An Energy Community Implementation: The Unical Energy Cloud
by
 , and
, and
Andrea Giordano
1, 
Carlo Mastroianni
1,
Daniele Menniti
2, 
Anna Pinnarelli
2 and
Nicola Sorrentino
2,* 1
ICAR-CNR, 87036 Rende, Italy
2
Energetic, Mechanical and Management Engineering Department, University of Calabria, 87036 Rende, Italy
*
Author to whom correspondence should be addressed.
Electronics 2019, 8(12), 1517; https://doi.org/10.3390/electronics8121517
Submission received: 16 October 2019
/
Revised: 6 December 2019
/
Accepted: 8 December 2019
/
Published: 11 December 2019
(This article belongs to the Special Issue Active Regional Energy Systems and Microgrids)
Abstract
:Reducing greenhouse gas emissions, limiting the effects of climate change and decreasing the environmental, social and economic costs of energy production are some of the main issues related to the sustainable development of modern society. Energy communities, envisioned to enable local energy exchange between consumers and producers of renewable energy, represent a possible scenario towards a cleaner and sustainable energy system. In this paper, an energy community management model called Power Cloud and presented in previous papers is proposed for a real-world practical application at the University of Calabria. In particular, the implementation of the information and communication technology (ICT) architecture and other enabling technologies, such as the nanogrid and the smart energy box, are discussed in detail. The experiment results show that by adopting the Power Cloud management model it is possible to obtain significant savings in terms of energy cost, which provide benefit for a community, such as a university campus.
Keywords:
energy community; smart grid; nanogrid; IoT; electricity market; aggregator; prosumer; storage system1. Introduction
Cities need energy to develop, grow and innovate. Reducing greenhouse gas emissions, limiting the effects of climate change and decreasing the environmental, social and economic costs of energy production are at the center of the development of future cities. The technological and infrastructural aspects are the starting points of this innovative process, but the final goal is to guarantee a sustainable and reliable energy supply and to improve the energy efficiency of cities, by implementing new political strategies on sustainability, economic development and social welfare.
The Energy Cloud, as defined in [1], includes all the technical, commercial, environmental and regulatory changes needed for the transition from a conventional model of energy supply to a clean energy distribution network and so to a sustainable system that is able to reduce pollution and dependence on petroleum products. A system that integrates the innovations of smart technologies is certainly more complex than a traditional one but it is much more efficient for the control of the energy that is supplied and consumed.
The Energy Cloud is an emerging platform that can offer a solution to facilitate the integration of distributed renewable energy systems with new environmental-friendly and smart technologies, such as micro and nanogrids, smart meters, IoT (Internet of Things) technologies and storage facilities. The Energy Cloud offers the technical and economic conditions for the support of distributed energy generation and for the activation of local demand-response programs.
In the future, different platforms will converge into an advanced Energy Cloud. Therefore, the Energy Cloud platforms will require the presence of “orchestrators” that are able to connect end customers to a wide range of products and services in the energy field. In [1], it is reported: “It is no longer a matter of understanding if the Energy Cloud market will mature, but when and, more importantly, how this will happen”.
The evolution towards the Energy Cloud is based on four main processes. Firstly, new stringent regulations on electricity generation are driving the shift towards the massive use of distributed energy resources (DER). Secondly, the cost of DER technologies like (photovoltaic) PV generators and energy storage is rapidly declining. Thirdly, thanks to the information and communication technologies (ICT), energy consumers are becoming more active and responsive to the electricity consumption problem. Finally, the development of smart grid infrastructures is now mature enough to support the digitalization of the electrical grid.
In the Energy Cloud framework, new business models, referred to as energy communities, arise. They can be classified into:
- -
- Community micro-grids [2]: they are groups of DERs that are managed as single consumers and producers from both electrical and market perspectives;
- -
- Virtual power plants (VPP) [3]: multiple producers can collectively ensure a flexible capacity equivalent to that of a power plant, hence creating a virtual power plant;
- -
- -
- Prosumer community groups (PCG) [6]: a PCG is defined as a network of prosumers that have interest in sharing energy among them, and are willing to pursue the shared goal of jointly competing in the energy market;
- -
- Community energy systems [7]: they allow the production of local electricity and/or heat on a limited local scale, so as to provide local people with either energy or economic benefits;
- -
- Integrated community energy systems (ICESs) [8]: they represent the most advanced solution, and are able to achieve and integrate all the potential benefits deriving from energy communities.
The emerging research area regarding the business models for renewable energies, outlined above, is discussed in [9,10]. In particular, the work presented in [9] aims at identifying new models and identifying the implementation barriers that need to be faced by renewable energy cooperatives. There are three main barriers: risk aversion, concerns about the environmental impacts, and the lack of competencies and time of the involved management. In [10], the emerging field of research on business models for renewable energies is systematically reviewed, differentiating between developing and industrialized countries. One of the main findings, which is essential for industrialized countries, is that cooperation is a key in future business models to handle increasing complexity.
The ICESs represent locally and collectively organized energy systems and combine the concepts of sustainable energy communities, community energy systems, micro-grid communities and peer-to-peer energy systems. ICESs are able to integrate energy systems effectively, through the local generation of heat and electricity, the exploitation of flexible demand, the development of demand side management and the integration of smart-grid technologies, which together ensure a significant increase in the reliability and efficiency of local energy systems. The implementation of all these aspects is not easy. On the one hand, a massive use of ICT is required in order to monitor the physical state of the entire electrical system, collect and exchange data among the various stakeholders, and check and manage any abnormal situation: the new term Internet of Energy (IoE) arises in this context. IoE allows energy production to be performed more efficiently and cleanly with the least amount of waste. This term is derived from the increasingly prominent market for Internet of Things technology, which has helped to develop the distributed energy systems that enable the IoE [11]. On the other hand, the energy system must be designed to enable the active participation of all the players who act into the energy sector, ranging from system operators, market operators, large and small producers to the consumers themselves. Though some experiences on the preliminary implementation of ICESs are appearing [12,13,14,15], a unique model does not exist. An overview of different types of energy communities in Europe, and an appropriate and detailed classification, are presented in [16]. In particular [16], presents clear and fact-based insights, using a systematic and analysis-driven approach, to deliver undisputed recommendations for the enabling framework of energy communities in Europe.
In this paper, a real-world practical application of an ICE based on the Power Cloud management model [17] and IoE technologies, namely the “Unical Energy Cloud”, developed at the University of Calabria Campus, is illustrated. The Power Cloud management model is designed and implemented with the goal of maximizing the self-consumption of energy and the profits/savings of Power Cloud members, thanks to the support of a specific hardware and software architecture. The Power Cloud includes several types of users: consumers, producers, prosumers (i.e., users that are both consumers and producers), and prosumages (prosumers with storage). An aggregator, i.e., a neutral no-profit entity, which in the following is referred to as the community energy provider (CEP), manages all these users. The CEP manages electricity exchanges within the Power Cloud and, when needed, with the Electricity Market. Therefore, it is the entity that interfaces the energy community with the electricity market and the electrical system operators and that guarantees the proper functionalities of the whole energy community.
The Unical Energy Cloud also enables the implementation of the so-called Internet of Microgrids (IoM) [2], as demonstrated in the pilot experiences. With respect to the IoM approach, the Unical Energy Cloud enables the use of different single microgrid control laws as in [18,19,20], empowering the performance of microgrids as a whole.
The main contribution of the paper is the development of the IoT platform and of the enabling technologies, such as nanogrids and smart energy boxes, to apply the Power Cloud model on a real-world practical application. In this way, it is possible to show that the Power Cloud model leads to real savings in terms of energy consumption and energy cost in a real case.
In this paper, firstly, the Power Cloud management model is illustrated, then, the ICT platform developed to realize the “Unical Energy Cloud” is depicted in detail. Finally, the real-world practical application at the University of Calabria Campus is described and some experimental results are reported. Appropriate conclusions finalize the paper.
2. The Power Cloud Model
The idea behind the Power Cloud model is the following: the inhabitants of a city area and its neighborhood can be rapidly involved in the city development and can be appropriately encouraged to produce energy through local renewable energy sources (RES). A basic requirement to enable this process is a strong interaction between the urban area and its neighborhood: indeed, the users who live in the city rarely have the chance of installing a small-size generation plant, for instance a PV plant on a rooftop, because they live in multi-floor buildings. Conversely, the users who live in the city neighborhood often live in houses with large surfaces and enough space to install a PV plant. The latter users can be both consumers and producers of energy and, therefore, they can actively take part in the electricity market, for example by selling their energy surplus to the users who live in the city. In this fashion, the electricity market becomes accessible to all the users, which can become electricity market operators in an aggregate form, with the role of both producers and consumers. Such a transition can provide an immediate economic gain, based on the difference that exists between sale and retail prices on the liberalized electricity market.
2.1. The Power Cloud Configuration as Energy Community
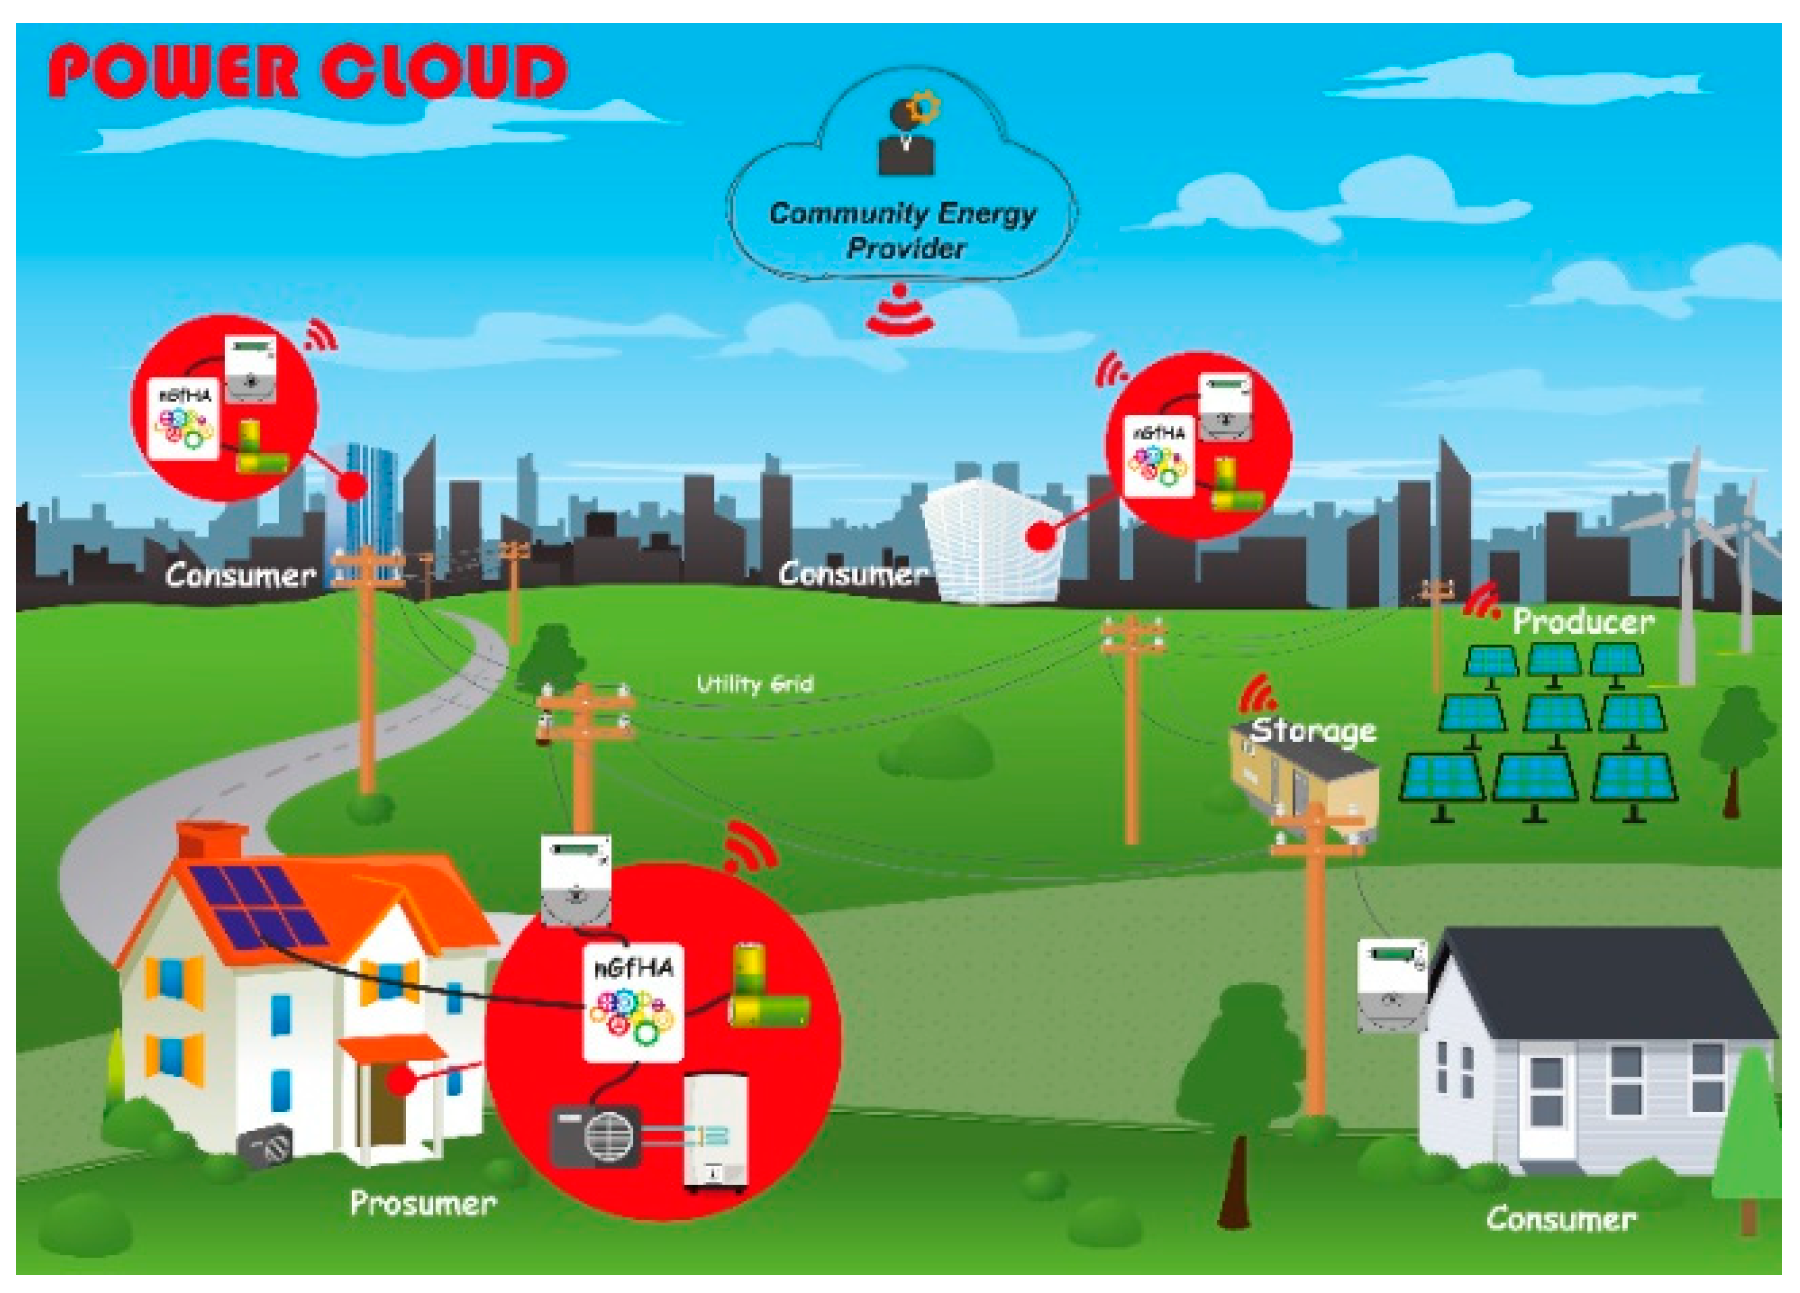
A Power Cloud is an aggregation of consumers, prosumers, i.e., users that are consumers and producers at the same time, prosumages, i.e., prosumers having an energy storage system (ESS), and simple producers, as illustrated in Figure 1. The aim is to incentivize the increase of renewable energy sources and of enabling technologies, in order to achieve a better power management of energy resources.
Power Cloud users are interconnected through the public distribution grid and they coordinate with each other in order to exchange electricity. The electricity coordination is ensured by an aggregator, i.e., the CEP, a neutral non-profit entity that manages electricity exchanges inside the Power Cloud and, in accordance with community needs, with the electricity market. Specifically, the CEP manages the consumption and the generation of energy by organizing sessions of local market and applying the Power Cloud management model. The amount of energy that is required by the users but that is not produced inside the Power Cloud, or, vice versa, the amount of energy that is produced in excess and is not consumed by the users, is managed by the CEP that is authorized to buy/sell energy to/from the national market operators.
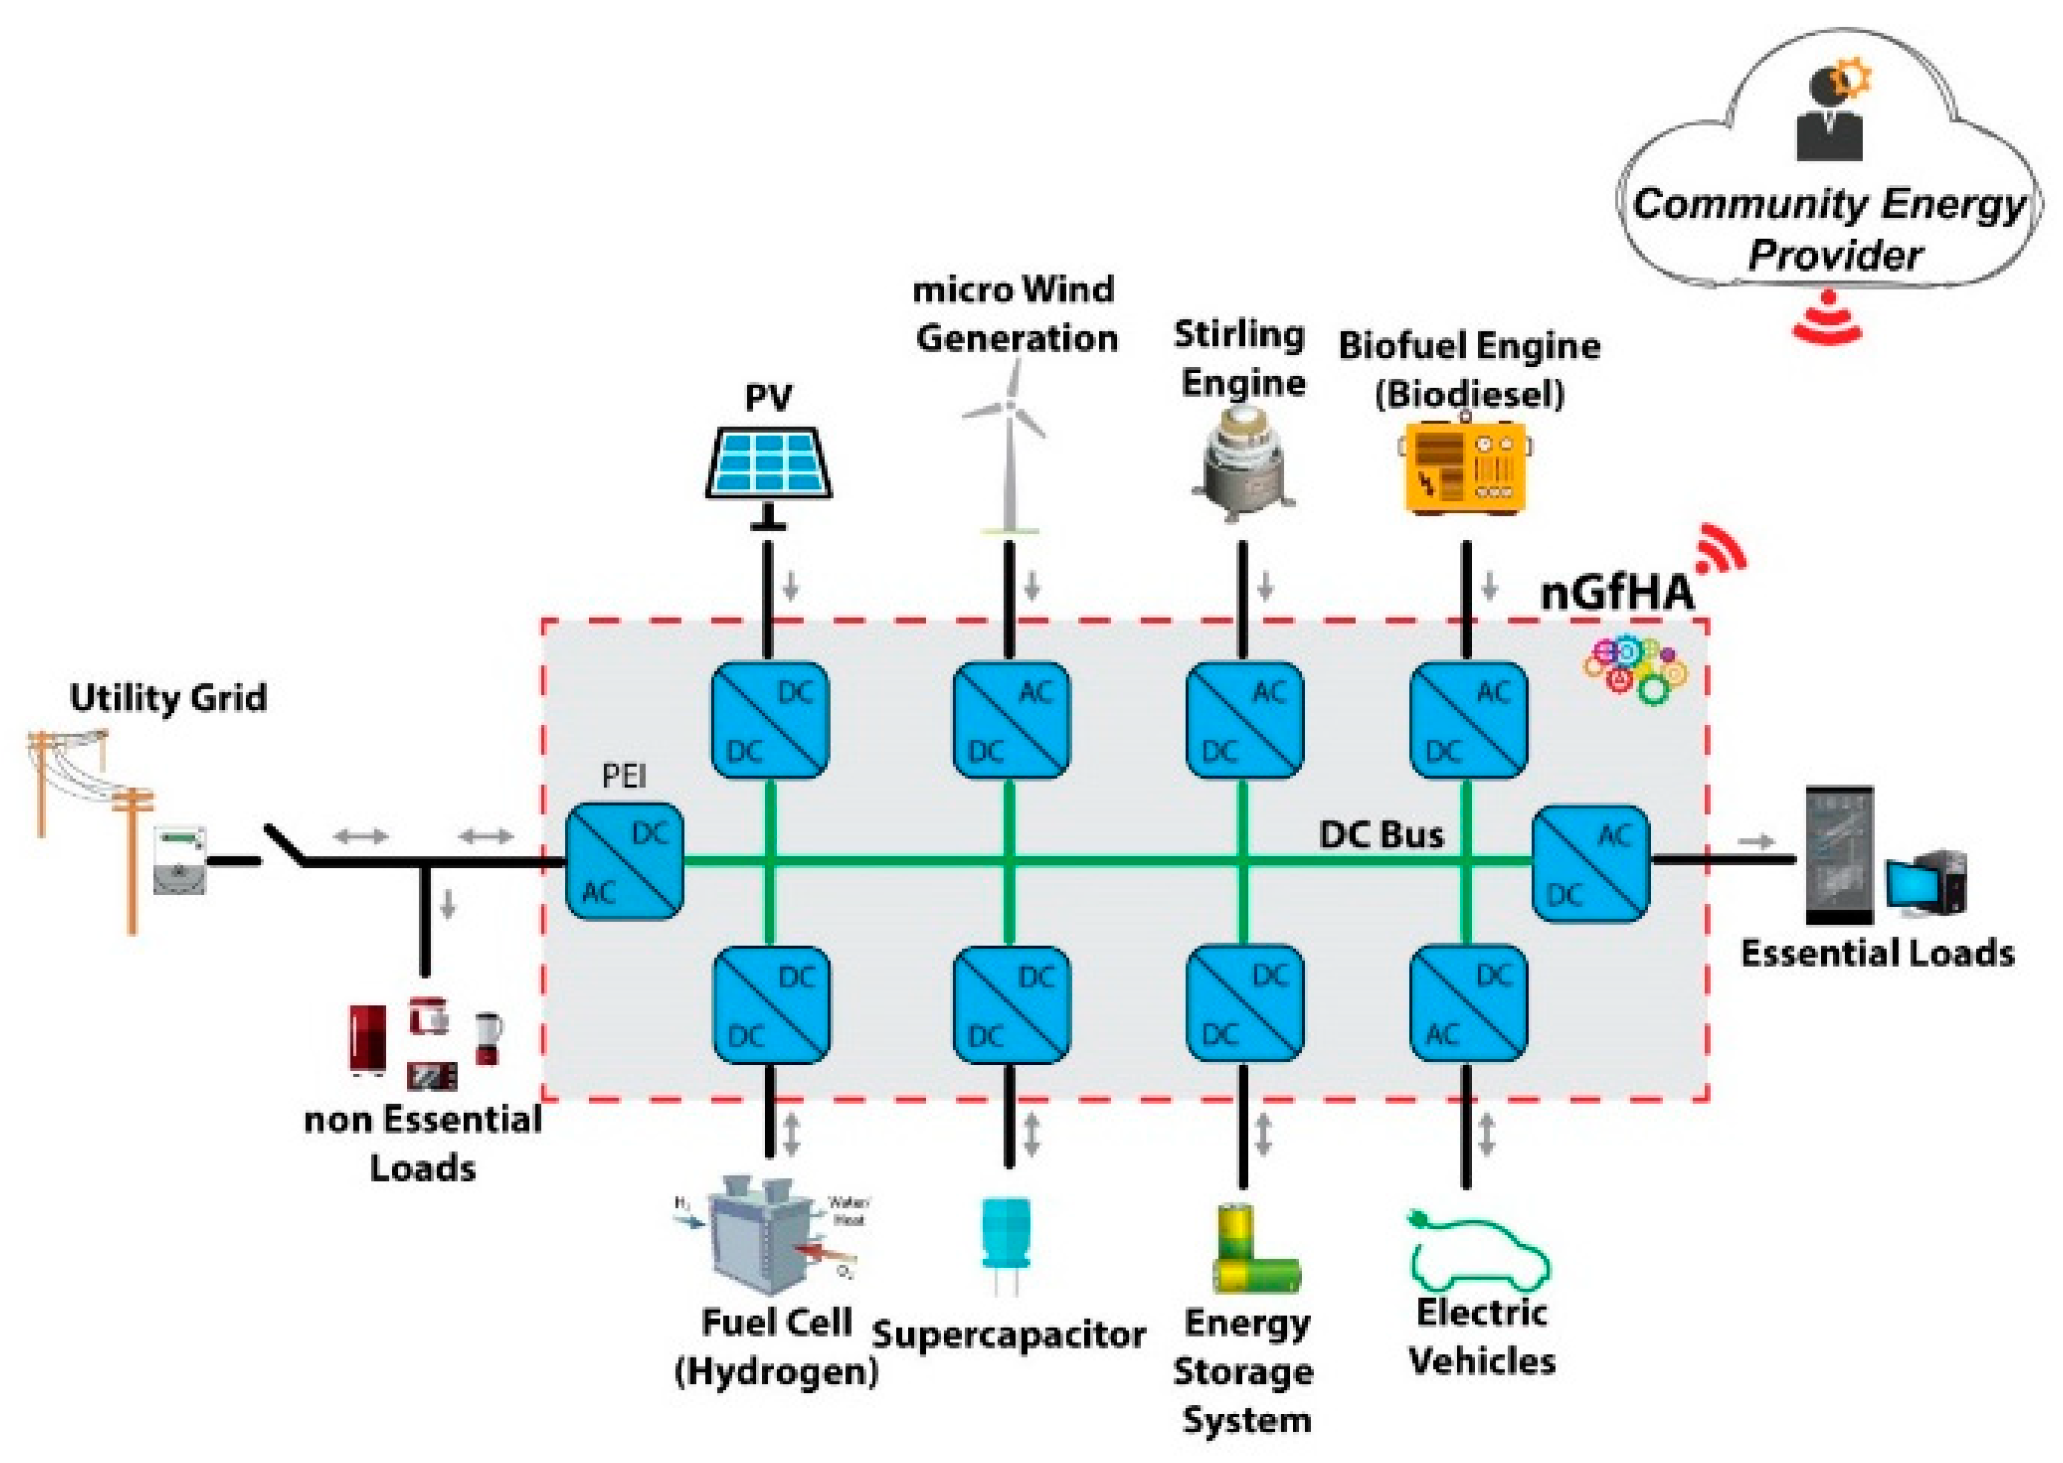
In order to implement the Power Cloud management model, it is essential to design and develop innovative physical systems, based on power electronics, IoT and ICT in general, for the generation, distribution and use of energy [21,22]. An example of enabling technology is the nanoGrid for Home Application (nGfHA), which allows the final user to take an active role. The nGfHA is a direct current (DC) nano-grid (generally not over 5 kW), which links generation plants—PV systems, micro-CHP (combined heat and power) with Stirling engine or natural gas micro-turbines, fuel cells, etc.—ESSs and loads (see Figure 2). The city users, who often live in residential multi-floor buildings, are generally consumers. These users can, with a small effort, host an ESS in the building and/or install a building automation system, but they cannot install a PV system on the building rooftop. A prosumer is a user equipped with an nGfHA, who can integrate an ESS (in this case becoming a prosumage) and one or more generation plants such as PV systems, micro-wind, micro-CHP, etc., which are able to produce surplus energy that can be offered to the consumers that participate in the same Power Cloud. The users who live in a rural area and own generation plants are examples of prosumers.
At each prosumer/prosumage/producer/consumer the following equipment is installed:
- -
- an nGfHA that is able, through its interface, to interact with the utility grid and so to absorb power and store/supply energy from its ESS to the utility grid, for example to provide ancillary services such as frequency regulation;
- -
- a home automation system able to control electrical and thermal loads; this technology is not installed in the case of a simple producer;
- -
- a smart energy box (SEB) that interfaces each user with the CEP and implements all the local services required to optimize the energy performance of the user or simply to monitor the production in the case of a simple producer [23].
2.2. Power Cloud Management Model
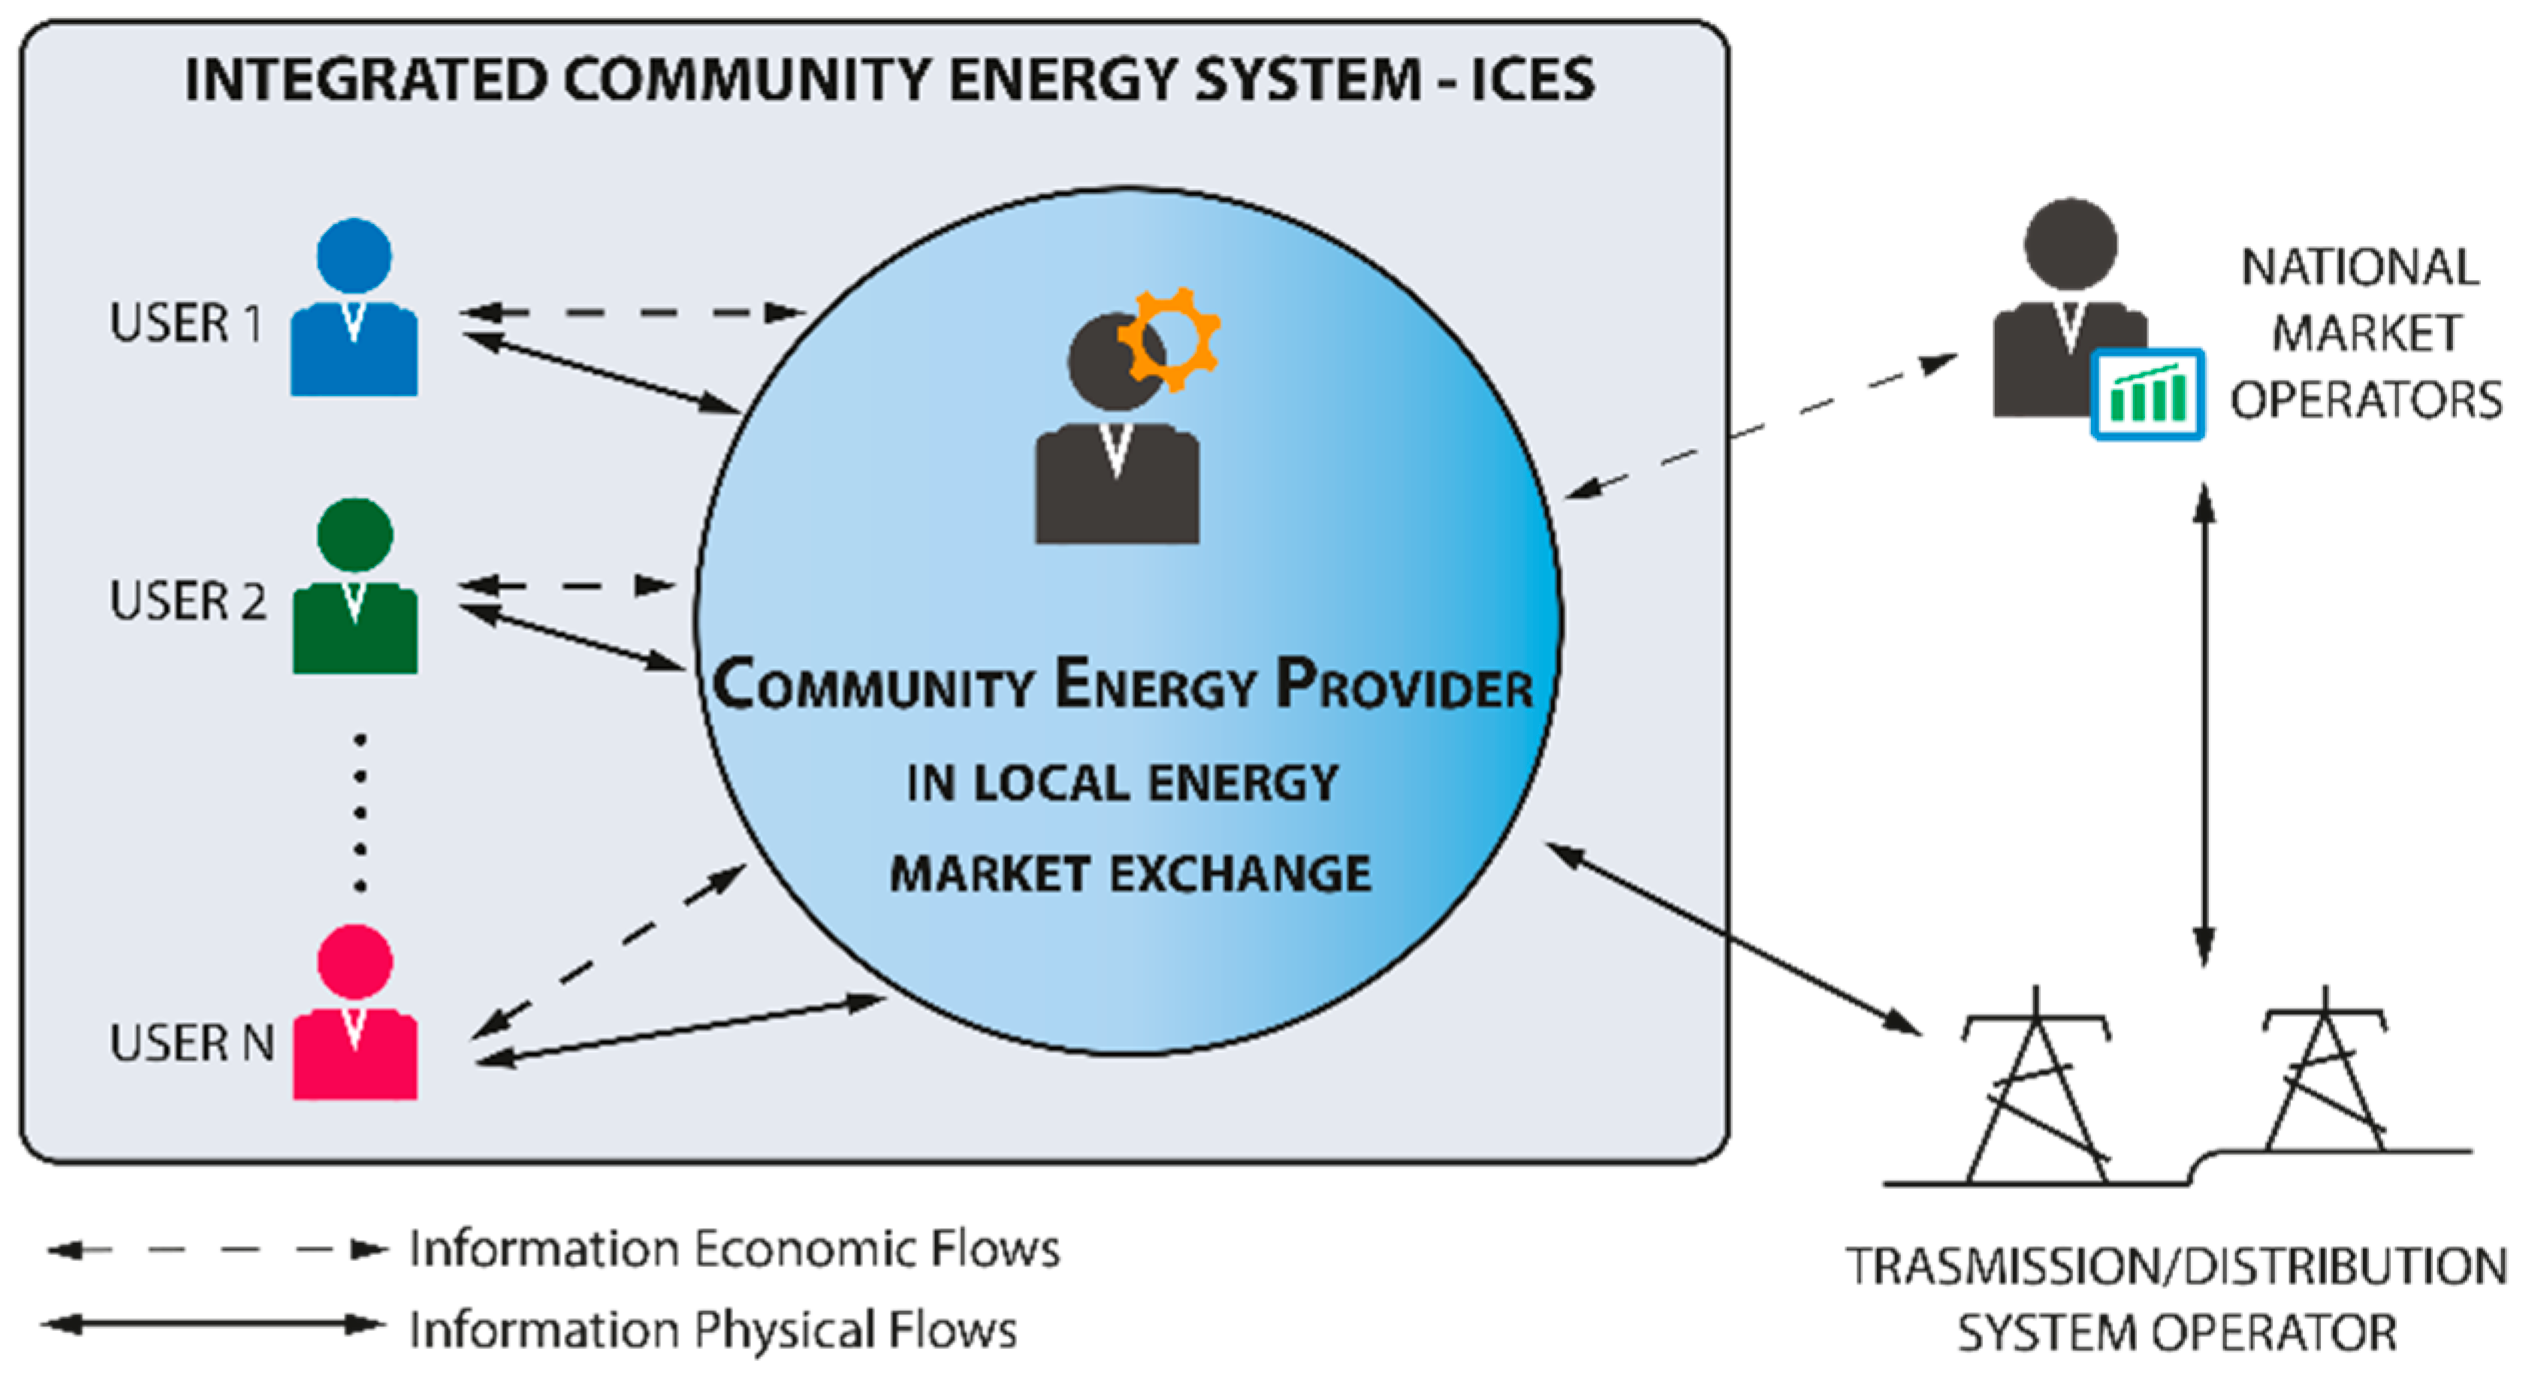
As mentioned before, all types of users (consumers, producers, prosumers, prosumages) are aggregated and managed by the CEP (see Figure 3).
The CEP communicates the withdrawal and the injection profiles to the TSO (transmission system operator), and the energy tariffs to the Power Cloud users. In addition, the CEP provides several services such as the generation forecast for producers and prosumers, and the load forecast for prosumers and consumers. A competitive approach is adopted to achieve the optimal management of the Power Cloud in terms of balance between generation and consumption. To this aim, the CEP is required to:
- -
- solve an optimal portfolio problem, that is, determine how much energy needs to be purchased by long-time contracts and how much energy should be reserved for the day ahead market;
- -
- evaluate the tariffs of sale and purchase for the Power Cloud users in order to maximize their profits/savings.
In this paper, we focus on what happens starting from the monthly management. To this purpose, in the following, we illustrate the Power Cloud management model by describing the single phases that need to be implemented to reach the overall goal of the Power Cloud, that is, reduce the withdrawal of energy from the electricity market and maximize the profits/savings of Power Cloud users. This process is composed of two phases, described in the following paragraphs.
- -
- First phase: definition of tariffs
The first phase, called Month’s Operational Planning, is performed monthly and marks the beginning of energy supply. The activity concerns the signing of supply contracts and, in particular, the definition of tariffs for the energy retail in the Power Cloud. At this stage, the CEP acts as an energy provider: it estimates the Power Cloud energy demand and the energy produced by RESs to calculate the energy that needs to be retailed or sold outside the Power Cloud. A time-of-use (TOU) tariff is determined in order to ensure a profit for producers and a saving for consumers in comparison with the cost/price of retailed/sold energy outside the Power Cloud [24].
- -
- Second phase: Demand Response
In this phase, a Demand Response program (DRp) takes place. In a DRp, the CEP plays the role of Power Exchange with a “pay as bid” rule [25]: it collects the retailing offers and selects the most convenient ones in accordance with a merit order list. The consumers offering higher prices will be selected and their offers accepted. Since there might be several consumers concerned, this converges to a market auction.
In [26], the authors proposed a two-stage DRp. The two-stage approach, differently from the typical single-stage adopted in the literature, allows us to improve the distribution of energy among the prosumers of the Power Cloud and to better exploit the local availability of renewable energy. Firstly, the wholesale prices at which the Power Cloud can buy/sell energy from/to the grid are determined. Then, the CEP determines the local tariffs, i.e., the prices that are reserved for Power Cloud prosumers for buying and selling energy within the Power Cloud. During the first stage, based on these prices, the prosumers schedule their load/production/storage profiles for the forthcoming day, independent of each other. The objective of the second stage is to refine the solution by managing the frequent scenarios in which, at some specific hours, the quantity of the energy produced inside the Power Cloud is greater than the consumers’ energy demand. Without the introduction of the second stage, the energy surplus would be sold to the grid at the wholesale selling price. The goal of the second stage is to perform this redistribution by taking into account the availability of prosumers to buy the energy surplus at a price that is lower than at the first stage. The addition of the second stage allows both the prosumers and the Power Cloud as a whole to reduce the energy costs.
The DRp is based on the solution of a prosumer problem [27], i.e., an energy cost-minimization problem, which determines the appliance scheduling and the use of ESSs in order to support the energy balance in the power system network and reduce the consumer energy cost. The motivation for consumers to participate in a DRp is to minimize the energy cost because the DRp allows energy users of all kinds to act as a VPP and lower their demand for electricity, which also contributes to increase the stability of the grid. The Prosumer Problem is formulated and solved by using a mixed-integer nonlinear programming mathematical model that includes constraints for the scheduling of the appliances and of the ESS.
3. The Unical Energy Cloud Information and Communication Technology (ICT) Architecture
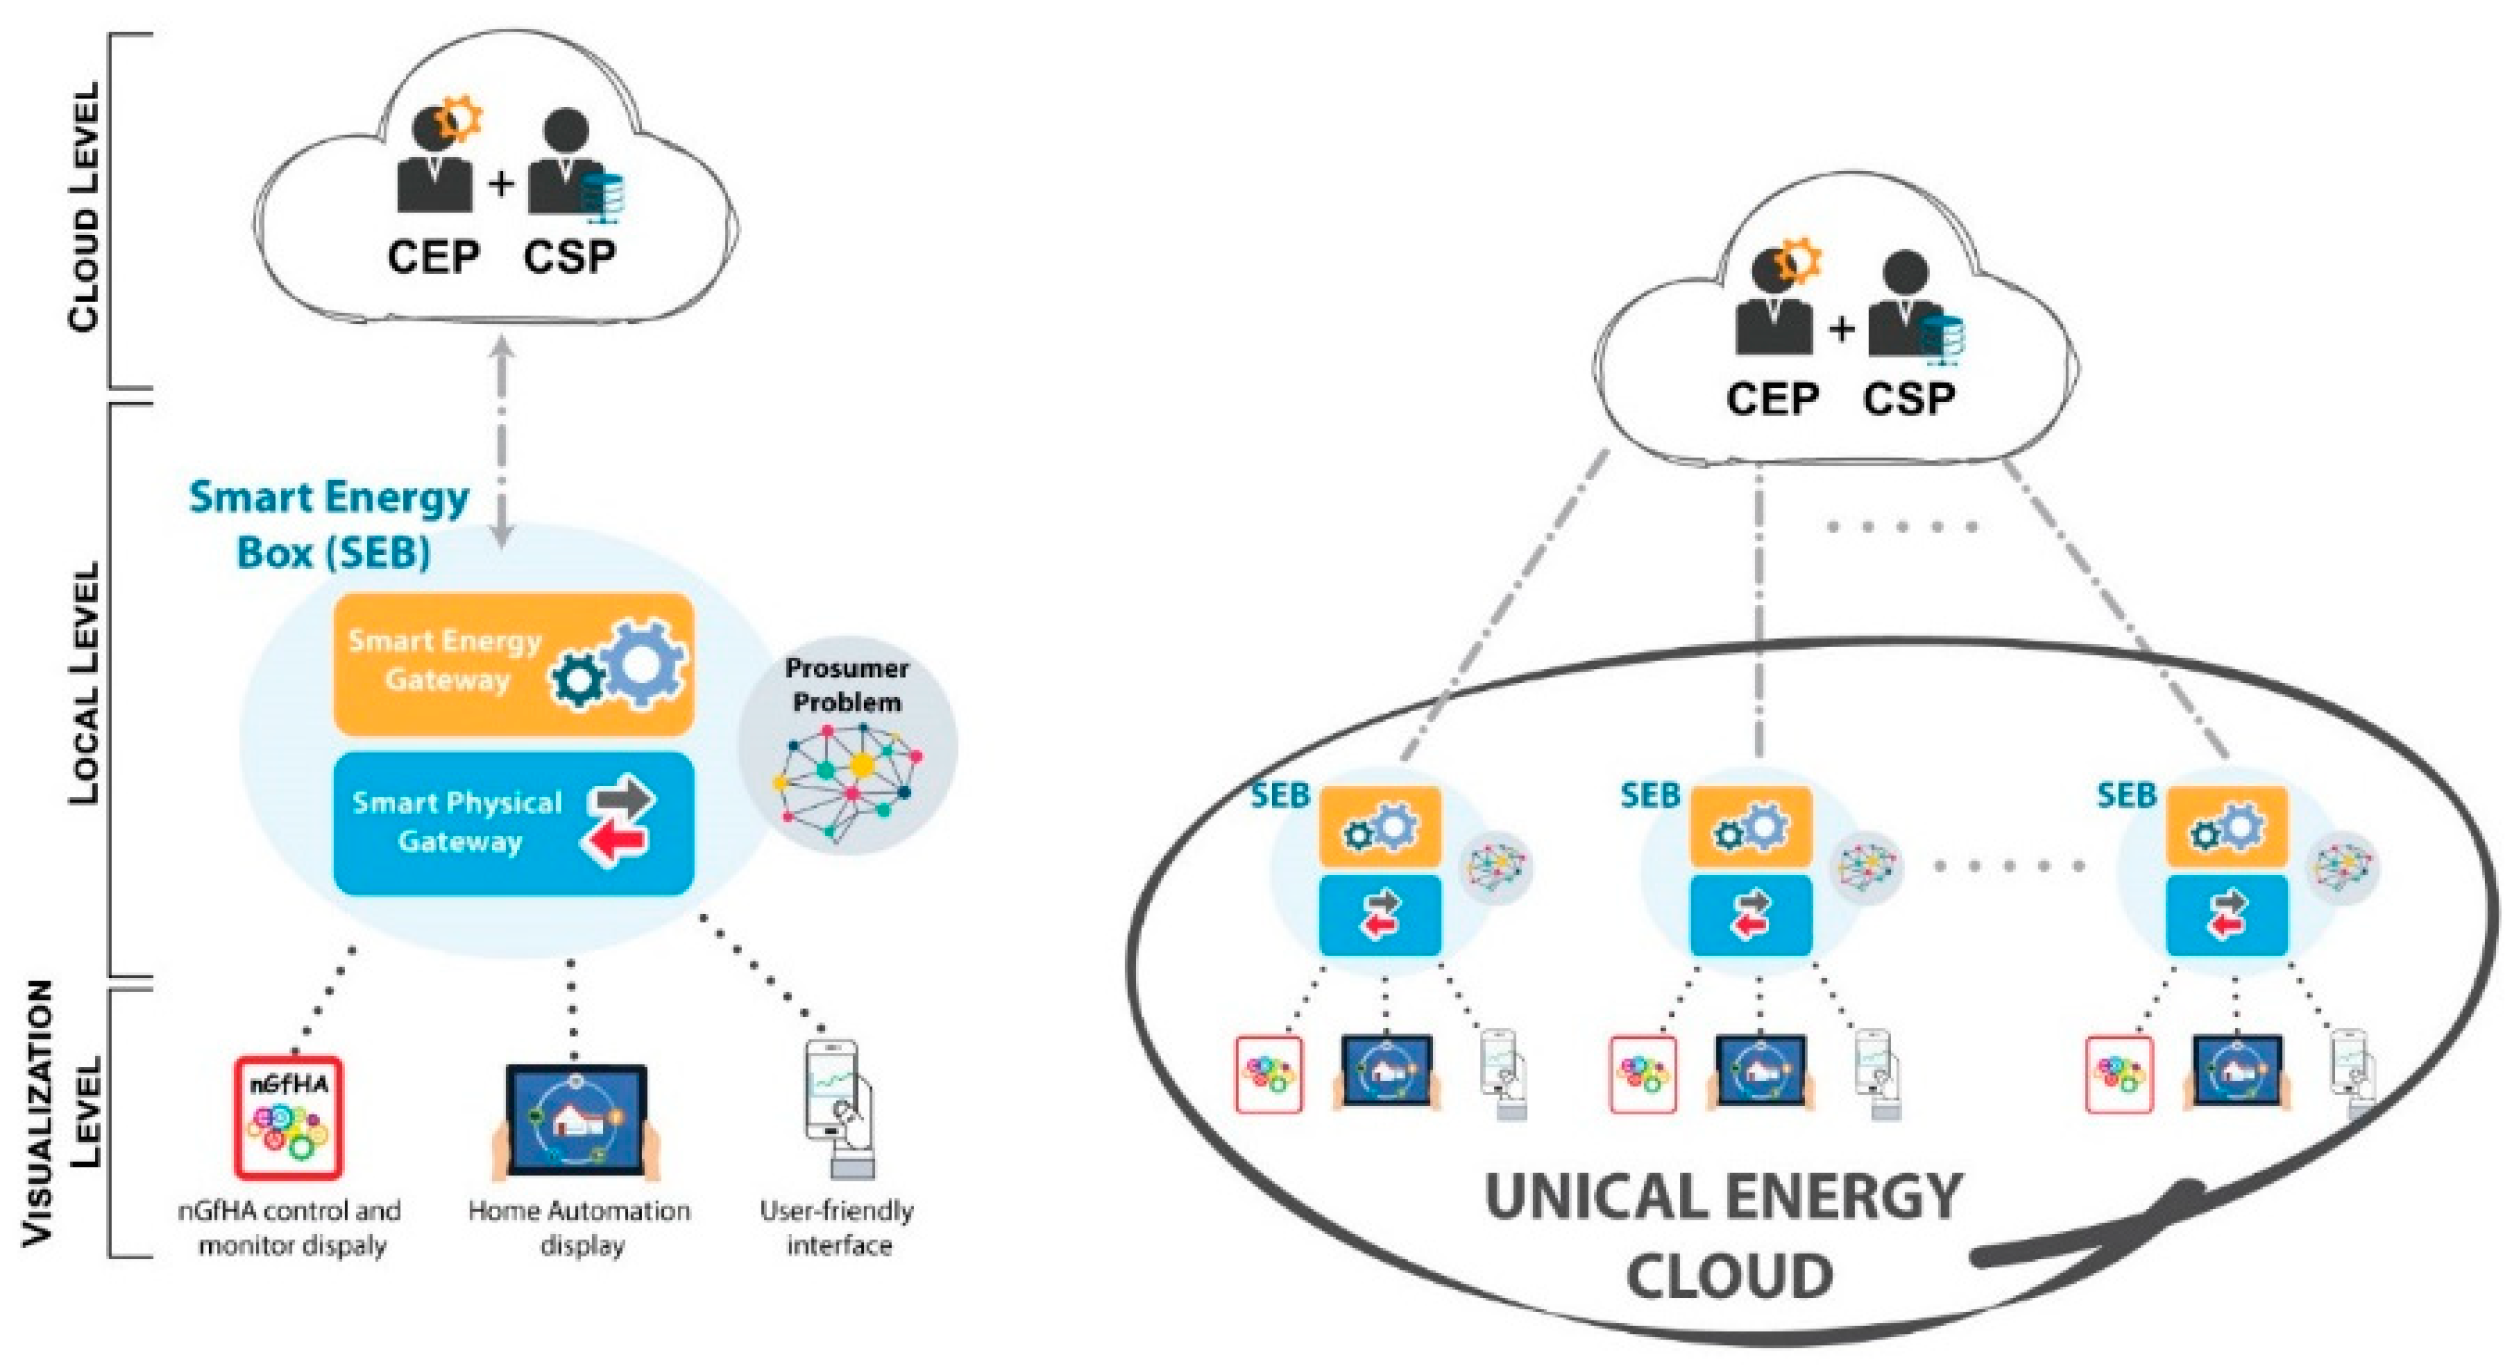
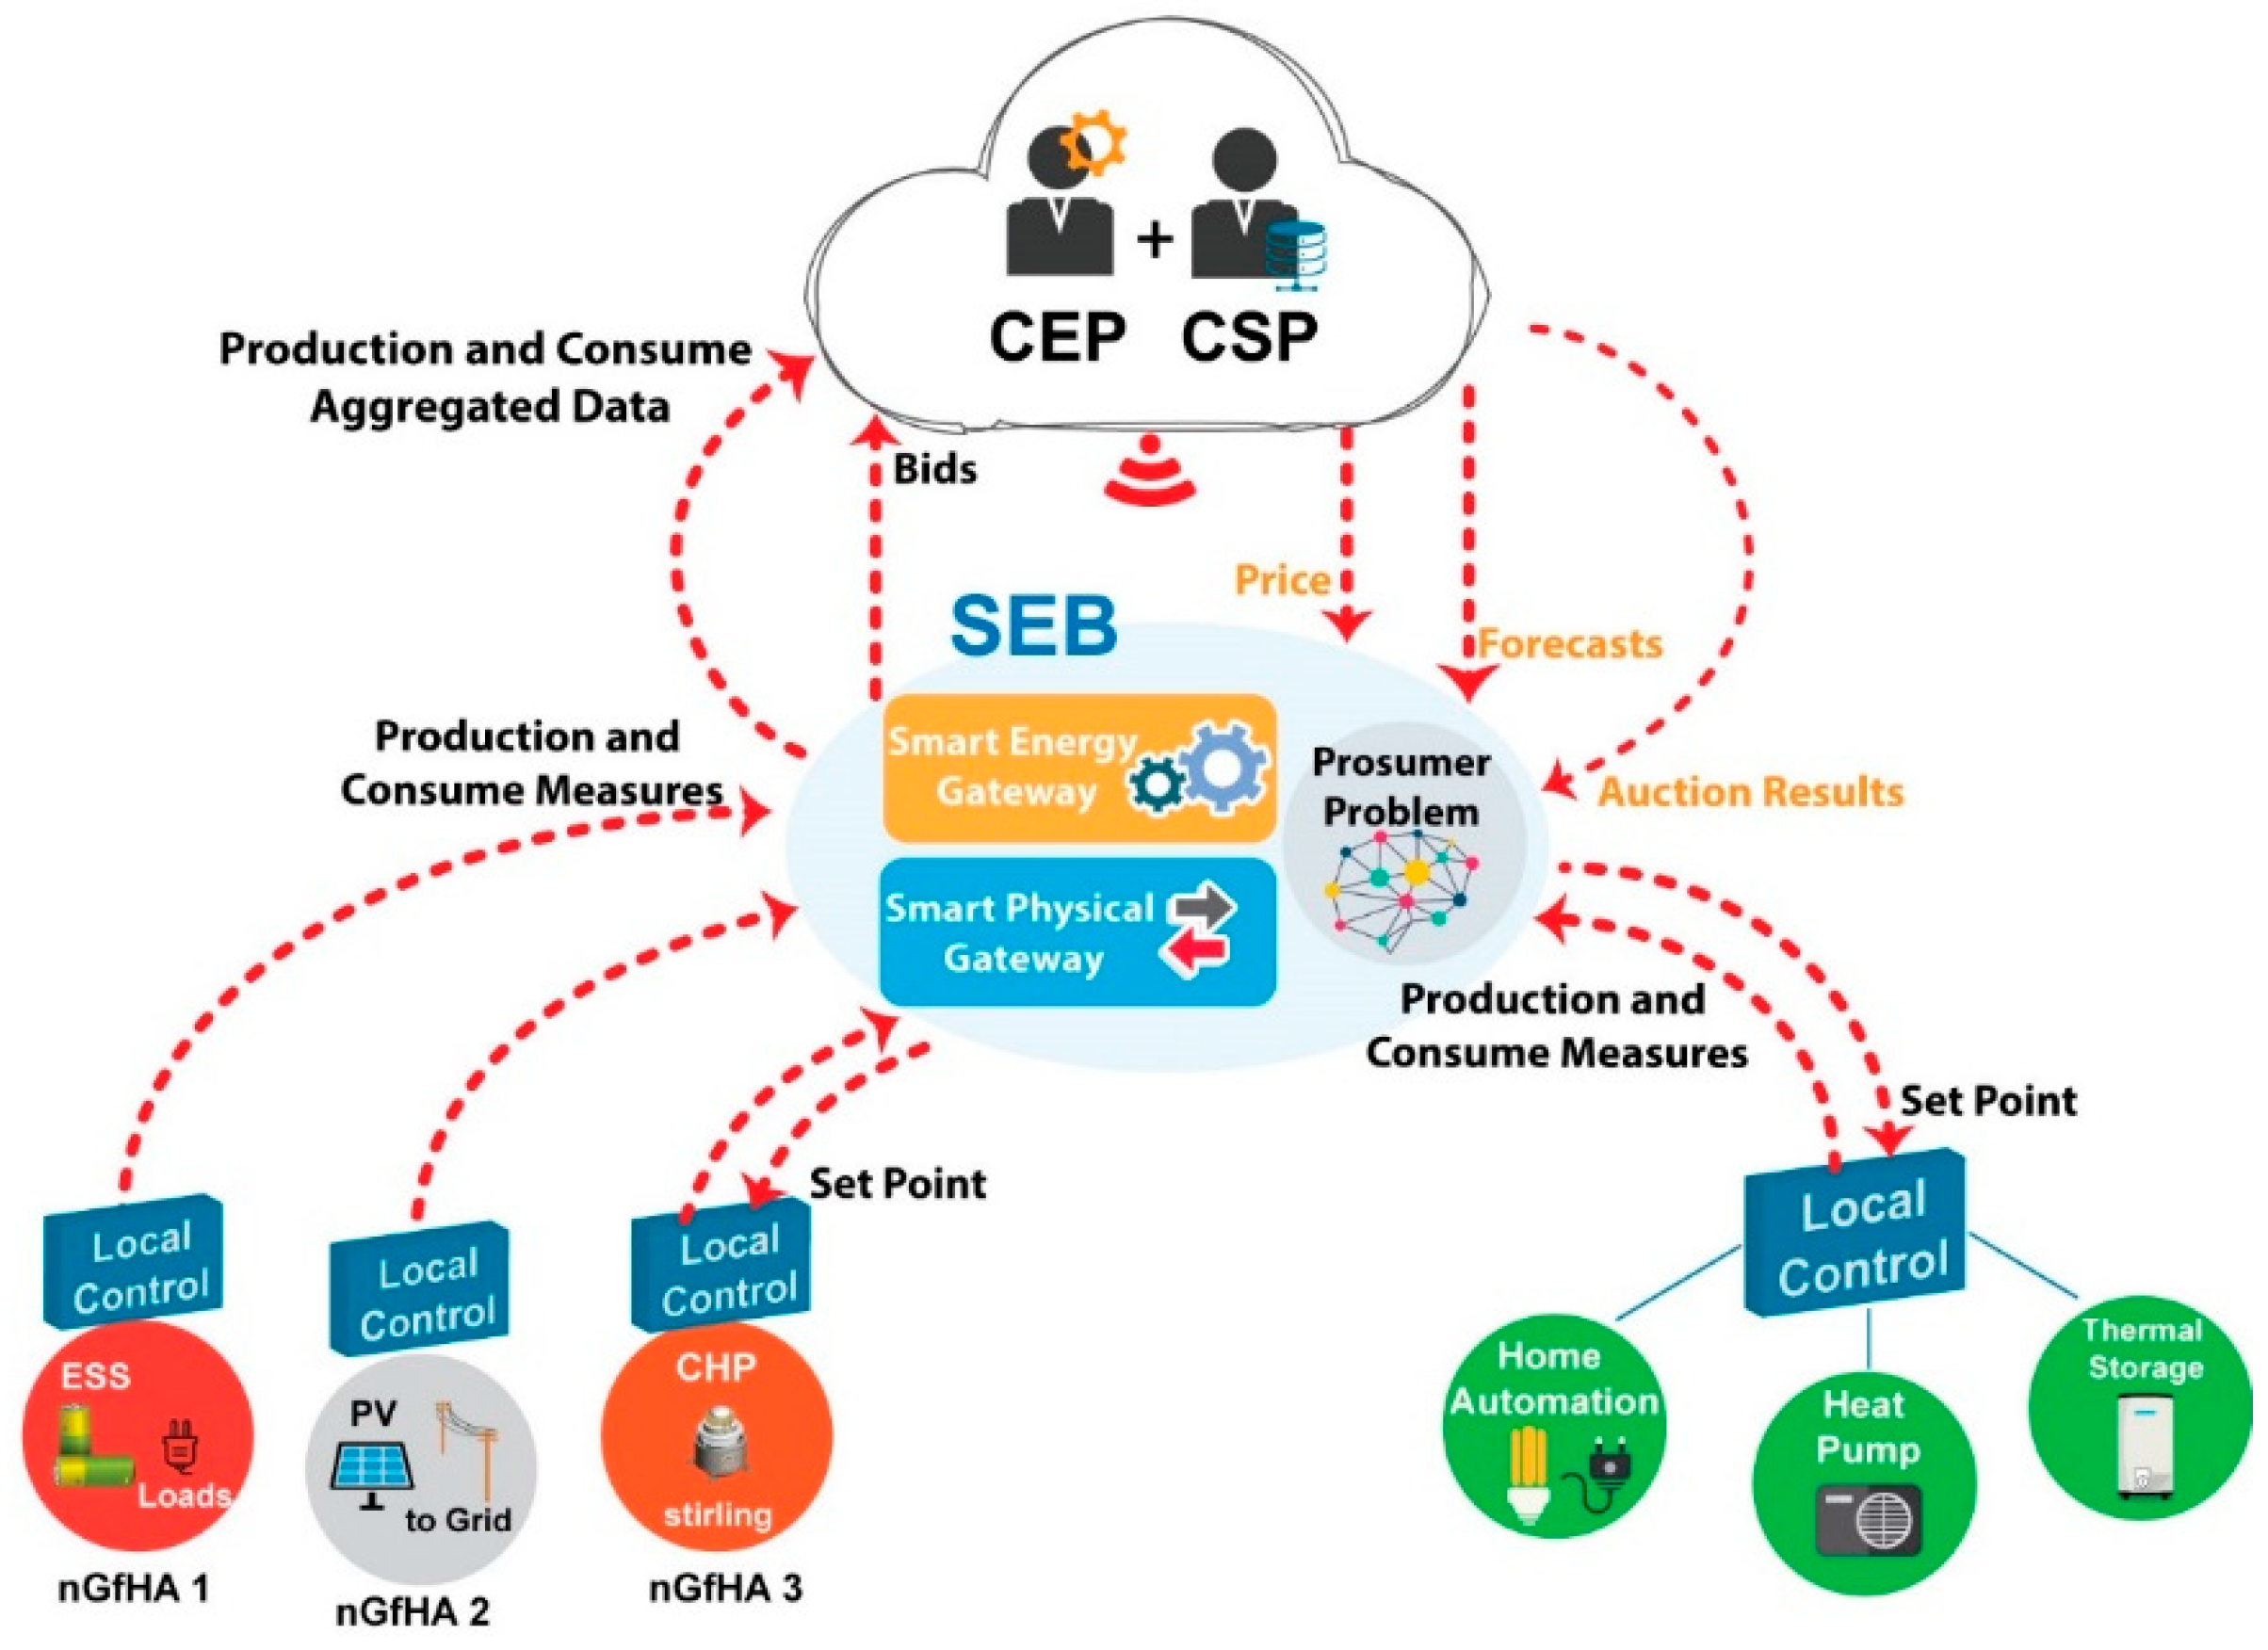
To implement the Power Cloud management model, an opportune hardware/software platform needs to be developed. The chosen ICT architecture is IoT-based, as reported in Figure 4. It is designed on three levels: the cloud level, the local level and the visualization level. At the cloud level, two entities exist: (i) the CEP and (ii) the Cloud Service Provider (CSP). The former is responsible for managing the energy exchanges among the Power Cloud users and within the electricity market; the latter, which can be managed by a single data center or, in the case of a very large Power Cloud, by a set of interconnected data centers, provides the forecast service and the service for the definition of tariffs.
At the local level, each Power Cloud user is equipped with a SEB, which enables the interaction with the cloud level. The SEB implements the prosumer problem, as presented in [26], and provides the control commands to the nGfHA and to the home automation system, when it exists.
Each SEB is equipped with a user-friendly interface to display the data and the output results in terms of user power profiles. Each user, using a web dashboard, enters his/her own preferences in terms of room temperature, starting time of the washing-machine, and so on.
The Prosumer Problem output is the optimal scheduling of controllable loads, programmable power plants and ESSs. It determines:
- -
- the on/off time of the controllable loads such as the thermal loads;
- -
- the charge/discharge time of the ESS;
- -
- the power flows exchanged with the grid;
- -
- the on/off times and the set points of the programmable power plants such as a micro-CHP.
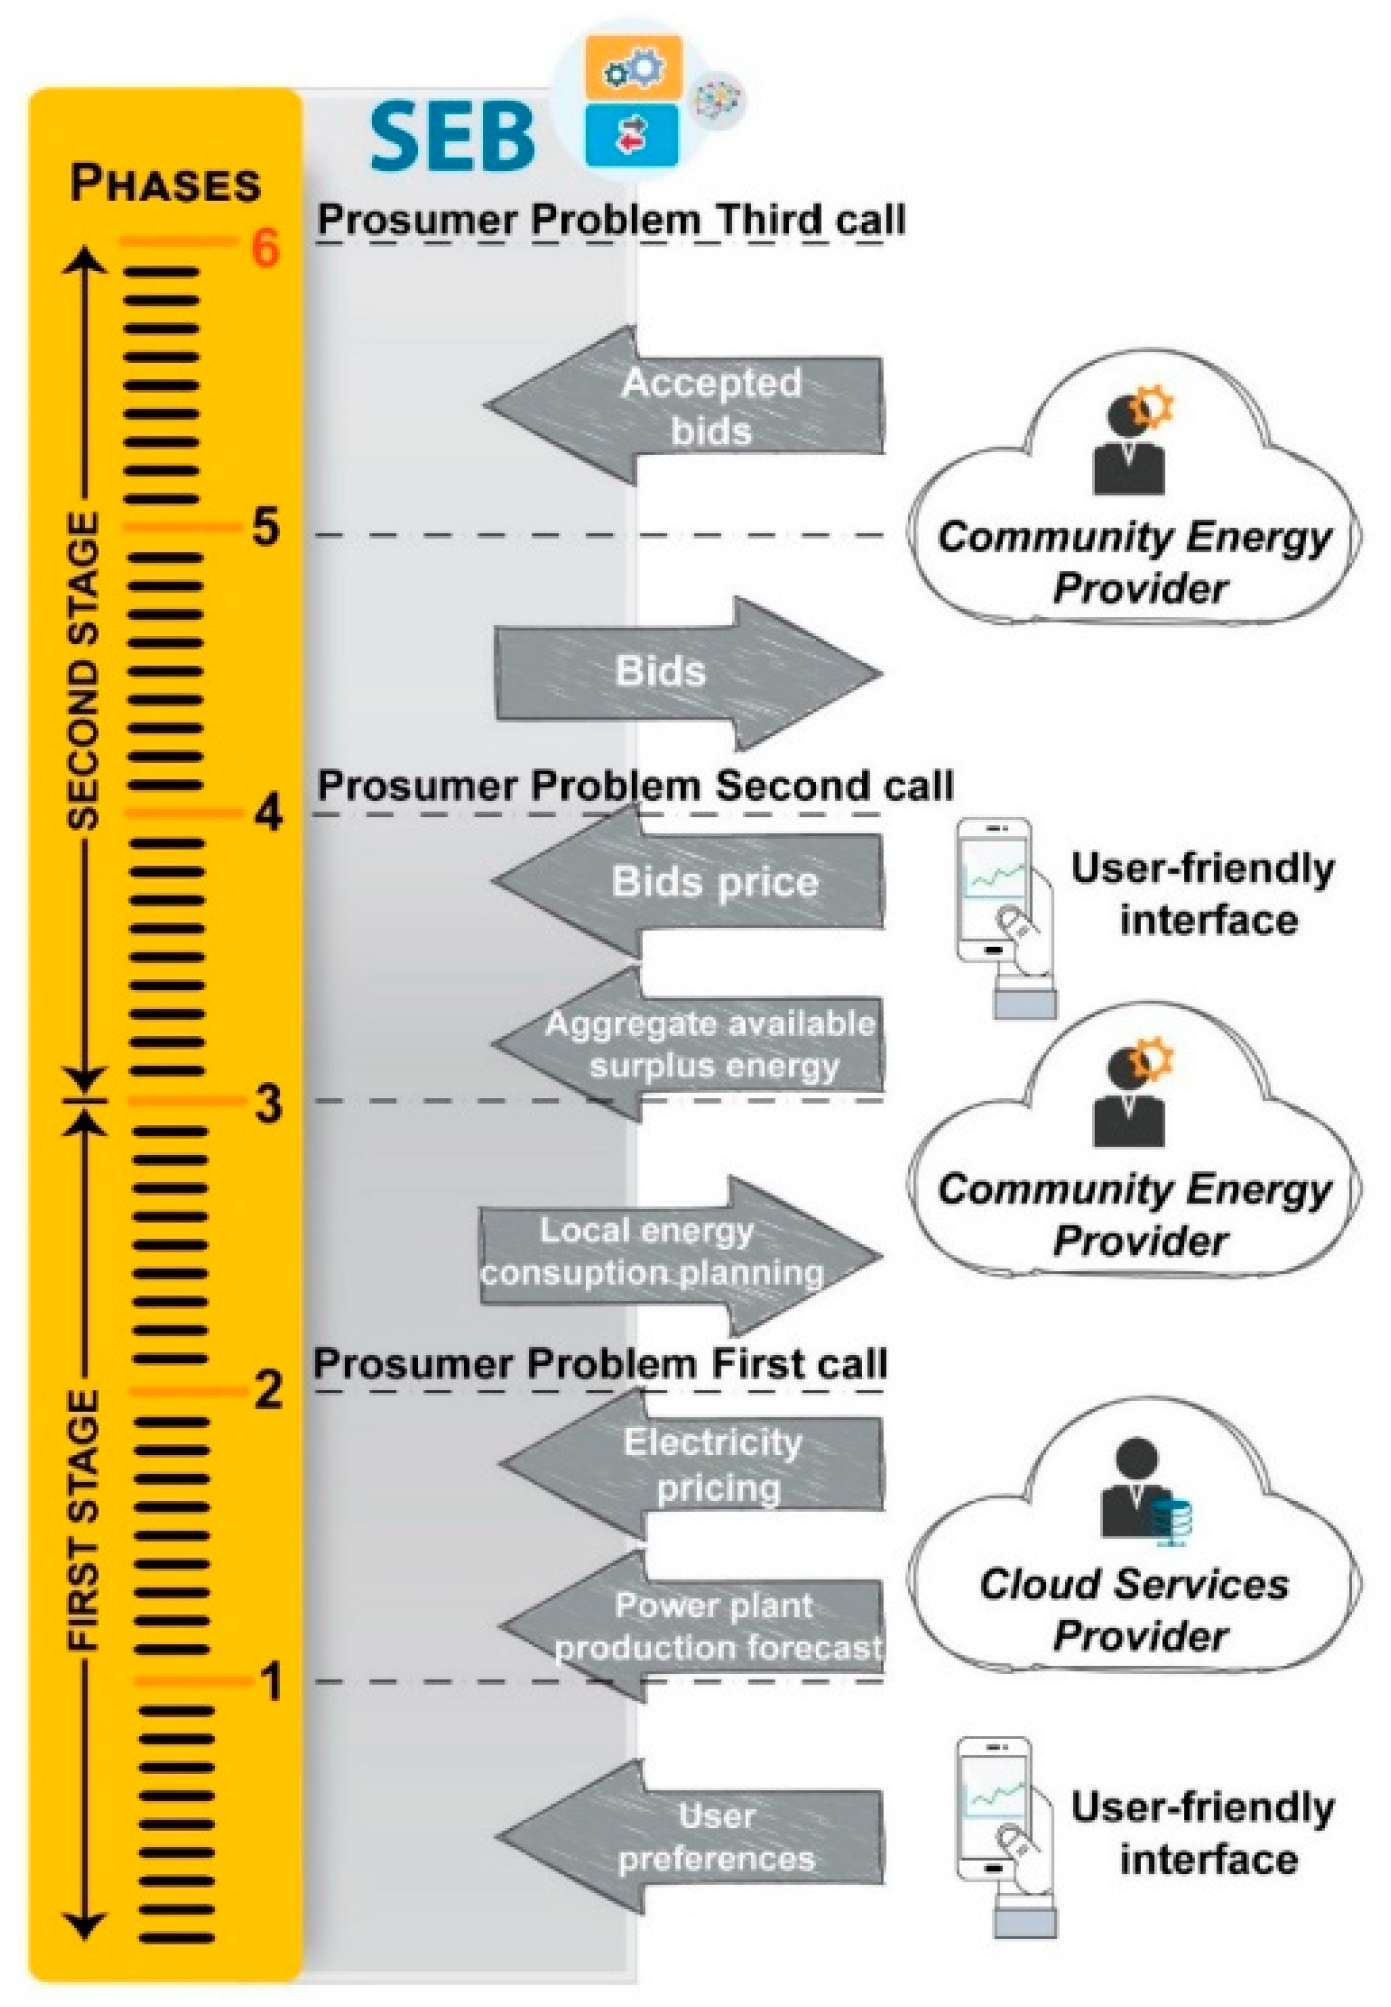
The CSP executes an appropriate set of algorithms, and delivers data (e.g., the energy production forecasts and the TOU tariff) to the SEB, which then solves the prosumer problem for the first stage. The daily workflow of the SEB, implementing the energy market, that is, the LEM (local electricity market) day ahead auction, is outlined in Figure 5 [28].
The CSP communicates to the SEBs the production forecast and the electricity price, so that the SEBs can solve the prosumer problem (prosumer problem—first call) to evaluate the load demand profiles that the SEBs communicate to the CEP. The CEP computes the aggregated generation and load demand profiles in order to evaluate whether an energy surplus exists. At this point, the second stage starts. The CEPs communicate the bid price to the SEBs and, based on this information, the SEBs solve the prosumer problem again (prosumer problem—second call). The results in terms of bids are communicated from each SEB to the CEP. The latter decides which bids should be accepted or declined, based on the availability of the surplus energy and of the received bids. Then, each SEB receives information from the CEP about the amounts of energy surplus granted to it. A third solution of the prosumer problem (prosumer problem—third call) is then computed taking into account the hours at which the bids have been accepted and the corresponding amounts of granted energy.
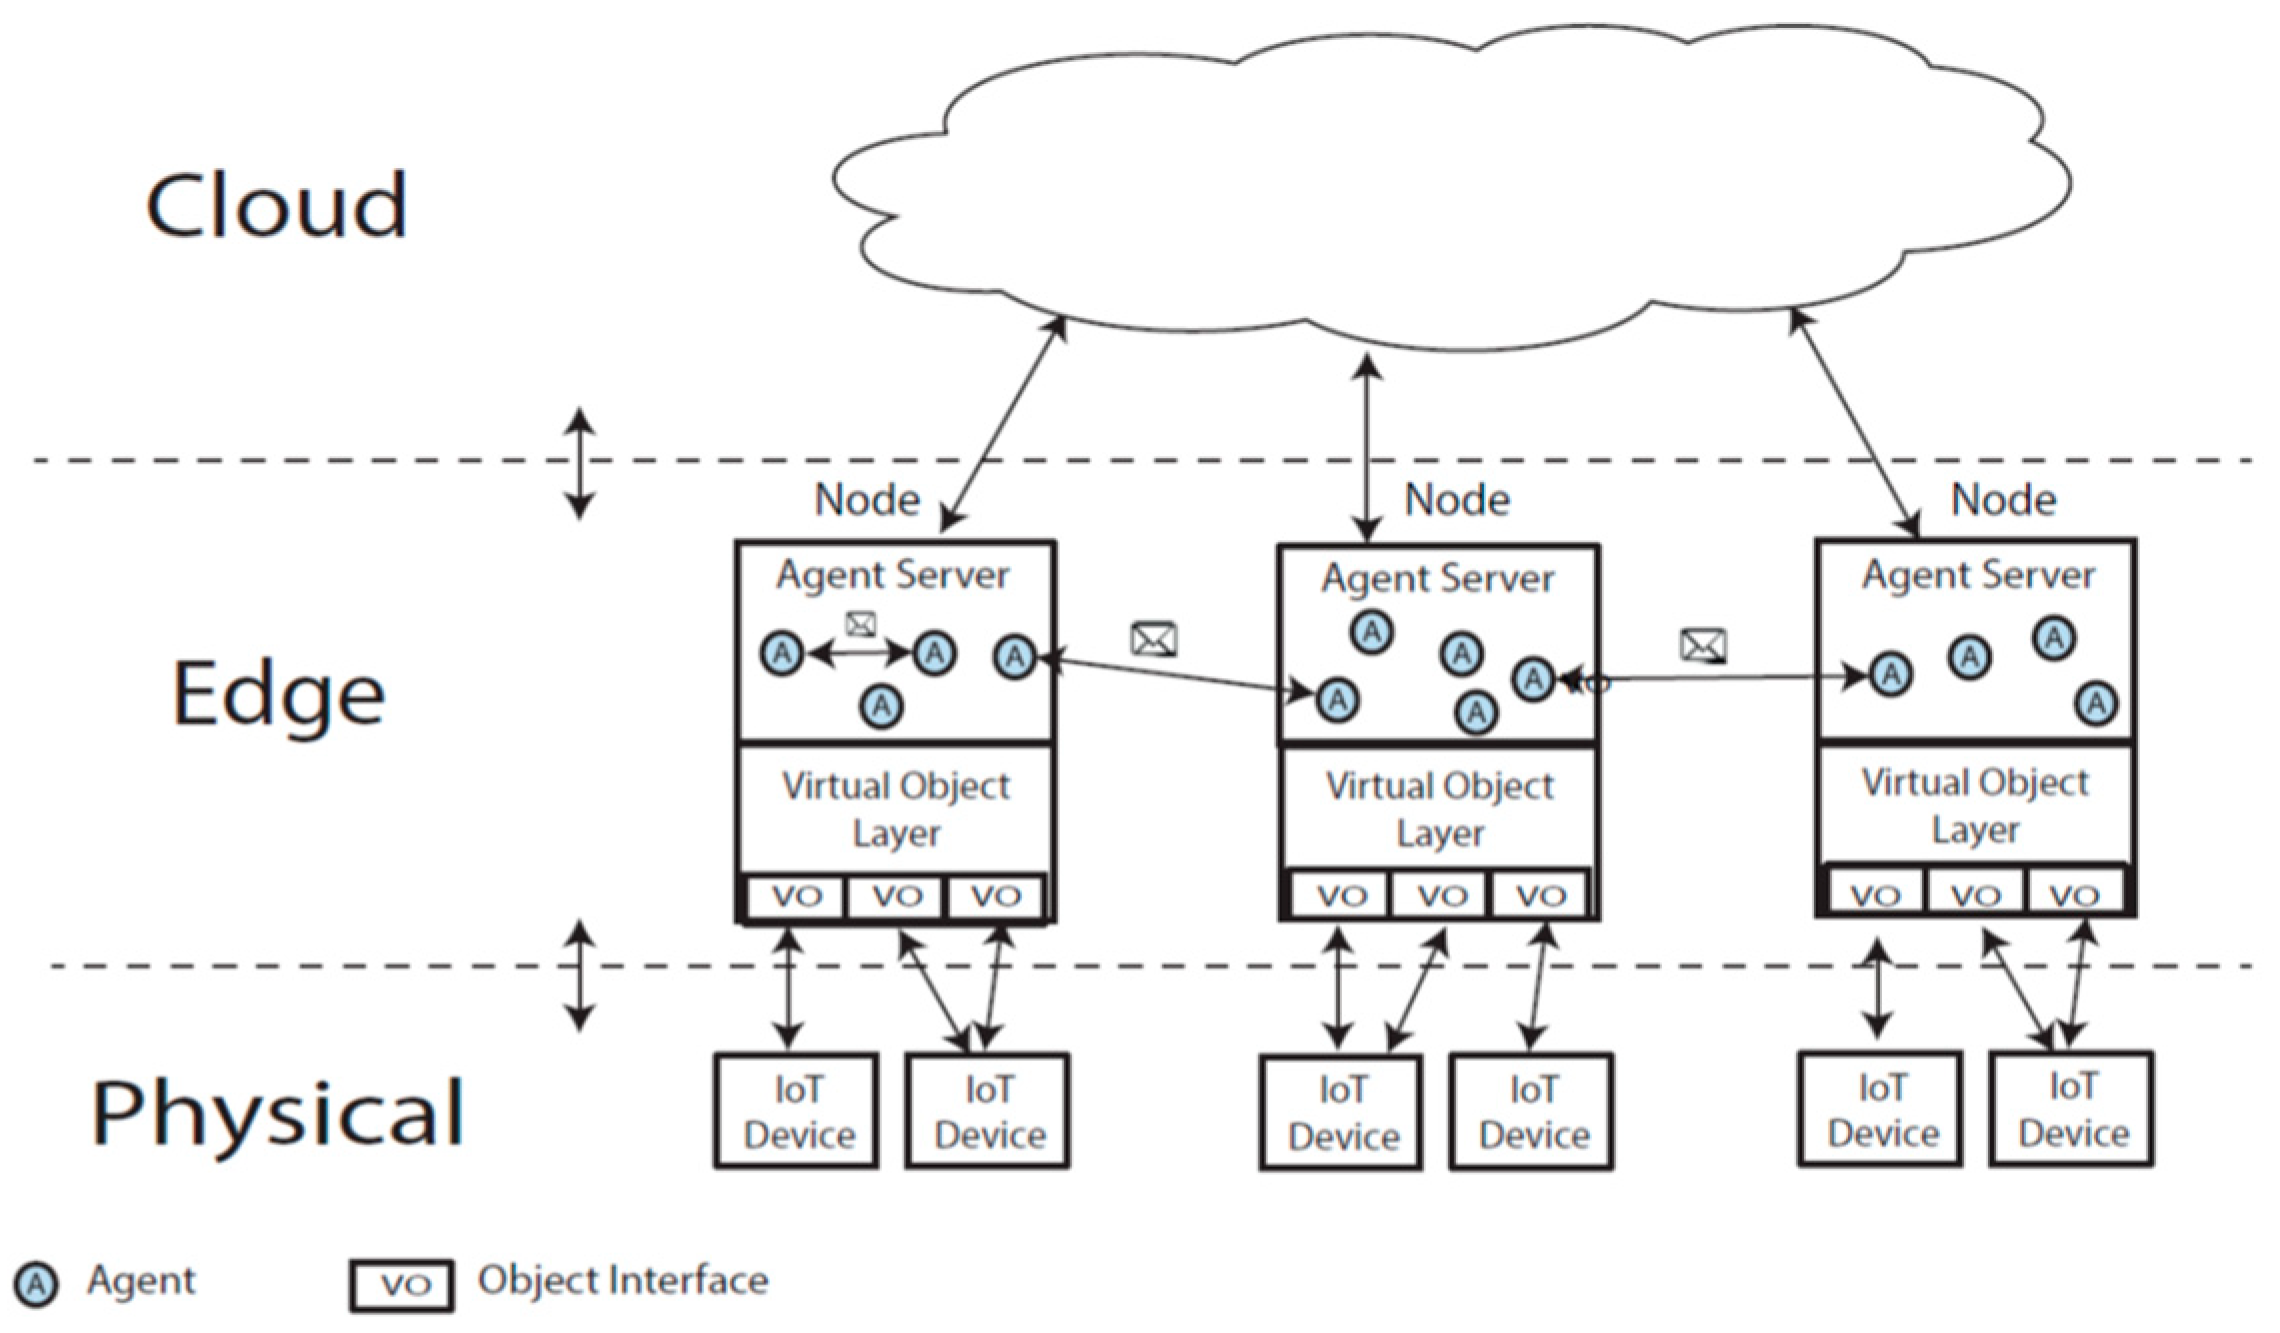
The software architecture that supports the Power Cloud management model is depicted in Figure 6. The architecture is based on “Rainbow” [29], a platform for the development of distributed applications pertaining to domains such as those related to cyber physical systems, fog computing, pervasive computing and the Internet of Things. Rainbow is written in Java, is highly modular, and includes three layers: the low or “physical” level, the medium or “edge” layer, and the high or “cloud” level. The physical layer is composed of physical objects and devices, which in the case of the Power Cloud are provided by the nGfHA and, eventually, the home automation systems and. The edge layer includes a set of servers (nodes), each of which contains two sublayers that provide the essential abstractions and functionalities for building the applications: the agent sublayer and the virtual object sublayer. The agent sublayer is characterized by an agent server on which a set of agents execute and interact with each other. Agents are entities that pursue their goals flexibly and autonomously while interacting with each other via message passing. In multi-agent systems [30], the interaction of multiple agents can produce complex emergent behaviors that possess many interesting properties such as adaptivity, resilience and fault tolerance. The virtual object sublayer contains a set of “virtual objects”, which are software abstractions of the actual physical devices.
The main purpose of a virtual object is to hide the heterogeneity of the different hardware peculiarities, by supplying a standard and flexible interface to the agents described above. In more detail, the virtual object interface abstracts the functionalities of the physical devices, and in particular generalizes the read and actuation operations that allow the applications to retrieve information and control the physical devices. In addition, the virtual object interface provides an event-based mechanism that allows agents to be asynchronously notified about the events in which they are interested, i.e., the state modifications of a physical resource. Finally, through the functionalities of the virtual object sublayer, an agent can subscribe to complex events defined by boolean rules over groups of functionalities. The two sublayers are implemented on the same server in order to speed up the execution and readily cope with real-time scenarios.
The role of the cloud layer is to offer the analytics and computation services that are too heavy to be performed in the distributed facilities of the edge layer. The cloud layer hosts the load forecast and generation forecast services.
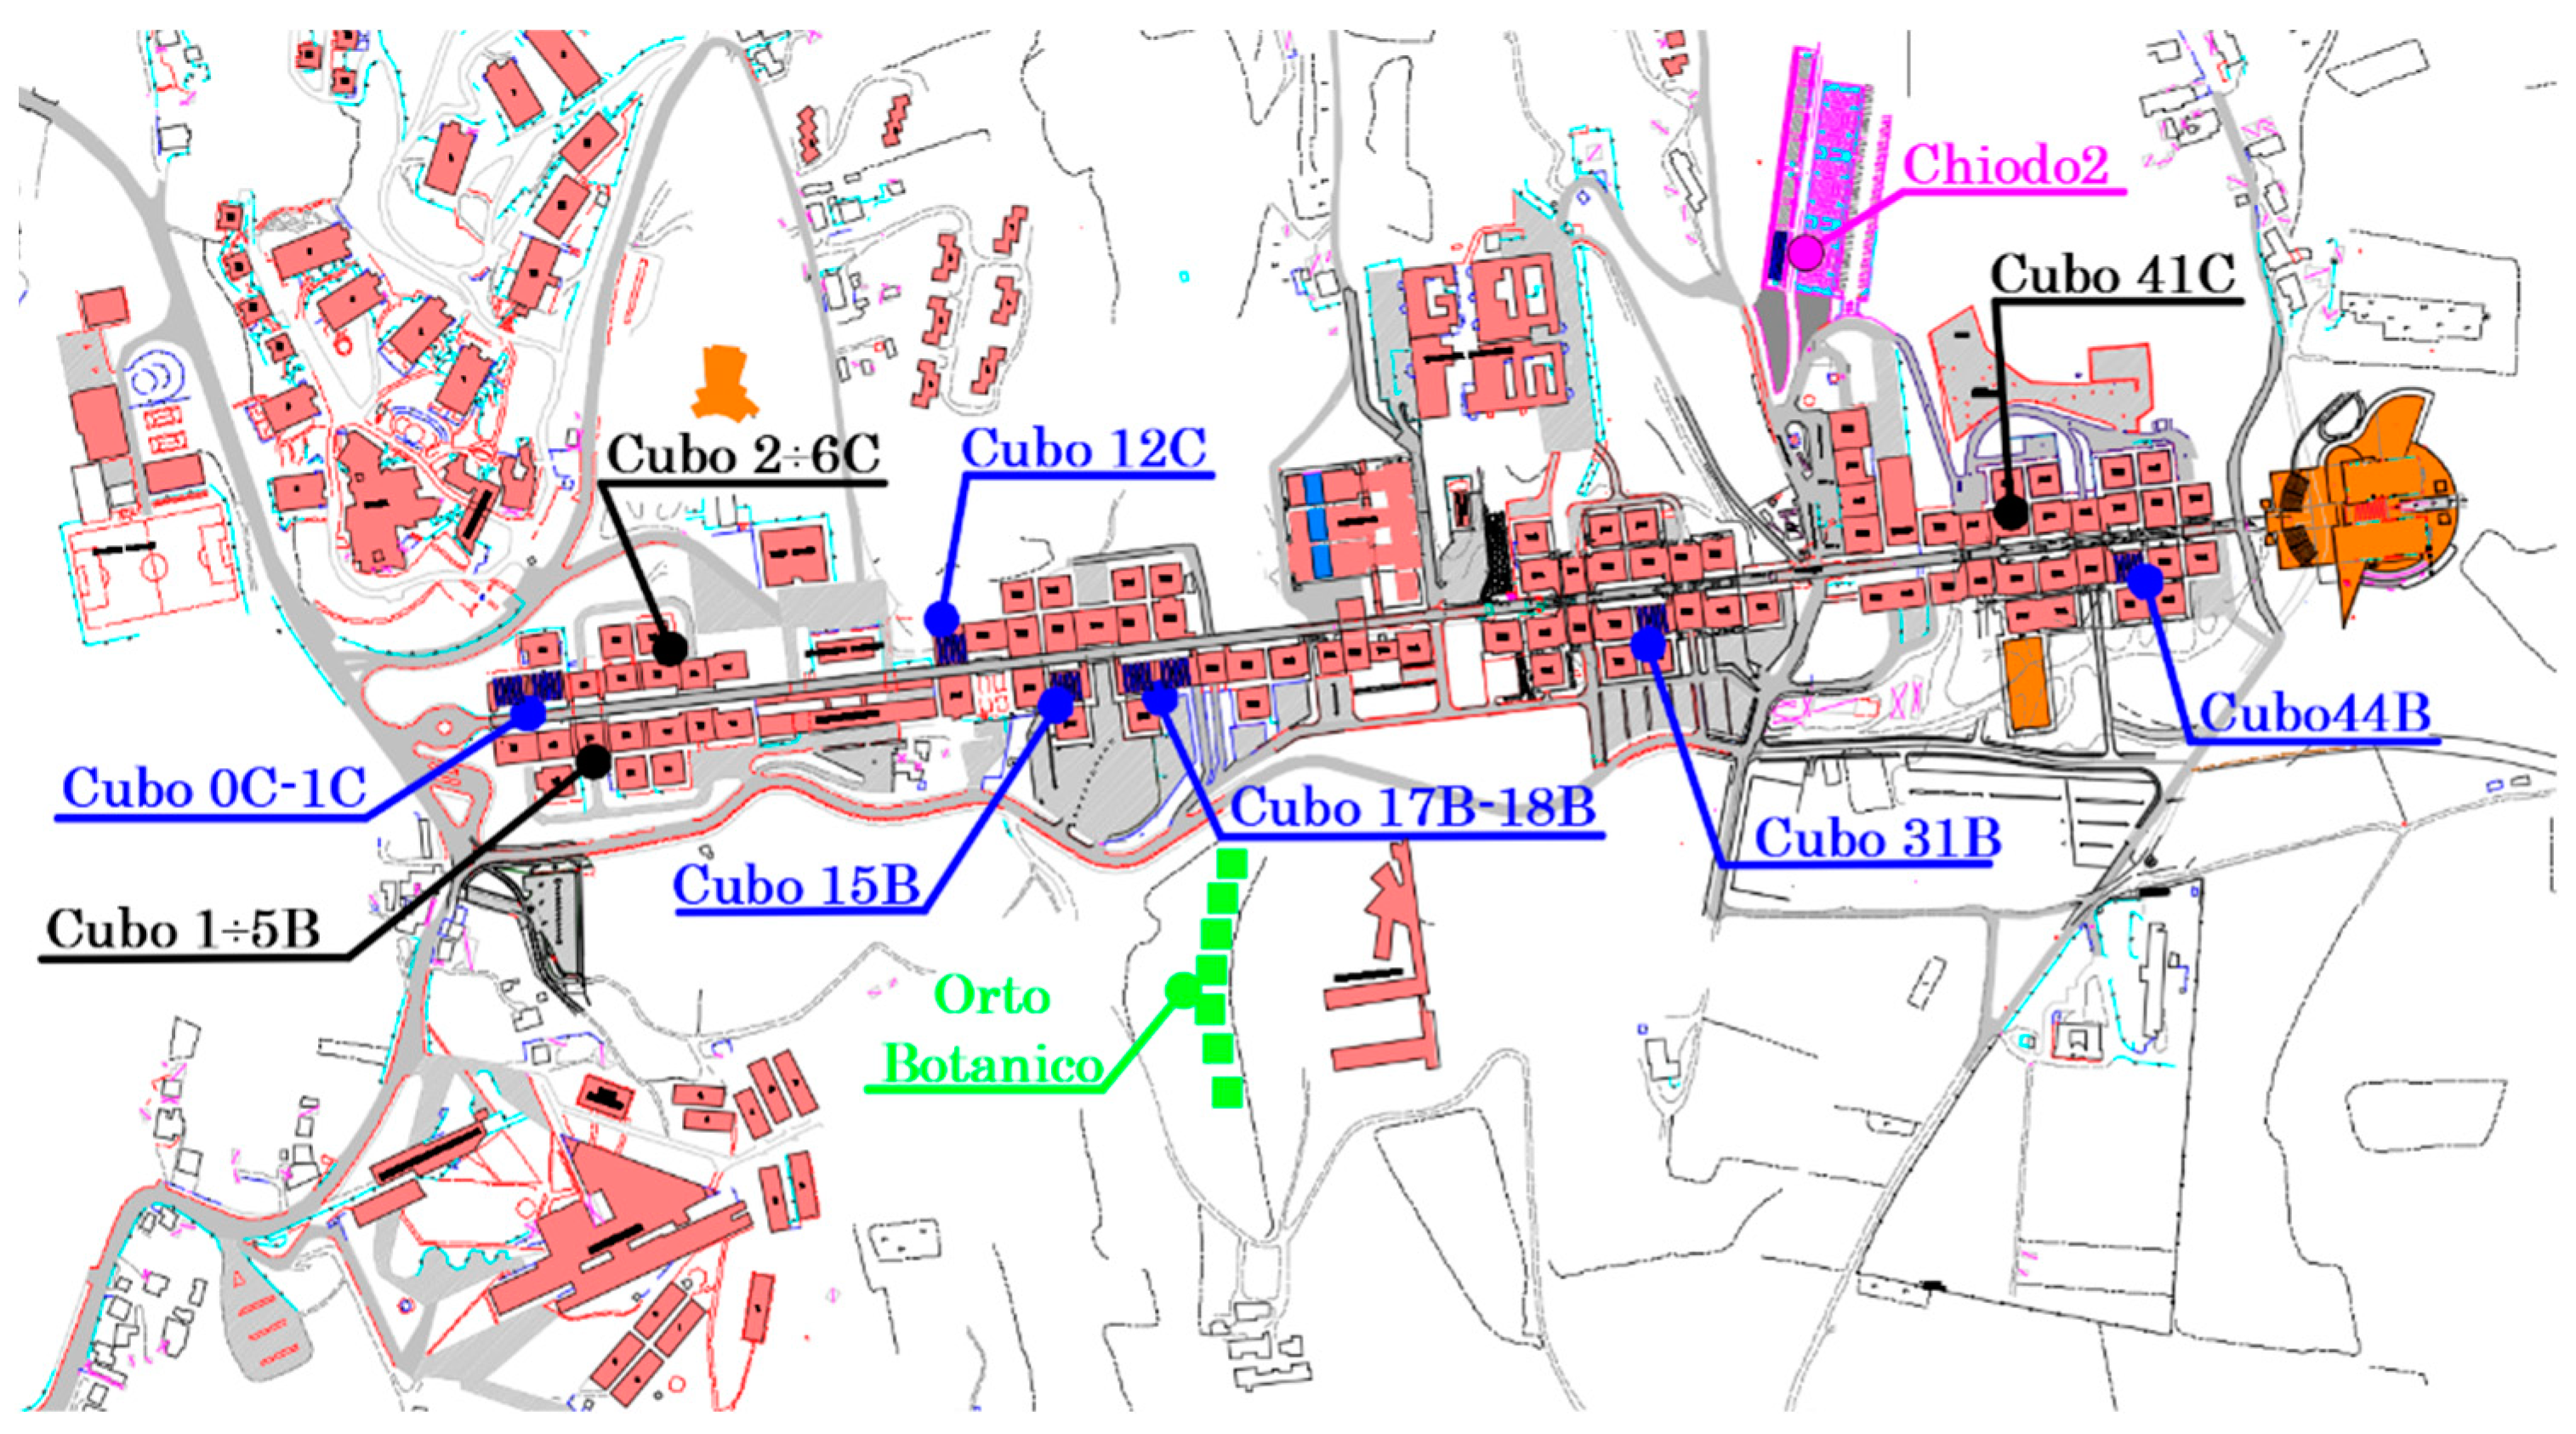
The Unical Energy Cloud, realised in the University of Calabria campus in Southern Italy, is an energy community. It is composed of several buildings located on the university campus; each building is a consumer or a prosumer with a PV plant installed on the building rooftop. Several RES plants are connected to the same low-voltage distribution network of the university (in the following referred to as Unical distribution grid) with a unique point of delivery that supplies the buildings, as illustrated in Figure 7. The idea is to share the RES production among the buildings by rescheduling the load when possible, and/or using ESSs. Table 1 reports the user data in terms of plants (RES, PV plants and thermal solar systems), traditional energy sources (gas boilers, heat pumps and points of delivery of the distribution grid) and loads (electrical-non schedulable and schedulable -and thermal) and ESSs (electrical and thermal). Table 1 also reports the rated power of each plant and the capacity of each ESS. Each Unical Energy Cloud user is interfaced with the cloud level through a local SEB.
In order to implement the Power Cloud management model on the Unical Energy Cloud, it was necessary to realise the ICT platform and so enable the communication among the buildings (Unical Energy Cloud users), the RES plants and the CEP. Indeed, it is well-known that the ICT infrastructure is essential to efficiently perform every action/control/management operation [31]. In particular, ICT technologies allow systems to:
- -
- send signals to users about their consumption/demands/prices;
- -
- report on any anomaly in the network, and act quickly;
- -
- carry out the daily market operations;
- -
- give users the market results;
- -
- communicate to operators what happens in the smart community, or receive directives from them.
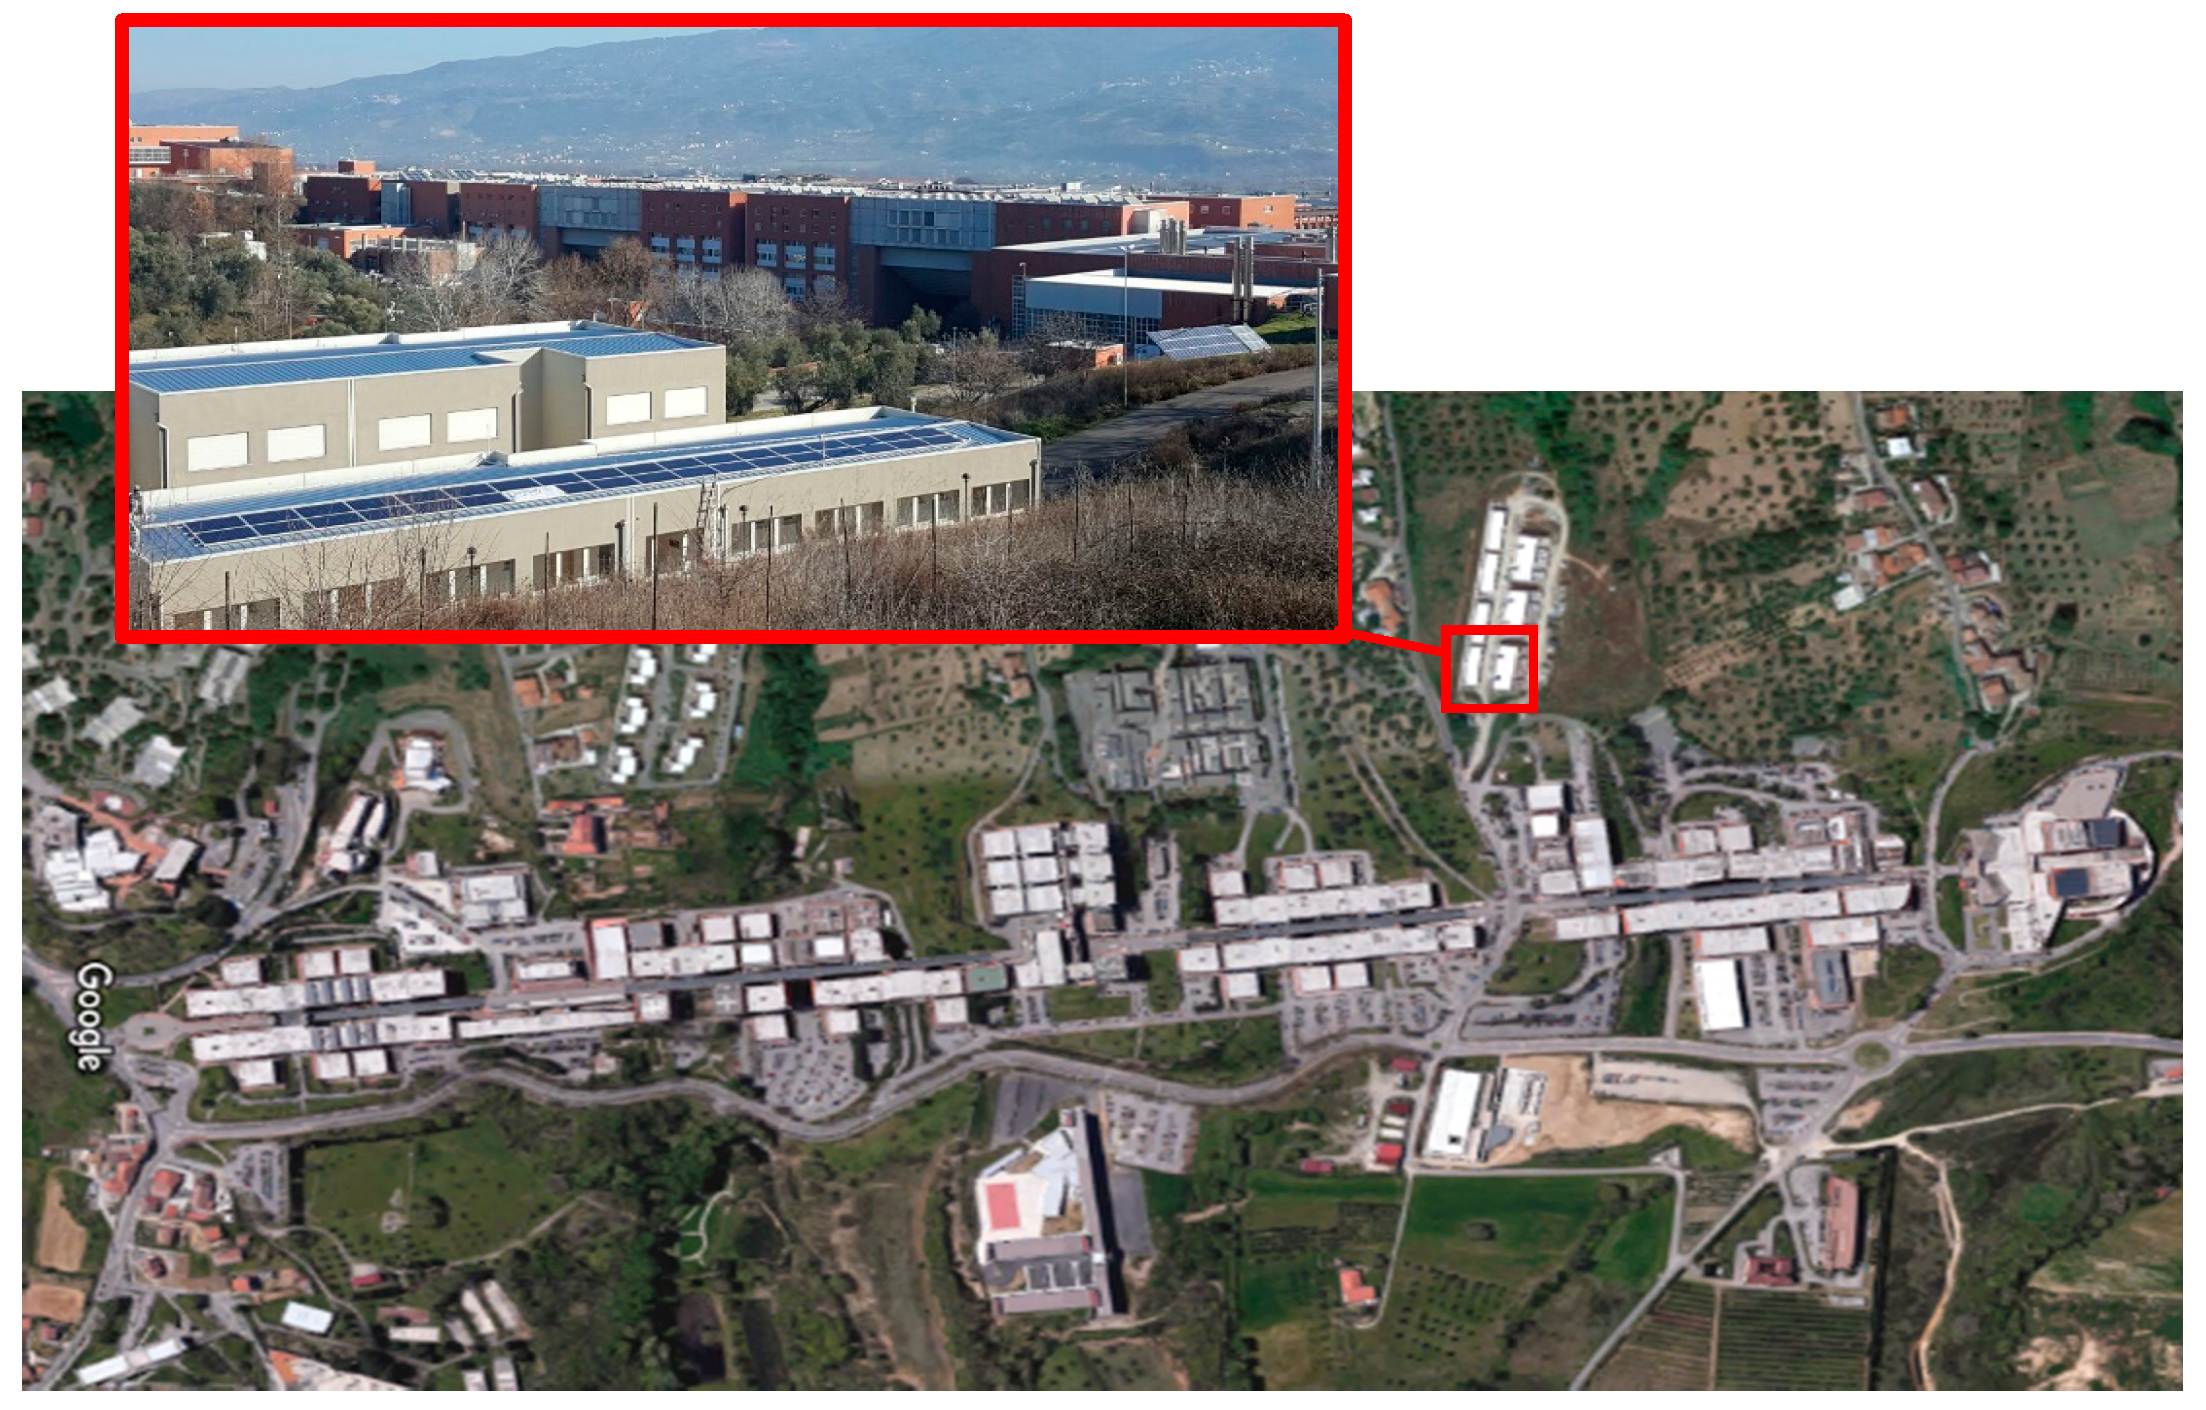
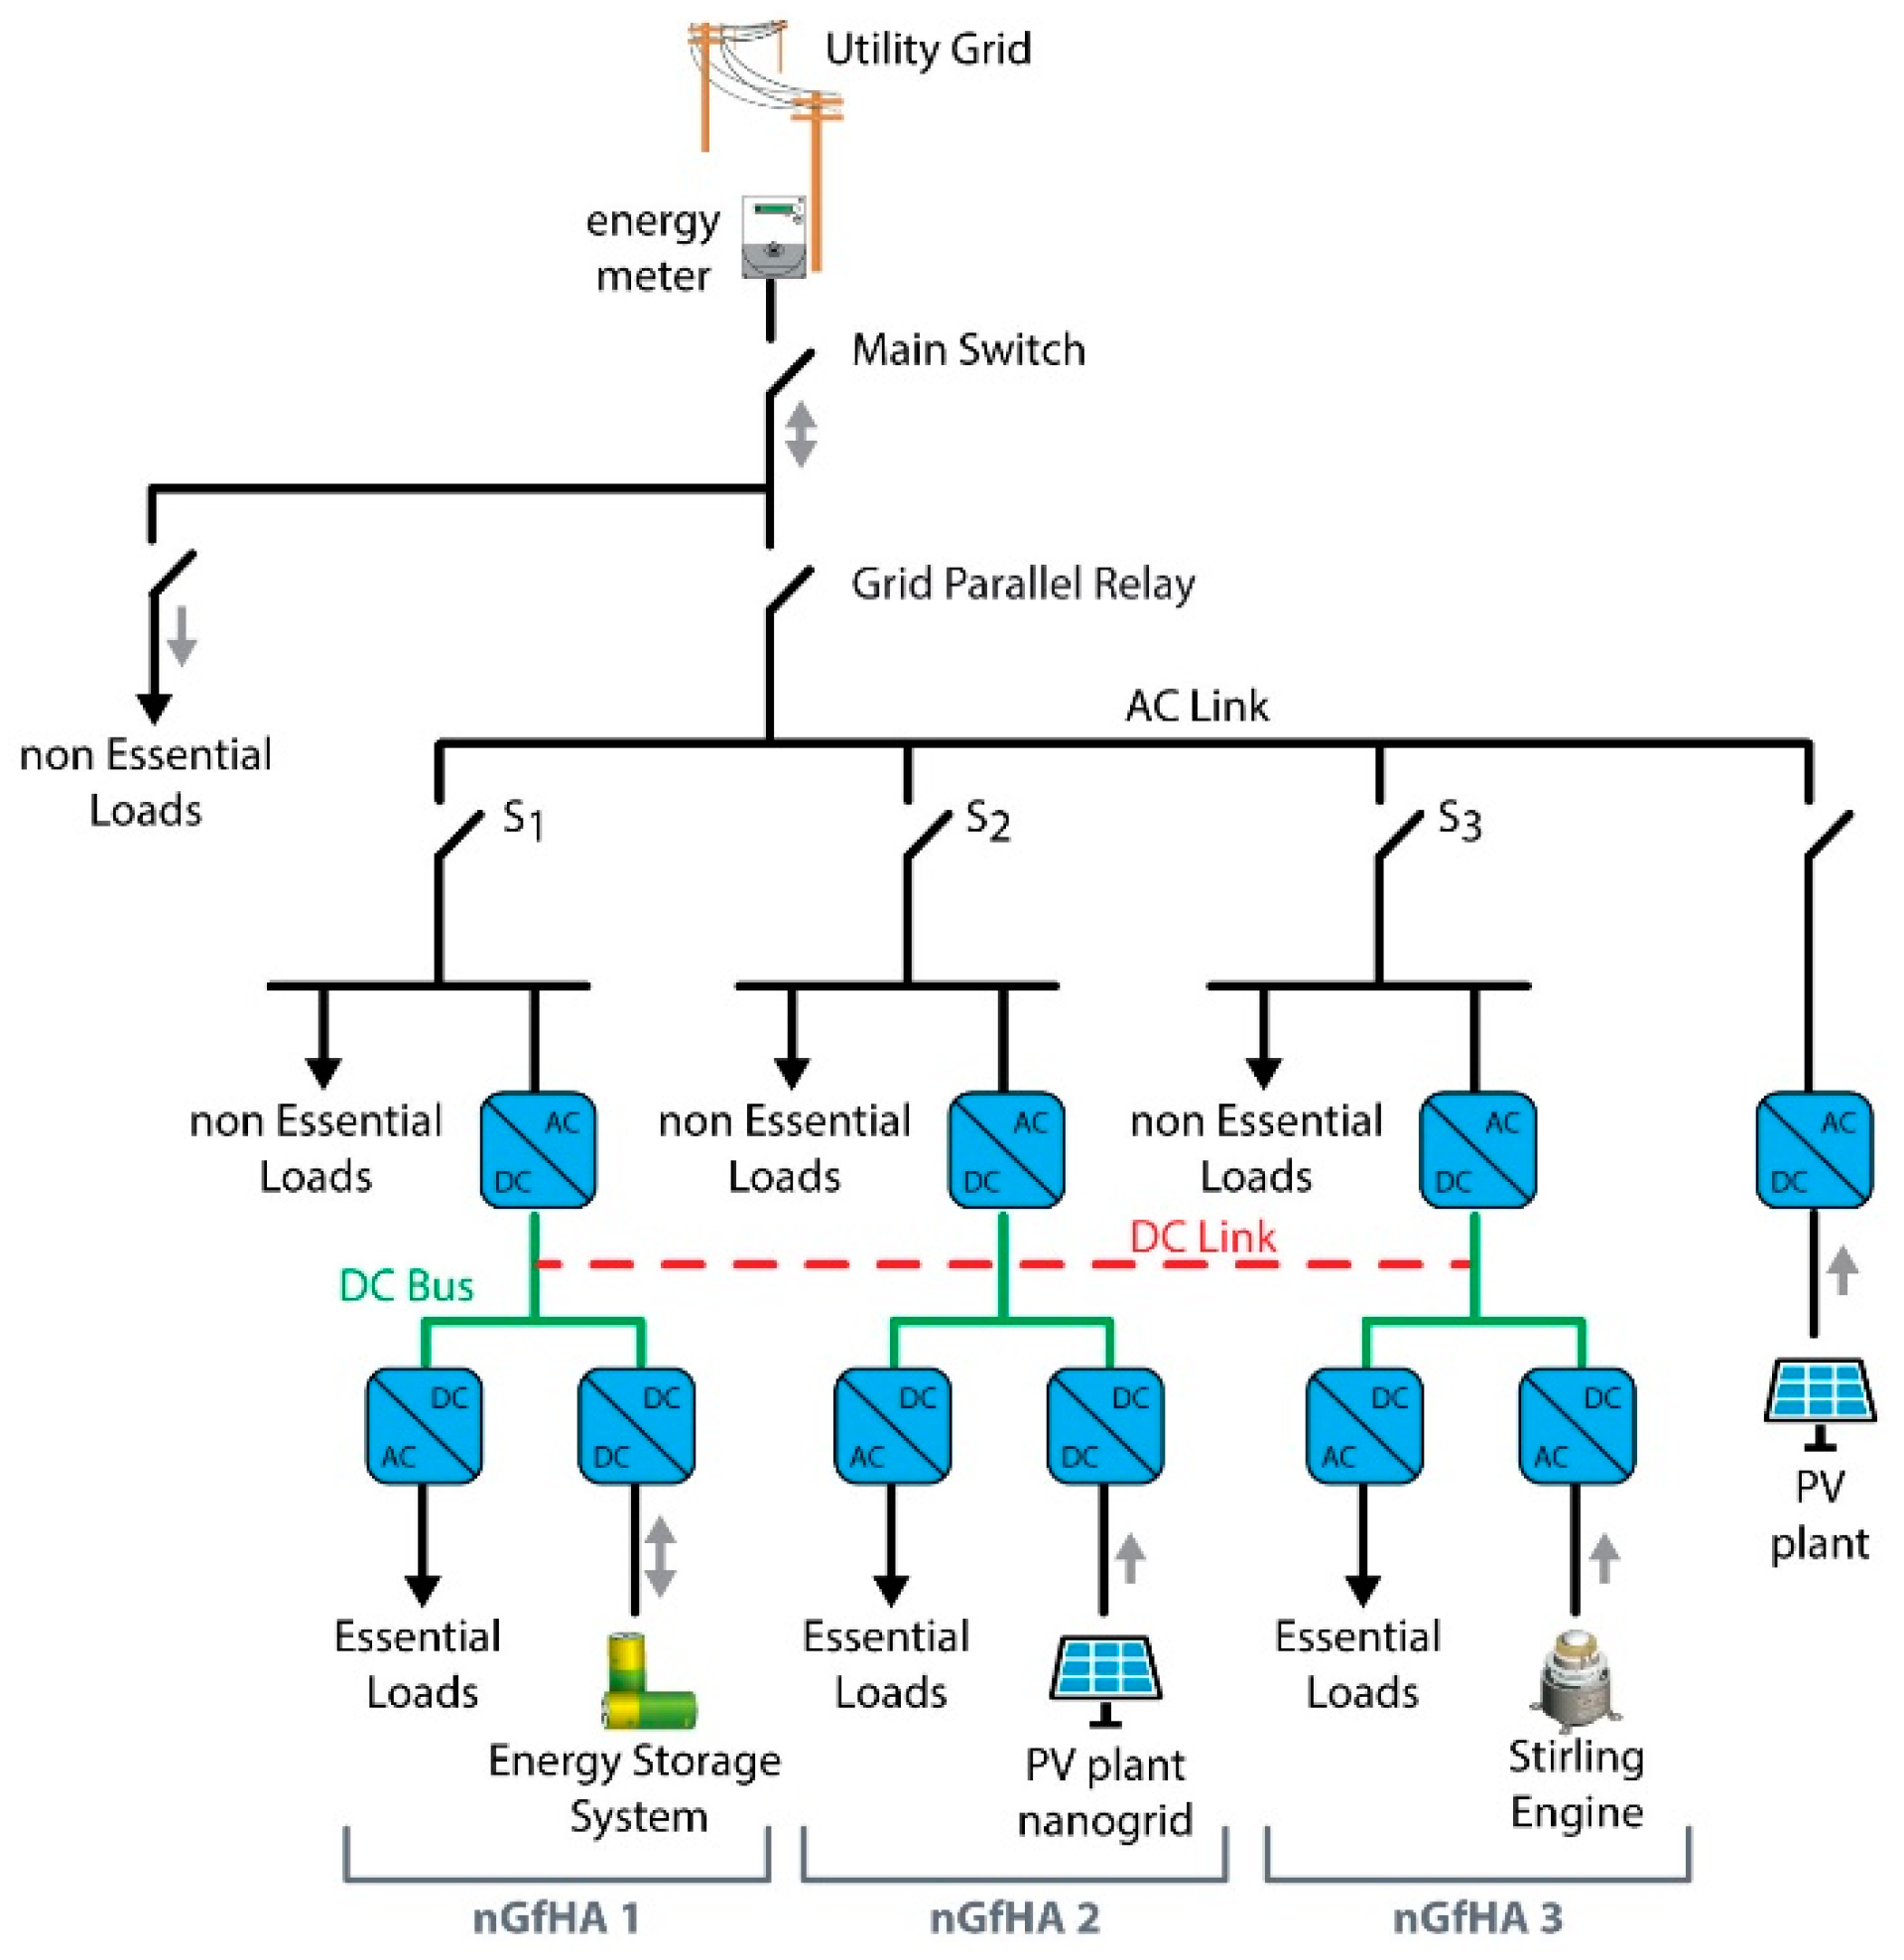
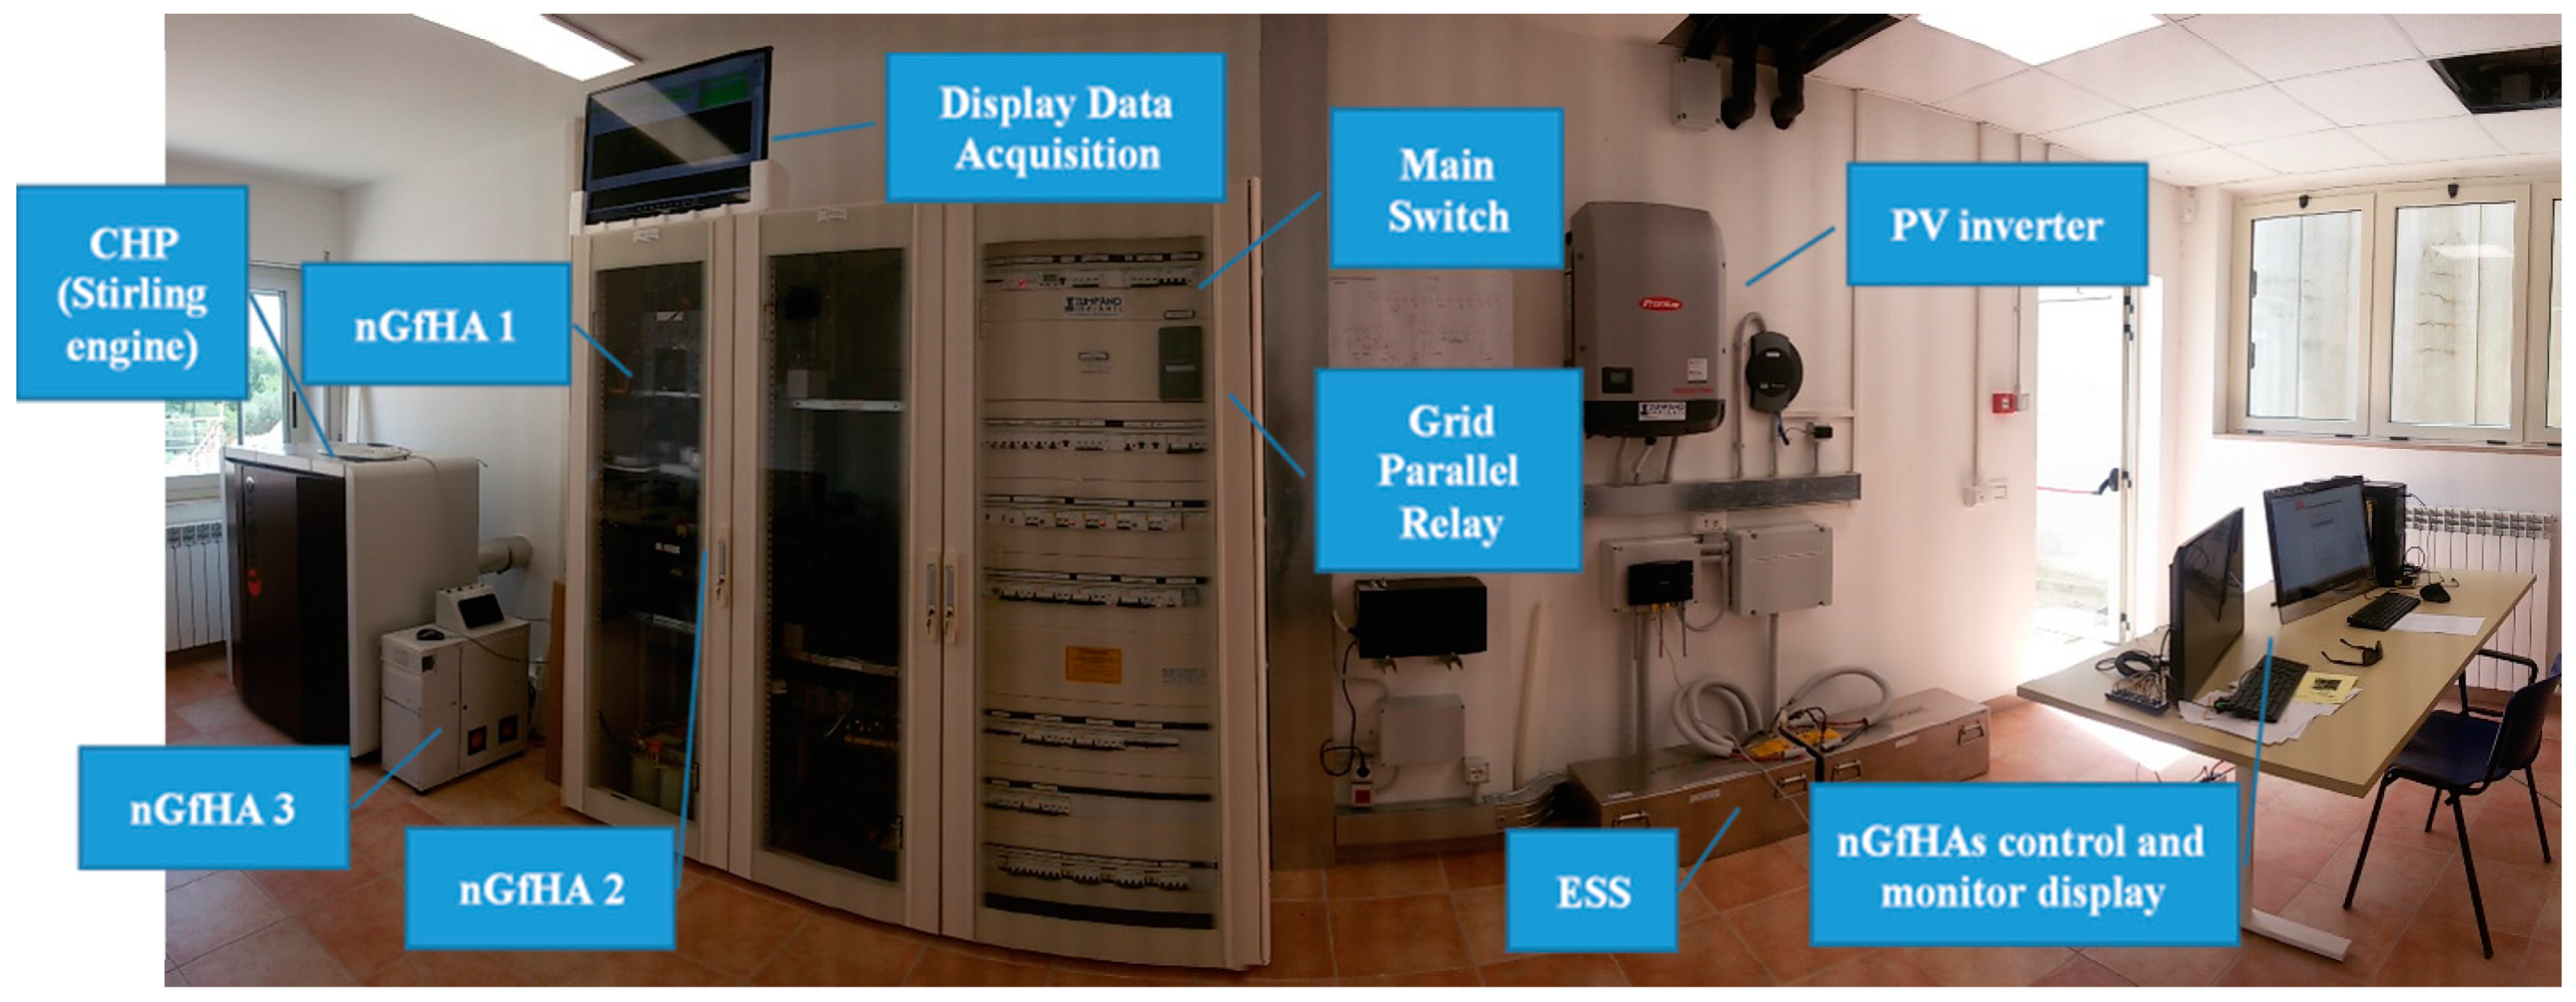
As an example, let us focus on one of the campus buildings, Chiodo2 (see Figure 8). In Chiodo2, three nGfHAs are installed and connected to a common DC bus, operating as a unique hybrid AC/DC (alternating current/direct current) microgrid. An energy meter is installed as interface between the DC microgrid and the Unical distribution grid. In this way, when the local generation and/or the ESS are not sufficient to satisfy the load demand, the energy deficit is absorbed from the Unical distribution grid. The interface switch installed below the energy meter is compliant to the Italian grid interconnected standard. It is open when the DC microgrid needs to operate in islanded mode. As illustrated in Figure 9, not all the loads are supplied in the case of islanded operating mode, but only the essential loads (the loads that do not tolerate a blackout or a low-quality supply). In each nGfHA, a switch device Si (i = 1…3) can disconnect the nanogrid from the local AC grid, so that the three nGfHAs will operate as isolated DC microgrids. The nGfHA 1 interfaces the ESS with the DC bus supplying the essential loads of the same nanogrid. The photovoltaic plant, installed on the rooftop, is interfaced by the nGfHA 2, while a stirling mCHP is interfaced by the nGfHA 3 [32]. An overall picture of the hybrid AC/DC microgrid is reported in Figure 10, while the information flows between the SEB and CEP are depicted in Figure 11.
4. Experimental Results
Each user is equipped with an nGfHA and a SEB. In the nGfHA, the electric energy distribution is realized through a common DC bus where micro-sources, ESSs, a power resistor (used to dissipate the surplus of energy) and non-interruptible loads are connected, using AC/DC or DC/DC power converters. The connection with the grid is realized through a DC/AC converter called a PEI (power electrical interface): it is a bi-directional power converter that regulates the power flow between the nGfHA and the grid and is capable of absorbing or supplying energy when the nGfHA is connected. In addition, the PEI allows the nGfHA to operate as a single system, providing ancillary services to the grid.
The nGfHA needs to balance the amount of produced energy with the energy required by the loads connected through the DC bus. The energy surplus can be accumulated in ESSs or in the grid used as a storage system. For instance, sudden changes of the load profile, when the nGfHA is not connected to the network (stand-alone configuration) imply that the energy must be properly dissipated, avoiding surges that can cause a malfunction, possibly damaging the nanogrid or creating a risk for the users. It operates in a distributed fashion by adopting the so-called DC bus signalling control strategy: every converter has a threshold voltage level DC bus, based on the voltage level that the converter can absorb or supply to the DC bus. By adopting this strategy, the converters operate independently, following the DC bus voltage level. In this way, the converters respond not only to the level of the DC bus voltage, but each converter is able to control indirectly the other converters connected to the same DC bus.
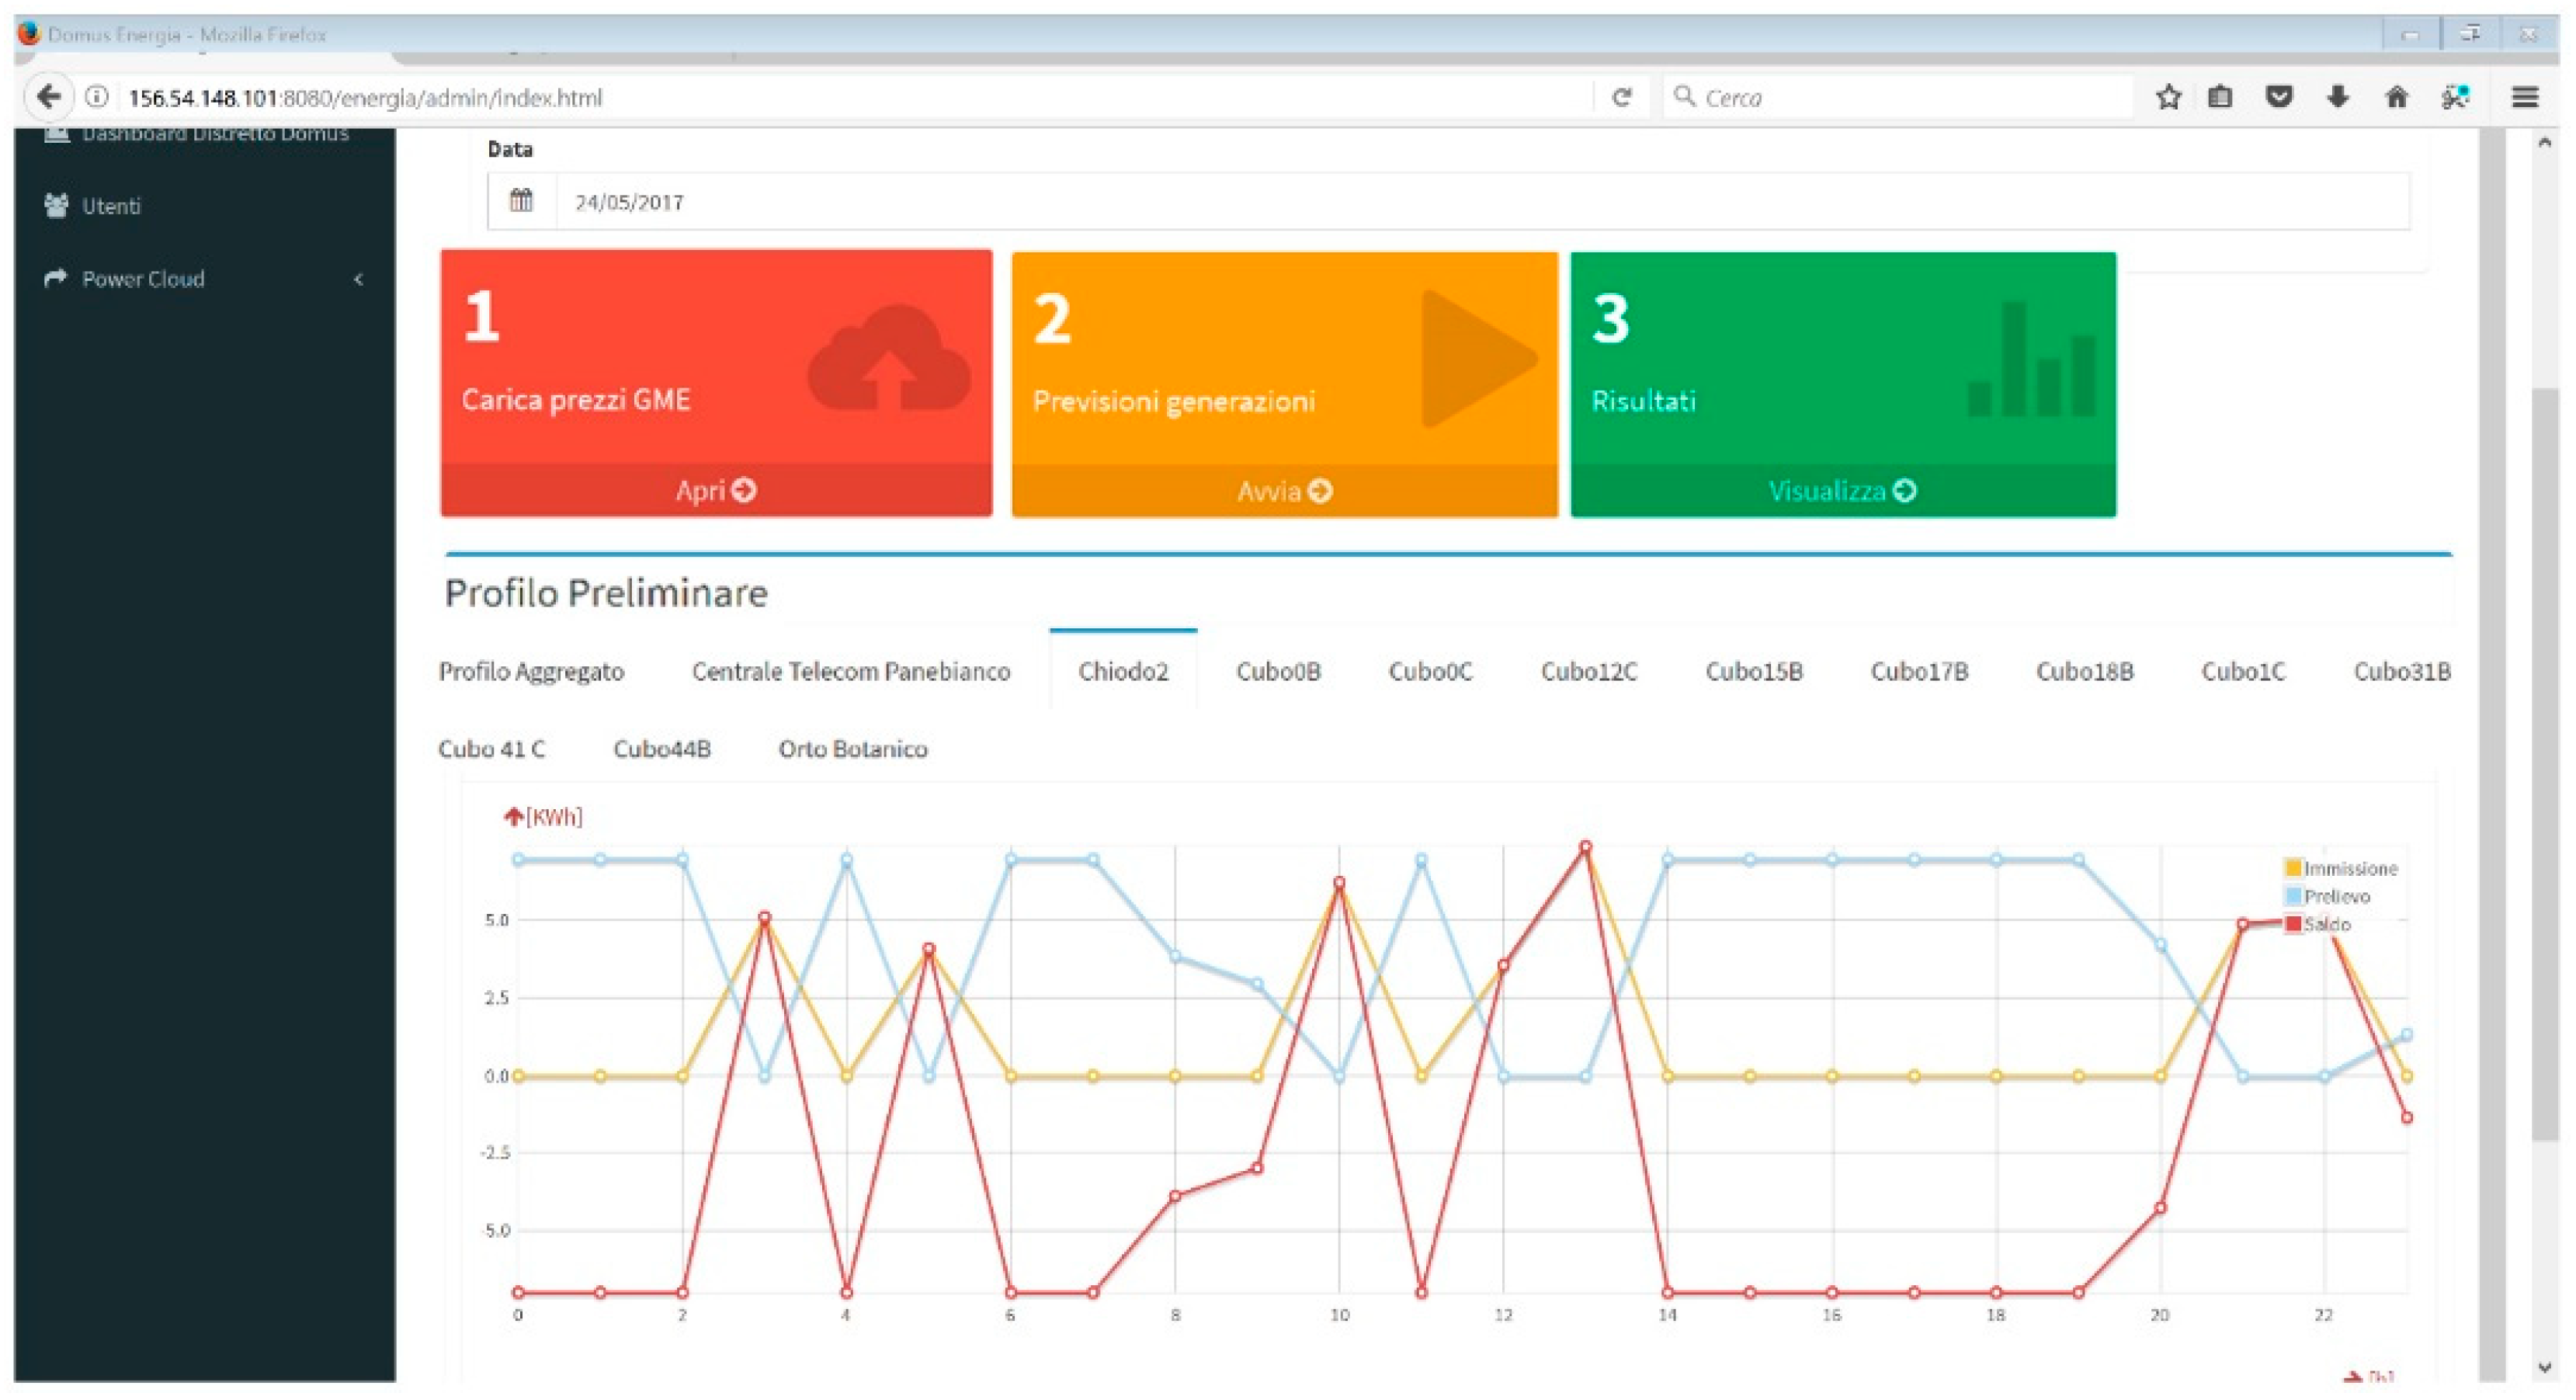
The SEB includes a 7-inch touch-screen, a Raspberry Pi3 a Tapko KNX sim, and a user-friendly interface through which the user sets his/her preferences regarding the schedulable load and the thermal comfort [33]. It communicates with the CEP and asks for services such as the hourly electricity prices and the hourly PV generation forecast. Therefore, it uses these data along with the user’s preferences to compute the optimal loads and production scheduling profile, thus activating the SEB workflow reported in Figure 5. At the end of the first stage, step 3 of Figure 5, a load and production scheduling profile is determined as depicted in Figure 12.
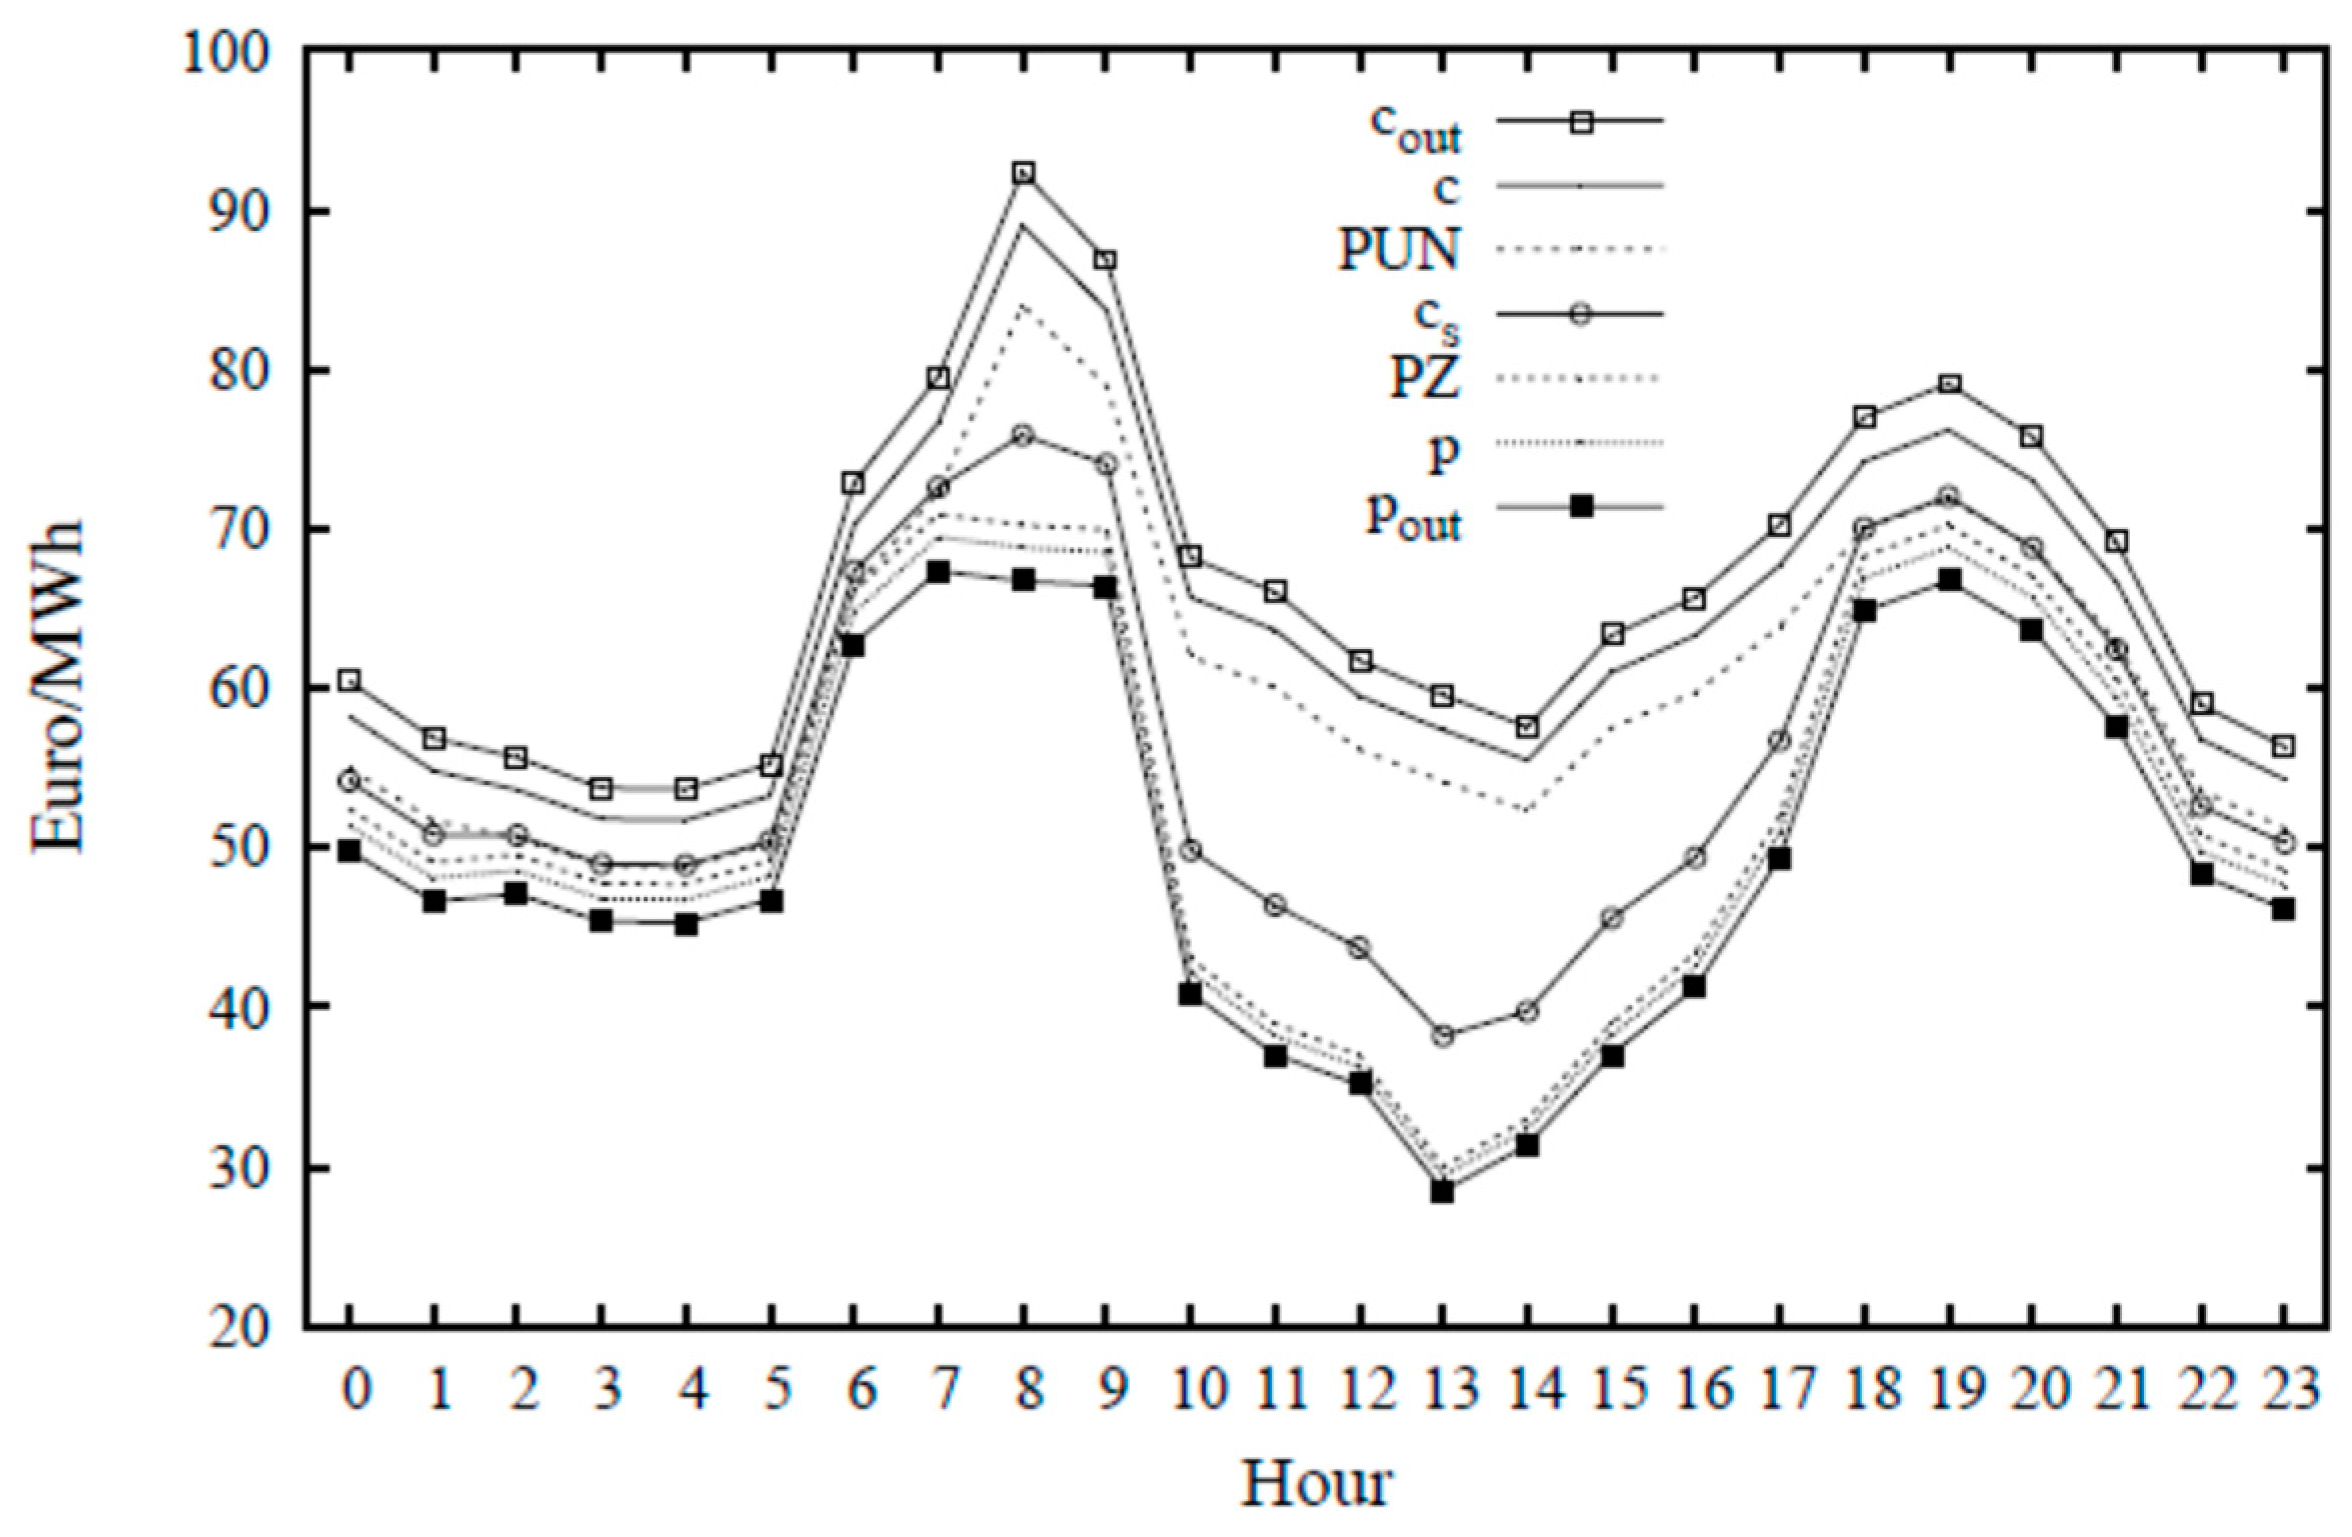
Before showing the benefits of the Unical Energy Cloud in terms of energy and economic performance, in the following, we briefly discuss the prices associated with the energy exchanges and how the Unical Energy Cloud can achieve benefits in this context. Indeed, even though the presented results refer to a case study subject to rules of the Italian energy market, the approach is valid for all the cases in which the energy cost changes hour-by-hour, due to free-market fluctuations, and where a gap exists between the selling and purchasing price. In this context, the prosumers that organize themselves in an aggregate form (energy community) can achieve benefits for two main reasons: (1) the energy community, as a whole entity, can negotiate directly with the energy provider that applies wholesaler energy prices and (2) the energy exchanges inside the energy community can be optimized.
The CEP takes into account the daily trend of the energy market, i.e., the hourly wholesaler prices, at which the energy community can exchange energy with the energy provider: the zone price (PZ), i.e., the selling price, and the single national price (PUN), i.e., the buying cost. In the case that the prosumers do not join an energy community, they need to negotiate directly with a wholesaler. As a consequence, if we call and the hourly buying cost and selling price for the prosumers that operate in isolation, i.e., outside any energy community, the following inequalities must apply:
The CEP is free to choose the tariffs that are applied to the prosumers of the energy community. Let us call and the buying and selling costs, which are established by considering a tradeoff between the prosumers’ and the CEP’s economic advantages. Clearly, to ensure that the prosumers have a benefit to join the energy community, it must hold that:
The above inequalities can be summarized as follows:
We also need to consider the price adopted in the second stage for the energy surplus put on sale to be redistributed among the prosumers. Let us call this price . Clearly, has to be more convenient than the purchase price used in the first stage. In addition, it must be greater than PZ, otherwise it would be more convenient to sell the energy surplus to the grid rather than distributing it within the energy community. Based on the latter considerations, the above inequalities can be rewritten by including the price , so obtaining:
The curly brackets indicate that there is no particular order relationship between the values of and PUN.
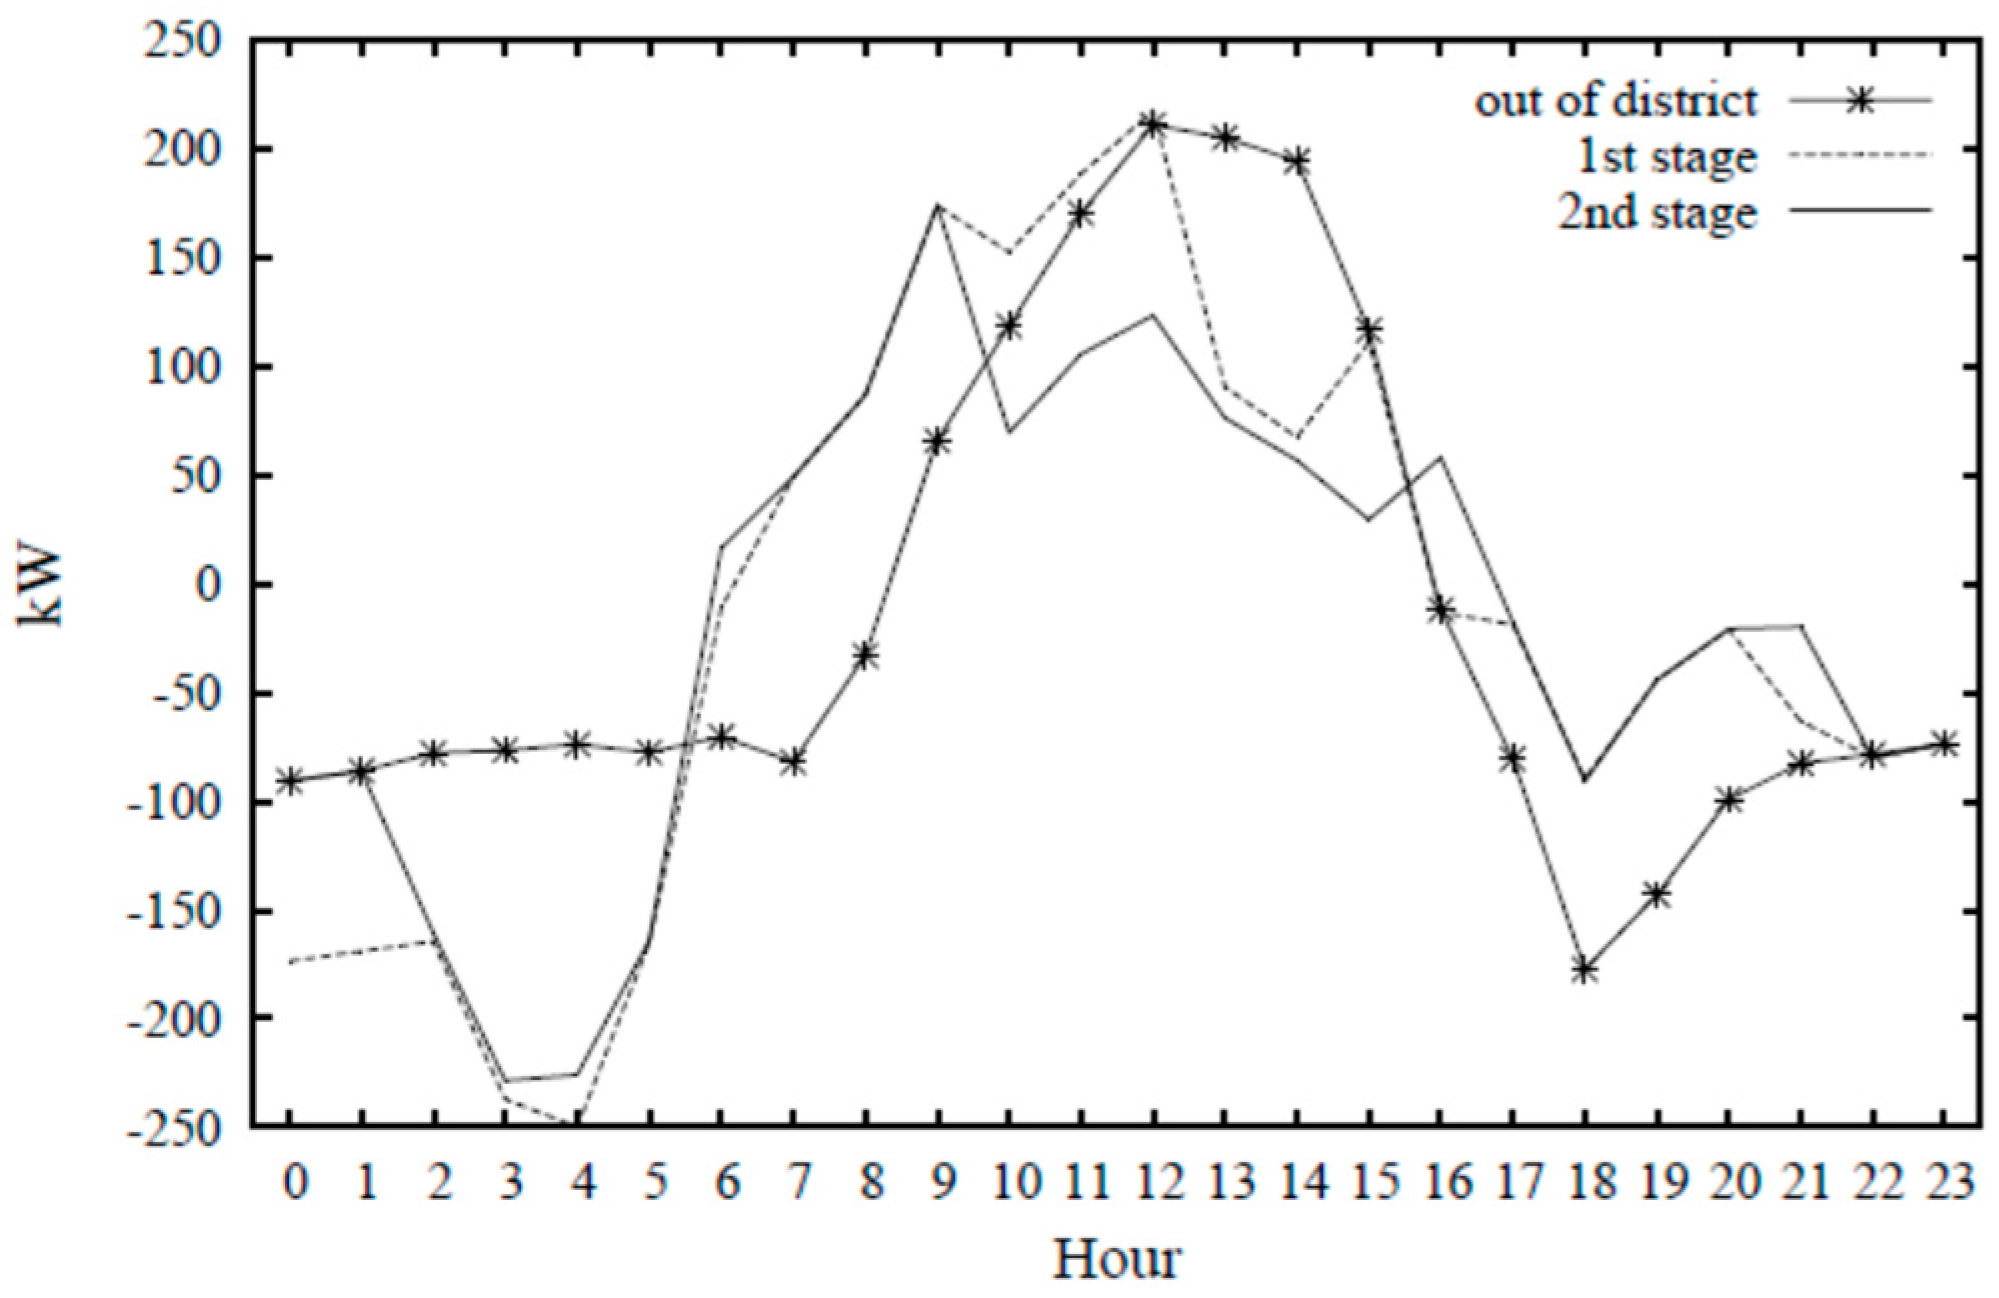
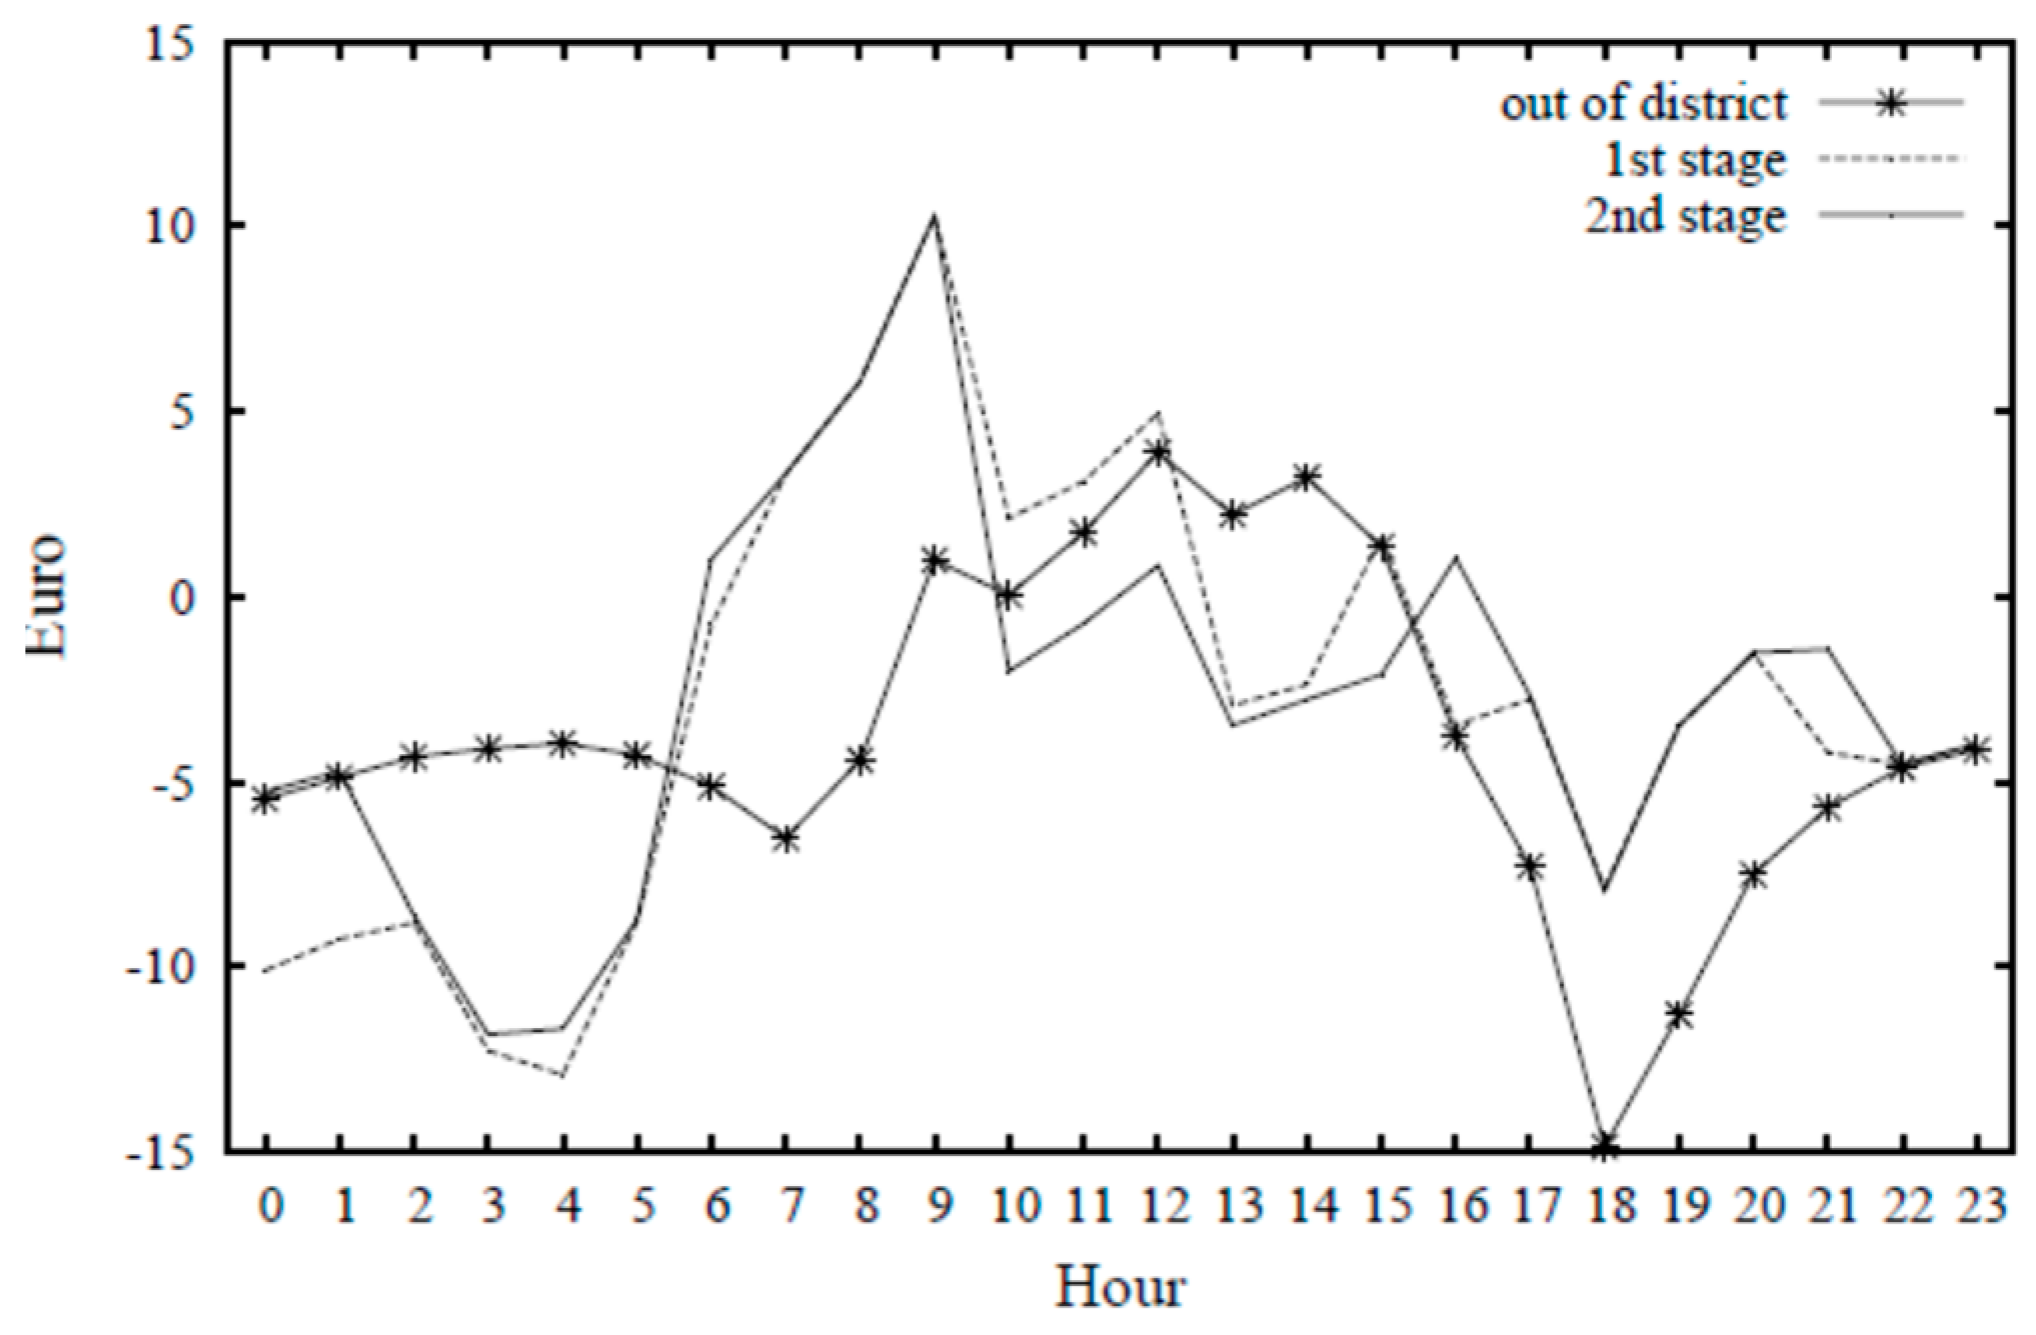
As an example, Figure 13 shows the hour-by-hour values of the prices described above, referred to a given day. It is worth noting the gap existing among these prices and how they fluctuate from hour to hour. In Figure 14, the performances of the Unical Energy Cloud are illustrated by comparing three different scenarios: (i) out of the district community case, in which the prosumers do not organize themselves in a Power Cloud and the strategies presented in this paper are not applicable; (ii) 1st stage case, in which only the DRp first stage is executed; and (iii) 2nd stage case, in which the DRp first and second stages are both executed. In the first scenario, the Prosumer Problem is not applied. The prosumers behave according to a simple energy strategy, which can be considered as a basic strategy for prosumers equipped with an ESS. In particular, a prosumer fulfils the load demand by using its PV plant or ESS, and when this is not sufficient, buys extra energy through the grid. Moreover, the energy produced by the PV plant, which exceeds the load demand, is used to charge the ESS and is sold to the grid when the ESS is full. The thermal part is managed in a similar fashion. When looking at Figure 14, it is important to notice that the 2nd-stage profile is flatter than the 1st-stage profile: the reason is that the redistribution of the energy surplus among the users allows the energy exchanges between the Unical Energy Cloud and the Unical distribution grid to be reduced. It can be noticed that costs/revenues, reported in Figure 15, are related both to the trend of imported/exported energy (Figure 14) and to the hourly prices reported in Figure 13.
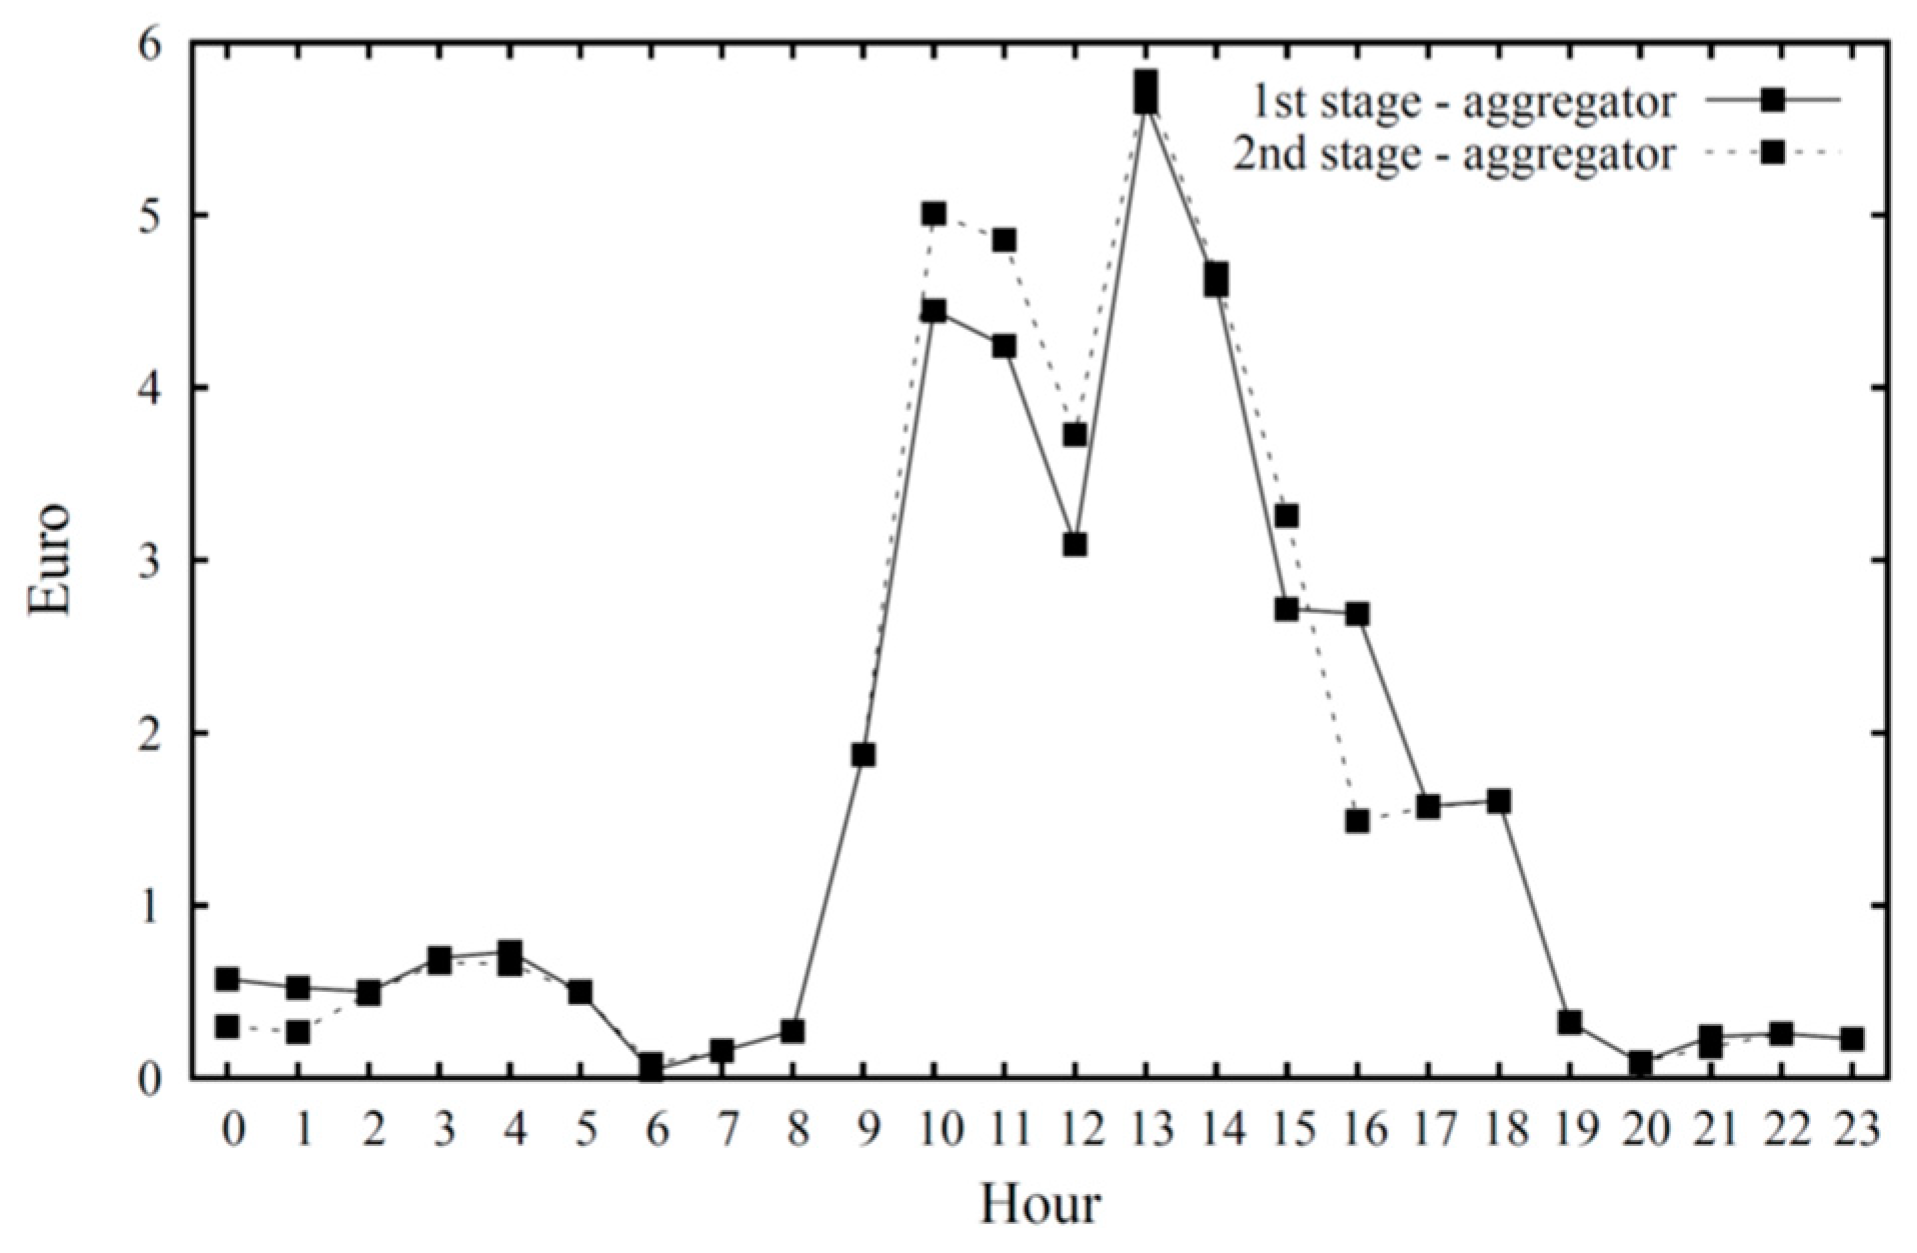
Beyond the advantages experienced by the prosumers, the adoption of a district allows the community to gain an additional economic advantage, which is obtained by the aggregator but of course can be redistributed to the prosumers, or used for other purposes such as maintenance, investments, etc. To illustrate this aspect, Figure 16 reports the hourly revenues of the aggregator for the first stage and second stage scenarios. It is worth noticing that this revenue can be achieved only in the presence of a district, while no such revenue exists in the out-of-district scenario.
To provide an overall insight into the results, Table 2 separately reports the costs/revenues experienced by the prosumers, by the aggregator and by the district as a whole. We can summarize the improvements due to the use of the Unical Energy Cloud by comparing the three scenarios. When considering the out of district and the first stage scenarios, we can assess that the latter allows the prosumers to obtain a cost reduction equal to about 22% with respect to the former, while, when also the second stage is considered, the cost further reduces by an additional 5%. When considering the district as a whole, including the revenue of the aggregator, the cost reduction percentages are equal to about 65% (first stage vs. out of district) and about 14% (second stage vs. first stage). This data bears witness to the validity of the Power Cloud management model approach.
5. Main Achievement
The main achievement of this paper is the application of the Power Cloud management model and IoE to a real-world practical scenario, and the implementation of the ICT architecture and other enabling technologies, such as the nanogrid and the SEB. Moreover the so-called ‘Internet of Microgrids’ (IoM) among three nanogrid has been implemented. In this fashion, it is possible to demonstrate the effectiveness of the model for the management and coordination of the resources available in a community like the Unical campus. The experiments show that it is possible to obtain significant savings in terms of energy costs, both for the prosumers and for the aggregator, which results in an even larger overall improvement for the district as a whole. The additional revenues or cost reductions are a benefit for a community and can be re-invested for the installation of new renewable energy plants. It is worth noting that the illustrated advantage can be obtained with a very limited initial economic effort, which consists in the purchase and installation of a SEB at each prosumer. Indeed, a SEB typically makes use of simple and economic hardware resources, such as a Raspberry, which needs to interface with a pre-existent Power Cloud infrastructure.
6. Conclusions
Energy communities are an effective solution to integrate renewable energy sources in an energy grid, and allow the users of an energy market to play an active role. Nowadays, only a few examples of energy communities are implemented and tested in a realistic scenario. The aim of this paper is to illustrate some interesting preliminary experimental results regarding the implementation of an Energy Community based on the Power Cloud model presented by the authors in a previous paper. To this purpose, a real-life application in the University of Calabria Campus, the Unical Energy Cloud, is illustrated.
The paper has provided some details on the implementation of the Energy Community, focusing on the nanoGrid for Home Application, which is the core of the Power Cloud model. Experimental results show the performance of the Power Cloud model in terms of increasing amount of renewable energy collectively shared, when compared to a scenario based on the autonomous energy management of each member of the Unical Energy Cloud.
Author Contributions
Conceptualization, D.M., A.P. and N.S.; methodology, A.G. and C.M.; software, A.G.; validation, A.P.; investigation, D.M. and N.S.; writing—Original draft preparation, A.G., C.M. and A.P.; funding acquisition, C.M., D.M. and N.S.
Funding
This work was funded by the Italian Ministry of Economic Development (MISE) and the Ministry of Education, University and Research (MIUR), Contract number: PON03PE_00050_1.
Conflicts of Interest
The authors declare no conflict of interest.
Nomenclature
| Acronyms | |
| AC | alternating current |
| CEP | community energy provider |
| CHP | combined heat and power |
| CSP | community service provider |
| DC | direct current |
| DER | distributed energy resources |
| DRp | demand response program |
| ESS | energy storage system |
| ICES | integrated community energy system |
| ICT | information and communication technologies |
| IoE | internet of energy |
| IoM | internet of microgrids |
| IoT | internet of things |
| LEM | local electricity market |
| nGfHA | nanoGrid for home application |
| PCG | prosumer community group |
| PEI | power electrical interface |
| PUN | wWholesale purchasing price in the Italian Power Exchange (“Prezzo Unico Nazionale”). |
| PV | photovoltaic |
| PZ | zonal wholesale selling price in the Italian Power Exchange (“Prezzo Zonale”). |
| RES | renewable energy source |
| SEB | smart energy box |
| TOU | time-of-use (tariff) |
| TSO | transmission system operator |
| VPP | virtual power plant |
| Variables | |
| c | cost to import an electrical kWh from the grid |
| cs | cost to import an electrical kWh of surplus energy |
| cout | cost to import an electrical kWh for a prosumer outside the energy community |
| p | price to export an electrical kWh to the grid |
| pout | price to export an electrical kWh to the grid for a prosumer outside the energy community |
References
- Lawrence, M.; Vrins, J. Energy Cloud 4.0; Capturing Business Value through Disruptive Energy Platforms. Available online: https://www.navigantresearch.com/reports/energy-cloud-40 (accessed on 6 November 2019).
- Harmon, E.; Ozgur, U.; Cintuglu, M.H.; de Azevedo, R.; Akkaya, K.; Mohammed, O.A. The Internet of Microgrids: A Cloud-Based Framework for Wide Area Networked Microgrids. IEEE Trans. Ind. Inform. 2018, 14, 1262–1274. [Google Scholar] [CrossRef]
- Jin, X.; Wang, J.; Shen, X.; Wang, H.; Liu, R. An Overview of Virtual Power Plant Development from the Perspective of Market Participation. In Proceedings of the 2nd IEEE Conference on Energy Internet and Energy System Integration (EI2), Beijing, China, 20–22 October 2018. [Google Scholar]
- Orehounig, K.; Evins, R.; Dorer, V. Integration of decentralized energy systems in neighbourhoods using the energy hub approach. Appl. Energy 2015, 154, 277–289. [Google Scholar] [CrossRef]
- Pasban-Gajan, A.; Moeini-Aghtaie, M.; Parvini, Z.; Fotuhi-Firuzabad, M. Optimal scheduling of renewable-based energy hubs considering time-of-use pricing scheme. In Proceedings of the 2017 Smart Grid Conference (SGC), Tehran, Iran, 20–21 December 2017. [Google Scholar]
- Rathnayaka, A.J.D.; Potdar, V.M.; Dillon, T.; Hussain, O.; Kuruppu, S. Goal-Oriented Prosumer Community Groups for the Smart Grid. IEEE Technol. Soc. Mag. 2014, 33, 41–48. [Google Scholar] [CrossRef] [Green Version]
- Mirzania, P.; Ford, A.; Andrews, D.; Ofori, G.; Maidment, G. The Impact of Policy Changes: The Opportunities of Community Renewable Energy Projects in the UK and the Barriers they Face. Energy Policy 2019, 129, 1282–1296. [Google Scholar] [CrossRef]
- Koirala, B.P.; Koliou, E.; Friege, J.; Hakvoort, R.A.; Herder, P.M. Energetic communities for community energy: A review of key issues and trends shaping integrated community energy systems. Renew. Sustain. Energy Rev. 2016, 56, 722–744. [Google Scholar] [CrossRef] [Green Version]
- Herbes, C.; Brummer, V.; Rognli, J.; Blazejewski, S.; Gericke, N. Responding to policy change: New business models for renewable energy cooperatives—Barriers perceived by cooperatives’ members. Energy Policy 2017, 109, 82–95. [Google Scholar] [CrossRef]
- Engelken, M.; Römer, B.; Drescher, M.; Welpe, I.M.; Picot, A. Comparing drivers, barriers, and opportunities of business models for renewable energies: A review. Renew. Sustain. Energy Rev. 2016, 60, 795–809. [Google Scholar] [CrossRef]
- Bui, N.; Castellani, A.; Casari, P.; Zorzi, M. The Internet of Energy: A Web-Enabled Smart Grid System. IEEE Netw. 2012, 26, 39–45. [Google Scholar] [CrossRef]
- Mendes, G.; Ioakimidisa, C.; Ferrão, P. On the planning and analysis of Integrated Community Energy Systems: A review and survey of available tools. Renew. Sustain. Energy Rev. 2011, 15, 4836–4854. [Google Scholar] [CrossRef]
- Koirala, B.P.; Ávila, J.P.C.; Gómez, T.; Hakvoort, R.A.; Herder, P.M. Local Alternative for Energy Supply: Performance Assessment of Integrated Community Energy Systems. Energies 2016, 9, 981. [Google Scholar] [CrossRef]
- Koirala, B.P.; Hakvoort, R.A.; Ávila, J.P.C.; Gómez, T. Assessment of Integrated Community Energy Systems. In Proceedings of the 13th International Conference on the European Energy Market (EEM), Porto, Portugal, 6–9 June 2016. [Google Scholar]
- Xua, X.; Jinb, X.; Jiab, H.; Yub, X.; Lia, K. Hierarchical management for integrated community energy systems. Appl. Energy 2015, 160, 231–243. [Google Scholar] [CrossRef]
- Tounquet, F. Energy Communities in the European Union. Available online: https://asset-ec.eu/wp-content/uploads/2019/07/ASSET-Energy-Comminities-Revised-final-report.pdf (accessed on 30 November 2019).
- Belli, G.; Brusco, G.; Burgio, A.; Motta, M.; Menniti, D.; Pinnarelli, A.; Sorrentino, N. An energy management model for energetic communities of Smart Homes: The Power Cloud. In Proceedings of the 14th IEEE International Conference on Networking, Sensing and Control (ICNSC), Calabria, Italy, 16–18 May 2017. [Google Scholar]
- Baghaee, H.R.; Mirsalim, M.; Gharehpetan, G.B.; Talebi, H.A. Nonlinear Load Sharing and Voltage Compensation of Microgrids Based on Harmonic Power-Flow Calculations Using Radial Basis Function Neural Networks. IEEE Syst. J. 2018, 12, 2749–2759. [Google Scholar] [CrossRef]
- Baghaee, H.R.; Mirsalim, M.; Gharehpetan, G.B. Power Calculation Using RBF Neural Networks to Improve Power Sharing of Hierarchical Control Scheme in Multi-DER Microgrids. IEEE J. Emerg. Sel. Top. Power Electron. 2016, 4, 1217–1225. [Google Scholar] [CrossRef]
- Baghaee, H.R.; Mirsalim, M.; Gharehpetan, G.B. Real-time verification of new controller to improve small/large-signal stability and fault ride-through capability of multi-DER microgrids. IET Gener. Transm. Distrib. 2016, 10, 3068–3084. [Google Scholar] [CrossRef]
- Brusco, G.; Burgio, A.; Mendicino, L.; Menniti, D.; Motta, M.; Pinnarelli, A.; Sorrentino, N. A compact nanogrid with a behavior-tree control for islanded applications and remote areas. In Proceedings of the 15th IEEE International Conference on Networking, Sensing and Control (ICNSC), Zhuhai, China, 27–29 March 2018. [Google Scholar]
- Barone, G.; Burgio, A.; Menniti, D.; Motta, M.; Pinnarelli, A.; Sorrentino, N. Remote control of nanogrids: A cost-effective solution in a laboratory setup. In Proceedings of the 2017 IEEE International Conference on Environment and Electrical Engineering and 2017 IEEE Industrial and Commercial Power Systems Europe (EEEIC/I&CPS Europe), Milan, Italy, 6–9 June 2017. [Google Scholar]
- Brusco, G.; Barone, G.; Burgio, A.; Menniti, D.; Pinnarelli, A.; Scarcello, L.; Sorrentino, N. A Smartbox as a low-cost home automation solution for prosumers with a battery storage system in a demand response program. In Proceedings of the 16th IEEE International Conference on Environment and Electrical Engineering (EEEIC), Florence, Italy, 6–8 June 2016. [Google Scholar]
- Beraldi, P.; Violi, A.; Carrozzino, G.; Bruni, M.E. A Stochastic Programming Approach for the Optimal Management of Aggregated Distributed Energy Resources. Comput. Oper. Res. 2017, 96, 200–212. [Google Scholar] [CrossRef]
- Brusco, G.; Burgio, A.; Menniti, D.; Pinnarelli, A.; Sorrentino, N. Energy Management System for an Energy District with Demand Response Availability. IEEE Trans. Smart Grid 2014, 5, 2385–2393. [Google Scholar] [CrossRef]
- Giordano, A.; Mastroianni, C.; Menniti, D.; Pinnarelli, A.; Scarcello, L.; Sorrentino, N. A Two-Stage Approach for Efficient Power Sharing within Energy Districts. IEEE Trans. Syst. Man Cybern. 2019, 1–11. [Google Scholar] [CrossRef]
- Belli, G.; Giordano, A.; Mastroianni, C.; Menniti, D.; Pinnarelli, A.; Scarcello, L.; Sorrentino, N.; Stillo, M. A unified model for the optimal management of electrical and thermal equipment of a prosumer in a DR environment. IEEE Trans. Smart Grid 2019, 10, 1791–1800. [Google Scholar] [CrossRef]
- Burgio, A.; Giordano, A.; Manno, A.; Mastroianni, C.; Menniti, D.; Pinnarelli, A.; Scarcello, L.; Sorrentino, N.; Stillo, M. An IoT approach for Smart Energy districts. In Proceedings of the 14th IEEE International Conference on Networking, Sensing and Control (ICNSC), Calabria, Italy, 16–18 May 2017. [Google Scholar]
- Giordano, A.; Spezzano, G.; Vinci, A. Rainbow: An Intelligent Platform for Large- Scale Networked Cyber-Physical Systems. In Proceedings of the 5th International Workshop on Networks of Cooperating Objects for Smart Cities (UBICITEC), Berlin, Germany, 14 April 2014. [Google Scholar]
- Wooldridge, M. An Introduction to Multiagent Systems, 2nd ed.; John Wiley & Sons: Hoboken, NJ, USA, 2009. [Google Scholar]
- Su, K.; Li, J.; Fu, H. Smart city and the applications. In Proceedings of the 2011 International Conference on Electronics, Communications and Control (ICECC), Ningbo, China, 9–11 September 2011. [Google Scholar]
- Menniti, D.; Sorrentino, N.; Pinnarelli, A.; Burgio, A.; Brusco, G.; Belli, G. The concentrated solar power system with Stirling technology in a micro-grid: The simulation model. In Proceedings of the 2014 IEEE International Symposium on Power Electronics, Electrical Drives, Automation and Motion (SPEEDAM), Ischia, Italy, 11–13 June 2014. [Google Scholar]
- Brusco, G.; Burgio, A.; Menniti, D.; Pinnarelli, A.; Sorrentino, N.; Scarcello, L. An Energy Box in a Cloud-Based Architecture for Autonomous Demand Response of Prosumers and Prosumages. Electronics 2017, 6, 98. [Google Scholar] [CrossRef] [Green Version]
Figure 1.
Power Cloud configuration.

Figure 2.
NanoGrid for Home Application (nGfHA) configuration.

Figure 3.
Cloud framework.

Figure 4.
Interactions between Power Cloud members and the Community Energy Provider (CEP).

Figure 5.
Day-ahead SEB workflow.

Figure 6.
Architecture supporting the Power Cloud.

Figure 7.
Energy cloud configuration.

Figure 8.
Building.

Figure 9.
Scheme of the direct current (DC) microgrid.

Figure 10.
Room housing the DC microgrid.

Figure 11.
Smart energy box (SEB) information flow at Chiodo2.

Figure 12.
The load and production scheduling profile of Chiodo2 user.

Figure 13.
Prices on 27 October 2017.

Figure 14.
Energy Cloud profile for out-of-energy community, 1st-stage and 2nd-stage scenarios.

Figure 15.
Aggregated hourly costs (negative values) and revenues (positive values) for out-of-energy community, 1st-stage and 2nd-stage scenarios.
Figure 15.
Aggregated hourly costs (negative values) and revenues (positive values) for out-of-energy community, 1st-stage and 2nd-stage scenarios.

Figure 16.
Hourly revenues of the aggregator for 1st-stage and 2nd-stage scenarios.


Table 1.
User data of the Unical Energy Cloud.
| Plants (Rated Power) | Loads | Storage (Capacity) | ||||||||
|---|---|---|---|---|---|---|---|---|---|---|
| Users | Grid [kW] | PV [kW] | Gas Boiler [kW] | Heat Pump [kW] | Thermal Solar System [m2] | Non Schedulable | Schedulable | Thermal | Electrical [kWh] | Thermal [L] |
| Chiodo2 | 10 | 09.00 | - | 9 | - | Yes | Yes | Yes | 25 | 800 |
| Cubo44B | 30 | 31.36.00 | 20 | - | 10 | Yes | Yes | Yes | 25 | - |
| Orto Botanico | - | 472.50.00 | - | - | - | No | No | No | - | - |
| Cubo0B | 60 | 62.72 | - | - | - | Yes | Yes | No | - | - |
| Cubo0C-1C | 30 | 31.36.00 | - | - | - | Yes | Yes | No | - | - |
| Cubo12C-18B | 30 | 31.36.00 | - | - | - | Yes | No | No | - | - |
| Cubo15B | 30 | 31.36.00 | - | - | - | Yes | No | No | 25 | - |
| Cubo17B | 30 | 31.36.00 | - | - | - | Yes | No | No | 50 | - |
| Cubo31B | 30 | 31.36.00 | - | - | - | Yes | No | No | 75 | - |
| Cubo41C | 20 | - | - | - | - | Yes | No | No | 25 | - |
| Cubo1B-2B-3B-4B-5B | 20 | - | - | - | - | Yes | Yes | No | 75 | - |
| Cubo2C-3C-4C-5C-6C | 20 | - | - | - | - | Yes | No | No | 75 | - |
Table 2.
Costs (negative values) and revenues (positive values) for all prosumers, the aggregator and the whole energy district in out-of-energy community, 1st-stage and 2nd-stage scenarios.
Table 2.
Costs (negative values) and revenues (positive values) for all prosumers, the aggregator and the whole energy district in out-of-energy community, 1st-stage and 2nd-stage scenarios.
| Out of District | First Stage | Second Stage | |
|---|---|---|---|
| All prosumers | −89.00 | −69.03 | −65.38 |
| Aggregator | 0.00 | 37.62 | 38.28 |
| Energy district | −89.00 | −31.41 | −27.10 |
© 2019 by the authors. Licensee MDPI, Basel, Switzerland. This article is an open access article distributed under the terms and conditions of the Creative Commons Attribution (CC BY) license (http://creativecommons.org/licenses/by/4.0/).
Share and Cite
MDPI and ACS Style
Giordano, A.; Mastroianni, C.; Menniti, D.; Pinnarelli, A.; Sorrentino, N. An Energy Community Implementation: The Unical Energy Cloud. Electronics 2019, 8, 1517. https://doi.org/10.3390/electronics8121517
AMA Style
Giordano A, Mastroianni C, Menniti D, Pinnarelli A, Sorrentino N. An Energy Community Implementation: The Unical Energy Cloud. Electronics. 2019; 8(12):1517. https://doi.org/10.3390/electronics8121517
Chicago/Turabian StyleGiordano, Andrea, Carlo Mastroianni, Daniele Menniti, Anna Pinnarelli, and Nicola Sorrentino. 2019. "An Energy Community Implementation: The Unical Energy Cloud" Electronics 8, no. 12: 1517. https://doi.org/10.3390/electronics8121517
Note that from the first issue of 2016, this journal uses article numbers instead of page numbers. See further details here.