Article

Multi-Points Cooperative Relay in NOMA System with N-1 DF Relaying Nodes in HD/FD Mode for N User Equipments with Energy Harvesting

1
Faculty of Electrical Engineering and Computer Science, Technical University of Ostrava, 17. listopadu 2172/15, 708 33 Ostrava-Poruba, Czech Republic
2
Faculty of Electronics and Telecommunications, Sai Gon University, 220 Tran Binh Trong st., Dict. 5, Ho Chi Minh City, Vietnam
*
Author to whom correspondence should be addressed.
Electronics 2019, 8(2), 167; https://doi.org/10.3390/electronics8020167
Submission received: 14 December 2018 / Revised: 20 January 2019 / Accepted: 29 January 2019 / Published: 1 February 2019
(This article belongs to the Special Issue Recent Technical Developments in Energy-Efficient 5G Mobile Cells)

Abstract

:
Non-Orthogonal Multiple Access (NOMA) is the key technology promised to be applied in next-generation networks in the near future. In this study, we propose a multi-points cooperative relay (MPCR) NOMA model instead of just using a relay as in previous studies. Based on the channel state information (CSI), the base station (BS) selects a closest user equipment (UE) and sends a superposed signal to this UE as a first relay node. We have assumed that there are N UEs in the network and the N-th UE, which is farthest from BS, has the poorest quality signal transmitted from the BS compared the other UEs. The N-th UE received a forwarded signal from N 1 relaying nodes that are the UEs with better signal quality. At the i-th relaying node, it detects its own symbol by using successive interference cancellation (SIC) and will forward the superimposed signal to the next closest user, namely the ( i + 1 ) -th UE, and include an excess power which will use for energy harvesting (EH) intention at the next UE. By these, the farthest UE in network can be significantly improved. In addition, closed-form expressions of outage probability for users over both the Rayleigh and Nakagami-m fading channels are also presented. Analysis and simulation results performed by Matlab software, which are presented accurately and clearly, show that the effectiveness of our proposed model and this model will be consistent with the multi-access wireless network in the future.

1. Introduction

The next-generation network (5G) technology has the advantage of increasing system capacity by superior sharing-spectrum efficiency [1]. Therefore, multiple users in the network can be served in the same frequency band/time slot and various allocation power coefficients by the key technology is called Non-Orthogonal Multiple Access (NOMA). The is fundamentally different from previous orthogonal access methods, e.g., Orthogonal Multiple Access (OMA) [2]. In NOMA system, the users with better channel conditions are allocated less transmitting power coefficients. On the other hand, the users with worse channel conditions are allocated more transmitting power coefficients to guarantee the quality of service (QoS) for all users in the system. After receiving a superposed signal, successive interference cancellation (SIC) is done at the end users [3]. In [4], the authors investigated the impact of imperfect SIC on the analysis performance of NONA system. Their analysis results showed that even though SIC is not perfect, the performance of the NOMA system is still better than the orthogonal system. A down-link NOMA wireless network was studied in [5] by considering using a relay for forwarding signals to combat the fading effect of the transmission channel. Authors applied to dual-hop relaying systems with decode-and-forward (DF) or amplify-and-forward (AF) protocols [6]. Relay full-duplex (FD) model over the Rayleigh fading channels using the DF protocol investigated the performance by optimizing the transmit power factor [7]. The study impacts relay selection of cooperative NOMA on the performance system [8]. The authors in [9] proposed a novel best cooperative mechanism (BCM) for wireless EH and spectrum sharing in the 5G network. The [10,11,12] include AF and DF relaying. In [12], it showed that a dual-hop power line communication (PLC) system can improve the system capacity compared to direct-link (DL) transmission. And M. Rabie et al. [13] proposed using Multi-hop relay instead of using one hop relay or dual-hop relays. The authors investigated the energy efficiency over PLC channels with assuming log-normal fading. The studies [14,15] analyzed the system performance of multi-hop AF/DF relaying over PLC channels in terms of average bit error and ergodic capacity. These studies showed that the system performance can be improved by increasing the number of relaying. In addition, The authors in [8] studied the impact of relay selection (RS) on system performance. The compared results on two-stage versus max-min RS showed that cooperative NOMA system over Rayleigh fading channels with two-stage RS is better than the max-min one. We hypothesized that there are N users with the N-th user at the far end from BS with the worst channel condition. The QoS of the N-th user can be improved with the cooperation of N 1 users instead of just receiving only a relay cooperation. At each node, one must perform the best neighbor selection to forward the signal next neighbor. The best selection of neighbors is repeated until the signal reaches the destination.
In addition, we also consider EH at UEs. The explosion of the number of wireless devices, radio frequency (RF) EH becomes a potential technology to convert the energy of receiving wireless signal into electricity. Therefore, the MPCR is not only transmitting information but also delivering energy to the users. In Ref. [16,17,18], only users located close to BS can collect energy. This is because signal reception and energy collection cannot be done simultaneously. Thus, the users need to divide the received signal for EH and information decoding (ID) by using power splitting (PS) or time switching (TS) which was called “received TS” [19,20]. Though the PS approach has been shown to mostly outperform the receive-TS approach, however, the PS is complicated and inefficient for practical implementation. The research results have shown that PS is better than TS, however, PS is more complex and difficult to practical application than TS. In our study, we consider compressing both information and energy in one transmission phase instead of splitting it into two transmission phases as in previous studies. Furthermore, a user faraway from BS can still receive information and collect energy from the nearest relay node. Researchers have made important contributions to the 5G wireless multi-access network. Specially, L. Dai et al. [21] presented the introduction, development process, and recent research trends on NOMA, comprehensively. Because of the potential application of NOMA in the future, there have been many important research contributions [22,23,24,25,26,27,28,29]. These positive research results are motivations for other researchers to continue to study NOMA improvement.
In this study, we focus on MPCR in NOMA network to improve the QoS for the user faraway form BS with poor channel. In terms of contributions in this research, the main contributions include:
  • The first, this article proposes a down-link side NOMA network with random N UEs.
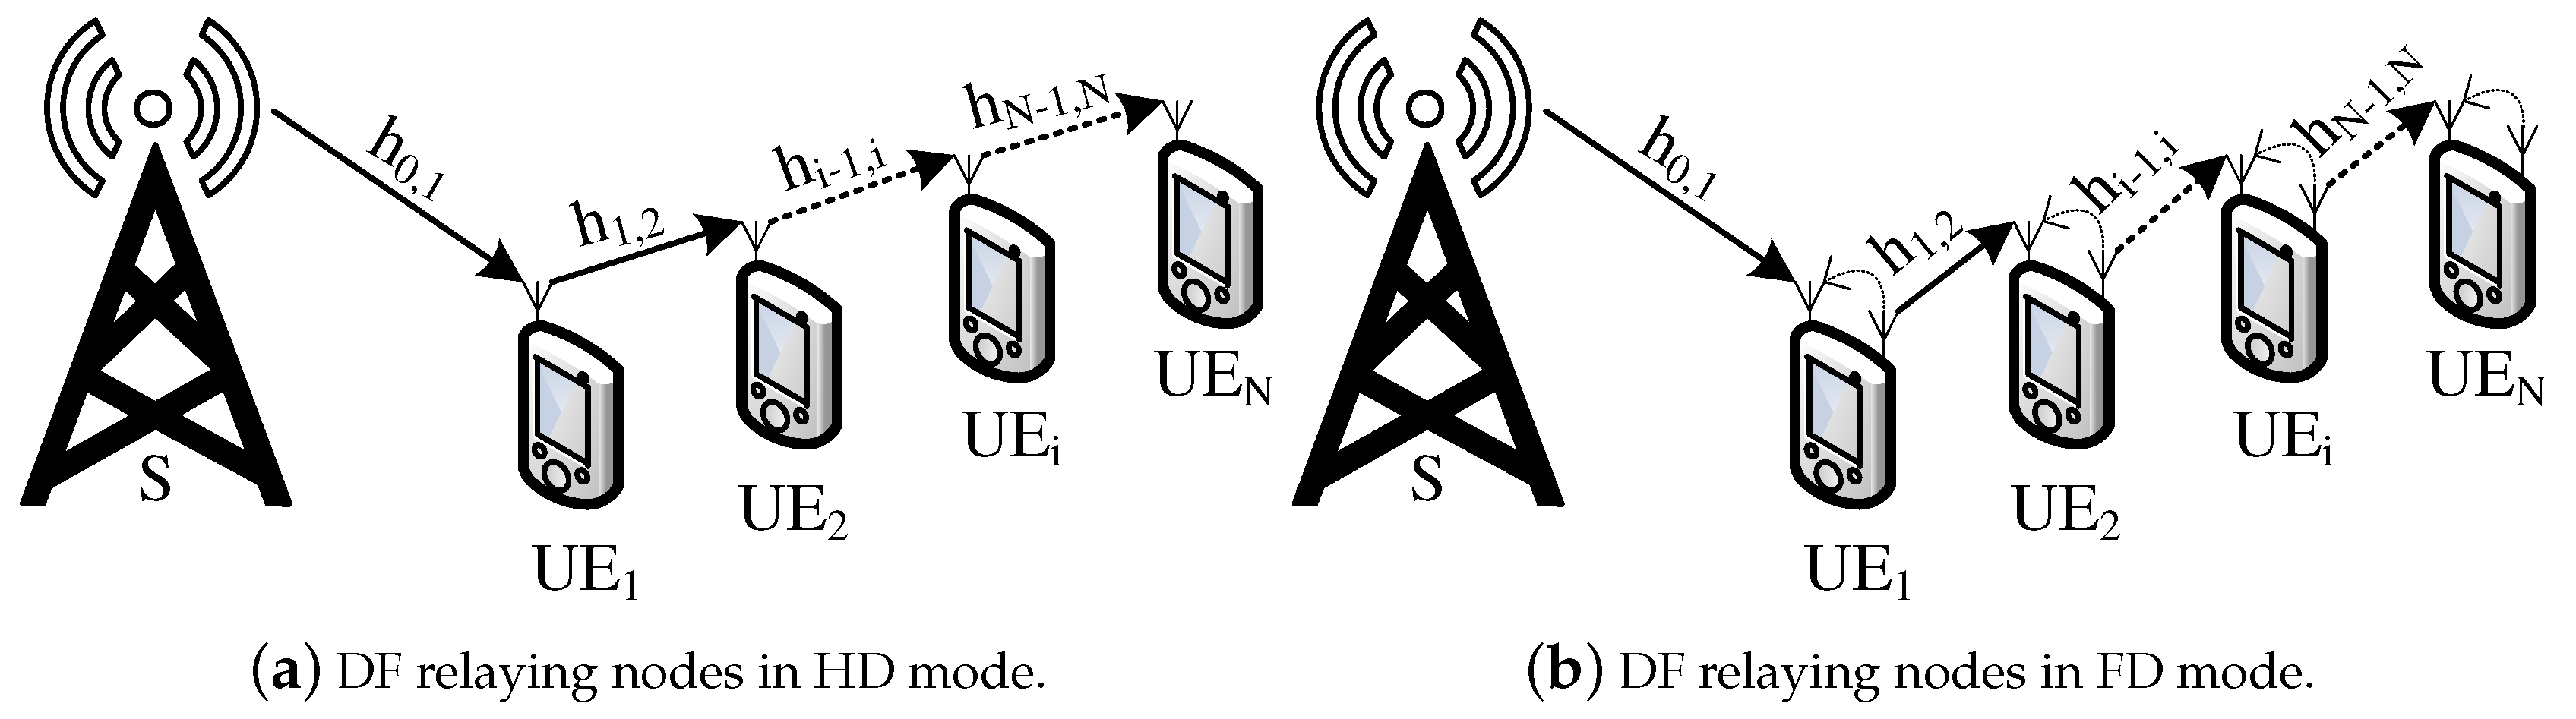
  • The next, the MPCR model is proposed to improve QoS for the Nth UE with farthest distance from BS among the others users by using N 1 UEs as DF relaying nodes in HD/FD mode. Each · U E i relaying node receives and forwards a superposed signal to next hop, namely U E i + 1 , which is nearest from U E i . This work will loop until the superposed signal is sent to last UE, namely U E N .
  • A algorithm for selecting relay nodes in MPCR is also presented clearly in next section.
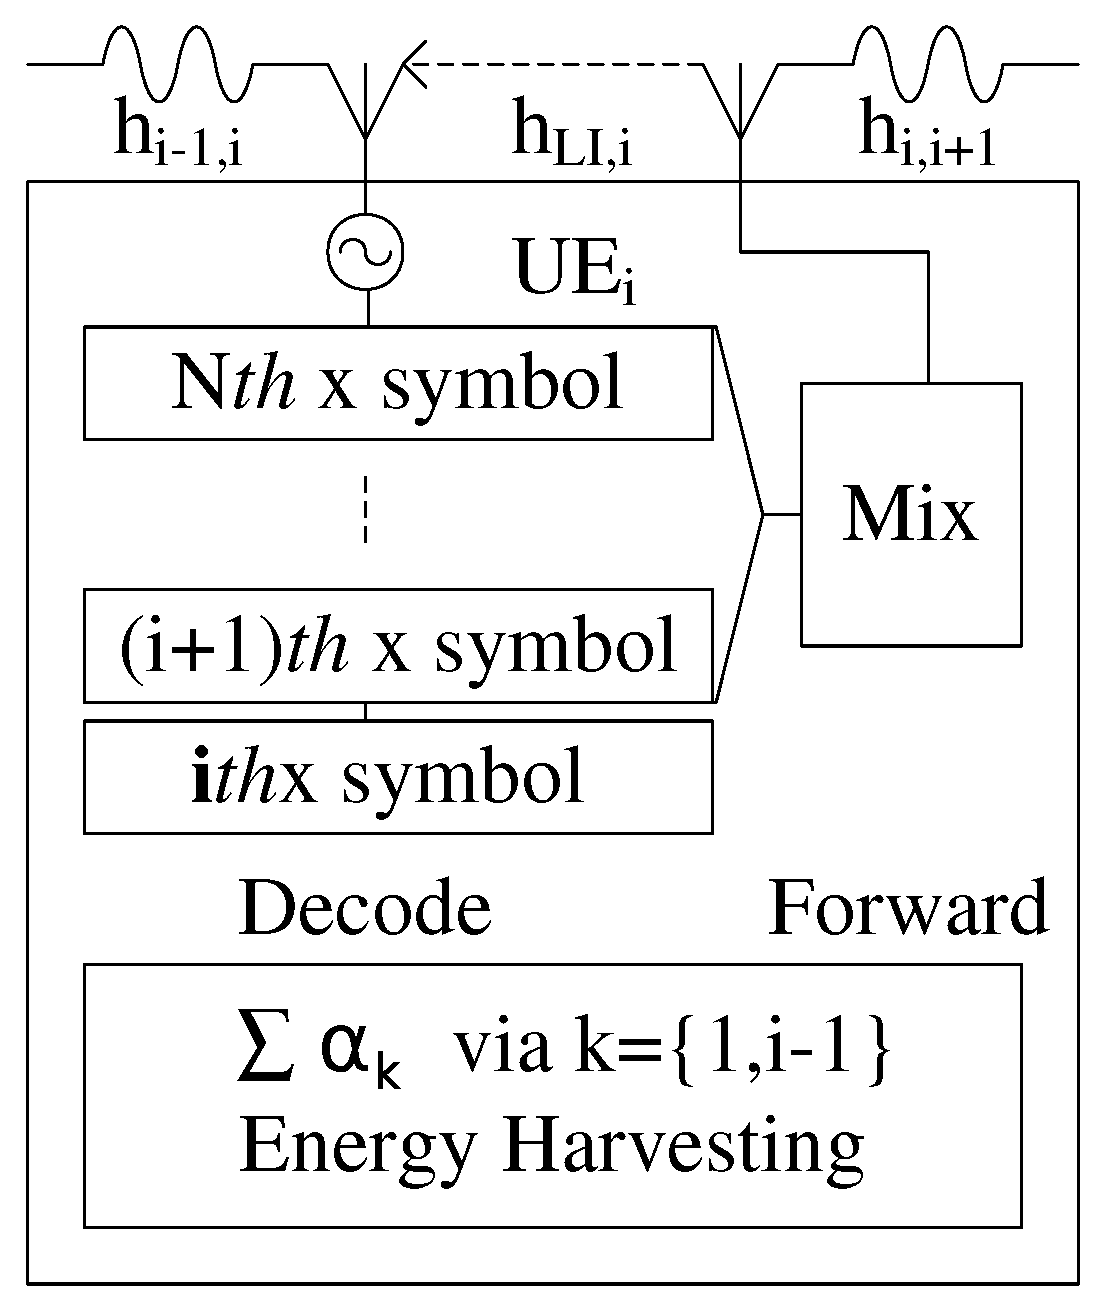
  • At U E i with i > 1 , the received signal has an excess power that is used for EH to charge the battery with assuming unlimited capacity of the battery.
  • In additional, this study investigates and finds an outage probability and system throughput for each UE, which are written in closed-form expressions.
  • Further, The analysis and simulation results are presented in a clear way by the Monte Carlo simulation ( 10 6 samples of channels) from the Matlab software to prove our propositions.
This article is presented as following. In the next section, namely Experimental Models, we propose system models and analyse two transmission scenarios which are called N 1 relaying nodes in HD or FD mode. In the third section, we have analyzed the system performance on outage probability and system throughput. In Section 4, we use Matlab software to simulate and results will also be presented in this section. A summary of the results of this study will be presented in Section 5.
Notice: In this study, we use a few notations included as
  • h a , b is a channel from source a to destination b.
  • α i is an allocation power coefficient for the i-th UE.
  • y i Ω is the received signal at the i-th UE with Ω protocol where Ω = H D , F D .
  • γ i x j Ω is a signal-to-interference-plus-noise-ratios (SINRs) at i-th UE while the i-th UE decodes x j symbol.
  • Pr . is a probability.
  • Θ i Ω or Θ i Ω is an outage probability of the i-th UE with Ω protocol over Rayleigh or Nakagami-m fading channels, respectively.
  • R i is a bit rate threshold of the i-th UE.

2. Experimental Models

In previous studies about NOMA, a direct down-link scenario is considered to serve a number of users in the same time slot. However, in such studies, there are usually a fixed number of users. Therefore, they have not shown the generality of the model. In order to ensure the generality, we have upgraded the model to a random and unpredictable number of users.

2.1. Direct Link Scenario

The authors analyzed different NOMA techniques including power domain and code domain [22]. The role of the power domain is proven to be important in determining the performance of the system through the availability of CSI [23]. The BS send a superposed signal S to all UEs in the same power domain and same time slot as following
S = P 0 j = 1 N α j x j .
Thus, the received signal at the i-th UE, i 1 , , N , would be expressed as following
y i D i r = h 0 , i P 0 j = 1 N α j x j + n i ,
where h 0 , i is denoted as the channels from BS to each the i-th UE over Rayleigh or Nakagami-m fading channel. Furthermore, N is a random number of UEs joined to network, α j in rule with j = 1 N α j = 1 is an allocation power coefficient for each UE and P 0 is the transmission power of BS. n i is denoted as the additive white Gaussian noise (AWGN) of the i-th UE, where n i C N 0 , N 0 with zero mean, variance N 0 and i 1 , , N .
It is important to notice that the channel coefficient from BS to each UE, in paired, is expressed as h 0 , i in our expressions.
In direct link scenario, the first user in the nearest distance from the BS with the strongest channel conditions was ordered first in the channel gain list. Furthermore, the list is in decreasing order as following
h 0 , 1 > h 0 , 2 > > h 0 , i > > h 0 , N 1 > h 0 , N .
According to the NOMA theory, users with the worst signal quality should be given priority to allocate the highest transmitting power factor. Another assumption in terms of the NOMA characteristics, we have assumed that the BS already owns the CSI of all UEs fully. In a previous study [30], the authors considered that CSI is available to the system and used to determine the decoding order of user’s data. The authors in [31] studied how NOMA performance depends on power allocation techniques to ensure fairness for users under instantaneous CSI and average CSI. The superimposed signals are sent to the UEs in the same power domain with different power coefficients, in the hope of ensuring system performance and ensuring service quality fairness for all users. Therefore, the list of allocation power factors is arranged in descending order for each UE in the network as
α 1 < α 2 < < α i < < α N 1 < α N .
In Figure 1, the U E N is farthest from the BS. Thus, the x N symbol is allocated the strongest power factor. Therefore, x N symbol will be first decoded at all UEs in the network by applying SIC [3]. Furthermore, the order of decoding is done sequentially according to the reversed list of power factor allocations presented in (4) expression. The Signal-to-interference-plus-noise ratios (SINRs) of all UEs have been expressed as
γ i x j D i r = h 0 , i 2 ρ 0 α j h 0 , i 2 ρ 0 k = 1 j 1 α k + 1 ,
where i 1 , , N and j N , , i .
In a special case at the U E 1 , after it decoded x j symbols with j { N , , 2 } by using (5), U E 1 decodes its own symbol x 1 with only AWGN n 1 as
γ 1 x 1 D i r = h 0 , 1 2 ρ 0 α 1 .
Furthermore, ρ 0 in (5) or (6) is signal-to-noise ratio (SNR) which can be calculated by
ρ i = P i N 0 ,
where i 0 , , N 1 , e.g., ρ 0 = P 0 / N 0 with P 0 is the transmitting power of the BS.
The achievable instantaneous bit rate of the i-th UE when it decodes x j symbol with x j x N , , x i is shown by
R i x j D i r = 1 2 log 2 1 + γ i x j D i r ,
where i 1 , , N and j N , , i . If i j 1 , and γ i x j D i r is given by (5) then. Else if i = j = 1 , and γ i x j D i r is given by (6) then.

2.2. N 1 DF Relaying Nodes Scenario

On the other hand, the system model in [13] has only one relaying to improve the QoS of UEs which are faraway from the BS. We propose a improved model with using a MPCR model instead of using only one user as a relay device. See in Figure 1, there are N users in the network with descending order channel conditions with the N-th UE has the poorest signal compared to the other UEs. The Figure 1a,b are N 1 HD relaying nodes model and N 1 FD relaying nodes models, respectively. In FD mode, the relays are impacted by the loop interference channels, which themselves affected the system’s performance. This study investigates the system performance on MPCR in HD or FD mode for N users over Rayleigh or Nakagami-m fading channels. Previous studies on the NOMA system used a cooperative relay to improve system performance compared to a direct transmission system. The contributions of previous studies [30,31,32] are the motivation for this research to continue to improve system performance.
Z. Ding et al. [8] proposed the relay selection method to choose the best relay with the best channel condition by using two-stage relay selection protocol which outperforms versus max-min relay selection protocol. There is a difference compared model in [8] versus our model. The authors consider selection a best relay in N relays to serve for two other users [8]. In our proposed model, Figure 1, all of the N 1 UEs can be selected for relaying node. A selected relay node set is initialized empty ϖ = , and a first relaying node can be selected by
ϖ 1 = max R i x 1 Ω > R 1 ,
where R i x 1 Ω is given by (22), and ϖ 1 has been added into ϖ = ϖ ϖ 1 then.
BS sends a superposed signal to the closest distance user with strongest channel condition, namely U E 1 in the Figure 1a,b, after BS selected U E 1 as a relay successfully. It is important to point out the difference. In this study, each relay node has a single or a twin antenna and works in HD or FD mode.
The received signals at the U E 1 in HD or FD mode are respectively the same like (2) or (10) as
y 1 F D = h 0 , 1 P 0 j = 1 N α j x j + h L I , 1 P 0 x ˜ 1 + n 1 ,
where h L I , 1 is the loop interference channel generated by the itself transmitter antenna, and n 1 is the AWGN noise of the device U E 1 .
In case the U E 1 is working in HD relaying mode, U E 1 decodes its own symbol by applying (5) and (6), respectively. On the other hand, the U E 1 is working in FD relaying mode, U E 1 decodes x j symbol with j N , , 2 or j = 1 by applying SINRs in (11a) or (11b), respectively,
γ 1 x j F D = Δ h 0 , 1 2 ρ 0 α j h 0 , 1 2 ρ 0 k = 1 j 1 α k + h L I , 1 2 ρ 1 + 1
= h 0 , 1 2 ρ 0 α 1 h L I , 1 2 ρ 1 + 1 .
Then, the U E 1 sends a mixed signal, namely S 1 in (13), to the next UE which is next nearest relay node, namely U E 2 . The second relay node can be selected by applying (9) as
ϖ 2 = max R i x 2 Ω > R 2 , i = 1 , , N , i ϖ ,
where R i Ω is also given by (22) and not being contained in ϖ set which is a selected relay nodes set. We removed U E i with i ϖ from the relays selection because the signal could be sent back to the previous relay node and the superposed signal is unable to send to the U E N . Furthermore, the ϖ 2 is also added into ϖ then. Note that the nearest neighbor represented in [33,34] are neighbors closest to the BS. However, the authors in [35] have extended the definition of nearest neighbor as the device can set up the transmission channel in the best condition compared to the other devices.
A mixed signal is sent to the next relay node as expressed
S 1 = P 1 α 1 x + j = 2 N α j x j ,
where x is an empty information symbol which was also namely x 1 decoded at the U E 1 .
The received signals at the U E 2 in both HD and FD relaying modes are expressed as, respectively,
y 2 H D = h 1 , 2 P 1 α 1 x + j = 2 N α j x j + n 2 ,
and
y 2 F D = h 1 , 2 P 1 α 1 x + j = 2 N α j x j + h L I , 2 P 2 x ˜ 2 + n 2 ,
where h 1 , 2 is the channel from U E 1 to U E 2 , P 1 is denoted as transmitting power at U E 1 , and h L I , 2 is loop interference channel from transmitting antenna to receiving one at U E 2 . Specially, the x 1 symbol existed in (2) and (10) but it was replaced by x symbol in (14) and (15). Because x 1 was previously decoded and removed from the mixed signal by U E 1 . Therefore, the x symbol does not contain information and becomes a redundancy in the mixed signal. This paper will use excess power of x symbol for EH purposes as is described in the next section.
The SINRs for decoding x j symbol and its own x 2 symbol at U E 2 in both HD and FD relaying modes can be expressed, respectively, as following
γ 2 x j H D = Δ h 1 , 2 2 ρ 1 α j h 1 , 2 2 ρ 1 k = 2 j 1 α k + 1
= h 1 , 2 2 ρ 1 α 2 ,
and
γ 2 x j F D = Δ h 1 , 2 2 ρ 1 α j h 1 , 2 2 ρ 1 k = 2 j 1 α k + h L I , 2 2 ρ 2 + 1
= h 1 , 2 2 ρ 1 α 2 h L I , 2 2 ρ 2 + 1 ,
where (16a) and (17a) with j N , , 3 , or (16b) and (17b) with j = 2 .
After U E 2 decoded its own symbol, it selects a next relay node and sends a new superposed signal to next nearest UE, namely U E 3 . This work will loop until a superposed signal is sent to the farthest UE, namely U E N in Figure 1.
Proposition 1.
In this study, we propose a EH model to use excess power in the mixed signals for purposing EH as Figure 2. As expressing in (18) and (19), the received signals at the i-th UE, where i 2 , , N , have an empty x symbol with no information. Thus, the transmit power coefficients of each empty symbol can be harvested. In previous studies, the power for EH was transmitted to users on different time slots or on different antennas on the receivers. However, in this study, we use only one antenna for receiving both signals and energy from the transmitter.
In general, the received signals at the U E i in both HD and FD relaying nodes can be rewritten by, respectively
y i H D = h i 1 , i P i 1 l = 1 i 1 α l x + k = i N α k x k + n i ,
and
y i F D = h i 1 , i P i 1 l = 1 i 1 α l x + k = i N α k x k + h L I , i P i x ˜ i + n i ,
where y i H D and y i F D are denoted as receiving signals at the U E i node, h i 1 , i is the channel from previous node to current node, P i 1 and P i are transmitting power of previous UE and current UE, respectively. It is important to notice that l = 1 i 1 α l + k = i N α k = 1 .
The SINRs of each the i-th UE relaying node for detecting x j symbol in HD and FD modes are expressed as, respectively
γ i x j H D = Δ h i 1 , i 2 ρ i 1 α j h i 1 , i 2 ρ i 1 k = i j 1 α k + 1 ,
= h i 1 , i 2 ρ i 1 α i ,
and
γ i x j F D = Δ h i 1 , i 2 ρ i 1 α j h i 1 , i 2 ρ i 1 k = i j 1 α k + h L I , i 2 ρ i + 1 ,
= h i 1 , i 2 ρ i 1 α i h L I , i 2 ρ i + 1 ,
where both (20a) and (21a) are with i 1 , , N and j N , , i + 1 . Furthermore, both (20b) and (21b) are with i = j .
In NOMA theory, reachable instantaneous bit rate can be calculated by
R i x j Ω = 1 2 log 2 1 + γ i x j Ω ,
where Ω = H D , F D , i 1 , , N , and j N , , i . If i j , and γ i x j Ω is given by (20a) or (21a) then. Else if i = j , and γ i x j Ω is given by (20b) or (21b) then.
A selected relay node can be performed by
ϖ i = max R i x j Ω > R j , i 1 , , N , i ϖ .
Furthermore, a selected relay nodes set ϖ after the signal has been sent to the U E N included
ϖ = ϖ 1 ϖ 2 ϖ N 1 .

3. The System Performance Analysis

In this section, we evaluate the performance of the system that we have proposed based on outage probability and system throughput, in order.

3.1. Outage Probability

In terms of investigating outage probability, the outage probability is defined as the occurrence of the stop transmitting event if any instantaneous bit rate in (8) or (22) cannot reach minimum bit rate thresholds.
The probability density function (PDF) and cumulative distribution function (CDF) of Rayleigh distribution are shown by, respectively,
f h a , b 2 x = 1 σ a , b 2 e x σ a , b 2 d x ,
and
F h a , b 2 x = 1 e x σ a , b 2 ,
where h a , b 2 are random independent variables namely x in PDF and CDF, respectively, with a and b are source and destination of channels, and σ a , b 2 is mean of channel with σ a , b 2 = E h a , b 2 .
In general, the PDF and CDF over nakagami-m fading channels can be expressed, respectively,
f h a , b 2 x = m σ a , b 2 m x m 1 Γ m e m x σ a , b 2 ,
and
F h a , b 2 ( x ) = γ m , m x σ a , b 2 Γ m = 1 e m x σ a , b 2 j = 0 m 1 m x σ a , b 2 j 1 j ! .
In direct link scenario, outage event occurs if U E i , where i 1 , , N , cannot decode x j symbol, where j N , , i . The outage probability for each of the joining UE in NOMA system is expressed as
Θ i D i r = 1 j = N i Pr R i x j D i r > R j .
where R i x j D i r is given by (8) and R j is bit rate threshold of U E j .
By applying the CDF in (25) and (27), the (29) is solved and it can be rewritten in closed-form as
Θ i D i r = 1 j = N i e R j χ j ρ 0 σ 0 , i 2 ,
and
Θ i D i r = 1 j = N i m σ 0 , i 2 m m σ 0 , i 2 m Γ m + R j χ j ρ 0 m m R j χ j ρ 0 σ 0 , i 2 m Γ m , m R j χ j ρ 0 σ 0 , i 2 Γ m Γ m ,
where Γ . and Γ . , . are gamma function and gamma incomplete function, respectively. Furthermore, R j = 2 2 R j 1 . It is important to notice that (30) and (31) are with the users over Rayleigh and Nakagami-m fading channels, respectively. In addition, χ j in both (30) and (31) is given by
χ j = Δ α j R j k = 1 j 1 α k
χ j = α 1 ,
where (32a) is with i , and j N , , 2 then. Furthermore, Equation (32b) is with i = j = 1 then.
Remark 1.
Base on the proposed model with N 1 relaying nodes as in Figure 1, this study investigates the outage probabilities of N UE nodes in both HD and FD modes as
Θ i Ω = 1 l = 1 i 1 Pr R l x i Ω > R i η a n d 1 j = N i Pr R i x j Ω > R j μ ,
where η is the successful probability to detect x i symbol at previous UEs and μ is the successful probability to detect x j symbol at the i-th UE. In a special case of the i-th UE with i = 1 , It is important to notice that η in (33) is equal with zero and the (33) becomes the same with (29). In (33), η and μ are also solved by applying the CDF and gotten closed-form outage probability of each UE node over Rayleigh fading channel on both HD and FD modes as, respectively,
Θ i H D = 1 l = 1 i 1 e R i ψ i ρ l 1 σ l 1 , l 2 η A 1 1 j = N i e R j χ j ρ i σ i 1 , i 2 μ A 2 ,
and
Θ i F D = 1 l = 1 i 1 e R i ψ i ρ l 1 σ l 1 , l 2 ψ i ρ l 1 σ l 1 , l 2 ψ i ρ l 1 σ l 1 , l 2 + R i ρ l σ h L I , l 2 η B 1 1 j = N i e R j χ j ρ i 1 σ i 1 , i 2 χ j ρ i 1 σ i 1 , i 2 χ j ρ i 1 σ i 1 , i 2 + R j ρ i σ L I , i 2 μ B 2 .
To be clearer, here is some information that should be clearly explained. We denoted Θ i Ω , where i 1 , , N and Ω = H D , F D , is the outage probability of U E i over Rayleigh fading channels. The η symbol in both (34) and (35) is the successful detected x i symbol at U E l probability with l 1 , , i 1 . Similarly, the μ symbol in both (34) and (35) is the successful detected x j symbol with j N , , i at the U E i . Here are two cases such as:
  • First case with i = 1 , η = 0 in both (34) and (35) then. Furthermore, the outage probability of the U E 1 in HD/FD mode is Θ i Ω = A 2 , B 2 .
  • In addition, second case with i > 1 , the (34) and (35) are with Θ i Ω = A 1 . B 1 , A 2 . B 2 .
In only the second case: ψ i in both (34) and (35) is given by
Ψ i = α i R i k = l i 1 α k .
In both cases: χ j is given by (32a) or (32b) after it has been rewritten as following, respectively,
χ j = Δ α j R j k = i j 1 α k χ j = α i
Remark 2.
The presented results of the studies [8,36] have firmly contributed to the role of NOMA system over the Rayleigh fading channels. However, studies on the NOMAn system over the Nakagami-m fading channels have received little attention because of its complexity. Therefore, we investigate the outage probability of each UE over Nakagami-m fading channels with m = 2 on both N 1 HD/FD relaying nodes. Furthermore, the (33) can be solved by applying the PDF in (27) which is expressed in closed-form, respectively, as this research contributes.
Θ i H D , m = 2 = 1 l = 1 i 1 e 2 R i ψ i ρ l 1 σ l 1 , l 2 2 R i + ψ i ρ l 1 σ l 1 , l 2 ψ i ρ l 1 σ l 1 , l 2 η C 1 1 j = N i e 2 R j χ j ρ i 1 σ i 1 , i 2 2 R j + χ j ρ i 1 σ i 1 , i 2 χ j ρ i 1 σ i 1 , i 2 μ C 2 ,
and
Θ i F D , m = 2 = 1 l = 1 i 1 e 2 R i ψ i ρ l 1 σ l 1 , l 2 ψ i ρ l 1 σ l 1 , l 2 ψ i ρ l 1 σ l 1 , l 2 ψ i ρ l 1 σ l 1 , l 2 + 2 R i + ρ l σ L I , l 2 R i 3 ψ i ρ l 1 σ l 1 , l 2 + 2 R i ψ i ρ l 1 σ l 1 , l 2 + ρ l σ L I , l 2 R i 3 η D 1 1 j = N i e 2 R i χ j ρ i 1 σ i 1 , i 2 χ j ρ i 1 σ i 1 , i 2 χ j ρ i 1 σ i 1 , i 2 χ j ρ i 1 σ i 1 , i 2 + 2 R j + ρ i σ L I , i 2 R j 3 χ j ρ i 1 σ i 1 , i 2 + 2 R j χ j ρ i 1 σ i 1 , i 2 + ρ i σ L I , i 2 R j 3 μ D 2 .
There have been two cases described above. It is not necessary to represent these cases. The analysis results will be presented in the next section. See Appendix A for proofing of remarks.

3.2. System Throughput

The total achievable received data rate at U E i , which is denoted as system throughput P s u m Ω , is the sum of throughput results of all UEs in system shown by
P s u m Ω = i = 1 N P i Ω = i = 1 N 1 Θ i Ω R i .

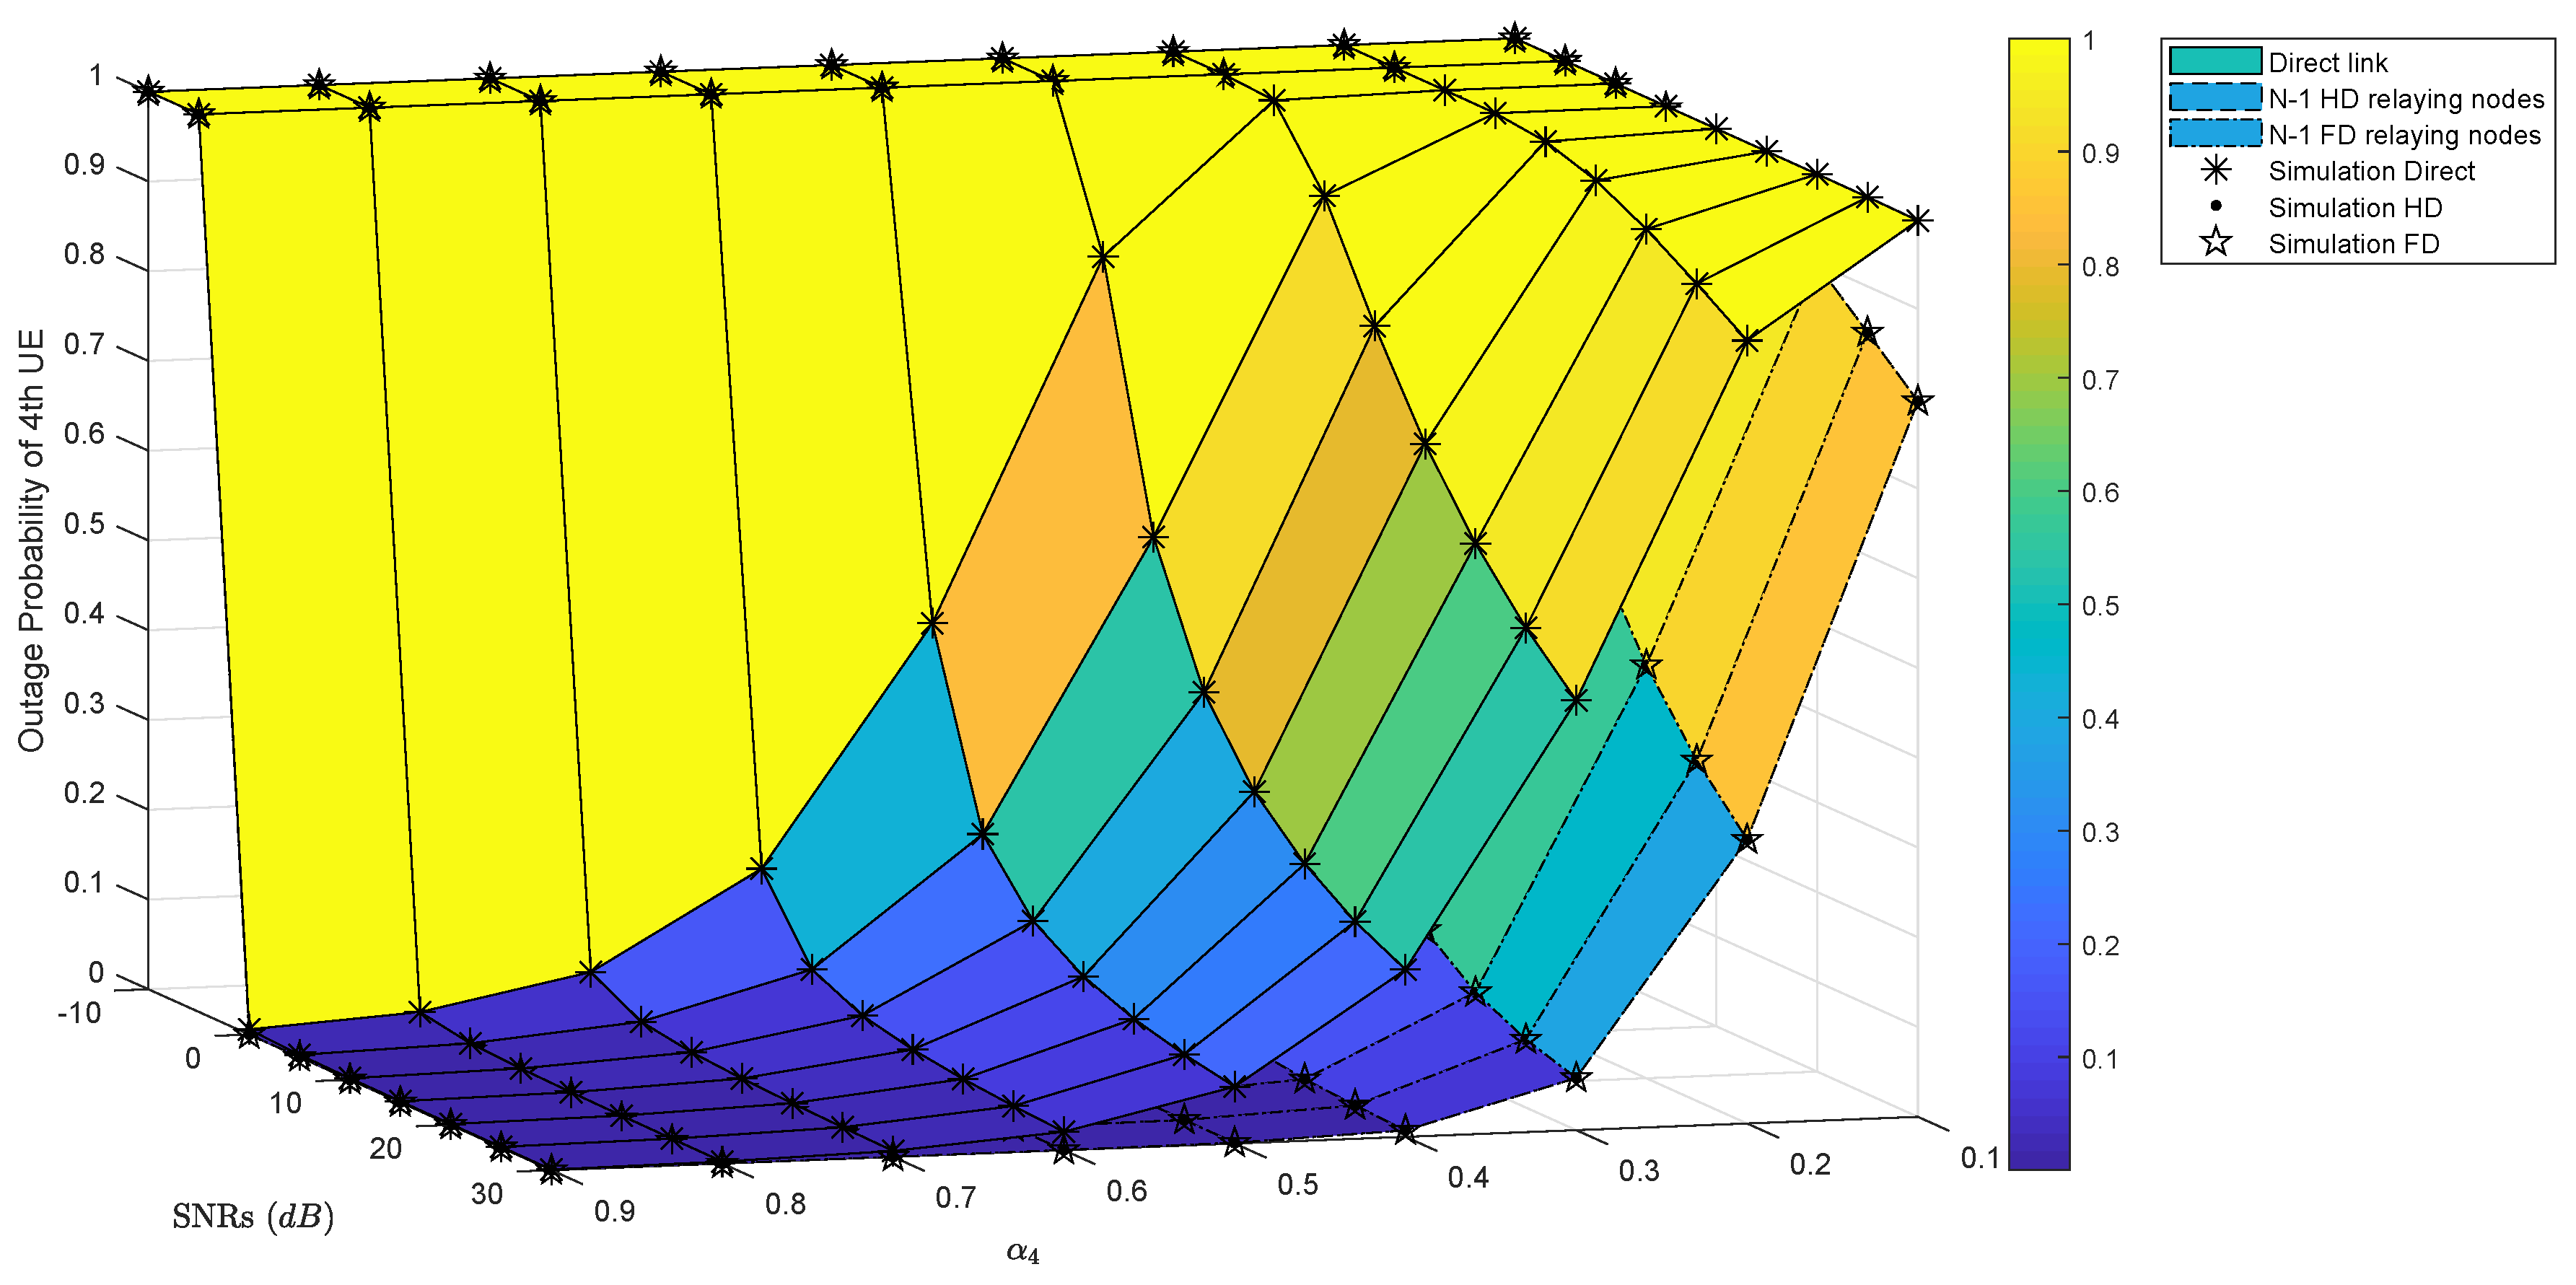
3.3. A Proposal for Energy Harvesting

Proposition 2.
In (18) and (19), the received signals at U E i , with i > 1 , include two parts which are x k data symbol and x empty symbol where k i , , N and l 1 , , i 1 . The x does not contain information. Therefore, we proposed collecting the energy of allocating power coefficient of the x symbol for charging the battery. Another assumption is that the battery is not limited by capacity. Thus, the EH for each UE in both HD and FD scenarios are expressed by, respectively
E H i = ξ l = 1 i 1 α l ρ i 1 h i 1 , i 2 ,
where i 2 , , N and ξ is collection coefficient.

3.4. A Proposed Algorithm for N 1 Relaying Nodes

Proposition 3.
In this section, an algorithm for processing with N 1 relaying nodes as shown in Figure 1 is proposed. The treatment flow is done in the waterfall pattern in the order shown in Figure 2.
1. 
Generate a random N UEs in the network with N channels from BS to UEs.
2. 
Creating a list of channels in descending order with the element at the top of the list is the best channel. Upon completion of the arrangement, BS will know which user is best chosen to use for first hop relaying node.
3. 
Through the results of the analysis [30], the authors have found that the performance of the NOMA system depends on the efficiency of the power allocation and the selection of the bit rate threshold, accordingly. Lack of CSI may affect the performance of the NOMA system. We have assumed that at BS and at each UE, there is full CSI of the UEs. Based on ordering of SCI as shown in (3), allocate the power coefficients and select the bit rate threshold for the UEs as, respectively
α i = min σ 0 , j 2 k = i N σ 0 , k 2 ,
and
R i = max σ 0 , i 2 k = i N σ 0 , k 2 ,
where in ordering and paring i 1 , , N and j N , , 1 . After the BS allocates the transmit power factor to the UEs, logically, a superposed signal will be sent to the nearest UE which is selected as the first hop relaying node, namely U E 1 .
4. 
The U E 1 receives and decodes x j symbol with j N , , i by (20a)–(21b), and excess power is collected by the UE for recharging. The U E 1 will select a next relay node by (23) and send a superposed signal as (18) or (19) to next hop relaying node after U E 1 detects its own symbol, namely x 1 , successfully. This work (step 4) will be repeated until the superposed signal will be transmitted to the last UE, namely U E N in model. The outage probability will occur when x j , where j N , , i , cannot be detected successfully at U E i with i 1 , , N .

4. Numerical Results and Discussion

It is important to announce that all of our analysis results are simulated by the Matlab software and are presented accurately and clearly. We undertake no reproduction of any prior research results. Furthermore, this study does not use any given data set, channels were generated randomly during the simulation of a rule. e.g., if there are random N users, the random channels are arranged according to the rule h 0 , 1 > h 0 , 2 > > h 0 , i > > h 0 , N 1 > h 0 , N and the corresponding channel coefficients 1 / 1 > 1 / 2 > > 1 / i > > 1 / ( N 1 ) > 1 / N .
For the results to be clear and accurate, we have performed the Monte Carlo simulation with 10 6 random samples of each h a , b channel.

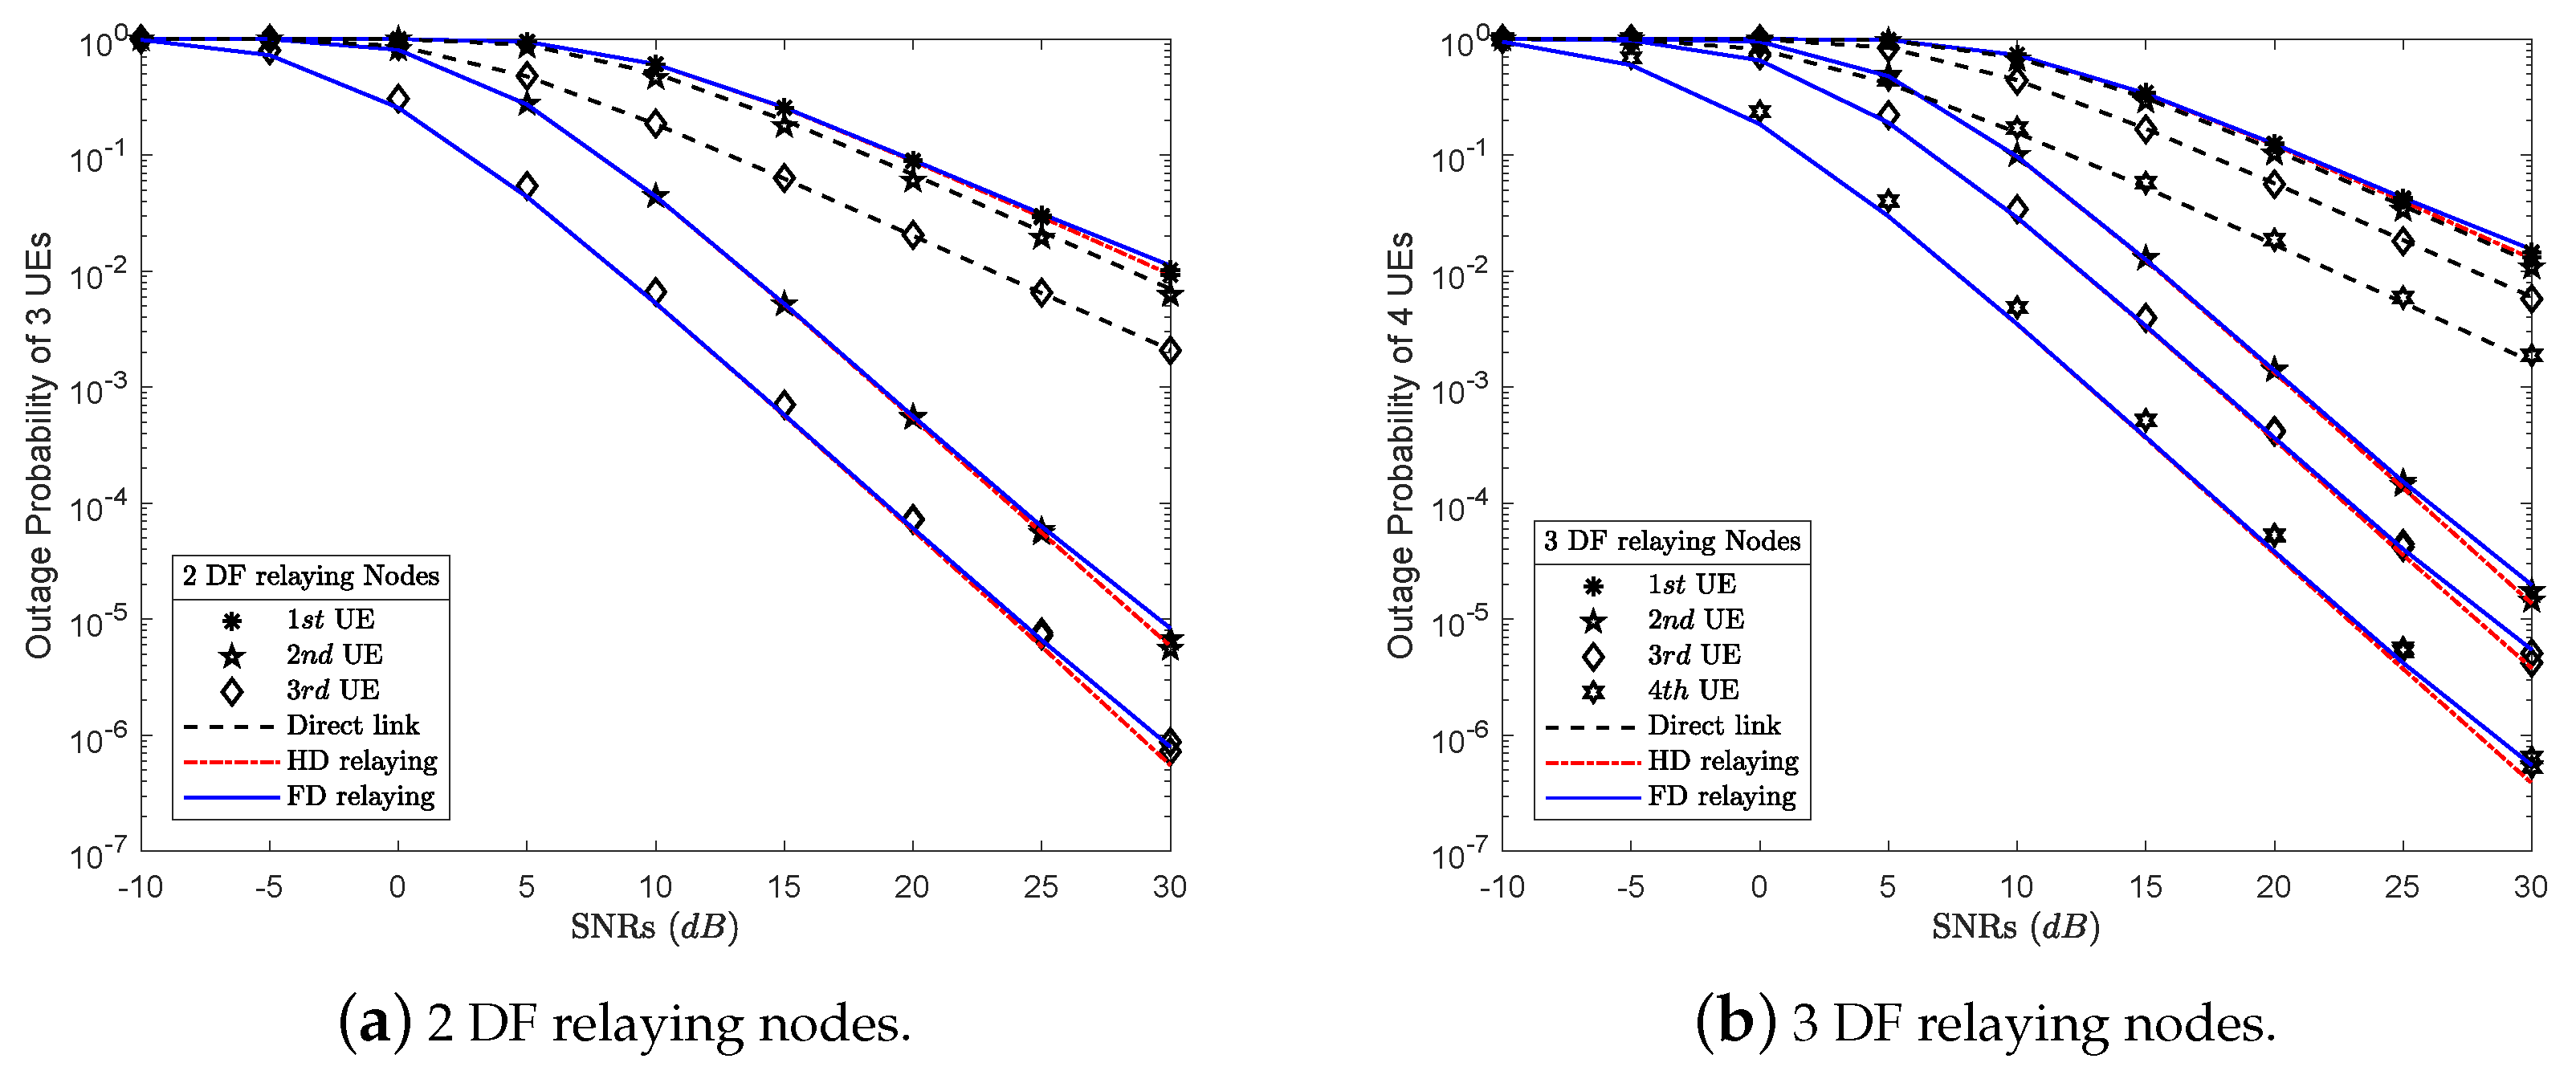
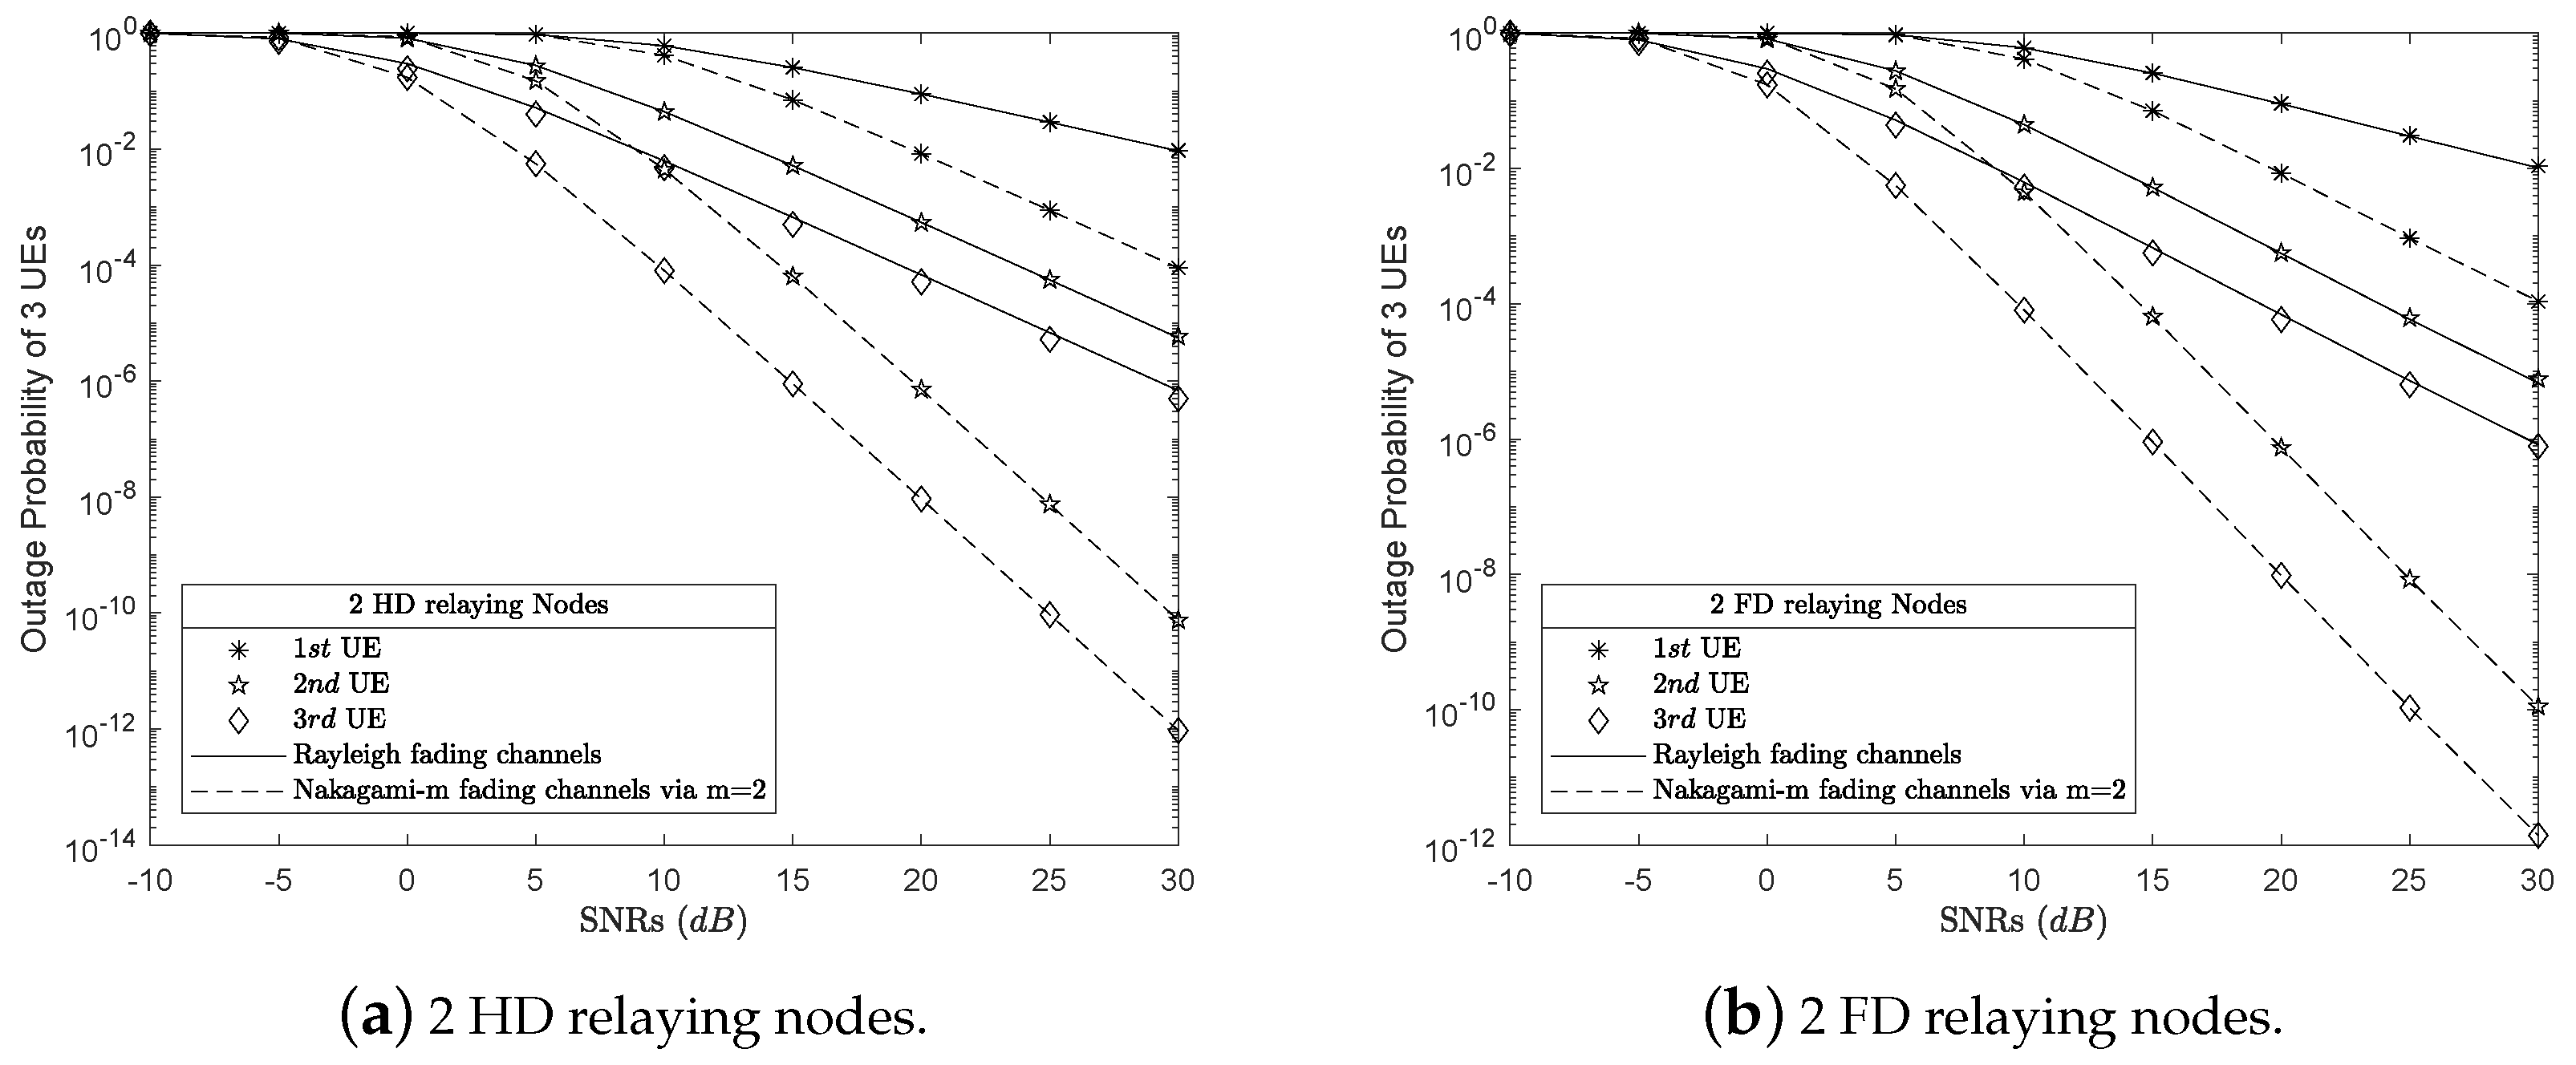
4.1. Numerical Results and Discussion for Outage Probability

It is important to note that the outage probability results of Dir, HD and FD scenarios are presented by black dashed lines, red dash-dot lines, and blue solid lines, respectively, as shown in Figure 3a,b. In the first case, we assume that there are only three users connected in the network at t-th time slot. We analyzed the performance of the system based on the outage probability of each user in three different scenarios such as Dir, HD and FD schemes. There are some simulation parameters, e.g., the channel coefficients h 0 , 1 = 1 , h 0 , 2 = 1 / 2 , and h 0 , 3 = 1 / 3 are in accordance with the earlier presented assumptions. Based on the transmission channel coefficients of the users, we can allocate power factors for the users U E 1 , U E 2 , and U E 3 with α 1 = 0.1818 , α 2 = 0.2727 , α 3 = 0.5455 , respectively, with i = 1 3 α i = 1 by applying (42). Because the third user, namely U E 3 , has the poorest signal quality, it is prioritized to allocate the biggest power factor among the users. Our analysis results showed that users who are far from BS with poor signal quality have better results, e.g., the outage probability results of the U E 2 and the U E 3 are better than the U E 1 , although their signal qualities are weaker than the first one. In addition, Figure 3a showed that U E 3 has the outage probability results which were marked with diamond marker, which are the best results compared to the other ones, although U E 3 has the weakest signal quality h 0 , 3 = 1 / 3 . Because U E 3 receives cooperation from the other UEs, the U E 3 ’s QoS has been improved and is better than the other ones. These results demonstrate the effectiveness of the proposed MPCR model. In addition, the outage probability results of the first user, namely U E 1 , has worse results than the other UEs, and U 1 ’s outage probability results approximate to each other in all three scenarios, namely Dir, HD and FD relaying scenarios. The U E 1 with the strongest channel coefficient h 0 , 1 = 1 has been allocated the worst power coefficient α 1 = 0.1818 compared to the others. A previous study of FD relay [37,38] and the results of comparison between FD and HD [27] showed that the outage probability results of the relaying in FD mode was worse than the HD one. There is a similarity in these research results. The system performance efficiency of the MPCR model with N 1 FD relaying nodes has resulted in approximation with N 1 HD relaying nodes in the low dB SNRs. However, as ascending the SNRs, the performance of the MPCR system with N 1 HD relaying nodes becomes better demonstrated by the red dash-dot lines in Figure 3a. Specifically, the first user’s outage probability results in the FD scenario are the worst. However, there is not much difference compared to the other scenarios, such as Dir and HD scenarios. The reason is that the first relaying node in FD mode is affected by its own antenna channel noise, whereas in the direct and HD transmission scenarios with one antenna there are no loop interference channels.
To be more clear, we increased the number of users in the network to N = 4 users with the channel coefficient of U E 4 was h 0 , 4 = 1 / 4 at (t+1)-th time slot. In addition, the outage probability of the users are presented in Figure 3b. This is because the system has a new joined user, namely U E 4 , involved in the network with very weak signal quality. Therefore, we reused (42) to reallocate the transmit power factors to the users with α 1 = 0.12 , α 2 = 0.16 , α 3 = 0.24 , α 4 = 0.48 as showing in Table 2. This is also because the power distribution coefficients have been changed. As a result, the instantaneous bit rate thresholds of users have been changed accordingly. The instantaneous bit rate thresholds of the user are R i = 0.48 0.24 0.16 0.12 bps/Hz with i 1 , , 4 . In this case, to ensure the QoS to the fourth user with the poorest signal quality, we have allocated to this user the biggest power factor, namely α 4 = 0.48 , and the lowest threshold, namely R 4 = 0.12 bps/Hz, compared with the other users in the network. In addition, the other users must share power coefficient to U E 4 in the same power domain. The compared row contents in Table 1 and Table 2 correspondingly, both α i and R i with i = 1 , 2 , 3 are reduced for sharing power and bit rate to U E 4 . As showing in Figure 3b, although the U E 4 has the poorest signal quality, it has the best outage probability results. This demonstrates that the MPCR combines with allocating power factor and instantaneous bit rate threshold selection are effective. In particular, the outage probability results in both HD and FD scenarios using N 1 relaying nodes always outperform the scheme with no relaying.
Furthermore, this study investigates the impact of both allocation power coefficient and SNRs affecting user’s service quality, especially weak users. In Figure 3b, the weakest user, namely U E 4 , has been assigned a fixed power factor α 4 = 0.48 . This study considers if the power allocation coefficient for U E 4 increases or decreases, the quality of service of U E 4 is varied over the corresponding SNRs. For simplicity, we assume that user U E 4 and the other users are over the Rayleigh fading channel. On the other hand, the U E 4 and the other users that are over Nakagami-m fading channels will be analyzed later. This study has assumed that the fourth user can be allocated a variable power factor α 4 0.1 , , 0.9 . The Figure 4 shows the outage probability of the U E 4 with the allocation power factor which can be variable by one-by-one submitting each variable value α 4 into (34), (35), (38), and (39). It is important to notice that the outage probability results of U E 4 in direct, HD relaying, FD relaying scenario are presented by solid grid, dashed grid, and dash-dot grid, respectively. The Figure 4 showed that the outage probability results of U E 4 with the cooperation of 3 HD relaying nodes and 3 FD relaying nodes in MPCR scenarios are better than the U E 4 ’s results in direct scenario. Specially, the outage probability results of U E 4 in MPCR system with N 1 HD/FD relaying nodes are also approximations in all SNRs. These results are consistent with the U E 4 ’s results presented earlier in Figure 3b.
In addition, this study investigates the outage probability of the users over Nakagami-m fading channels scenario versus the ones over Rayleigh fading channels scenario as shown in Figure 5. To ensure that this comparison is fair, the simulation parameters in the Nakagami-m fading channels scenario are the same as the simulation parameters shown in Table 1. Therefore, it is not necessary to represent these simulation parameters. In low SNRs, the outage probability results of the users over Rayleigh fading channels and Nakagami-m fading channels are approximated. However, when the SNRs are increased, the outage probability results of the users over the Nakagami-m scenario are greatly improved.

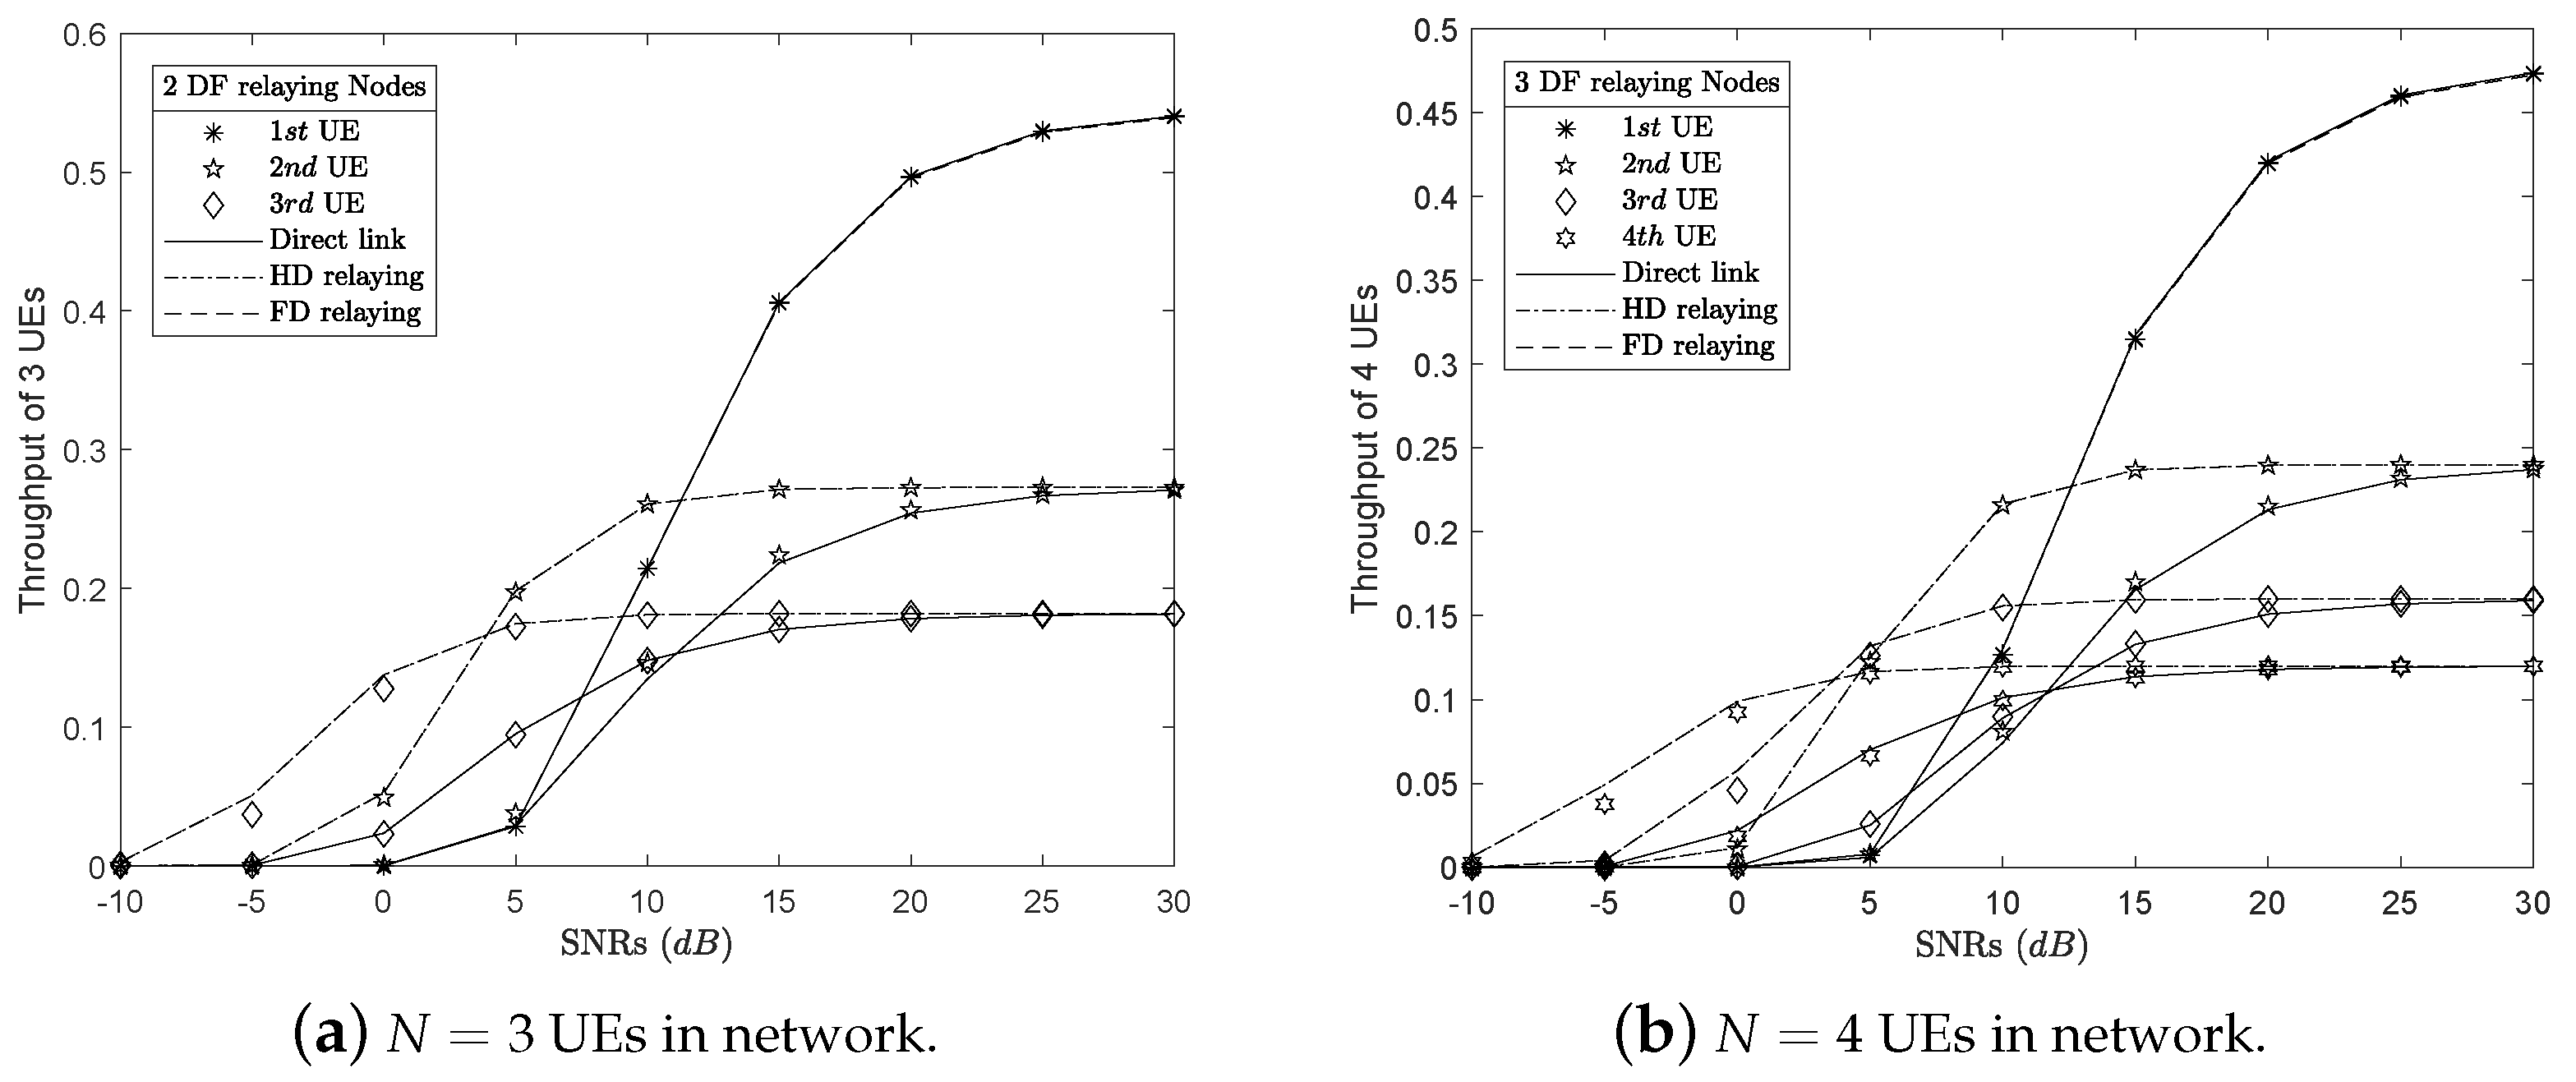
4.2. Numerical Results and Discussion for System Throughput
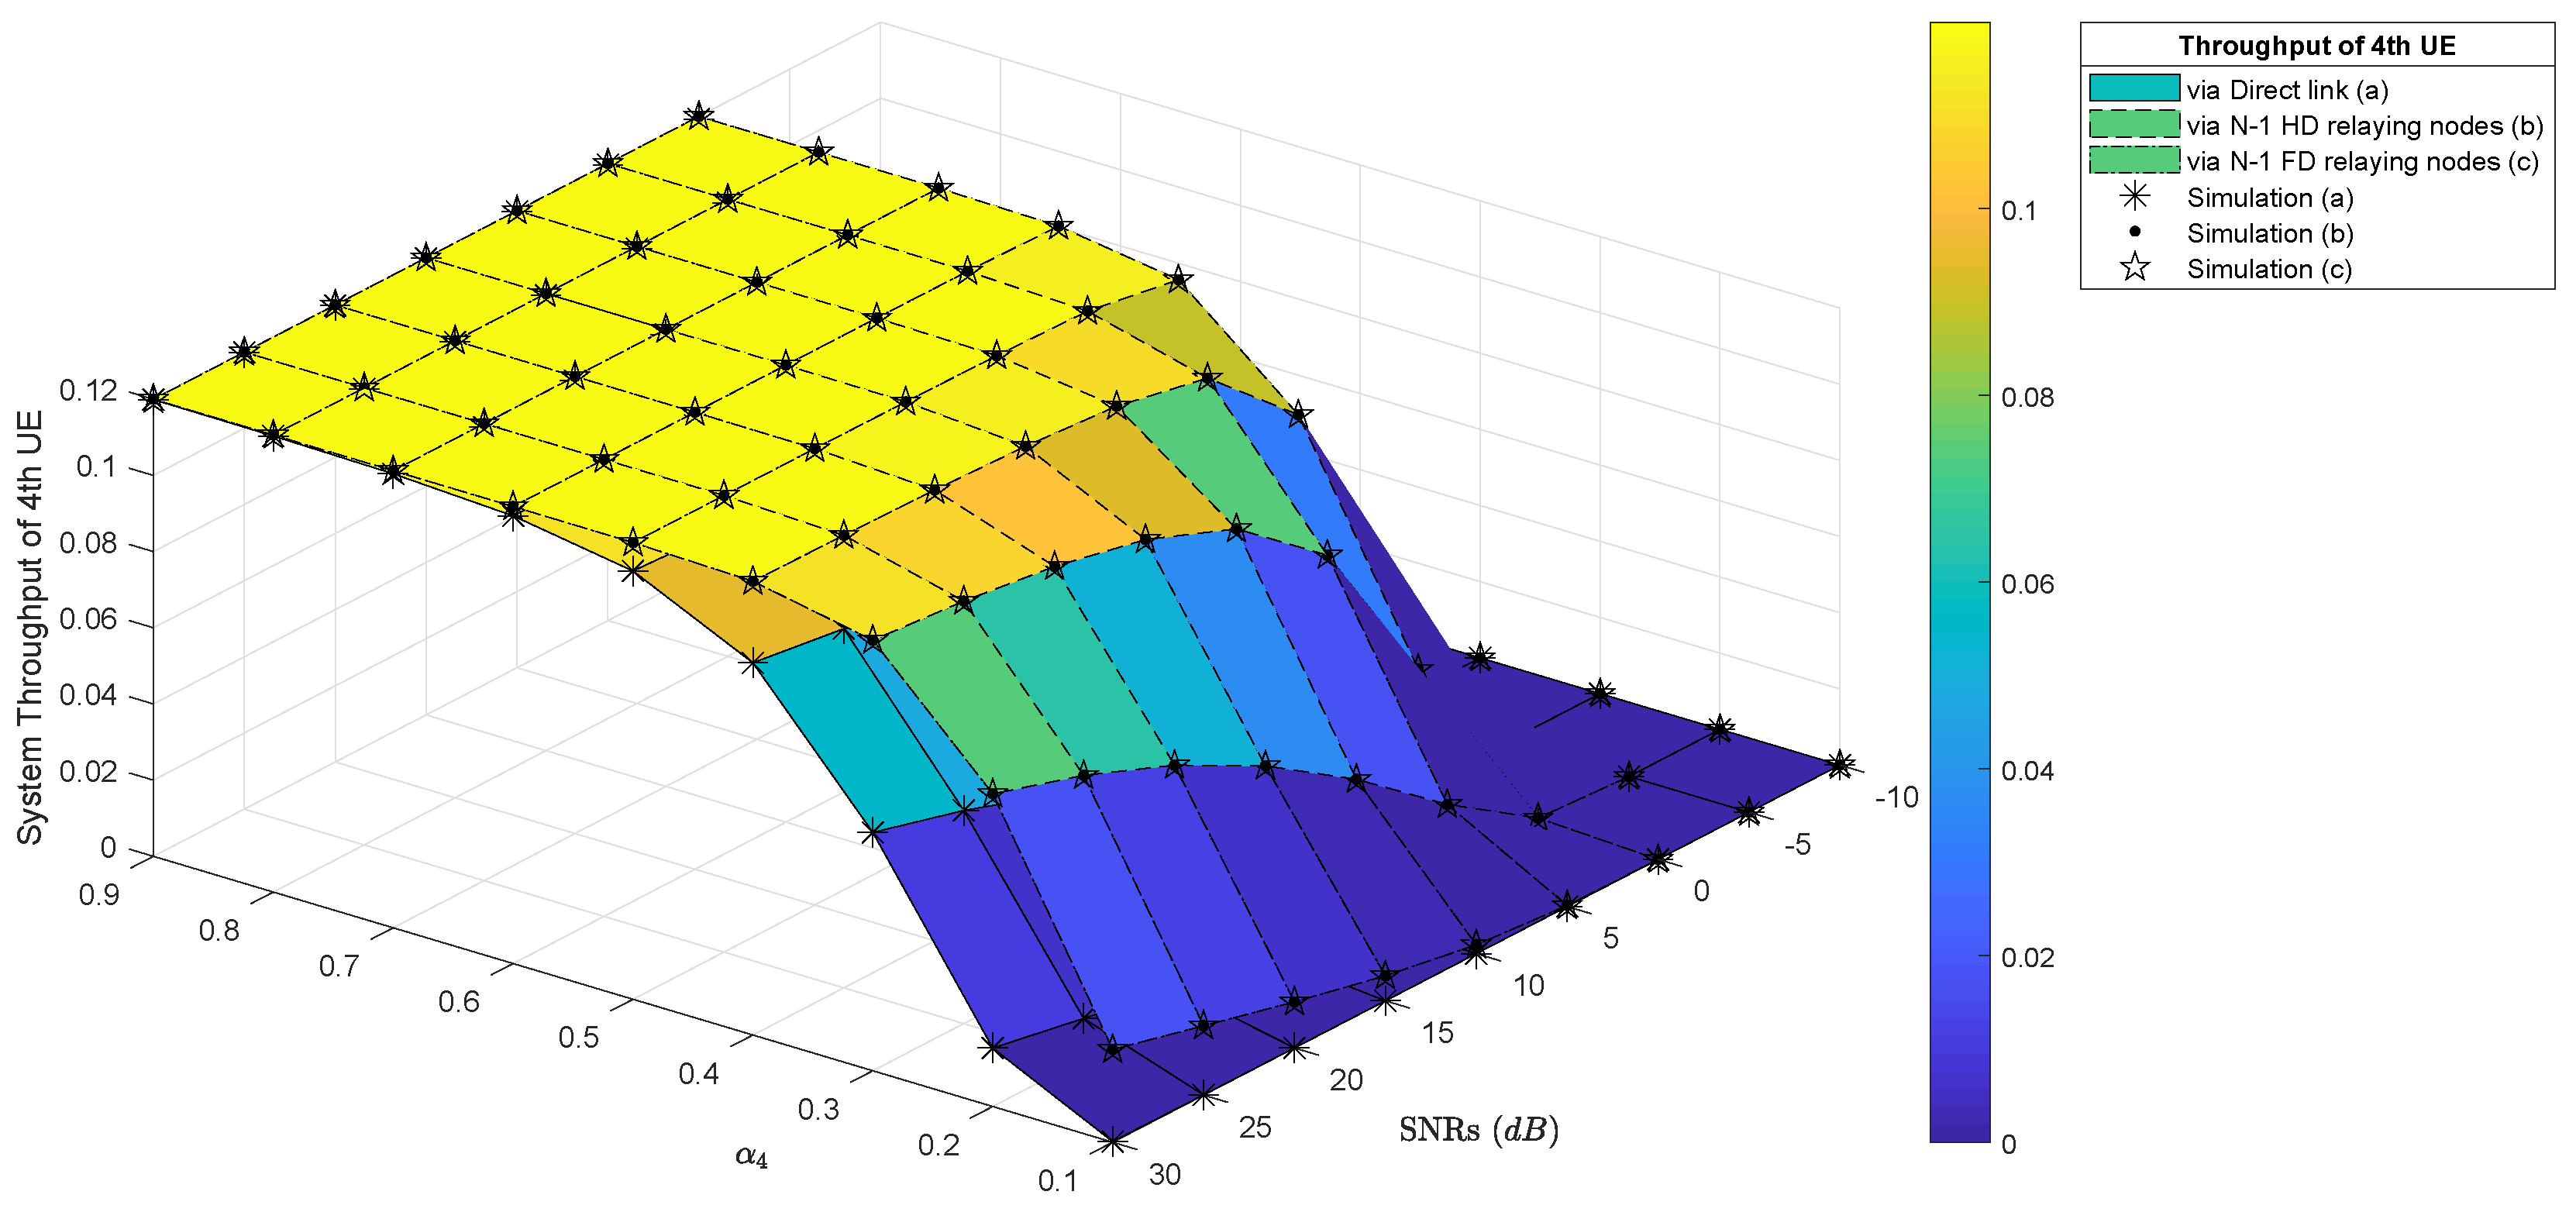
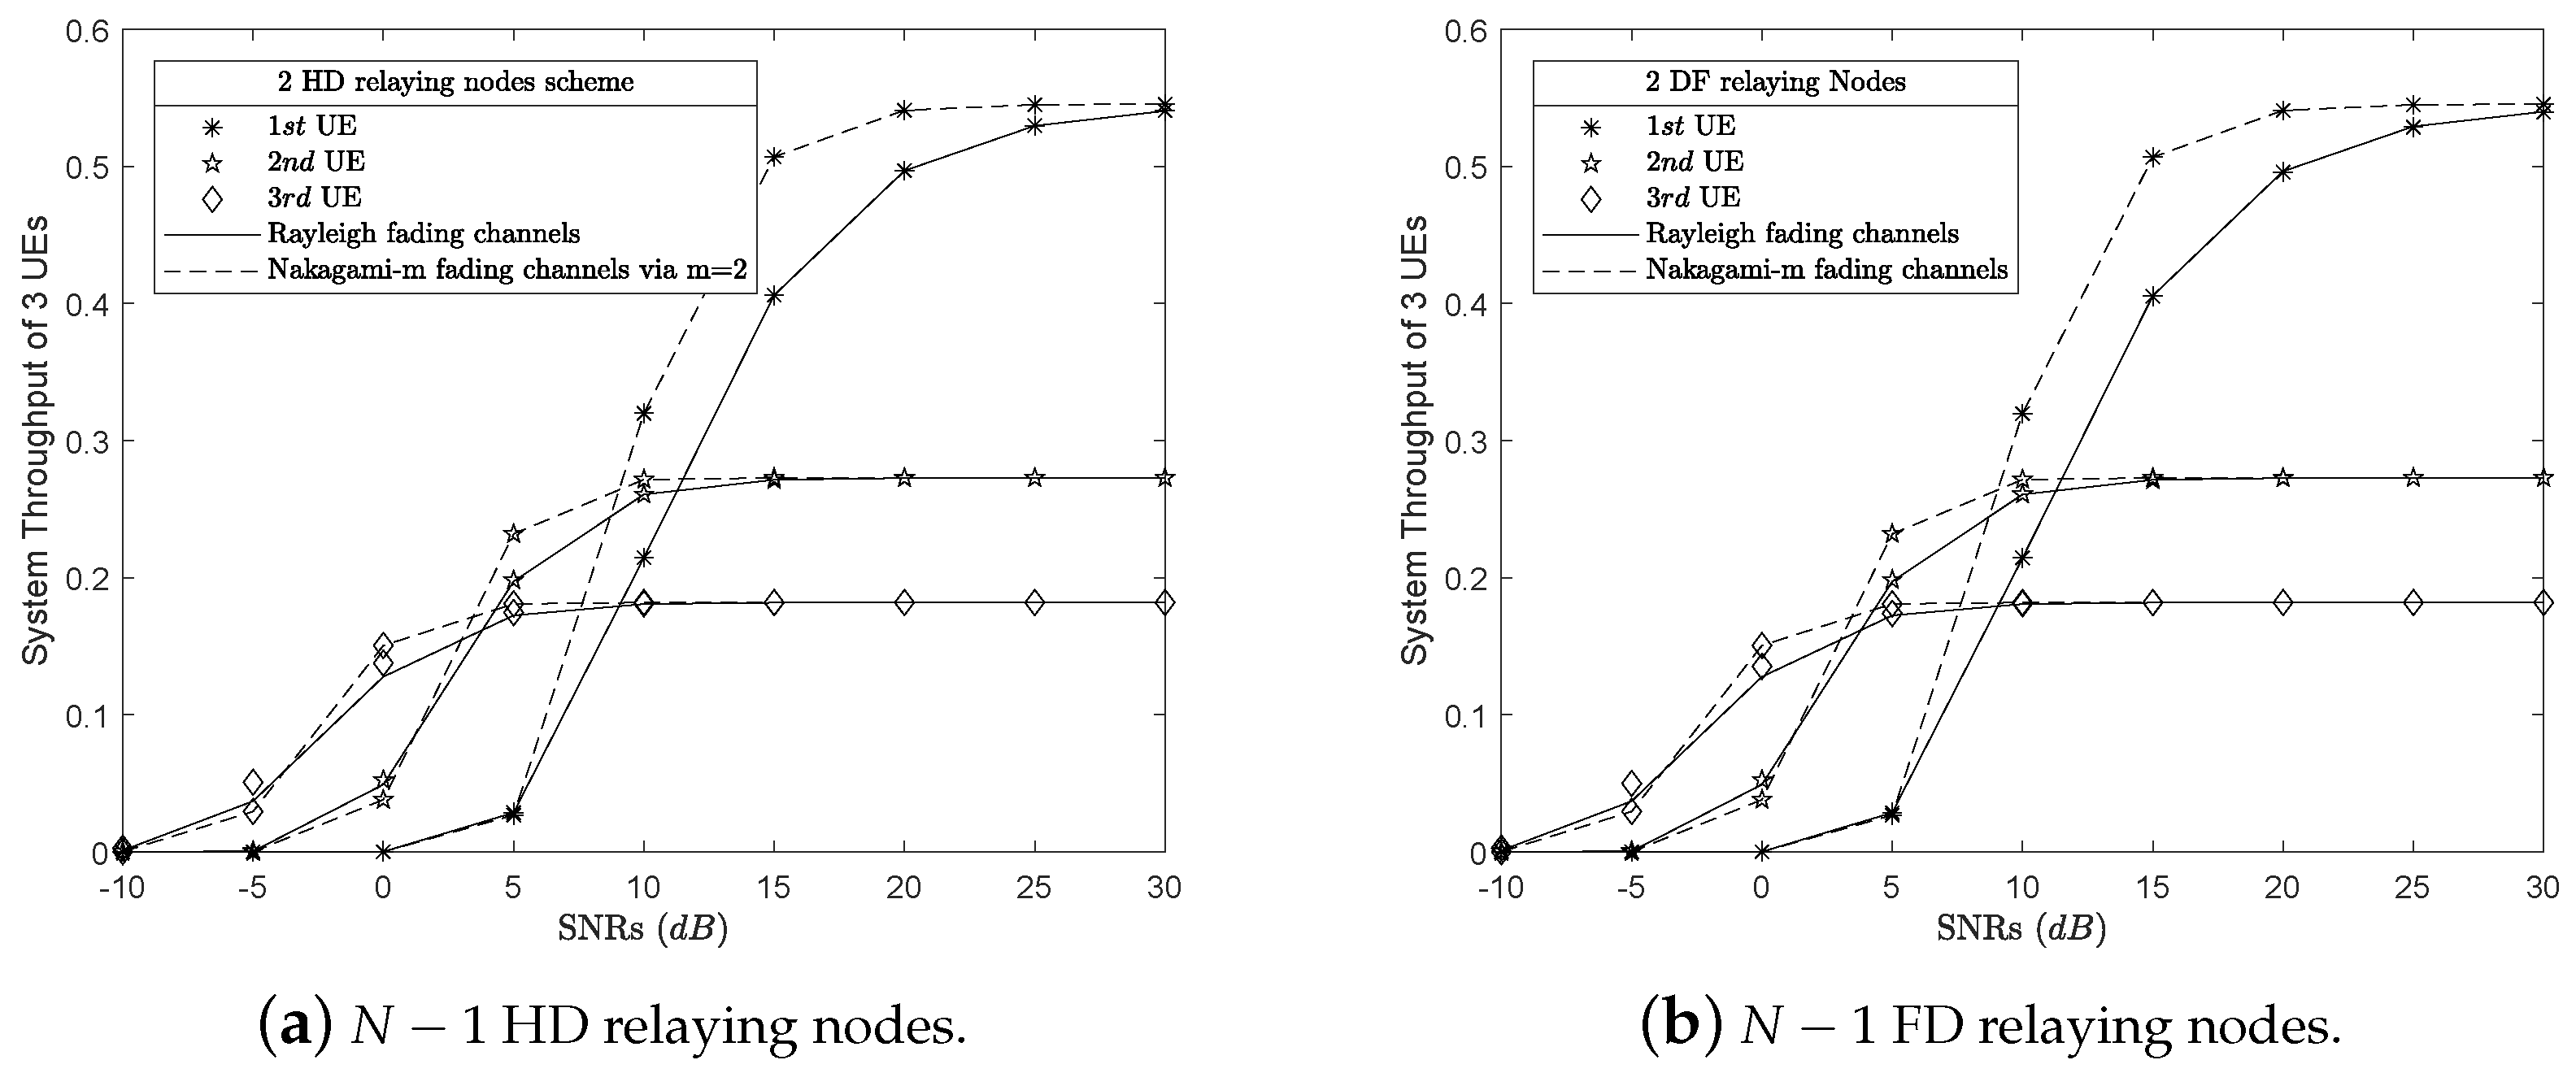
In system performance evaluation, system throughput is an important criterion that is known as the sum of instantaneous achievable bit rate of each user in the system. We reuse the simulation parameters as described in the evaluation of the outage probability shown in Table 1 and Table 2. Therefore, we do not restate these parameters. The system throughput of each user with N = 3 UEs and N = 4 ones are presented in Figure 6a,b, respectively. It is important to notice that the solid lines, dash-dot lines and dashed lines are the system throughput of the users in Dir, HD and FD scenarios, respectively. This is because the outage probability results of the users in HD and FD scenarios are approximately equal. As a result, the throughput results of these users are also approximately equal. Thus, the dash-dot lines and dashed ones are overlapped in both Figure 6a,b. The analysis results showed that the system throughput of users in the N 1 HD/FD relaying nodes scenarios are always better than the system throughput of the ones in the non-relay scenario. Specifically, the first UE’s system throughput is approximate in all three scenarios. At SNR in 30 dB, all users in three scenarios reach their bit rate thresholds R i .
On the other hand, this study analyzes the impact of the allocation power factor α 4 on the fourth user’s throughput with variable α 4 0.1 , , 0.9 values instead fixing α 4 = 0.48 . As shown in Figure 7, higher grid lines are better results than the other ones. In this case, the instantaneous bit rate threshold of U E 4 is R 4 = 0.12 bps/Hz. In low SNRs, e.g., S N R = 0 db, the system throughput results in all scenarios being approximately zero. On the other hand, although the SNRs have been increased, e.g., S N R = 10 dB, the system throughput results are still approximately zero if the power factor, namely α 4 , is still in low, e.g., α 4 = 0.1 . However, with α 4 = 0.4 and S N R is still held in 10 dB, the system throughput results of U E 4 in both three HD relaying nodes and three FD relaying nodes in MPCR scenarios are improved and reach their bit rate threshold. The Figure 6b showed that at SNR in 10 dB and α 4 = 0.48 , the U E 4 reach its bit rate threshold, approximately. Another e.g., in paired α 4 = 0.5 and S N R = 0 dB, U E 4 also reach its bit rate threshold in Figure 7. By this analysis, we can find pairs of values α 4 and S N R where U E 4 can reach the threshold R 4 = 0.12 bps/Hz.
The system throughput of the users in N 1 HD relaying nodes over both Rayleigh and Nakagami-m scenarios were analyzed, compared and presented in Figure 8a. In Figure 8a, there are N = 3 UEs over Rayleigh fading channels and Nakagami-m fading channels with solid lines and dashed ones, respectively. This is because of the results of Θ 1 H D > Θ 2 H D > Θ 3 H D as shown in Figure 5a. By applying (40), we get P 1 H D < P 2 H D < P 3 H D with low SNRs. With increasing SNRs, the system throughput of each UE changes, e.g., S N R = 30 dB, P 1 H D > P 2 H D > P 3 H D and reach their bit rate thresholds R i .
The similarly results also happen in N 1 FD relaying nodes scheme as shown in Figure 8b. Specifically, because the users over Nagami-m fading channels have better outage probability results than the ones over the Rayleigh fading channels as shown in Figure 5b, in some SNRs, e.g., S N R = 10 dB then Θ i F D < Θ i F D . Therefore, P i F D > P i F D where ℵ and ℜ were denoted as Nakagami-m and Rayleigh fading channels, respectively, after applying (40). These results proved that the Nakagami-m channel is better than the Rayleigh channel. However, when SNRs are increasing, the users have the throughput results approximately and close to the thresholds P i H D P i H D R i .

4.3. N UEs with N 1 HD/FD Relaying Nodes

As modeling Figure 1a,b, the proposed Proposition 3 can investigate the system performance with N UEs where N is a random and big number. Because of the limited power of our personal computers, this study only investigates and presents cases where there are only three or four users, N = 3 , 4 , in the system. However, the results presented do not show all the advantages of proposing algorithm. Thus, we are increasing the limit the number user with bigger number N. As shown in Figure 9a,b, there are 9 UEs in the network. By applying Proposition 3, we investigated the outage probability of the UEs in the network over both Rayleigh and Nakagami-m fading channels. For e.g., in N 1 HD relaying nodes scenario, the outage probability of the first UE, namely U E 1 , can be calculated by (34) or (28) over Rayleigh or Nakagami-m fading channels with m = 2 , respectively, where η = 0 . Another e.g., in FD scenario, the outage probability of last UEs, namely U E 9 , over Rayleigh or Nakamagmi-m fading channels can be computed by (35) or (39), respectively. With the number of users is greater than nine UEs, N > 9 , the results of the analysis are difficult to observe in the figure and it needs more time for the simulation. Therefore, we end the investigation with up to nine users in network.

5. Conclusions

In this study, we proposed a novel NOMA network model with N 1 relaying nodes instead of using only one relay as in previous studies. A superposed signal would be sent through N 1 relaying nodes before it reaches the farthest UE which is denoted by U E N . The closed-form expressions of N 1 HD/FD relaying nodes scenarios over Rayleigh/Nakagami-m fading channels are also presented along with an explanation for the corresponding processing. By presenting results in the figures, our proposed models with N 1 HD/FD relaying nodes are effective for applying to the cooperator NOMA network in the next generation of wireless telecommunications.

Author Contributions

T.-N.T. is the first author who proposed the main idea, analyzed and simulated the system, and presented the writing—original draft preparation, writing—review and editing, visualization. M.V. is the second who has experience in wireless communication research. He has made a supervision, review, and given the first author some useful comments and funding acquisition for this research. All authors read and approved the final manuscript.

Funding

This research received no external funding.

Acknowledgments

We would like to extend special thanks to the Reviewers for their comments and suggestions to improve this article.

Conflicts of Interest

We declare no conflict of interest. The funders had no role in the design of the study; in the collection, analyses, or interpretation of data; in the writing of the manuscript, or in the decision to publish the results.

Abbreviations

The following abbreviations are used in this manuscript:
No.AbbreviationsFull description
1AWGNsAdditive white Gaussian noises
2BSBase station
3CDFCummuative distribution function
4CSIChannel state information
5FDFull-duplex
6Fig.Figure
7HDHalf-duplex
8MPCRMulti-Point Cooperative Relay
9NOMAnon-orthogonal multiple access
10PDFProbability density function
11QoSQuality of service
12SSource
13SICSuccessive interference cancellation
14SINRSignal-to-interference-plus-noise ratio
15SNRSignal-to-noise ratio
16UEsUser Equipments

Appendix A

Proof of N − 1 HD relaying nodes scenario:
The condition for occurrence of the outage events has been presented in (33). By submitting (22), where Ω = H D , into (33), we can get a expression for computing the outage probability of each UE in N 1 HD relaying nodes scenario as following
Θ i H D = 1 l = 1 i 1 Pr h l 1 , l 2 > R i χ i ρ l 1 a n d 1 j = N i Pr h i 1 , i 2 > R j χ j ρ i 1 .
The (A1) can be rewritten in experimental integral by applying the PDF (25) of Rayleigh distributions as
Θ i H D = 1 l = 1 i 1 R i χ i ρ l 1 1 σ l 1 , l 2 e x σ l 1 , l 2 d x a n d 1 j = N i R j χ j ρ i 1 1 σ i 1 , i 2 e x σ i 1 , i 2 d x .
The (A2) can be solved and expressed as (34).
On the other hand, the (A2) can be written with the PDF (27) of Nakagami-m fading channels as following
Θ i H D = 1 l = 1 i 1 R i χ i ρ l 1 m σ l 1 , l 2 m x m 1 Γ m e m x σ l 1 , l 2 d x a n d 1 j = N i R j χ j ρ i 1 1 σ i 1 , i 2 m x m 1 Γ m e m x σ i 1 , i 2 d x .
and after the (A3) was solved, it can be expressed as (38). □
Proof of N − 1 FD relaying nodes scenario:
Similarly, by submitting (22) with Ω = F D into (33), we can get an expression for computing the outage probability of each UE in N 1 FD relaying nodes scenario
Θ i F D = 1 l = 1 i 1 Pr h l 1 , l 2 > R i h L i , l 2 ρ l + 1 χ i ρ l 1 , h L i , l 2 > 0 1 j = N i Pr h i 1 , i 2 > R j h L i , i 2 ρ i + 1 χ j ρ i 1 , h L i , i 2 > 0 .
The (A4) is also rewritten in experimental integral by applying the PDF of Rayleigh or Nakagami-m fading which are respectively (25) or (27), respectively, as
Θ i H D = 1 l = 1 i 1 0 R i y ρ l + 1 χ i ρ l 1 1 σ l 1 , l 2 σ L I , l 2 e x σ l 1 , l 2 + y σ L I , l 2 d x d y 1 j = N i 0 R j y ρ i + 1 χ j ρ i 1 1 σ i 1 , i 2 σ L I , i 2 e x σ i 1 , i 2 + y σ L I , i 2 d x d y ,
and
Θ i F D = 1 l = 1 i 1 0 R i y ρ l + 1 χ i ρ l 1 m 2 σ l 1 , l 2 σ L I , l 2 m x y m 1 Γ m 2 e m x σ l 1 , l 2 + y σ L I , l 2 d x d y 1 j = N i 0 R j y ρ i + 1 χ j ρ i 1 m 2 σ i 1 , i 2 σ L I , i 2 m x y m 1 Γ m 2 e m x σ i 1 , i 2 + y σ L I , i 2 d x d y .
For e.g., m = 2 , the (A5) and (A6) are solved and expressed as (38) and (39), respectively. End of proof. □

References

  1. Saito, Y.; Benjebbour, A.; Kishiyama, Y.; Nakamura, T. System-level performance evaluation of downlink non-orthogonal multiple access (NOMA). In Proceedings of the 2013 IEEE 24th Annual International Symposium on Personal, Indoor, and Mobile Radio Communications (PIMRC), London, UK, 8–11 September 2013. [Google Scholar]
  2. Ding, Z.; Yang, Z.; Fan, P.; Poor, H. On the Performance of Non-Orthogonal Multiple Access in 5G Systems with Randomly Deployed Users. IEEE Signal Process. Lett. 2014, 21, 1501–1505. [Google Scholar]
  3. Higuchi, K.; Benjebbour, A. Non-orthogonal Multiple Access (NOMA) with Successive Interference Cancellation for Future Radio Access. IEICE Trans. Commun. 2015, 98, 403–414. [Google Scholar]
  4. Men, J.; Ge, J.; Zhang, C. Performance Analysis for Downlink Relaying Aided Non-Orthogonal Multiple Access Networks with Imperfect CSI Over Nakagami-m Fading. IEEE Access 2017, 5, 998–1004. [Google Scholar] [CrossRef]
  5. Ding, Z.; Peng, M.; Poor, H. Cooperative Non-Orthogonal Multiple Access in 5G Systems. IEEE Commun. Lett. 2015, 19, 1462–1465. [Google Scholar]
  6. Xiao, Y.; Hao, L.; Ma, Z.; Ding, Z.; Zhang, Z.; Fan, P. Forwarding Strategy Selection in Dual-Hop NOMA Relaying Systems. IEEE Commun. Lett. 2018, 22, 1644–1647. [Google Scholar]
  7. Davoodi, A.; Emadi, M.; Aref, M. Analytical power allocation for a full duplex decode-and-forward relay channel. In Proceedings of the 2013 Iran Workshop on Communication and Information Theory, Tehran, Iran, 8–9 May 2013. [Google Scholar]
  8. Ding, Z.; Dai, H.; Poor, H. Relay Selection for Cooperative NOMA. IEEE Wirel. Commun. Lett. 2016, 5, 416–419. [Google Scholar]
  9. Gao, H.; Ejaz, W.; Jo, M. Cooperative Wireless Energy Harvesting and Spectrum Sharing in 5G Networks. IEEE Access 2016, 4, 3647–3658. [Google Scholar]
  10. Tonello, A.; Versolatto, F.; D’Alessandro, S. Opportunistic Relaying in In-Home PLC Networks. In Proceedings of the 2010 IEEE Global Telecommunications Conference GLOBECOM 2010, Miami, FL, USA, 6–10 December 2010. [Google Scholar]
  11. Lampe, L.; Vinck, A. Cooperative multihop power line communications. In Proceedings of the 2012 IEEE International Symposium on Power Line Communications and Its Applications, Beijing, China, 27–30 March 2012; pp. 1–6. [Google Scholar]
  12. Cheng, X.; Cao, R.; Yang, L. Relay-aided amplify-and-forward powerline communications. IEEE Trans. Smart Grid 2013, 4, 265–272. [Google Scholar]
  13. Rabie, K.; Adebisi, B.; Gacanin, H.; Nauryzbayev, G.; Ikpehai, A. Performance evaluation of multi-hop relaying over non-gaussian PLC channels. J. Commun. Netw. 2017, 19, 531–538. [Google Scholar]
  14. Dubey, A.; Mallik, R.K.; Schober, R. Performance analysis of a multi-hop power line communication system over log-normal fading in presence of impulsive noise. IET Commun. 2015, 9, 1–9. [Google Scholar]
  15. Dubey, A.; Mallik, R.K. PLC system performance with AF relaying. IEEE Trans. Commun. 2015, 63, 2337–2345. [Google Scholar]
  16. Lu, X.; Wang, P.; Niyato, D.; Kim, D.I.; Han, Z. Wireless networks with RF energy harvesting: A contemporary survey. IEEE Commun. Surv. Tutor. 2015, 17, 757–789. [Google Scholar]
  17. Nasir, A.A.; Tuan, H.D.; Ngo, D.T.; Durrani, S.; Kim, D.I. Path-following algorithms for beamforming and signal splitting in RF energy harvesting networks. IEEE Commun. Lett. 2016, 20, 1687–1690. [Google Scholar]
  18. Nguyen, V.D.; Duong, T.Q.; Tuan, H.D.; Shin, O.S.; Poor, H.V. Spectral and energy efficiencies in full-duplex wireless information and power transfer. IEEE Trans. Commun. 2017, 65, 2220–2233. [Google Scholar]
  19. Tam, H.H.M.; Tuan, H.D.; Nasir, A.A.; Duong, T.Q.; Poor, H.V. MIMO energy harvesting in full-duplex multi-user networks. IEEE Trans. Wirel. Commun. 2017, 16, 3282–3297. [Google Scholar]
  20. Nasir, A.A.; Tuan, H.D.; Duong, T.Q.; Poor, H.V. Secrecy rate beamforming for multicell networks with information and energy harvesting. IEEE Trans. Signal Process. 2017, 65, 677–689. [Google Scholar]
  21. Dai, L.; Wang, B.; Ding, Z.; Wang, Z.; Chen, S.; Hanzo, L. A Survey of Non-Orthogonal Multiple Access for 5G. IEEE Commun. Surv. Tutor. 2018, 20, 2294–2323. [Google Scholar]
  22. Islam, S.; Avazov, N.; Dobre, O.; Kwak, K. Power-Domain Non-Orthogonal Multiple Access (NOMA) in 5G Systems: Potentials and Challenges. IEEE Commun. Surv. Tutor. 2017, 19, 721–742. [Google Scholar]
  23. Islam, S.; Zeng, M.; Dobre, O.; Kwak, K. Resource Allocation for Downlink NOMA Systems: Key Techniques and Open Issues. IEEE Wirel. Commun. 2018, 25, 40–47. [Google Scholar]
  24. Shi, S.; Yang, L.; Zhu, H. Outage Balancing in Downlink Non-Orthogonal Multiple Access with Statistical Channel State Information. IEEE Trans. Wirel. Commun. 2016, 15, 4718–4731. [Google Scholar]
  25. Di, B.; Song, L.; Li, Y. Sub-Channel Assignment, Power Allocation, and User Scheduling for Non-Orthogonal Multiple Access Networks. IEEE Trans. Wirel. Commun. 2016, 15, 7686–7698. [Google Scholar]
  26. Lei, L.; Yuan, D.; Ho, C.; Sun, S. Power and Channel Allocation for Non-Orthogonal Multiple Access in 5G Systems: Tractability and Computation. IEEE Trans. Wirel. Commun. 2016, 15, 8580–8594. [Google Scholar]
  27. Fang, F.; Zhang, H.; Cheng, J.; Leung, V. Energy-Efficient Resource Allocation for Downlink Non-Orthogonal Multiple Access Network. IEEE Trans. Commun. 2016, 64, 3722–3732. [Google Scholar]
  28. Hanif, M.; Ding, Z.; Ratnarajah, T.; Karagiannidis, G. A Minorization-Maximization Method for Optimizing Sum Rate in the Downlink of Non-Orthogonal Multiple Access Systems. IEEE Trans. Signal Process. 2016, 64, 76–88. [Google Scholar]
  29. Ding, Z.; Adachi, F.; Poor, H. The Application of MIMO to Non-Orthogonal Multiple Access. IEEE Trans. Wirel. Commun. 2016, 15, 537–552. [Google Scholar]
  30. Wan, D.; Wen, M.; Ji, F.; Liu, Y.; Huang, Y. Cooperative NOMA Systems with Partial Channel State Information Over Nakagami-m Fading Channels. IEEE Trans. Commun. 2018, 66, 947–958. [Google Scholar]
  31. Timotheou, S.; Krikidis, I. Fairness for Non-Orthogonal Multiple Access in 5G Systems. IEEE Signal Process. Lett. 2015, 22, 1647–1651. [Google Scholar]
  32. Liu, H.; Ding, Z.; Kim, K.; Kwak, K.; Poor, H. Decode-and-Forward Relaying for Cooperative NOMA Systems with Direct Links. IEEE Trans. Wirel. Commun. 2018, 17, 8077–8093. [Google Scholar]
  33. Sadek, A.K.; Han, Z.; Liu, K.J.R. A distributed relay-assignment algorithm for cooperative communications in wireless networks. In Proceedings of the 2006 IEEE International Conference on Communications, Istanbul, Turkey, 11–15 June 2006. [Google Scholar]
  34. Sreng, V.; Yanikomeroglu, H.; Falconer, D.D. Relay selection strategies in cellular networks with peer-to-peer relaying. In Proceedings of the 2003 IEEE 58th Vehicular Technology Conference, VTC 2003-Fall (IEEE Cat. No.03CH37484), Orlando, FL, USA, 6–9 October 2003. [Google Scholar]
  35. Jing, Y.; Jafarkhani, H. Single and multiple relay selection schemes and their achievable diversity orders. IEEE Trans. Wirel. Commun. 2009, 8, 1414–1423. [Google Scholar]
  36. Kim, J.B.; Lee, I.H. Capacity Analysis of Cooperative Relaying Systems Using Non-Orthogonal Multiple Access. IEEE Commun. Lett. 2015, 19, 1949–1952. [Google Scholar]
  37. Thanh-Nam, T.; Dinh-Thuan, D.; Voznak, M. Full-duplex Cognitive Radio NOMA Networks: Outage and Throughput Performance Analysis. Int. J. Electron. Telecommun. 2019. in processing. [Google Scholar]
  38. Thanh-Nam, T.; Dinh-Thuan, D.; Voznak, M. On Outage Probability and Throughput Performance of Cognitive Radio Inspired NOMA Relay System. Adv. Electr. Electron. Eng. 2018, 16, 501–512. [Google Scholar]
Figure 1. The NOMA system with N − 1 relaying nodes in HD/FD mode..
Electronics 08 00167 g001
Figure 2. DF protocol and EH protocol at the i-th U E node.
Electronics 08 00167 g002
Figure 3. The outage probability results of N = {3,4} UEs over Rayleigh fading channels.
Electronics 08 00167 g003
Figure 4. The outage probability results of 4 t h UE with α 4 = 0.1 , , 0.9 and S N R s = 10 , , 30 .
Electronics 08 00167 g004
Figure 5. The outage probability results of three UEs over Rayleigh fading channels versus Nakagami-m fading channels via m = 2.
Electronics 08 00167 g005
Figure 6. The system throughput results of the users over Rayleigh fading channels.
Electronics 08 00167 g006
Figure 7. The throughput of the 4th UE over Rayleigh fading channels with α 4 = 0.1 , , 0.9 and S N R s = 10 , , 30 dB.
Electronics 08 00167 g007
Figure 8. Comparison of the system throughput results of Rayleigh versus Nakagami-m via m = 2.
Electronics 08 00167 g008
Figure 9. Comparison of the outage probability results of Rayleigh versus Nakagami-m fading channels.
Electronics 08 00167 g009
Table 1. 3 UEs in NOMA system at t-th time slot.
UEsChannelsAllocation Power CoefficientsBit Rate Thresholds
U E 1 h 0 , 1 = 1 α 1 = 0.1818 R 1 = 0.5455
U E 2 h 0 , 2 = 0.5 α 2 = 0.2727 R 2 = 0.2727
U E 3 h 0 , 3 = 0.3333 α 3 = 0.5455 R 3 = 0 . 1818
Table 2. 4 UEs in NOMA system at (t+1)th time slot.
UEsChannelsAllocation Power CoefficentsBit Rate Thresholds
U E 1 h 0 , 1 = 1 α 1 = 0.1200 R 1 = 0.4800
U E 2 h 0 , 2 = 0.5 α 2 = 0.1600 R 2 = 0.2400
U E 3 h 0 , 3 = 0.3333 α 3 = 0.2400 R 3 = 0.1600
U E 4 h 0 , 4 = 0.2500 α 4 = 0.4800 R 4 = 0.1200

