Strategies Comparison for Voltage Unbalance Mitigation in LV Distribution Networks Using EV Chargers


Area of Electrical Engineering, E.T.S.I. Industriales, Universidad Politécnica de Madrid, 28006 Madrid, Spain
*
Author to whom correspondence should be addressed.
Electronics 2019, 8(3), 289; https://doi.org/10.3390/electronics8030289
Submission received: 22 January 2019
/
Revised: 16 February 2019
/
Accepted: 28 February 2019
/
Published: 5 March 2019
(This article belongs to the Special Issue Power Quality in Smart Grids)
Abstract
:The increasing penetration of Electric Vehicles (EVs) in LV distribution networks can potentially cause voltage quality issues such as voltage unbalance and under-voltage conditions. According to the EV charger characteristics, some strategies can be adopted to mitigate the aforementioned effects. Smart decentralized charging controls seem to be a more practical solution than centralized controls, since there is no need for communication because they rely only on local measurements. The four most relevant decentralized charging strategies, two for single-phase and two for three-phase EV chargers, have been implemented in a typical three-phase four-wire European LV distribution network. Simulations have been carried out for scenarios with single-phase EV chargers, three-phase EV chargers, and a combination of both. Single-phase controls are aimed at under-voltage regulation, while three-phase controls are focused on mitigating voltage unbalance. Results show that the implementation of a decentralized EV charging control is an adequate solution for Distribution System Operators (DSOs) since it improves the reliability and security of the network. Moreover, even though decentralized charging control does not use any communication, the combination of three-phase and single-phase controls is able to mitigate voltage unbalance while preventing the under-voltage condition.
1. Introduction
Electric Vehicles (EVs) are, slowly but undoubtedly, becoming a real alternative to traditional combustion engine cars. In recent years, several European countries have set national electric car deployment targets as a key measure to diminish pollutant and greenhouse gas emissions in urban areas [1]. Financial incentives, together with an increased availability of charging infrastructure and certain benefits when accessing and parking in some urban areas in many cities, are decisive factors for the expected growth of electric vehicle market shares in the coming years [2,3].
Due to these predicted changes in transportation markets, the increase of EVs penetration in Low-Voltage (LV) distribution networks is likely to become a challenge for Distribution System Operators (DSOs), since it can lead to power quality issues. A typical topology for European LV distribution networks is the three-phase four-wire network, where loads and EVs are not equally distributed across the three phases. The combined effect of both EVs and household loads highly contributes to the unbalanced operation of the network, which results in voltage quality concerns such as under-voltage conditions and voltage unbalance [4,5,6].
EVs’ smart charging impacts on LV networks’ power quality has been studied from a wide range of perspectives, including the capability of EVs to mitigate the aforementioned voltage quality concerns. Among the specialized literature, smart charging controls can be divided into centralized and decentralized architectures, whose advantages and disadvantages have been discussed in [7,8,9,10]. Centralized smart charging requires a central aggregator that controls the charging of all vehicles and optimizes their charging load profiles based on a specific control algorithm. It requires a huge interconnected communication network, so charging profile information can be exchanged between each EV and the aggregator. The centralized architecture allows smoothing the aggregated electric load profile and improves voltage and power quality in a region, but may cause individual vehicles to have voltage peaks in their charging profiles.
On the other hand, the decentralized architecture manages the charging process of the EVs locally. Decentralized controls present several advantages such as scalability, constant computational effort, and reduced communication requirements [11]. Besides, it allows each individual EV to minimize their respective charging costs, but, collectively, this may not be the optimal solution for the region, since there could be instabilities when all controllers react simultaneously to the measurements. Considering that cost and robustness are similar in both architectures, the decentralized control tends to be a more practical solution, since it is based on local measurements and does not need additional communication infrastructure [10,12].
In addition to the classification between centralized and decentralized architectures, EV smart charging controls can be divided into those controls suitable for being implemented in a single-phase charger and those applicable to three-phase chargers. Historically, in European countries, the three-phase connection has been reserved for industrial consumers, but, in recent years, the number of residential houses with three-phase connection has increased considerably in Northern and Central Europe [12]. Regarding single-phase connection, EVs’ smart charging impact on LV networks has been investigated mainly by modulating the active power consumed by the EVs through a droop control [13,14,15]. This control highly influences the time needed for a full charge and could potentially result in inconveniences for the user. Besides, the power electronic converter in the charger might introduce a reactive power capability, which can contribute to ancillary services and the correction of voltage issues, such as [16,17]. Therefore, taking advantage of the available hardware, the reactive power provision has been studied in [18,19] for a balanced system, and the work in [12] proposed a new control for an unbalanced system based on a droop control.
In relation to three-phase connection, the work in [20] investigated the capability of providing a negative and zero sequence in order to diminish voltage unbalance. Moreover, research presented in [21,22] demonstrated that it is possible to achieve substantial improvement in voltage unbalance by balancing the LV network loads. In this case, the strategy also requires a reactive power capability, which is always limited by the charger’s rated power. Thus, the more reactive power the charger is dealing with, the less reactive power is available.
This paper analyses the most relevant Electric Vehicle (EV) charging strategies to mitigate voltage unbalance and under-voltage conditions in Low-Voltage (LV) distribution networks. Besides, a comparison is made between the results obtained with three-phase charging strategies, single-phase charging strategies, and a combination of both.
This paper is organized as follows: Section 2 presents the test LV network, together with the household consumptions and EV charging power demand. Section 3 describes the voltage quality indicators and standards and introduces the EV smart charging controls selected for the analysis. Finally, the scenarios conducted and results are discussed in Section 4, while the conclusion is given in Section 5.
2. Test Case
2.1. Test Network
The analyzed 50-Hz and 400-V test network was based on the European Low Voltage Distribution Network Benchmark developed by CIGRETask Force C6.04 [23]. The original test network was connected to a 20-kV Medium Voltage (MV) network. This MV network was the only feeding point and had a short-circuit power of 100 MVA and an X/Rratio equal to one. Besides, the LV network was divided into three subnetworks: residential, industrial, and commercial. Each subnetwork was connected to the MV network through a Dyn1 transformer, whose rated power was 500 kVA for the residential, 150 kVA for the industrial, and 300 kVA for the commercial subnetwork. The transformers’ secondary star point windings were grounded through a 3 impedance. The MV network of the described test system was considerably stiff. Due to this situation, power and voltage quality issues that occurred in one subnetwork did not influence the other two subnetworks. Hence, since EVs were connected to the residential subnetwork, disturbances that took place there only affected the residential voltage quality. Considering the purpose of this paper, industrial and commercial subnetworks are not going to be analyzed further, since they are not altered by the different EV charging strategies. The modified network including only the residential subnetwork is shown in Figure 1.
The residential test network’s consumptions were aggregated into six different supply points (R1, R11, R15, R16, R17, and R18). As indicated in Figure 1, the residential subnetwork had its neutral wire grounded at the indicated nodes through a 40 impedance. The test network was composed of 17 line segments of the following types:
- residential main line: underground NA2XY 4 × 240 mm
- residential ramifications: underground NA2XY 4 × 50 mm
The X/R ratio of each Thévenin equivalent circuit of the supply nodes in the residential subnetwork is displayed in Table 1. The X/R ratio was calculated using the direct sequence impedance. Accordingly, Node R15 can be considered as the weakest point of the network with a significant difference with respect to the rest of the supply nodes.
2.2. Households’ Consumption
As mentioned before, the work in [23] proposed standard daily power profiles for each subnetwork at the transformer level, but lacked information per individual household. Since that approach does not allow implementing individual household consumption profiles and individual EV charging profiles, the authors have disaggregated the supply points based on a previous version of the test network [24]. Thereby, households were distributed as stated in Table 2, having a residential network with 12 three-phase consumptions and 14 single-phase consumptions. Besides, Table 2 shows the apparent power of each supply point, which was divided equally among the consumptions so that the maximum power consumed by each supply point did not exceed the indicated apparent power. Moreover, the feeder located in R1 is represented as a single aggregated household since there were no data per individual house, and it was characterized by the standard power profile proposed in [23]. It had a rated power of 200 kVA and a power factor equal to 0.95.
Power profiles have been obtained for 24 h on a 0.1-s basis. Daily individual consumptions for the residential subnetwork were obtained with the software LoadProfileGenerator developed in [25]. The software simulates the behavior of the household occupants based on a desired model, so individual household power profiles can be obtained. Power profiles were randomly generated and were all different, so they were assigned to individual households randomly. However, apparent power for those power profiles did not necessarily coincide with the values of Table 2; therefore, the power profiles’ values were amended by translating them to per unit values and multiplying by the correspondent apparent power.
Due to the lack of information regarding the connection phase of the 14 single-phase consumptions of the network, they were divided between phases in an equitable way, i.e., 4 consumptions connected in Phase a, 5 in Phase b, and 5 in Phase c. Thus, the daily power profile at transformer level was calculated by adding up the power profile of each individual consumption. The 24-h power profile at the transformer level for the residential subnetwork is represented in Figure 2a, as well as the residential subnetwork power profile per phase during the selected time period for simulations. For the purposes of this paper, it is sufficient to select a time period of one hour to perform simulations. The time period between 21:00 and 22:00 was selected, which represents the worst case scenario since household consumptions were close to the peak value, there was a significant unbalance when EVs were not connected, and EVs were likely to have arrived home by 21:00 [26], so there would be an increased power demand due to the EVs’ charging. The detailed consumption on each load node is shown in Figure 3.
2.3. Electric Vehicles
Each household was equipped with an EV with the correspondent EV charger. The EV charging power profile for the base case corresponded to the “dumb-charging” pattern, i.e., the charging started immediately after the vehicle was connected and consumed 3.68 kW [27]. This charging pattern contributed to the worst case scenario since the power demanded by EVs was not regulated, and the penetration rate was 100%.
As previously mentioned, the paper aims at comparing single-phase and three-phase charging controls. Therefore, EVs were connected in a single phase or three phases depending on the EV charging controls selected for comparison. For scenarios with single-phase charging controls, vehicles located in households with three-phase consumptions were connected to a random single-phase EV charger with an overall equal number of EVs per phase. Besides, vehicles in households with single-phase consumptions were connected to the same phase as the household. On the other hand, for scenarios with three-phase charging controls, every EV was connected to a three-phase EV charger. The simulation scenarios are defined in Section 4.
3. Methodology
3.1. Voltage Quality Indicators
Any deviation in voltage waveform from the perfect sinusoidal one, both in terms of magnitude or phase shift, is termed as an unbalance. The unbalanced distribution of single-phase loads between the three phases and unequal line impedances imply voltage and current unbalance. As a result, power losses in wires were increased, motors reduced their efficiency severely and suffered degradation, and protection components could be tripped [28]. Three-phase voltages can be translated into symmetrical components through the following expression:
where , are phase-to-neutral complex voltages and are the zero, positive, and negative sequence components. Hence, the presence of negative or zero sequence voltages indicates an unbalance operation of the system.
European standard EN50160 [29] establishes the voltage characteristics of electricity supplied by public distribution systems. Averaging phase-to-neutral voltages every 10-min over a week, phase-to-neutral voltage magnitudes (U) and the Voltage Unbalance Factor (VUF) should remain under the following boundaries 95% of the time:
where corresponds to 1 p.u.
Standard EN50160, as well as other VUF standards, defines VUF as the ratio between the negative voltage component and the positive voltage component [30]. This definition is sufficient for three-phase three-wire systems, since the absence of a neutral wire implies that zero sequence current cannot flow though the system. However, this statement is not valid for three-phase four-wire systems, and the VUF definition has to be adapted so it can take into account the zero sequence contribution. The authors have chosen the following VUF definition, previously defined by [31], which is valid for both three-phase three-wire and three-phase four-wire systems:
Figure 4 illustrates the difference between using the formula proposed by EN50160 and the one defined by [31], for the test network with no EVs during 24 h. A severe difference between both curves can be seen, where the mean relative error was 2.94%, reaching a maximum error of 5.83%. Hence, for the studies and analysis carried out in this paper, the authors used the aforementioned improved formula since it is more accurate when measuring VUF and requires a more severe control action to be compliant with the standard.
3.2. Selected Smart Charging Controls for EVs
As introduced in Section 1, the most relevant decentralized smart charging controls for improving voltage quality levels in an LV network were selected for comparison. These strategies established the reference with which the EV charger operates.
3.2.1. Active Power Droop Control (Droop P)
Droop P control was mainly investigated to be implemented in single-phase EV chargers. Among the different Droop P controls in the literature, the one proposed in [15] was selected for the analysis. The charging control takes the EV’s phase voltage measurement and calculates the charging power based on the Droop P curve shown in Figure 5. According to this curve, the charging power is at the maximum value when the phase voltage is above 0.95 p.u. For phase voltages below 0.95 p.u. the charging power is reduced according to the slope, until it reaches 0.9 p.u. Then, the EV is disconnected as long as the voltage remains low. This strategy presents a straightforward under-voltage regulation.
The main drawback of the Droop P control is that the time needed for a full charge increases severely, which could be an inconvenience to the EV owner. Thus, the social factor would have an impact on this control strategy, which is beyond the scope of this study. Moreover, since the control does not have information about the two phases where the EV is not connected, there is no possibility of regulating voltage unbalance.
3.2.2. Reactive Power Droop Control (Droop Q)
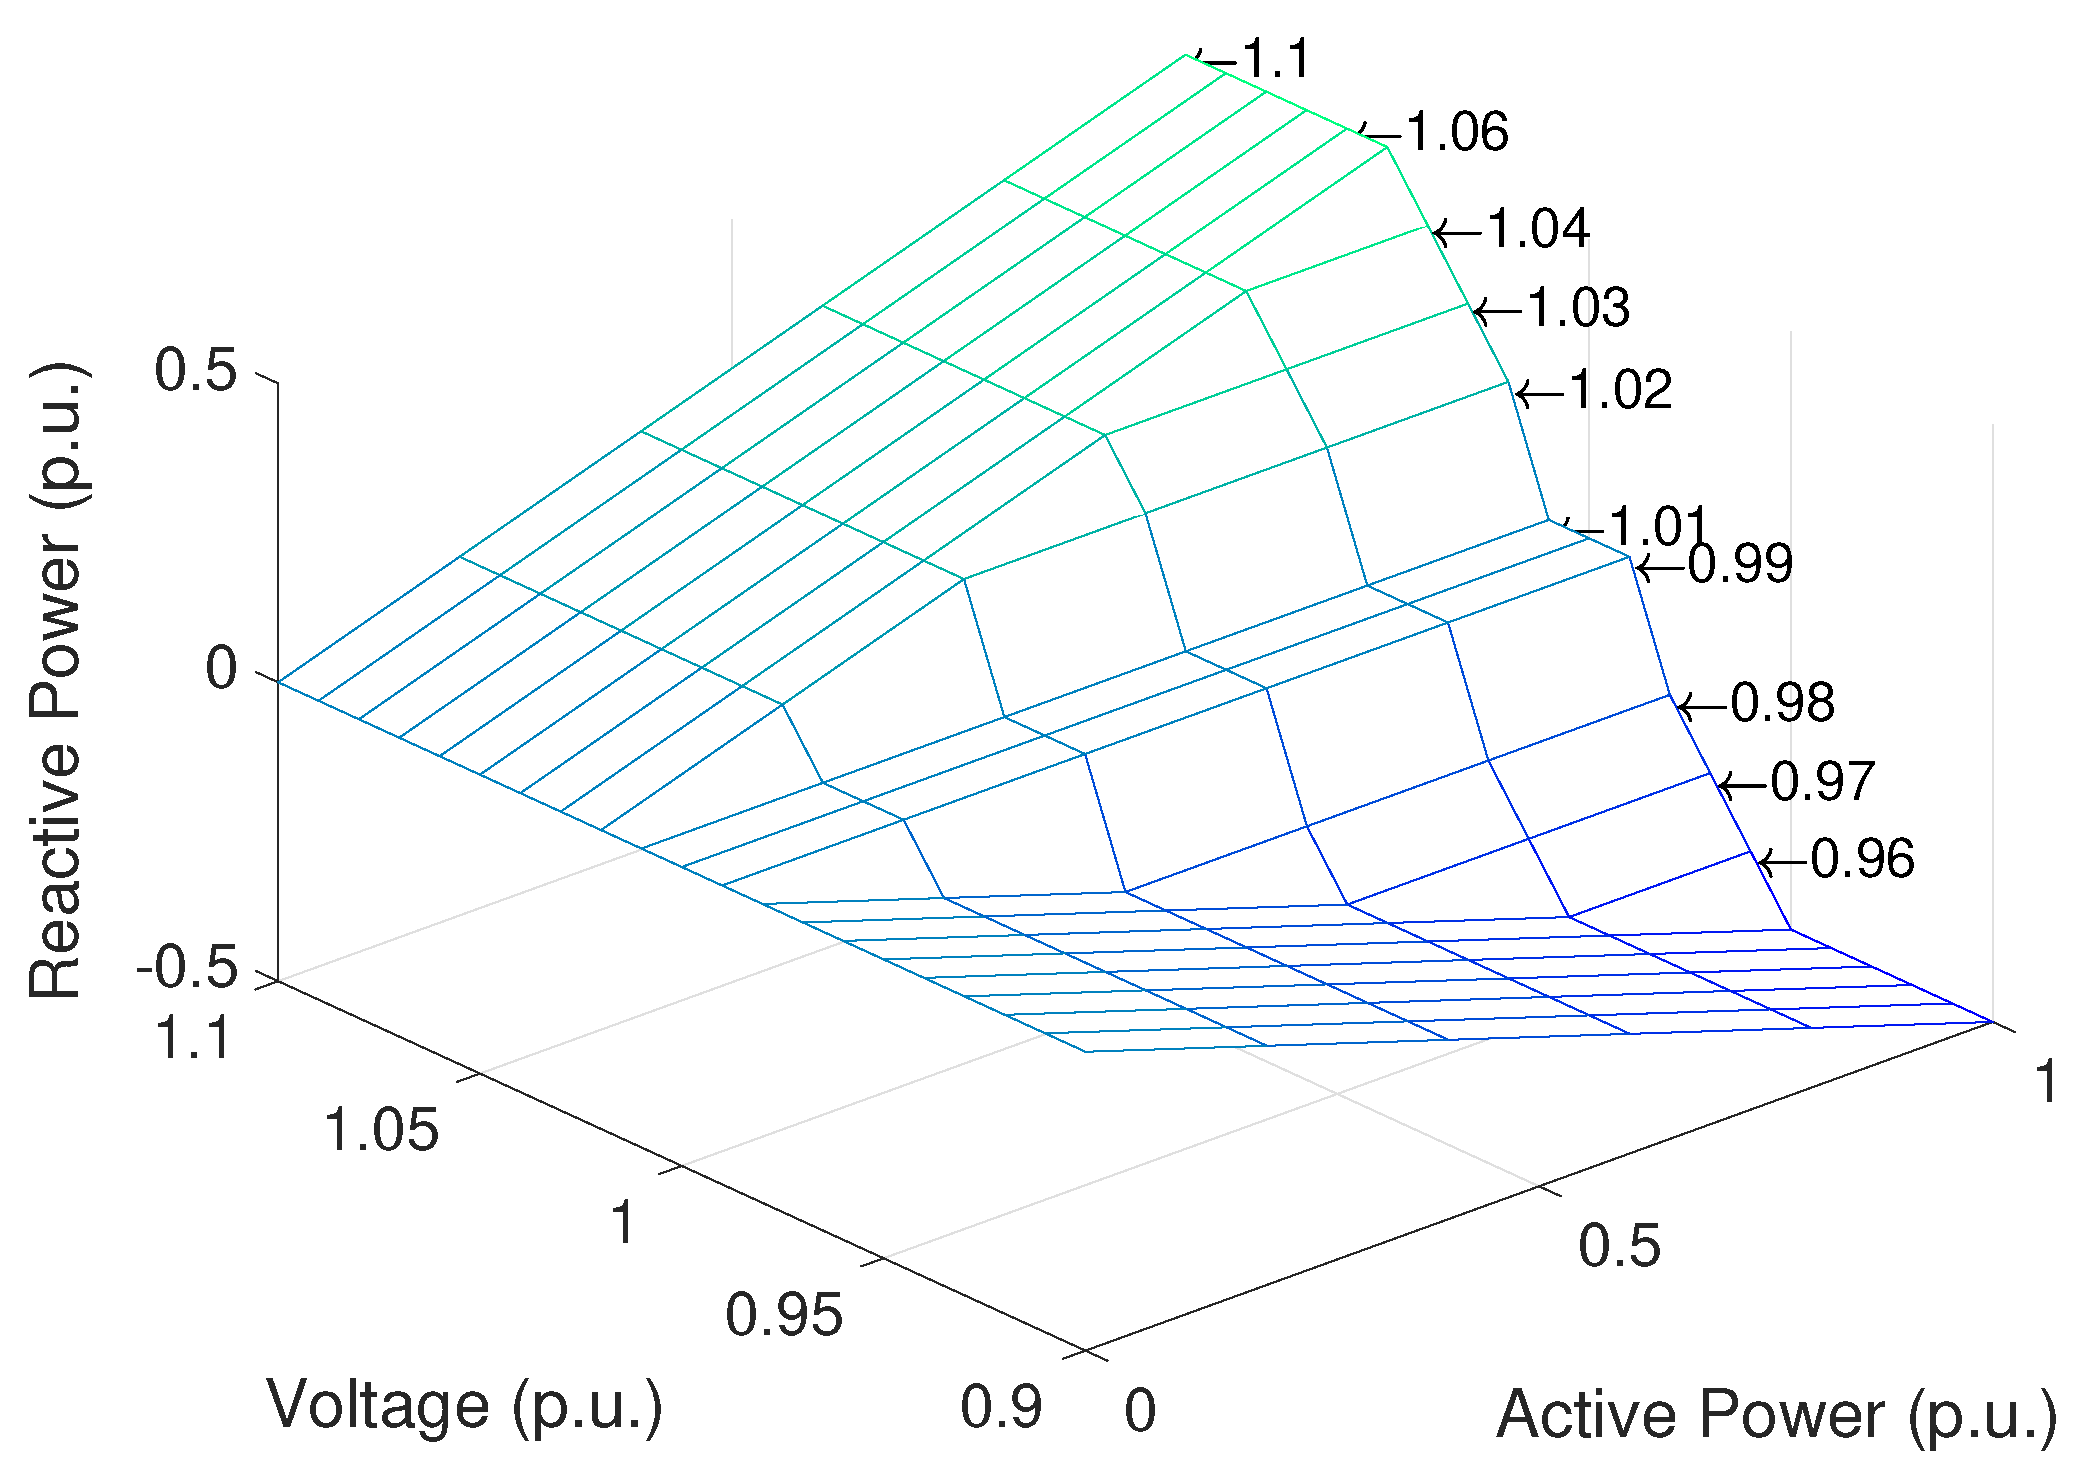
The Droop Q control selected for comparison and analysis was the control described in [12]. Although it can be implemented in both three-phase and single-phase EV chargers, in this work, it was applied to a single-phase case. Its main advantage with respect to the Droop P control is that it provides under-voltage and over-voltage regulation without compromising the EV full charge. However, this control is incapable of providing voltage unbalance regulation because it only uses single-phase measurements. This control is similar to the Droop P control, but the reactive power is a function of the active power consumed by the EV and the voltage at the EV connection point, , as shown in Figure 6. In order to not penalize the consumer, the EV charging power was set to the maximum value (1 p.u.). In this way, the control behaves as a voltage droop control, simplified to . Unlike the Droop P control, the Droop Q can be bidirectional, i.e., it can absorb or generate reactive power. For phase voltages from 0.99 p.u.–0.95 p.u., the control injects reactive power. On the other hand, for voltages between 1.01 p.u. and 1.05, it absorbs reactive power. In addition, there is a dead band for voltages between 0.99 p.u. and 1.01 p.u.
When designing this Droop Q control, it is important to size the inverter properly, so it is capable of providing or absorbing the desired reactive power without affecting the consumed active power. The reactive power limits were assumed to be ±0.5 p.u., which, considering that 1 p.u. is equal to the active power consumed by the EV (3.68 kW), equals ±1840 var [12].
3.2.3. Load Balancing Control
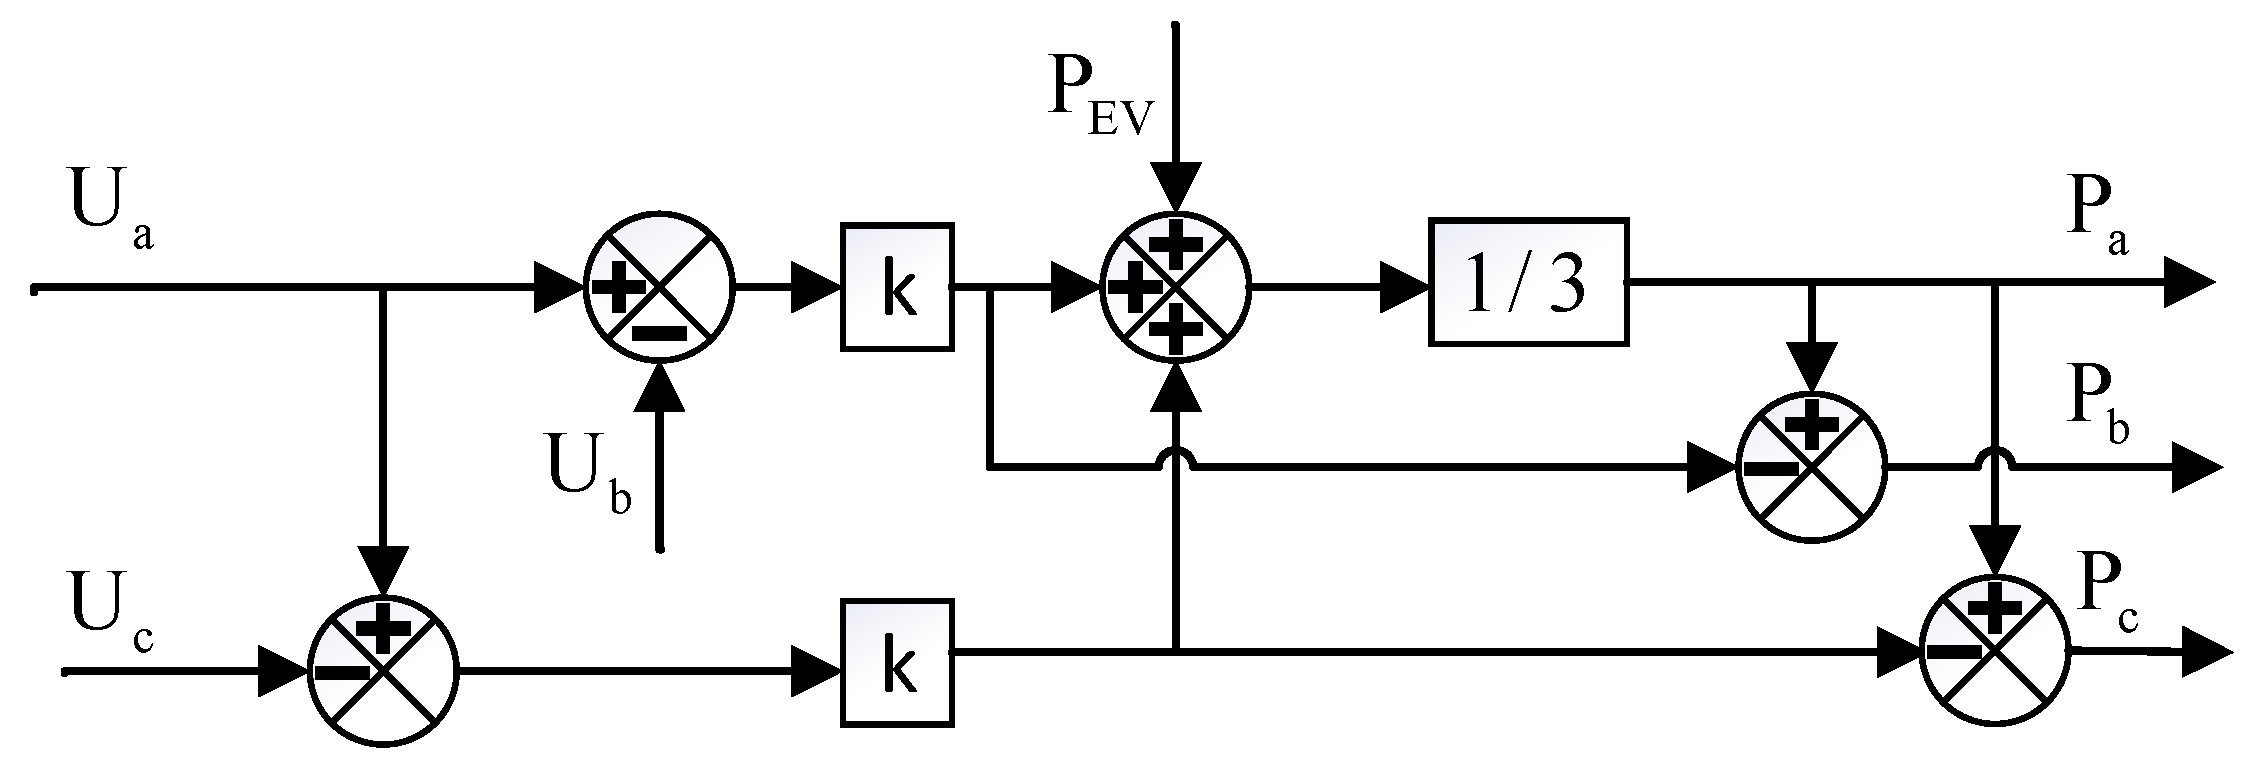
The control proposed in [21] has been implemented in this paper as a Load Balancing (LB) control. This charging control was designed to be implemented in a three-phase charger and consists of dividing the EV charging power between the phases based on the phase-to-neutral voltage differences between them. The control behaves as follows:
where is the EV charging power and k is a parameter that controls the inter-phase power delivery. For the studies carried out in this paper, a constant value of 100 W/V was selected for this parameter. Besides, the following equations have to be accomplished in order to satisfy the EV charger size:
where kW. This strategy, based on the above equations, was implemented as shown in Figure 7.
3.2.4. Sequence Compensation Control
The Sequence Compensation (SC) control is aimed at compensating the negative and zero voltage components, so VUF equals 0%. The SC control selected was the one proposed in [20], which is suitable to be implemented in three-phase inverters and behaves as follows:
where is the three sets of compensating currents and is the three sets of balancing currents that compensate the voltage unbalance originated by the measured currents and . The balancing currents, apart from reducing the VUF, introduce an undesirable active power that needs to be eliminated by injecting a further balanced set of currents . This set equals the active power originated by divided by three times the mean value of the phase voltage magnitudes. The block diagram of this control strategy is shown in Figure 8.
Since this paper focuses on comparing decentralized control strategies, the measured currents of the above equations correspond to the consumption current of each household.
4. Results and Discussion
This paper analyses and compares voltage unbalance and under-voltage conditions for the scenarios listed in Table 3. Comparing decentralized single-phase with decentralized three-phase EV charging controls is not appropriate, since they do not rely on the same measurements. In other words, single-phase EV chargers can only measure single-phase values, and they do not have information about VUF, while three-phase EV chargers have complete information about the three-phases. Hence, a comparison was made between uncontrolled single-phase charging, Droop P and Droop Q control, and between uncontrolled three-phase charging, LB and SC control. Moreover, a further comparison was made between scenarios with both types of EV chargers, combining single-phase controls with three-phase controls in the same scenario.
4.1. Simulation Scenarios
As shown in Table 2, the LV test network accounted for 14 households with single-phase connection and 12 with three-phase connection, so there were 26 households with 26 EVs in total. For the single-phase EV charging control scenarios, it was assumed that every household in the test network accounted for a single-phase EV charger, and the correspondent assumption was made for three-phase EV charger scenarios. For Scenarios VII–XI listed in Table 3, households with single-phase consumptions were assumed to be equipped with a single-phase EV charger and those with three-phase consumptions, a three-phase EV charger.
Simulations were carried out in the environment of MATLAB Simulink SimPowerSystems. Voltage levels were registered at 0.1 s over a time span of 1 h, and they are presented in box-plots for the supply nodes of the test network (R11, R15, R16, R17, and R18). Furthermore, VUF was calculated by averaging its value every 10 min, and the results are presented for each supply node together with the average VUF for the network. As previously mentioned, in Table 1, R15 was the weakest node of the network, and there were five three-phase and eight single-phase consumptions with the correspondent EVs connected there. Therefore, Node R15 was expected to present the lowest voltage levels and the highest VUF.
4.2. Scenarios I, II, and III: Single-Phase Controls
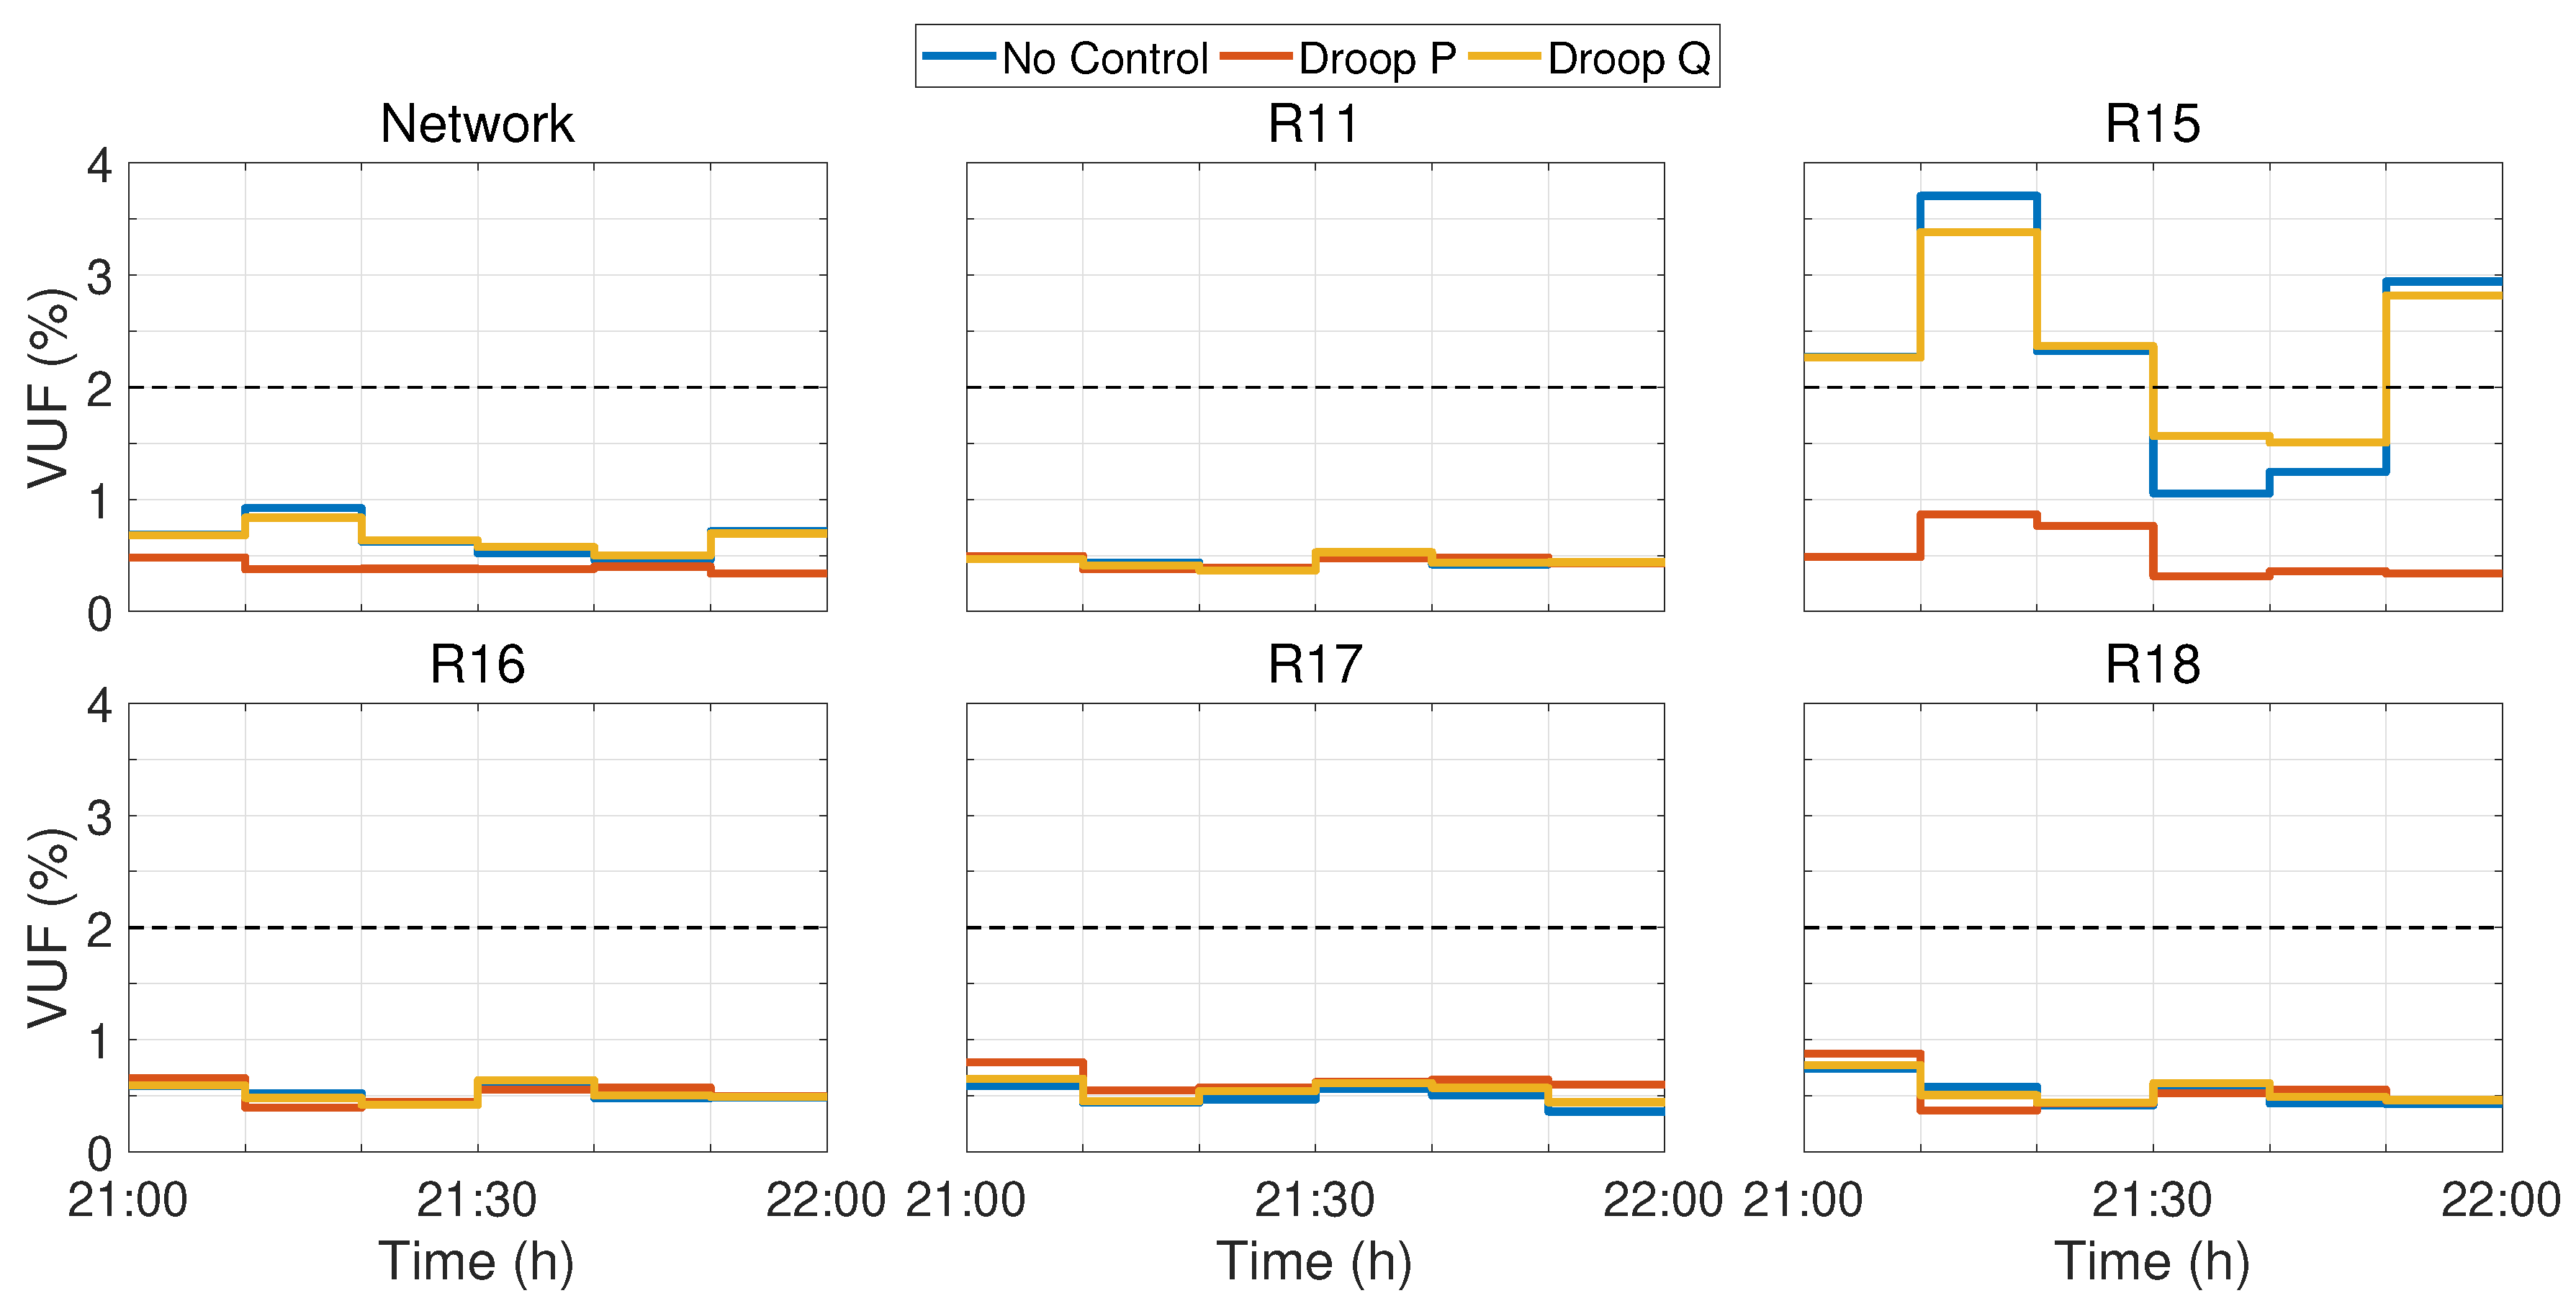
Voltage levels and VUF for Scenarios I, II and III are represented in Figure 9 and Figure 10, respectively. Based on phase voltages obtained with the uncontrolled charging for Scenario I, Phase b and Phase c remained within the desirable bound during the simulated period. Phase a voltages at Node R15 presented values below 0.9 p.u., which is a critical behavior since it is not compliant with the standards. This issue was due to the high loading of Phase a during the selected time period (Figure 2), in addition to the weakness of Node R15, as well as the high number of EVs connected to that phase, according to Table 4.
Droop P and Droop Q control, implemented in Scenarios II and III, respectively, are decentralized single-phase controls, and they can only provide local voltage regulation for a specific phase at one specific node. Regarding voltage levels, it is observed in Figure 9 that both charging strategies contributed to raising the phase voltages in the nodes where they were providing regulation, and besides, Droop P control diminished the voltage variability. The effect of both controls on the rest of the network depended on the network topology and loading profiles, as would be expected from a decentralized control. As shown in Figure 9, Droop P control provided a significant regulation at Node R15 since it was the only node with voltages below 0.95 p.u. Hence, solely voltage levels at that node experienced a substantial improvement. On the other hand, the Droop Q control was always active, injecting reactive power in every supply node of the network with EVs connected. Thus, voltage levels in those nodes rose, as seen in Figure 9. Summarizing, the higher the Droop P regulation, the more substantial the improvement observed in voltage levels, which could be higher than the one obtained with Droop Q control.
Voltage level regulation provided by Droop P control obtained closer voltage levels in the three phases due to power curtailment in the phases with the lowest voltage levels. As a side effect, VUF could be improved. This VUF reduction can be observed in Figure 10 at Node R15, where VUF presented, after regulation, values significantly lower than the ones obtained in Scenario I, which were above the threshold of 2%. As regards Droop Q control, even though reactive power was injected in every phase, this contribution did not take into account the voltage level of the three phases, so it was unable to diminish VUF.
4.3. Scenarios IV, V, and VI: Three-Phase Controls
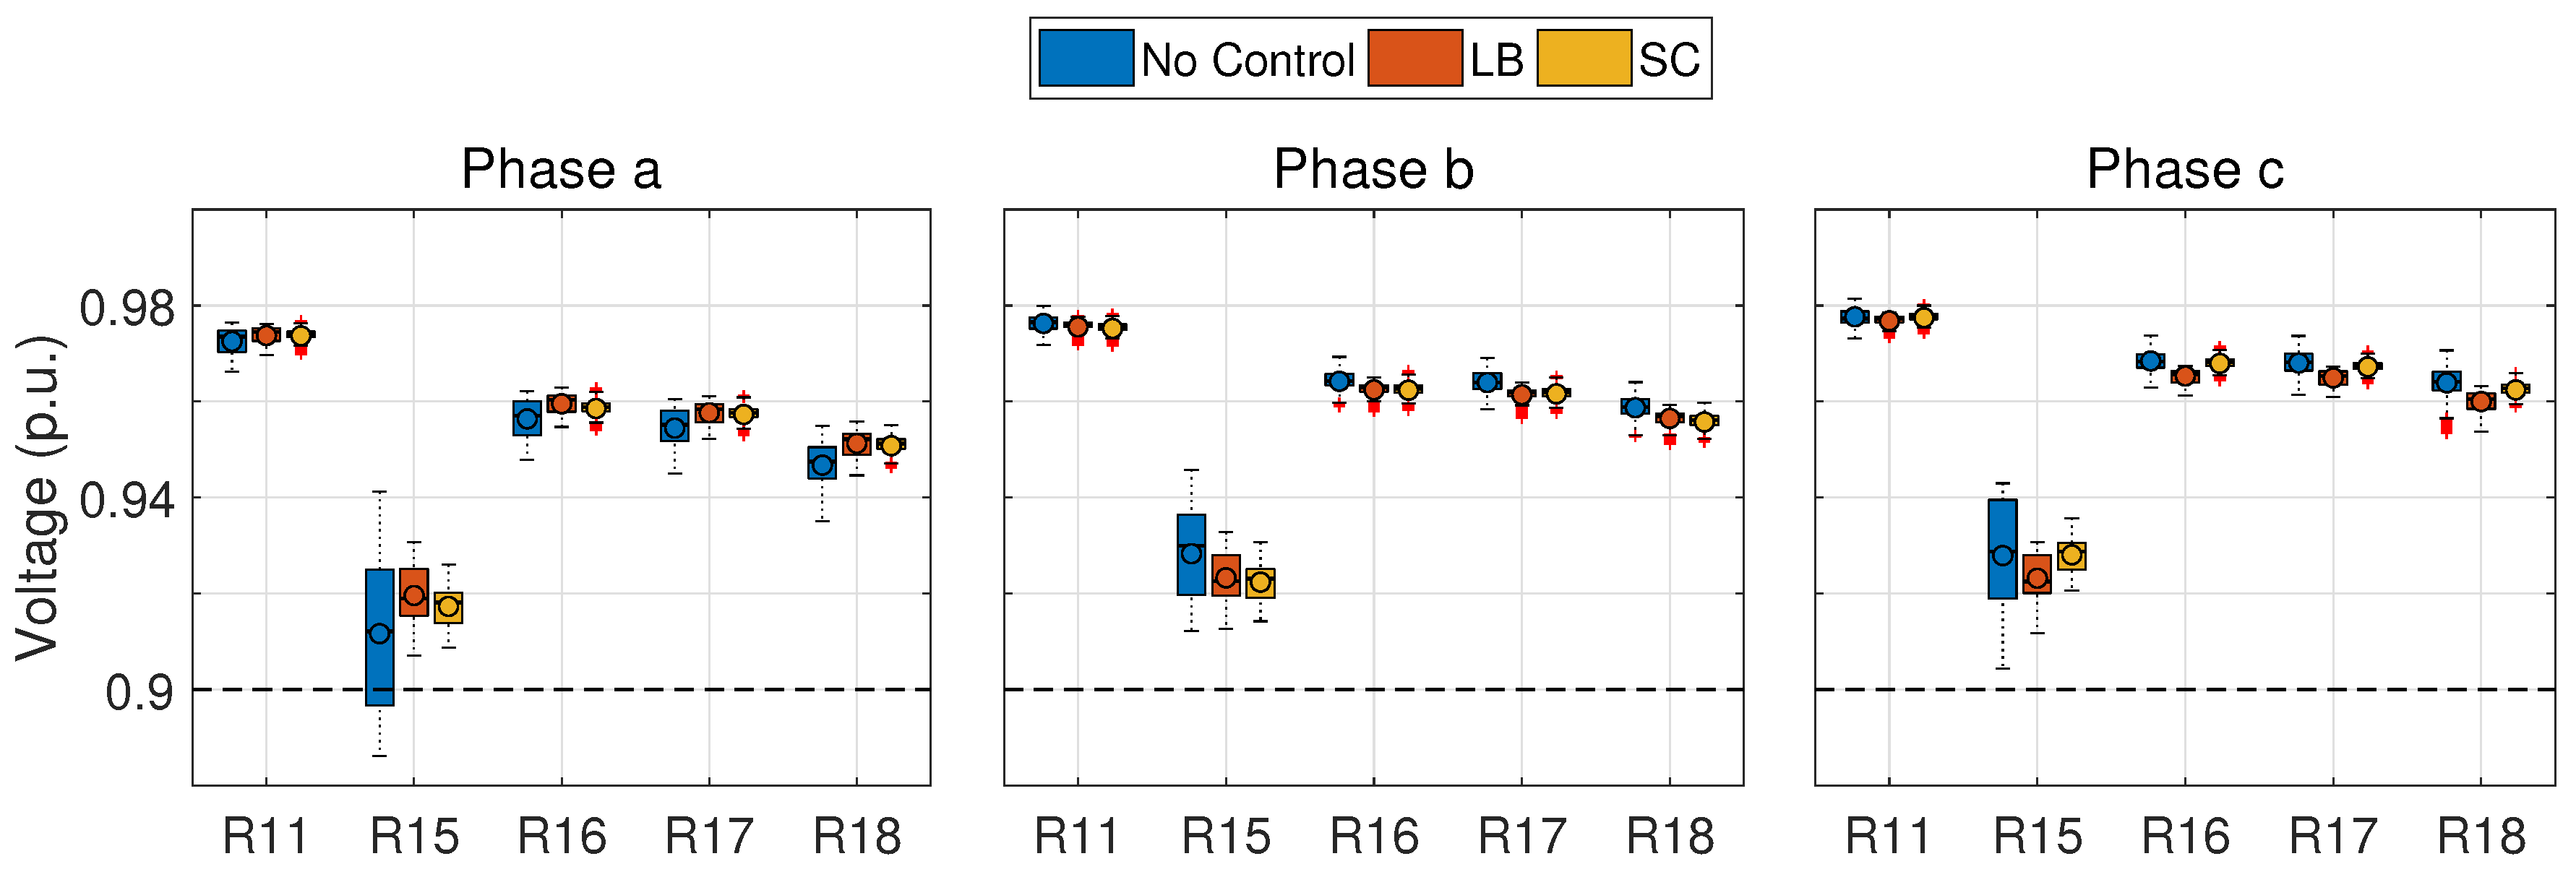
Results for Scenarios IV and V are presented in Figure 11 and Figure 12. As happened for the single-phase controls’ comparison, Phase b and Phase c voltages obtained with uncontrolled charging for Scenario IV remained within the desirable limits during the simulated period, while Phase a voltages at Node R15 reached values below the minimum threshold. Apart from that phase voltage, the remaining voltages of the network did not present the under-voltage condition.
Both LB and SC control were three-phase decentralized controls, and they were aimed at mitigating VUF. Results displayed in Figure 12 show that the VUF reduction achieved with the two charging controls was noticeably high and similar for both controls. LB control mitigated VUF by balancing the active power between the three phases of each node, while SC control eliminated the negative and zero components of the household consumption current by injecting/absorbing reactive power. Hence, neither of the controls provided voltage level regulation, as is shown in Figure 11. If desired, this voltage level regulation can be implemented in LB control through reactive power control, which has not been used for the scenarios analyzed in this paper. However, this voltage level regulation cannot be implemented in SC control since reactive power regulation was already compromised for VUF mitigation.
4.4. Scenarios VII, VIII, IX, X, and XI: Combined Controls
Simulation results for Scenarios VII, VIII, IX, X, and XI are presented in Figure 13 and Figure 14. Scenario VII, uncontrolled charging, was considerably different with respect to the previous uncontrolled charging Scenarios I and IV. In Table 5, it is observed that Phase b and Phase c were more loaded in Scenario VII than Phase a at Node R15. Hence, Phase c at Node R15 presented voltages below 0.9 p.u. for uncontrolled charging, while Phase a and Phase b were close to that threshold.
Combining both three-phase with single-phase decentralized controls, three-phase EV chargers were aimed at VUF regulation, while single-phase EV chargers were focused on voltage-level regulation. Regarding voltage levels, the conclusion drawn from Section 4.2 (Scenarios II and III) can be applied to Scenarios VIII–XI. As seen in Figure 13, Droop P control was significantly effective in nodes where it regulated the EVs’ charging power, while Droop Q control increased the voltage levels in every node.
The aforementioned side effect of Droop P control combined with the VUF regulation of LB and SC controls achieved a huge VUF reduction. On the other hand, as Droop Q control was not able to contribute to VUF mitigation, the combination with LB and SC controls was less effective. The different results between Scenarios VIII and IX (Droop P-LB and Droop P-SC) and Scenarios X and XI (Droop Q-LB and Droop Q-SC) were due to the three-phase control regulation. SC control eliminated the negative and zero sequence components of the consumption current of the household where it was implemented. Since there was a combination of three-phase and single-phase consumptions at Nodes R15 and R18 (Table 2), SC control was unable to mitigate the node’s VUF because it did not have influence in single-phase households. On the contrary, since every household connected at each node measured the same phase voltages, LB control can compensate the single-phase controls’ effect and contribute to the VUF mitigation. In summary, in the presence of single-phase charging controls, SC control was observed to be inadequate to reduce VUF. The most relevant results are summarized in Table 6, where is the minimum voltage at Node R15 on the most loaded phase, is the mean voltage at Node R15 on the most loaded phase, and is the maximum VUF.
5. Conclusions
EVs’ increased penetration will have a great impact on Low-Voltage (LV) distribution networks, since it leads to power and voltage quality concerns. In order to mitigate the undesirable effects originated by uncontrolled EV charging, several decentralized smart charging controls have been proposed in recent years, both for three-phase and single-phase EV chargers. Trying to clarify which of the different solutions acts in a better way regarding a specific objective, this paper analyses and compares four of the most relevant smart charging controls, with the aim of reducing the VUF and avoiding under-voltage conditions. The selected controls are active power droop control (Droop P) and reactive power droop control (Droop Q) for single-phase EV chargers and Load Balancing control (LB) and Sequence Compensation control (SC) for three-phase EV chargers. Comparison and analysis were done between the two single-phase controls, between the two three-phase controls, and between a combination of Droop P-LB, Droop P-SC, Droop Q-LB, and Droop Q-SC controls. The selected controls were tested on the standardized European Low Voltage Distribution Network developed by CIGRE for the worst case scenario, i.e., 100% EV penetration during a highly-loaded and unbalanced time period.
Single-phase controls provide phase voltage regulation, since they are not able to mitigate VUF due to the lack of information about the three phases. On the other hand, three-phase controls aim to mitigate VUF, but they do not provide voltage level regulation. From the results, it was concluded that Droop P control provides a huge voltage level rise and reduces the voltage variability, although it only acts on nodes with low voltages. Furthermore, as a side effect, Droop P control balances the phase voltages and is able to reduce VUF. On the other hand, Droop Q control’s influence on voltage levels is not as noticeable as Droop P control, but it affects every node.
Regarding three-phase controls, both LB and SC controls are able to reduce VUF when every EV charger is equipped with the same charging control. Nevertheless, SC control loses effectiveness when combined with single-phase charging controls, while LB control is able to contribute to VUF mitigation in that situation.
In conclusion, the implementation of a decentralized EV charging control is an adequate solution for DSOs since it improves the reliability and security of the network. Moreover, Droop P and LB controls have been proven to be the most suitable solution for DSOs when dealing with under-voltages, due to the high improvement in voltage level at critical nodes provided by Droop P control and the better association with and contribution to VUF mitigation provided by LB control with respect to SC control. If the network experience over-voltages, Droop P control is unable to regulate voltage levels in order to be compliant with the standards. However, Droop Q control is able to regulate both over- and under-voltages due to its versatility. Hence, the control strategies selected by the DSO should take into consideration the aforementioned issues.
References
Author Contributions
Conceptualization, J.N., H.M., and R.M.d.C.; methodology, J.N., H.M., and R.M.d.C.; software, J.N.; validation, H.M., R.M.d.C., and J.R.A.; formal analysis, J.N., H.M., and R.M.d.C.; investigation, J.N., H.M., and R.M.d.C.; resources, H.M., R.M.d.C., and J.R.A.; data curation, J.N.; writing, original draft preparation, J.N., H.M., and R.M.d.C.; writing, review and editing, H.M., R.M.d.C., and J.R.A.; visualization, R.M.d.C. and J.R.A.; project administration, R.M.d.C.
Funding
This research was partially funded by the research project “SEGVAUTO-TRIES-CM. Convocatoria de Programas de I+Den Tecnología/2013 Orden 3017/2014 del 24 de septiembre, B.O.C.M.Núm. 252 del 23 de octubre de 2014. Reference: S2013/MIT-2713”.
Conflicts of Interest
The authors declare no conflict of interest.
References
- Tietge, U.; Mock, P.; Lutsey, N.; Campestrini, A. Comparison of leading electric vehicle policy and deployment in Europe. Int. Council Clean Transp. 2016, 49, 847129-102. [Google Scholar]
- Hertzke, P.; Müller, N.; Schenk, S. Dynamics in the Global Electric Vehicle-Market; McKinsey: New York, NY, USA, 2017. [Google Scholar]
- Cazzola, P.; Gorner, M.; Schuitmaker, R.; Maroney, E. Global ev Outlook 2016; International Energy Agency: Paris, France, 2016. [Google Scholar]
- Kamal, T.; Karabacak, M.; Hassan, S.; Fernández-Ramírez, L.; Riaz, M.; Khan, M.; Khan, L. Energy Management and Switching Control of PHEV Charging Stations in a Hybrid Smart Micro-Grid System. Electronics 2018, 7, 156. [Google Scholar] [CrossRef]
- Dubey, A.; Santoso, S. Electric vehicle charging on residential distribution systems: Impacts and mitigations. IEEE Access 2015, 3, 1871–1893. [Google Scholar] [CrossRef]
- Martinenas, S.; Knezović, K.; Marinelli, M. Management of power quality issues in low voltage networks using electric vehicles: Experimental validation. IEEE Trans. Power Deliv. 2017, 32, 971–979. [Google Scholar] [CrossRef]
- Farooq, S.M.; Hussain, S.; Kiran, S.; Ustun, T.S. Certificate Based Security Mechanisms in Vehicular Ad-Hoc Networks based on IEC 61850 and IEEE WAVE Standards. Electronics 2019, 8, 96. [Google Scholar] [CrossRef]
- Vaya, M.G.; Andersson, G. Centralized and decentralized approaches to smart charging of plug-in vehicles. In Proceedings of the Power and Energy Society General Meeting, San Diego, CA, USA, 22–26 July 2012; pp. 1–8. [Google Scholar]
- Richardson, P.; Flynn, D.; Keane, A. Local versus centralized charging strategies for electric vehicles in low voltage distribution systems. IEEE Trans. Smart Grid 2012, 3, 1020–1028. [Google Scholar] [CrossRef]
- Cheng, A.J.; Tarroja, B.; Shaffer, B.; Samuelsen, S. Comparing the emissions benefits of centralized vs. decentralized electric vehicle smart charging approaches: A case study of the year 2030 California electric grid. J. Power Sources 2018, 401, 175–185. [Google Scholar] [CrossRef]
- García-Villalobos, J.; Zamora, I.; Knezović, K.; Marinelli, M. Multi-objective optimization control of plug-in electric vehicles in low voltage distribution networks. Appl. Energy 2016, 180, 155–168. [Google Scholar] [CrossRef] [Green Version]
- Knezović, K.; Marinelli, M. Phase-wise enhanced voltage support from electric vehicles in a Danish low-voltage distribution grid. Electr. Power Syst. Res. 2016, 140, 274–283. [Google Scholar] [CrossRef]
- Leemput, N.; Geth, F.; Van Roy, J.; Delnooz, A.; Buscher, J.; Driesen, J. Impact of Electric Vehicle On-Board Single-Phase Charging Strategies on a Flemish residential Grid. IEEE Trans. Smart Grid 2014, 5, 1815–1822. [Google Scholar] [CrossRef]
- Huang, S.; Pillai, J.R.; Bak-Jensen, B.; Thøgersen, P. Voltage support from electric vehicles in distribution grid. In Proceedings of the 2013 15th European Conference on Power Electronics and Applications (EPE), Lille, France, 2–6 September 2013; pp. 1–8. [Google Scholar]
- Geth, F.; Leemput, N.; Van Roy, J.; Büscher, J.; Ponnette, R.; Driesen, J. Voltage droop charging of electric vehicles in a residential distribution feeder. In Proceedings of the 2012 3rd IEEE PES International Conference and Exhibition on Innovative Smart Grid Technologies (ISGT Europe), Berlin, Germany, 14–17 October 2012; pp. 1–8. [Google Scholar]
- Mendonça, H.; de Castro, R.M.; Martínez, S.; Montalbán, D. Voltage Impact of a Wave Energy Converter on an Unbalanced Distribution Grid and Corrective Actions. Sustainability 2017, 9, 1844. [Google Scholar] [CrossRef]
- Rebours, Y.G.; Kirschen, D.S.; Trotignon, M.; Rossignol, S. A survey of frequency and voltage control ancillary services—Part I: Technical features. IEEE Trans. Power Syst. 2007, 22, 350–357. [Google Scholar] [CrossRef]
- Leemput, N.; Geth, F.; Van Roy, J.; Büscher, J.; Driesen, J. Reactive power support in residential LV distribution grids through electric vehicle charging. Sustain. Energy Grids Netw. 2015, 3, 24–35. [Google Scholar] [CrossRef]
- Kisacikoglu, M.C.; Kesler, M.; Tolbert, L.M. Single-phase on-board bidirectional PEV charger for V2G reactive power operation. IEEE Trans. Smart Grid 2015, 6, 767–775. [Google Scholar] [CrossRef]
- Caldon, R.; Coppo, M.; Turri, R. Distributed voltage control strategy for LV networks with inverter-interfaced generators. Electr. Power Syst. Res. 2014, 107, 85–92. [Google Scholar] [CrossRef]
- Weckx, S.; Driesen, J. Load balancing with EV chargers and PV inverters in unbalanced distribution grids. IEEE Trans. Sustain. Energy 2015, 6, 635–643. [Google Scholar] [CrossRef]
- Freire, R.; Delgado, J.; Santos, J.M.; De Almeida, A.T. Integration of renewable energy generation with EV charging strategies to optimize grid load balancing. In Proceedings of the 13th International IEEE Conference on Intelligent Transportation Systems, Funchal, Portugal, 19–22 September 2010; pp. 392–396. [Google Scholar]
- Barsali, S.; Strunz, K.; Styczynski, Z. Benchmark Systems for Network Integration of Renewable and Distributed Energy Resources; Università Di Pisa: Pisa, Italia, 2014. [Google Scholar]
- Papathanassiou, S.; Hatziargyriou, N.; Strunz, K. A benchmark low voltage microgrid network. In Proceedings of the CIGRE Symposium: Power Systems with Dispersed Generation, Athens, Greece, 13–16 April 2005; pp. 1–8. [Google Scholar]
- Pflugradt, N.D. Modellierung von Wasser und Energieverbräuchen in Haushalten; Technische Universitat Chemnitz: Chemnitz, Germany, 2016. [Google Scholar]
- Fernández-Crehuet, J.M. La Conciliación de la Vida Profesional, Familiar y Personal; Ediciones Pirámide: Madrid, Spain, 2016. [Google Scholar]
- Alonso, M.; Amaris, H.; Germain, J.G.; Galan, J.M. Optimal charging scheduling of electric vehicles in smart grids by heuristic algorithms. Energies 2014, 7, 2449–2475. [Google Scholar] [CrossRef]
- Pillay, P.; Hofmann, P.; Manyage, M. Derating of induction motors operating with a combination of unblanced voltages and over-or under-voltages. IEEE Power Eng. Rev. 2002, 22, 51. [Google Scholar] [CrossRef]
- Markiewicz, H.; Klajn, A. Voltage disturbances standard en 50160-voltage characteristics in public distribution systems. BS EN 2004, 21, 215–224. [Google Scholar]
- Pillay, P.; Manyage, M. Definitions of voltage unbalance. IEEE Power Eng. Rev. 2001, 21, 50–51. [Google Scholar] [CrossRef]
- Bina, M.T.; Kashefi, A. Three-phase unbalance of distribution systems: Complementary analysis and experimental case study. Int. J. Electr. Power Energy Syst. 2011, 33, 817–826. [Google Scholar] [CrossRef]
Figure 1.
Modified CIGRÉEuropean Low Voltage Distribution Network Benchmark [23].
Figure 1.
Modified CIGRÉEuropean Low Voltage Distribution Network Benchmark [23].

Figure 2.
(a) Daily consumption profile at the transformer level for the residential subnetwork. (b) The residential subnetwork consumption per phase at the transformer level for the selected time period.
Figure 2.
(a) Daily consumption profile at the transformer level for the residential subnetwork. (b) The residential subnetwork consumption per phase at the transformer level for the selected time period.

Figure 3.
Nodes’ consumption per phase for the selected time period.

Figure 4.
Voltage Unbalance Factor (VUF) formula comparison.

Figure 5.
Droop curve of active power control.

Figure 6.
Droop curve of reactive power control.

Figure 7.
Load balancing control block diagram.

Figure 8.
Sequence compensation control block diagram.

Figure 9.
Voltage levels for Scenarios I, II, and III.

Figure 10.
VUF for Scenarios I, II, and III.

Figure 11.
Voltage levels for Scenarios IV, V, and VI.

Figure 12.
VUF for Scenarios IV, V, and VI.

Figure 13.
Voltage levels for Scenarios VII, VIII, IX, X, and XI.

Figure 14.
VUF for Scenarios VII, VIII, IX, X, and XI.


Table 1.
X/R ratio of each Thévenin equivalent circuit of supply points.
| Node | R11 | R15 | R16 | R17 | R18 |
|---|---|---|---|---|---|
| X/R ratio | 0.5366 | 0.2654 | 0.5257 | 0.5199 | 0.5185 |
Table 2.
Household distribution for the test network.
| Node | 1-Phase Consumptions | 3-Phase Consumptions | Apparent Power (kVA) | Power Factor | ||
|---|---|---|---|---|---|---|
| Phase a | Phase b | Phase c | ||||
| R11 | 0 | 0 | 0 | 1 | 15 | 0.95 |
| R15 | 2 | 3 | 3 | 5 | 72 | 0.95 |
| R16 | 0 | 0 | 0 | 4 | 55 | 0.95 |
| R17 | 0 | 0 | 0 | 1 | 15 | 0.95 |
| R18 | 2 | 2 | 2 | 1 | 47 | 0.95 |
Table 3.
Simulation scenarios conducted. LB, Load Balancing; SC, Sequence Compensation.
| Scenario | 3-Phase EV Chargers | 1-Phase EV Chargers | EV Charging Control |
|---|---|---|---|
| I | 0 | 26 | No Control |
| II | 0 | 26 | Droop P |
| III | 0 | 26 | Droop Q |
| IV | 26 | 0 | No Control |
| V | 26 | 0 | LB |
| VI | 26 | 0 | SC |
| VII | 12 | 14 | No Control |
| VIII | 12 | 14 | Droop P + LB |
| IX | 12 | 14 | Droop P + SC |
| X | 12 | 14 | Droop Q + LB |
| XI | 12 | 14 | Droop Q + SC |
Table 4.
Number and phase of EVs connected per node for Scenarios I, II, and III.
| Node | Phase a | Phase b | Phase c | Total per node |
|---|---|---|---|---|
| R11 | 0 | 0 | 1 | 1 |
| R15 | 5 | 4 | 4 | 13 |
| R16 | 1 | 2 | 1 | 4 |
| R17 | 0 | 1 | 0 | 1 |
| R18 | 2 | 2 | 3 | 7 |
| Total per phase | 8 | 9 | 9 |
Table 5.
Number and phase of EVs connected per node for Scenarios VII, VIII, IX, X, and XI.
| Node | Phase a | Phase b | Phase c | 3-Phase | Total per Node |
|---|---|---|---|---|---|
| R11 | 0 | 0 | 0 | 1 | 1 |
| R15 | 2 | 3 | 3 | 5 | 13 |
| R16 | 0 | 0 | 0 | 4 | 4 |
| R17 | 0 | 0 | 0 | 1 | 1 |
| R18 | 2 | 2 | 2 | 1 | 7 |
| Total per phase | 4 | 5 | 5 | 12 |
Table 6.
Summarized results for the scenarios conducted.
| Scenario | EV Charging Control | (p.u.) | (p.u.) | (%) |
|---|---|---|---|---|
| I | No Control | 0.872 | 0.898 | 3.707 |
| II | Droop P | 0.911 | 0.931 | 0.865 |
| III | Droop Q | 0.882 | 0.908 | 3.384 |
| IV | No Control | 0.886 | 0.912 | 2.561 |
| V | LB | 0.907 | 0.919 | 0.753 |
| VI | SC | 0.909 | 0.917 | 0.554 |
| VII | No Control | 0.895 | 0.919 | 2.373 |
| VIII | Droop P + LB | 0.919 | 0.931 | 0.727 |
| IX | Droop P + SC | 0.917 | 0.932 | 0.799 |
| X | Droop Q + LB | 0.912 | 0.927 | 1.248 |
| XI | Droop Q + SC | 0.907 | 0.929 | 2.116 |
© 2019 by the authors. Licensee MDPI, Basel, Switzerland. This article is an open access article distributed under the terms and conditions of the Creative Commons Attribution (CC BY) license (http://creativecommons.org/licenses/by/4.0/).
Share and Cite
MDPI and ACS Style
Nájera, J.; Mendonça, H.; de Castro, R.M.; Arribas, J.R. Strategies Comparison for Voltage Unbalance Mitigation in LV Distribution Networks Using EV Chargers. Electronics 2019, 8, 289. https://doi.org/10.3390/electronics8030289
AMA Style
Nájera J, Mendonça H, de Castro RM, Arribas JR. Strategies Comparison for Voltage Unbalance Mitigation in LV Distribution Networks Using EV Chargers. Electronics. 2019; 8(3):289. https://doi.org/10.3390/electronics8030289
Chicago/Turabian StyleNájera, Jorge, Hugo Mendonça, Rosa M. de Castro, and Jaime R. Arribas. 2019. "Strategies Comparison for Voltage Unbalance Mitigation in LV Distribution Networks Using EV Chargers" Electronics 8, no. 3: 289. https://doi.org/10.3390/electronics8030289
Note that from the first issue of 2016, this journal uses article numbers instead of page numbers. See further details here.