Indoor Localization Method Based on Regional Division with IFCM

1
School of Computer Science and Engineering, Xi’an University of Technology, Xi’an 710048, China
2
Shaanxi Key Laboratory for Network Computing and Security Technology, Xi’an 710048, China
*
Authors to whom correspondence should be addressed.
Electronics 2019, 8(5), 559; https://doi.org/10.3390/electronics8050559
Submission received: 9 April 2019
/
Revised: 15 May 2019
/
Accepted: 16 May 2019
/
Published: 20 May 2019
(This article belongs to the Section Microwave and Wireless Communications)
Abstract
:With the development of wireless technology, indoor localization has gained wide attention. The fingerprint localization method is proposed in this paper, which is divided into two phases: offline training and online positioning. In offline training phase, the Improved Fuzzy C-means (IFCM) algorithm is proposed for regional division. The Between-Within Proportion (BWP) index is selected to divide fingerprint database, which can ensure the result of regional division consistent with the building plane structure. Moreover, the Agglomerative Nesting (AGNES) algorithm is applied to accomplish Access Point (AP) optimization. In the online positioning phase, sub-region selection is performed by nearest neighbor algorithm, then the Weighted K-nearest Neighbor (WKNN) algorithm based on Pearson Correlation Coefficient (PCC) is utilized to locate the target point. After the evaluation on the effect of regional division and AP optimization of location precision and time, the experiments show that the average positioning error is 2.53 m and the average computation time of the localization algorithm based on PCC reduced by 94.13%.
1. Introduction
With the continuous development of wireless communication technology and ubiquitous computing in recent years, as well as the growing demand for Location Based Services (LBS) [1], wireless positioning technology has become more widely used. LBS provides accurate location information for areas such as traffic navigation, medical assistance, logistics transportation and smart city construction [2,3]. Traditional global positioning system (GPS) and base station positioning technologies can provide more accurate outdoor location estimation. However, GPS signals cannot penetrate well in complex and varied indoor environments [4]. At the same time, the application of indoor positioning to LBS is more and more promising, and the requirement for positioning accuracy is getting higher and higher.
There are many wireless technologies for indoor positioning research, such as Bluetooth [5,6], UltraWide Band [7,8], ZigBee [9], infrared [10], radio-frequency identification (RFID) [11,12], wireless local area networks (WLAN) [13,14], and so on. Due to the wide coverage of the WLAN in the indoor environment, the access standard is unified, the received signal strength is stable, and the WLAN signal is covered in various occasions, such as hospitals, supermarkets, airports, etc. The Wi-Fi fingerprint localization has become a research hotspot in the field of indoor positioning [15,16].
At present, the fingerprint localization method is commonly used in the Wi-Fi indoor positioning method. The Wi-Fi location fingerprint [17,18] is a positioning technique without the need for ranging, it utilizes a certain mapping relationship between Received Signal Strength (RSS) and physical location. Usually, Wi-Fi fingerprint localization includes two phases: offline training phase and online localization phase. In the offline training phase, a series of reference points are set in the target area and wireless signal samples are collected, finally a fingerprint database is established by using the location information of the reference point and the RSS information of the corresponding Access Point (AP). In the online positioning phase, the RSS information of each AP collected in real time is compared with the existing information in the fingerprint database, and the matching algorithm is used to perform matching calculation to estimate the current location of the user. In complex environments, the fingerprint localization performs better than the range-based method [19]. The ranging method based on time-of-flight (TOF) [20] is linear with distance, so the result will be more accurate. However, it suffers from outliers, coverage and dependency of AP deployment geometry.
Wi-Fi fingerprint localization can satisfy the needs of users for indoor location information services in most cases. However, the fingerprint localization has a large amount of fingerprint data and high fingerprint dimension. A large number of Access Points (APs) can be detected in indoor environment with wide Wi-Fi coverage. Generally, the more APs in the location area, the higher the accuracy of positioning. However, due to the complexity of the indoor environment, such as Non Line of Sight (NLOS) [21], object occlusion, multipath effect and people walking, not all APs are beneficial to improving positioning accuracy. Excessive APs will increase the fingerprint dimension, resulting in increased calculation and energy consumption. Therefore, selecting the appropriate subset AP to reduce the fingerprint dimension, reduce the workload of establishing a fingerprint database, and improve fingerprint matching efficiency and positioning accuracy are important research topics based on fingerprint localization. At the same time, the proposed sub-region division reduces the computation of Wi-Fi fingerprint localization technology.
To solve the problem of huge databases, while still achieving high localization accuracy, this paper proposes an indoor positioning method based on regional division with the Improved Fuzzy C-means (IFCM), and uses the AGNES algorithm to realize AP optimization. AP optimization is the process of selecting a small subset of available APs. The IFCM algorithm is an improvement of the FCM algorithm. It introduces the K-means clustering algorithm and the Between-Within Proportion (BWP) index to select the optimal initial clustering center and the number of clusters. In this way, we can reduce the amount of calculation of the fingerprint matching algorithm and improve the real-time performance of the algorithm. In the offline training phase, according to the idea of hierarchical and regional division, the fingerprint database is layered until the number of reference points (including two categories: the initial reference points chosen to collect RSS artificially, and the virtual reference points obtained through some calculations) in each sub-region is less than a set threshold. Then, the AGNES algorithm is used to optimize the APs in each sub-region, and the APs with strong discriminating ability is selected to reduce the fingerprint dimension. In online positioning phase, the nearest neighbor algorithm is used to select the sub-region closest to the target point, then the target location is estimated according to WKNN algorithm based on PCC. To verify the validity of the experiment, it is compared with Euclidean distance and Spearman correlation coefficient.
2. Related Work
A variety of fingerprint-based indoor positioning technologies have been proposed in recent years. In surveying the related work, we considered three different aspects, namely, the fingerprint localization work, regional division work and AP selection work.
2.1. Fingerprint Localization Method
During the last decade, indoor positioning technology has developed rapidly. Radio detection and ranging (RADAR) system [22] was first proposed by Microsoft Research as an RSS-based WLAN indoor positioning system. Because of the wide deployment of Wi-Fi devices and the popularity of smart mobile terminals, this method has attracted wide attention. Prasithsangaree et al. [23] have improved the RADAR system. They used the WKNN method to calculate the location, which improves the positioning accuracy and applies the location system to complex indoor environment. Niu et al. [24] used the K-nearest Neighbor (KNN) classification method with three different weighted distances and found that the KNN algorithm with the Manhattan distance performed best. Mirowski et al. [25] used Kullback-Leibler (KL) divergence to calculate the similarity among fingerprints, performing localization through kernel function regression. The Wireless Indoor Logical Localization (WILL) system studied by Liu et al. [26] combined the location information of sensor data and RSS data to build fingerprint database. The system does not need to collect RSS data at a specified location, so it can be quickly deployed and applied. Khalajmehrabadi et al. [27] proposed a sparse reconstruction model based on Least Absolute Shrinkage and Selection Operator (LASSO) and Elastic-net Regularized Generalized Linear Models (GLMNET). These schemes render a sparse user’s position vector, and minimize the distance between the online measurement and radio map in parallel. Gu et al. [28] proposed a fingerprint construction method based on compressive sensing. Although the experiment proved that only 5% fingerprint data can have accurate positioning, it greatly reduced the workload of fingerprint acquisition while ensuring the localization accuracy. The LiFS indoor positioning system proposed by Wang et al. [29] does not need to construct an offline fingerprint database. It can realize passive positioning by sensing the change of channel state information (CSI) in WLAN, and at the same time, it can localize at a high accuracy. Wang et al. [30] also proposed a deep-learning-based indoor fingerprinting system using channel state information (CSI), which is termed DeepFi. In [31], a convolutional neural network was proposed that uses only one access point channel state information, and achieves an average positioning error of 1.36 m, but has a high training complexity. On the contrary, a low computational complexity model was proposed in [32], which shows a positioning error of 2.1 m. In this model, RSS and direction information are combined by the C4.5-based AdaBoost algorithm to improve the accuracy of indoor positioning. Crowdsourcing [33,34] can provide sufficient fingerprint updates for indoor LBS. However, in some cases, prompting users to upload their collected signal data may be inconvenient. Literature [35] proposed Localization with Altered APs and Fingerprint Updating (LAAFU) system, fingerprint updating and investigation reduction using implicit crowdsourced signals. Literature [36] proposed a weighted algorithm based on the physical distance of RSSI, which considers the uneven spatial resolution of Wi-Fi RSSI, and the positioning accuracy is significantly better than KNN, EWKNN, Euclidian-W-KNN, LiFS and other traditional indoor positioning algorithms.
2.2. Regional Division
In the process of fingerprint localization, the fingerprint database is clustered in the offline phase, and the localization region is divided into several sub-regions according to the clustering results. Each sub-region corresponds to a sub-fingerprint database. The clustering of the fingerprint database can effectively shorten the location matching time and improve the positioning efficiency. In [37], the authors proposed a Wi-Fi fingerprint clustering method based on the K-means method and an output floor estimation method for various positioning sensors. Because Euclidean distance is used to calculate the RSS similarity, the clustering results for linear inseparable data are not good. Sun et al. [38] combine FCM clustering with KNN algorithm and propose KNN-FCM hybrid location algorithm. Because the initial clustering center of FCM is randomly initialized, the clustering effect is easily affected. In addition, He [39] proposed a regional division method based on Voronoi graph. Voronoi graph is constructed with initial reference points as generating points, and the virtual reference points are partitioned into the nearest Voronoi region.
2.3. AP Selection Method
Because of the wide deployment of WLAN, a large number of AP signals can be detected in indoor environments. However, there are many interference factors, such as the multipath effect, object occlusion, and human movement, in indoor environment, AP signals will not be useful for positioning, and excessive APs will increase the dimension of fingerprint and the complexity of location calculation [40]. Therefore, selecting a proper subset from APs plays a very important role in positioning. In [41], an AP selection strategy was proposed based on online mutual information, which computes the mutual information between different AP combinations. The AP optimization process can provide real-time positioning information even when the environment changes dynamically. Reference [42] used principal component analysis (PCA) to map the RSS of online measurements to the principal component for localization. This method is not to select the AP subset, but to select an effective principal component subset to reduce the fingerprint dimension so as to reduce the computational complexity. Reference [43] proposed an AP selection strategy based on Group Discriminant (GD), which evaluates the GD value through the risk function of the SVM. At the same time, a method based on recursive feature elimination is proposed to reduce the complexity of GD.
3. Fingerprint Localization Method
With the increasing number of fingerprints, the time required for location is longer. To solve the problem of low positioning efficiency caused by the huge amount of fingerprint data, a clustering method is introduced. To reduce the fingerprint dimension and further reduce the computation time, AP optimization method was introduced. The fingerprint localization is shown in Figure 1, which is divided into two phases: offline training and online positioning.
In the offline training phase, fingerprint database is formed by collecting fingerprint at reference points, and then the fingerprint database is divided into different layers by using IFCM algorithm until the number of fingerprints in each sub-region is lower than the set threshold, and then the AP in the sub-region is optimized by the AGNES algorithm. The whole fingerprint map is divided into several sub-regions, each of sub-region contains a cluster center for region selection.
In the online positioning phase, the RSS value of each AP is collected at the target location. Then, the nearest neighbor algorithm is used to continuously match the cluster centers of each layer sub-region until the last layer of the branch is matched, the nearest sub-region of the clustering center is selected as the target region. Finally, the coordinates of the target point are calculated by the WKNN algorithm based on PCC.
3.1. Offline Training Phase
In this section, we discuss the regional division method based on IFCM algorithm in Section 3.1.1. Section 3.1.2 shows the AP optimization process.
3.1.1. Regional Division
The fingerprint database is clustered based on IFCM algorithm, according to the clustering results, the target region is divided into several sub-regions, each sub-region corresponds to a sub-region fingerprint database. We first introduce the BWP index, and then we describe the method of regional division details.
(1) The BWP Index
The BWP index [44] reflects the clustering effect of a sample. The larger the BWP value, the higher the similarity in inner-class, and the lower the similarity in inter-class, the better the clustering effect. The BWP index is applied to the K-means algorithm to determine the optimal number of clusters. To better divide the fingerprint database into sub-regions, we use the BWP index and select the clustering number corresponding to the largest BWP index value as the optimal number of clusters. The relevant definitions of BWP index are as follows:
Let the clustering space be R, the sample be , the number of clusters be k.
Definition 1.
The inter-class distanceis defined as the minimum value of the average distance from the i-th sample in the j-th class to each other class, i.e.,
where s and j represent class labels;represent the i-th sample in the j-th class;represent the p-th sample in the s-th class;represent the number of samples in the s-th class.
Definition 2.
The inner-class distance isdefined as the average distance from the i-th sample in the j-th class to all other samples in the class, i.e.,
where:represents the q-th sample in the j-th class, and,represents the number of samples in the j-th class.
Definition 3.
The BWP index for the i-th sample in the j-th class is defined as
In Formula (4),indicates the average BWP index when the number of clusters is k. In the Formula (5),indicates the maximum value of BWP and the optimal number of clusters.
(2) Regional Division Based on the IFCM Algorithm
As a soft partitioning clustering algorithm, the FCM algorithm has wide applications. Nevertheless, there are still some drawbacks. For example, random selection of initial cluster center may cause the high computational complexity and affect the clustering results; the number of clusters needs to be determined in advance to perform clustering.
The initialization of cluster center V has an important influence on the clustering speed of FCM algorithm. Therefore, this paper improves the FCM algorithm from two aspects: determining the optimal number of clusters and initializing the cluster center. K-means clustering algorithm (K-means algorithm) is a kind of hard clustering algorithm. Its principle is simple, the computation time is short, and the clustering is fast. In most cases, the final clustering center is close to the clustering center of the FCM algorithm. Therefore, we first use the K-means algorithm to cluster, then the BWP index is calculated to select the optimal number of clusters. The K-means clustering center corresponding to the optimal number of clusters is used as the initial clustering center of FCM algorithm. This method can reduce the number of iterations of FCM algorithm and improve its convergence speed. This is what we call the Improved FCM algorithm (IFCM).
The IFCM algorithm is used to carry out hierarchical clustering of fingerprint database, and finally the fingerprint database is divided into k sub-classes. Each sub-class contains a cluster center, which represents the characteristics of the class and is used for region matching in online phase. The data set to be divided is F, 1 < i < p, 1 < j < q, there are p reference points and q APs. The specific steps of the algorithm are:
- Determine the number range of clustering .
- K-means algorithm is used for clustering, then the average BWP index values of samples were calculated under the number of clusters .
- Select the cluster number corresponding to the largest BWP index as the best clustering number C and the initial cluster center , is the j-th RSS value, and is the i-th cluster center, initialize weighting coefficient m = 2, the iterative stop threshold is ε, the iteration counter l = 0.
- Update the membership matrix according to the following formula [45]:
- Update the clustering center according to the following formula [45]:
- Determine whether the algorithm stops executing. If , let , jump to step 2 to continue this iteration. If , stop the current iteration, and the cluster center V and the membership matrix U are output.
- Determine whether the number of reference points of the sub-region is less than a threshold. If it is less than the threshold, the iteration stops completely; if it is greater than the threshold, then it jumps to step 3 to perform the next layer division.
The IFCM-based regional division method is shown in Figure 2.
The structure of the regional division is shown in Figure 3. It can be seen that the whole fingerprint database is divided into several hierarchical sub-regions, similar to a tree structure, and the lowest layer of each branch is the reference point.
3.1.2. AP Optimization
Figure 4a shows the RSS distribution of 65 APs at three optional reference points. It can be seen that most of the RSS values are −99 dBm, and only a very small portion of the RSS value is useful. In general, the more RSS values, the higher the positioning accuracy. However, it is found that not all RSS values are beneficial to improve positioning accuracy. On the contrary, if all RSS values are used for positioning calculation, not only the fingerprint dimension will be increased, but also increase the calculation complexity. From reference [46], we can see that increasing the number of available APs beyond five does not improve the performance dramatically. Therefore, in order to reduce the fingerprint dimension and further reduce the complexity, this paper introduces the AP optimization method. Figure 4b shows that APs are divided into two categories: valid and invalid.
The AGNES algorithm is to aggregate a given data object into several classes according to certain rules at different stages, so that the data in inner-class has greater similarity, while the data in inter-class has smaller similarity. Therefore, we use the AGNES algorithm to divide APs into two categories. The basic idea is: first of all, each sample is a class, calculating the distance among the classes, merging the two classes with the smallest distance, and then recalculating the distance among the classes, repeating the steps until all the samples are aggregated into the required number. In this paper, the average distance method is used to calculate the distance among classes, that is, to calculate the distance between all the elements of one class and all the elements of the other class, and the average of these distances is taken as the distance between the two classes. The specific AP classification steps are as follows:
- Classify each RSS value into one class and calculate the distance between each two classes. The average distance method is used to calculate the distance between classes;
- Find the two nearest RSS values and classify them as one class;
- Recalculate the distance between each class;
- Repeat steps 2 and 3 until RSS values are divided into two classes, output AP optimal results.
The AP optimization method based on AGNES is shown in Algorithm 1.
| Algorithm 1 AP optimization |
| 1: Get all RSS values D = , initialize k = N. |
| 2: Make each RSS value in the data set D a cluster, marked as {, , …, }. |
| 3: Repeat |
| 4: Compute all pair-wise distances of clusters {, , …, }. |
| 5: Select min{}. |
| 6: Merge the two clusters with the smallest distance. |
| 7: Form a new cluster {,, …, {,}, …, CN}, set k = N − 1. |
| 8: Until k = 2 |
3.2. Online Localization Phase
3.2.1. Sub-Region Selection
In the online localization phase, firstly, the nearest neighbor algorithm is used to compare the fingerprint of the target point with the cluster center of each sub-region, until the last layer of the branch, and select the area of the nearest cluster center in the last layer as the target area.
The cluster center of each sub-region is , the RSS sample of the target point is , then the distance between the cluster center and the location of target point can be expressed as:
Choose the class corresponding to as the region of the target point location in the current level, and continue to select the sub-regions until you reach the last level.
3.2.2. Positioning Match
Once the sub-region is determined, the positioning match will be carried out according to the reference points in the sub-region. The traditional WKNN algorithm uses Euclidean distance to measure the similarity between the RSS of the target point and the data in the fingerprint database. This paper introduces PCC and Spearman correlation coefficient, and compares the positioning accuracy of WKNN algorithm based on Euclidean distance, PCC and Spearman correlation coefficient.
Considering the algorithm complexity and location precision, we choose Euclidean distance. Assuming that there are m APs and n reference points in the location area, the distance between the target point and i-th point is expressed in Euclidean distance as follows:
where Tj represents the RSS value of the j-th AP in the online RSS sample, Sij represents the RSS value of the j-th AP at i-th reference point in the fingerprint database.
Select k reference points nearest to the RSS sample of the target point in the fingerprint database, and the coordinates of the target point are calculated as follows:
The PCC [47] between the target point and i-th reference point is calculated by (12):
The Spearman correlation coefficient [48] between the target point and i-th reference point is calculated by (13) and (14):
The online RSS sample T traverses the N fingerprints in the sub-region fingerprint database, and finds Euclidean distance, PCC and Spearman correlation coefficient among the fingerprints, and selects the top k reference points with the highest similarity. When PCC and Spearman correlation coefficients are used as similarity coefficients, each reference point weight is calculated by and instead of the equation (10), and then the coordinates of the target point are calculated.
The localization method based on PCC is shown in Algorithm 2.
| Algorithm 2. Localization Method |
| Input: , , T denotes the RSS sample of the target point, . denotes the cluster center of each sub-region. |
| Output: the coordinates of the target point. |
| Step1: Select the sub-region |
| 1.1 do while ( ø) |
| 1.2 Calculate the distance between cluster center and the target location. |
| 1.3 Select min{} corresponding class as the region of the target location. |
| 1.4 Update under the region. |
| 1.5 Endwhile |
| Step2: Calculate the coordinate |
| 2.1 Calculate the PCC between target fingerprint and fingerprint of each reference point. |
| 2.2 Select k maximum PCC. |
| 2.3 k PCC are used as weights to calculate coordinates (x,y). |
4. Experimental Analysis
In the experiment, two datasets were used: one was a public dataset from the Institute of Applied Computer Systems, Riga Technical University [49], and the second was composed of initial reference points fingerprint and virtual reference points fingerprint. The WLAN positioning dataset was applied in this experiment, and the experimental area is shown in Figure 5. The experimental area, including 12 rooms and corridors, is about 860 m2, and it is located on the 5th floor of the teaching building. The rooms include laboratories, offices and classrooms. The five APs (red square) are arranged in the experimental area, and reference points may perceive the APs of other floors close to the experimental area, and may also perceive some APs outside the experimental area. The location of each AP in the experiment is unknown. A total of 82 initial fingerprint reference points (blue points) are deployed in the experimental environment with an interval of about 5 m. At each reference point, the amount of APs can be perceived ranges from 3 to 13. In the experimental environment, there are 65 perceptible APs.
4.1. Regional Division Result
According to the method of regional division in this paper, the data in the fingerprint database is divided hierarchically until the number of reference points in the sub-region is less than the threshold, and the threshold is 12 in this experiment. The regional division structure is shown in Figure 6, the fingerprint database is initially divided into three sub-regions, Z1, Z2 and Z3, followed by hierarchical division, and finally the entire experimental area is divided into 21 sub-regions. In the last layer of each branch, the number of reference points is indicated.
In Table 1, Table 2, Table 3, Table 4, Table 5 and Table 6, the BWP index with the clustering numbers at different layers is shown respectively, and the number of clusters with the largest BWP index is selected as the optimal number of clusters.
After the regional division, the distribution of all reference points is shown in Figure 7. Compared with Figure 5, it can be seen that the division results are roughly consistent with the experimental area, that is, reference points are divided according to the layout of rooms and corridors, and only a small number of reference points are inconsistent with the layout of the experimental environment. Three reference points that are not consistent with the layout of experimental environment are marked with rectangle, as shown in Figure 7.
4.2. The Effect of Regional Division on Location Precision and Time
We randomly selected 68 test points distributed in different regions. First, the IFCN algorithm is used to cluster the fingerprint database, and then WKNN (k is the number of reference points in each sub-region) algorithm based on Euclidean distance, PCC and Spearman coefficient is utilized to calculate the target location.
Figure 8a–c shows the cumulative error probability of WKNN algorithm based on Euclidean distance, PCC and Spearman coefficient before and after regional division. The horizontal axis represents the localization error distance, and the vertical axis represents the probability of error. As shown in Figure 8a, the probability of error is 0.19 and 0.06 when distance of error is less than 1 m. It is shown that under the same probability of error, the distance of error with regional division is smaller than with no regional division. Under the same distance of error, the cumulative error probability after regional division is larger than that after regional division. Therefore, it can be concluded that the location accuracy is improved after regional division.
Finally, we compare the location accuracy of WKNN algorithm based on three different fingerprint similarities. Figure 8d shows that the performance of PCC is similar to Euclidean distance, better than Spearman coefficient. It can be seen that the WKNN algorithm based on PCC is superior to others.
The statistics of the positioning time before and after regional division are shown in Table 7. The average computation time of WKNN algorithm based on Euclidean distance, PCC and Spearman coefficient is 1.61 × 10⁻⁴ s, 1.58 × 10⁻² s and 2.4 × 10⁻² s before regional division. The average computation time of these three algorithms after regional division is 5.16 × 10⁻⁵ s, 1.80 × 10⁻³ s and 1.30 × 10⁻³ s, which is shorter than 67.95%, 88.61% and 94.58%, respectively.
4.3. The Effect of AP Optimization on Location Precision and Time
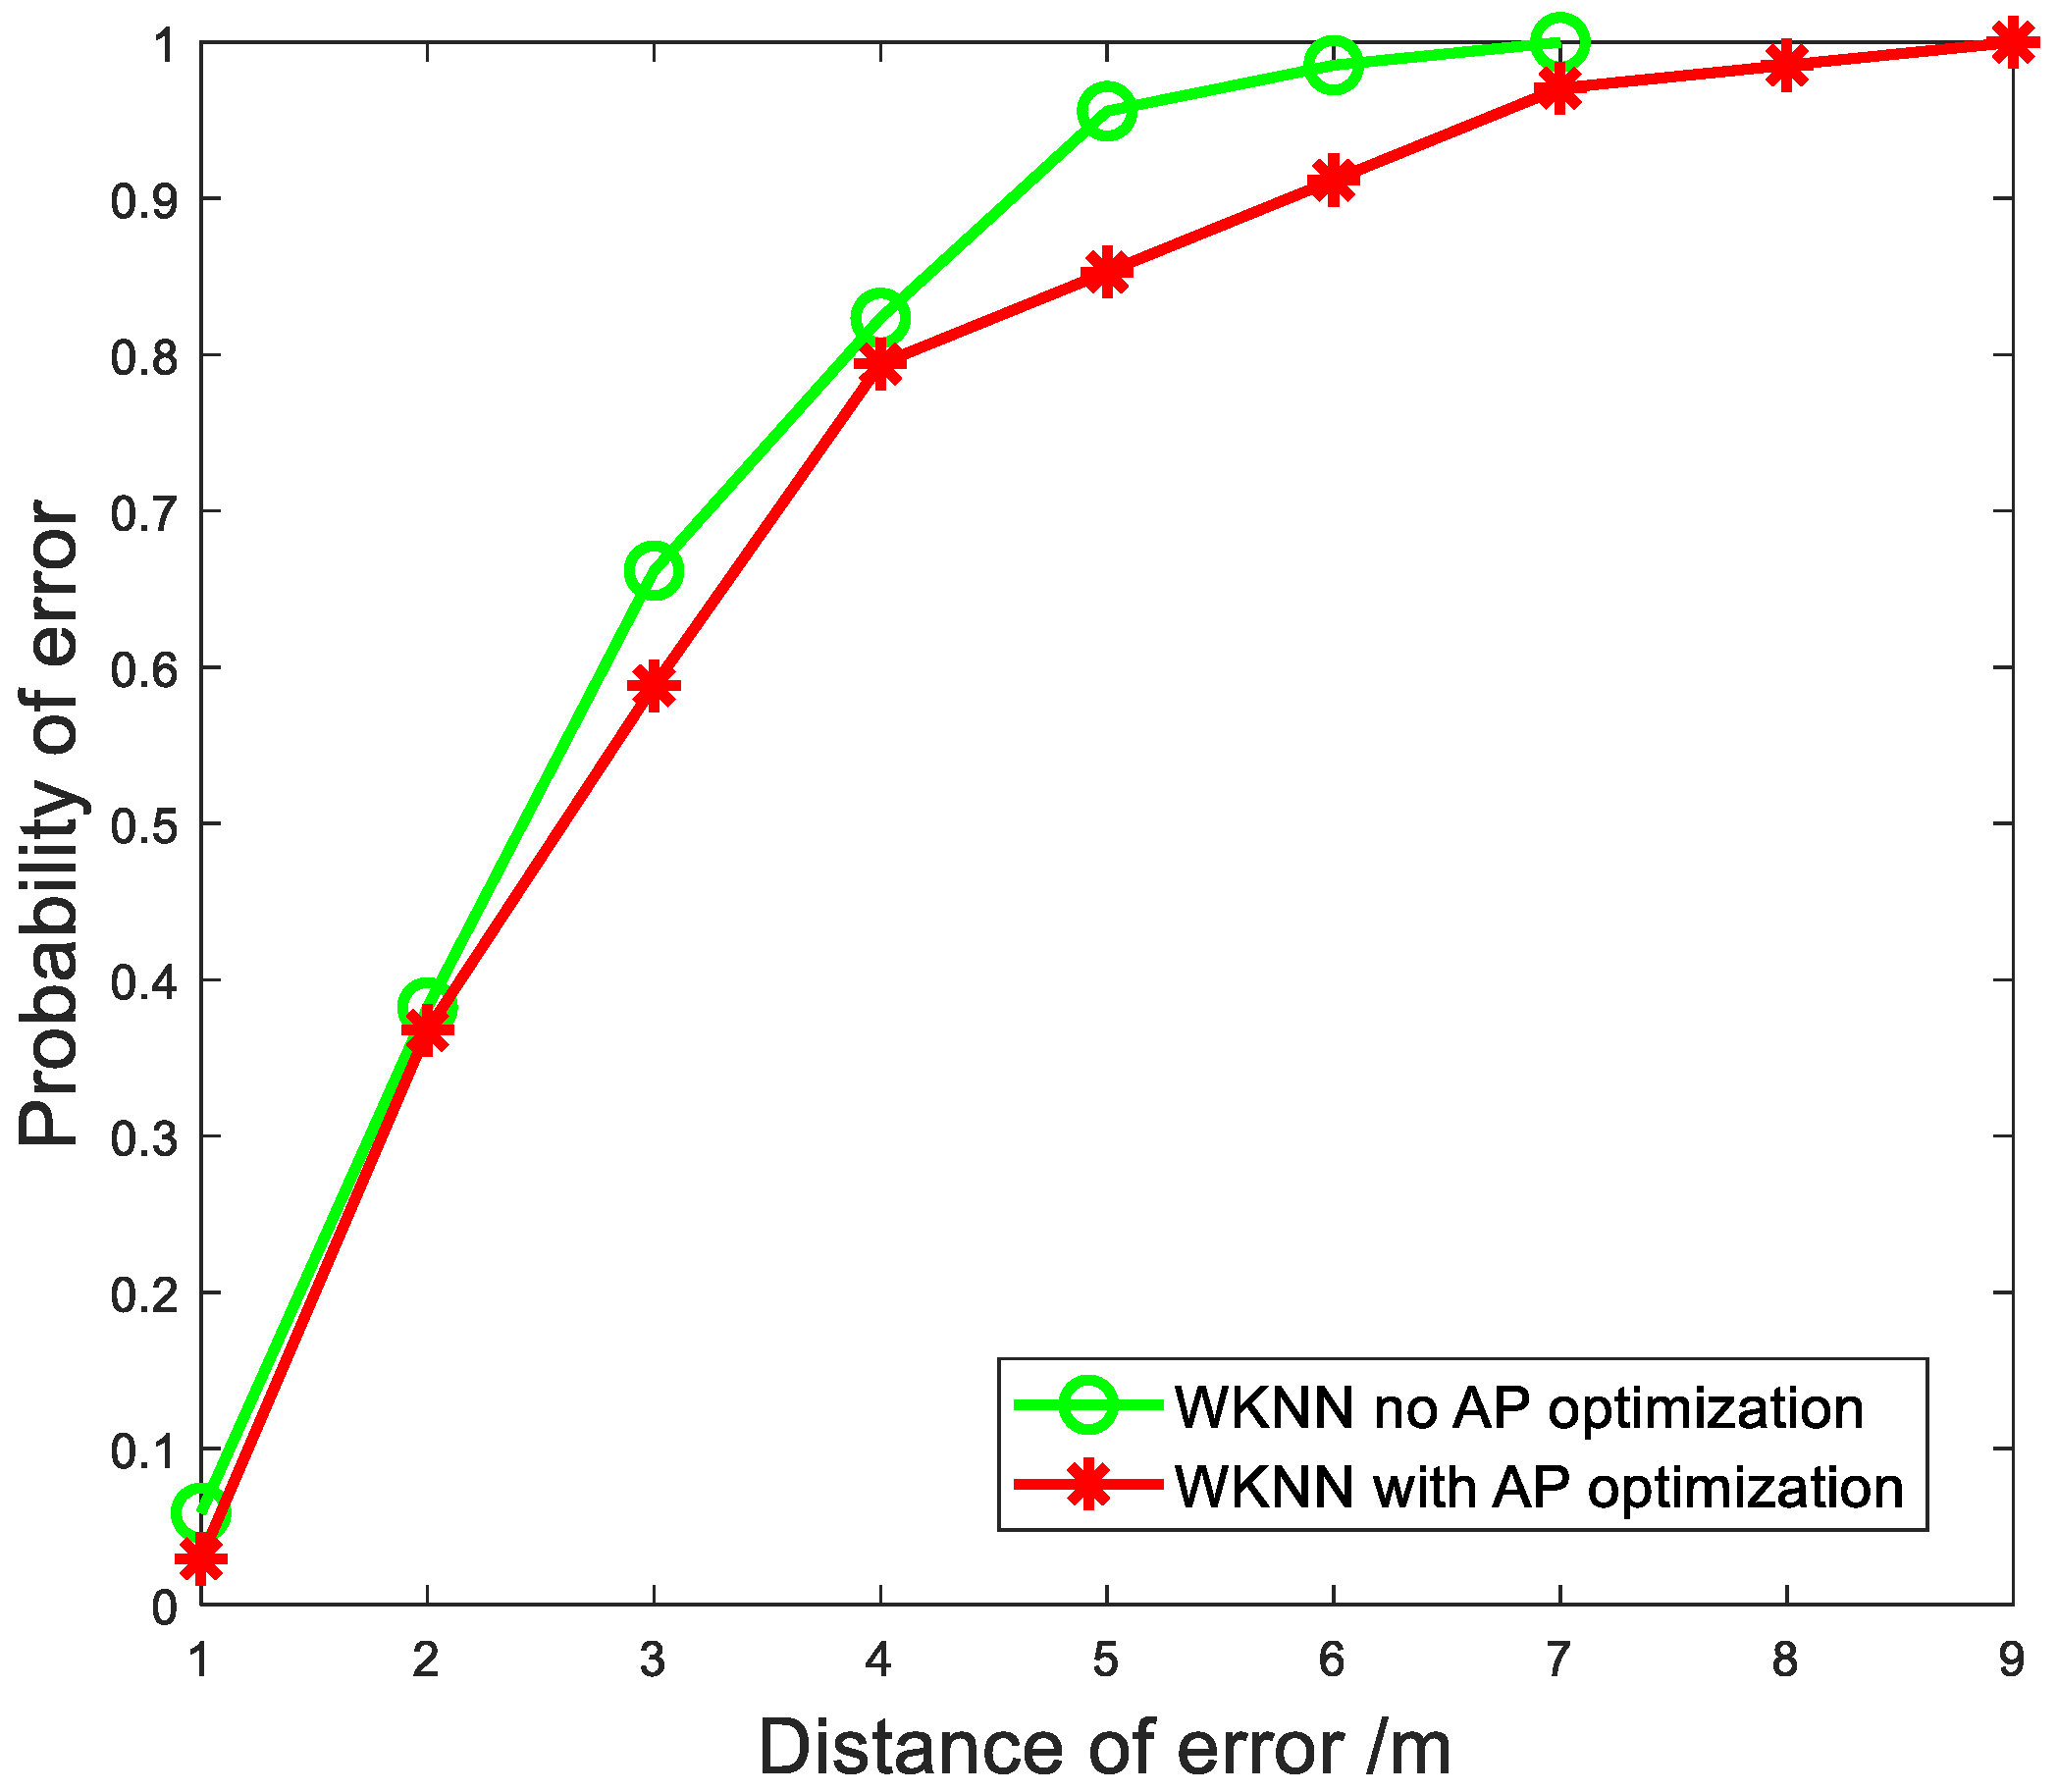
There are 151 reference points in the experimental environment. The number of perceptible APs at each reference point is different, and the unavailable RSS value is defined as −99 dbm. Taking RSS value as the feature, the AGNES algorithm is used to divide the AP into two categories, and then the WKNN algorithm (k is the number of reference points in each sub-region) is used for positioning calculation. The cumulative error probability before regional division is shown in Figure 9. It can be seen that the positioning accuracy with no AP optimization is higher than that of AP optimization. The main reason is that AP varies greatly in different regions, the process did not take into account the regional differences, resulting in effective APs is excluded.
Since the detection of APs varies greatly in different regions, we then perform AP optimization for each sub-region. As shown in Figure 10, after AP optimization, the number of AP in most sub-regions is reduced to 4–7, averaging 5 AP.
Figure 11 shows the positioning accuracy of WKNN algorithm based on Euclidean distance, PCC and Spearman coefficient before and after AP optimization in each sub-region. The positioning accuracy of the WKNN algorithm based on Euclidean distance and PCC is 7 m before and after AP optimization, the positioning accuracy of WKNN algorithm based on Spearman is 1 m higher than that before AP optimization. It can be seen that the positioning accuracy of the three algorithms changes little before and after AP optimization; however, after AP optimization, the fingerprint dimension decreased significantly and the computation time decreased.
Figure 12 shows the cumulative error probability of WKNN algorithm based on three different fingerprint similarities after AP optimization. It can be seen that the error probability of these three algorithms reaches 100% when the error distance is 7 m, that is, the positioning accuracy is 7 m. When the error probability is greater than 90%, the WKNN algorithm based on PCC has higher positioning accuracy than WKNN algorithm based on Euclidean distance and Spearman coefficient.
Through the AP optimization, in the process of location calculation, the average number of AP in each sub-region decreased from 65 to 5, reduced by 92.31%. In Table 8, when there is no AP preference in the sub-region, the average computation time of WKNN algorithm based on Euclidean distance, PCC and Spearman coefficient is 5.16 × 10⁻⁵ s, 1.80 × 10⁻³ s and 1.30 × 10⁻³ s, respectively. After AP optimization in the sub-region, the average calculation time of these three algorithms is 4.61 × 10⁻⁵ s, 9.27 × 10⁻⁴ s and 1.20 × 10⁻³ s, which are decreased by 10.66%, 48.50% and 7.69%, respectively. However, because of the small number of reference points in each sub-region, the time did not decrease significantly.
By AP optimization in the sub-region, the fingerprint dimension is greatly reduced and the positioning accuracy is improved, and the average computing time of WKNN algorithm based on PCC is the least.
Now let us compare the position accuracy with other three well known indoor positioning methods (KNN [24], WKNN [23], FCM [36]). From the results displayed in Figure 13, we can see that the proposed algorithm outperforms the other three algorithms. We calculate the mean error, the median error, the root-mean-square-error (RMSE), the maximum error distance and the error distance within 90% to compare the positioning accuracy of the four methods. As is shown in Table 9, we can see that the proposed method produces a 90th percentile error of 4.2 m, which is better than the 4.6 m, 4.6 m and 5.6 m of KNN, WKNN and FCM. The mean error of we proposed method is 2.4 m, which is lower than the 2.8 m, 2.5 m, 3.4 m of KNN, WKNN and FCM. It is a good positioning accuracy when considering the error distance is 4 m.
In addition, the factors affecting positioning accuracy also include the orientation and the calibration time. Different orientations have some influence on the RSS values, and then affect the positioning accuracy. Theoretically, the orientation information can improve the location accuracy in many studies. However, in reference [49], the availability of orientation information could not increase the positioning accuracy. The reason for this could be the evident signal strength fluctuations. Generally speaking, when the calibration time increases, the positioning error will decrease. In reference [46], when the calibration time is about 30 seconds, the estimation can be significantly improved. The location error changes slightly after 30 seconds. Therefore, the calibration time of 30 seconds in the public dataset is very reasonable.
5. Conclusions and Future Work
To reduce the positioning time and improve the positioning accuracy, we proposed a fingerprint localization method based on regional division with IFCM. The obtained results show that the average computation time of the localization algorithm based on PCC can be reduced by 94.13% (from 1.58 × 10⁻² s to 9.27 × 10⁻⁴ s), and the positioning accuracy was improved from 9 m to 7 m. In offline phase, since the FCM algorithm needs to determine the number of clusters in advance, and the cluster center is randomly initialized, we apply BWP index to K-means algorithm in order to improve the clustering speed and clustering effect. In online phase, due to the enormous APs may produce similar calculations, leading to excessive fingerprint dimension and biased estimate, so the AGNES algorithm is used to optimize the AP. The average number of AP in each sub-region decreased by 92.31% (from 65 to 5). The experimental results show that the localization error of 97% of fingerprints is under 5 m and the average localization error is 2.53 m, which implies that our proposed method is effective.
Although this paper aims at solving the problems of high fingerprint dimension and long matching time in fingerprint localization, there are still other problems to be solved, such as the deployment of APs will also affect the RSS value, thus affecting the positioning accuracy. Therefore, how to optimize the deployment strategy of APs according to the actual environment to maximize the discrimination of fingerprints in each region is a valuable research direction.
Author Contributions
Conceptualization, J.L.; methodology, J.L., X.G., Z.H.; validation, J.L., X.G., Z.H., T.C., H.W. and L.Y.; investigation, J.L., X.G., Z.H.; writing—review and editing, J.L., X.G., Z.H., T.C.
Funding
This research was funded by the National Key Research and Development Plan (No. 2017YFB 1402103), Natural Science Foundation of China (No. 61771387), Scientific Research Program of Shaanxi Province (2018HJCG-05, 2016KTZDNY01-06,), Project of Xi’an science and technology planning foundation (201805037YD15CG21(4)), CERNET Innovation Project (No. NGII20160704).
Acknowledgments
The authors are grateful for the anonymous reviewers who made constructive comments.
Conflicts of Interest
The authors declare no conflict of interest.
References
- Zou, D.; Meng, W.; Han, S.; He, K.; Zhang, Z. Toward Ubiquitous LBS: Multi-Radio Localization and Seamless Positioning. IEEE Wirel. Commun. 2016, 23, 107–113. [Google Scholar] [CrossRef]
- Alletto, S.; Cucchiara, R.; Fiore, G.D.; Mainetti, L.; Mighali, V.; Patrono, L.; Serra, G. An Indoor Location-Aware System for an IoT-Based Smart Museum. IEEE Int. Things J. 2016, 3, 244–253. [Google Scholar] [CrossRef]
- Kurniawan, B.; Pranoto, H. Destination Information System for Bandung City Using Location-Based Services (LBS) on Android. IOP Conf. Ser. Mater. Sci. Eng. 2018, 306, 012016. [Google Scholar] [CrossRef]
- Khalajmehrabadi, A.; Gatsis, N.; Akopian, D. Modern WLAN Fingerprinting Indoor Positioning Methods and Deployment Challenges. IEEE Commun. Surv. Tutor. 2017, 19, 1974–2002. [Google Scholar] [CrossRef] [Green Version]
- Rida, M.E.; Liu, F.; Jadi, Y.; Algawhari, A.A.A.; Askourih, A. Indoor Location Position Based on Bluetooth Signal Strength. In Proceedings of the International Conference on Information Science and Control Engineering, Shanghai, China, 24–26 April 2015; pp. 769–773. [Google Scholar]
- Huh, J.H.; Seo, K. An Indoor Location-Based Control System Using Bluetooth Beacons for IoT Systems. Sensors 2017, 17, 2917. [Google Scholar] [CrossRef] [PubMed]
- Segura, M.; Mut, V.; Sisterna, C. Ultra-Wideband Indoor Navigation System. IET Radar Sonar Navig. 2012, 6, 402–411. [Google Scholar] [CrossRef]
- Kaniewski, P.; Kazubek, J.; Kraszewski, T. Application of UWB Modules in Indoor Navigation System. In Proceedings of the IEEE International Conference on Microwaves, Antennas, Communications and Electronic Systems, Tel-Aviv, Israel, 13–15 November 2018. [Google Scholar]
- Janicka, J.; Rapinski, J. An Example and Analysis for Ambiguity Resolution in the Indoor ZigBee Positioning System. Rep. Geod. Geoinform. 2017, 103, 1–9. [Google Scholar] [CrossRef] [Green Version]
- Wu, C.; Zhu, M.; Zhang, Y. The Design and Implementation of an Infrared Indoor Positioning and Lighting System. In Proceedings of the Advanced Information Technology, Electronic and Automation Control Conference, Chongqing, China, 25–26 march 2017. [Google Scholar]
- Seco, F.; Jiménez, A.R. Smartphone-Based Cooperative Indoor Localization with RFID Technology. Sensors 2018, 18, 266. [Google Scholar] [CrossRef]
- Liu, F.; Zhong, D. GSOS-ELM: An RFID-Based Indoor Localization System Using GSO Method and Semi-Supervised Online Sequential ELM. Sensors 2018, 18, 1995. [Google Scholar] [CrossRef] [PubMed]
- Tian, X.; Li, W.; Yang, Y.; Zhang, Z.; Wang, X. Optimization of Fingerprints Reporting Strategy for WLAN Indoor Localization. IEEE Trans. Mob. Comput. 2018, 17, 390–403. [Google Scholar] [CrossRef]
- Laitinen, E.; Lohan, E.S. Are all the Access Points necessary in WLAN-based indoor positioning? In Proceedings of the International Conference on Localization and GNSS, Gothenburg, Sweden, 22–24 June 2015. [Google Scholar]
- He, S.; Chan, S.H.G. Wi-Fi Fingerprint-Based Indoor Positioning: Recent Advances and Comparisons. IEEE Commun. Surv. Tutor. 2016, 18, 466–490. [Google Scholar] [CrossRef]
- Guo, X.; Li, L.; Ansari, N.; Liao, B. Accurate WiFi Localization by Fusing a Group of Fingerprints via Global Fusion Profile. IEEE Trans. Veh. Technol. 2018, 67, 7314–7325. [Google Scholar] [CrossRef]
- Jun, J.; He, L.; Gu, Y.; Jiang, W.; Kushwaha, G.; Vipin, A.; Cheng, L.; Liu, C.; Zhu, T. Low-Overhead WiFi Fingerprinting. IEEE Trans. Mob. Comput. 2018, 17, 590–603. [Google Scholar] [CrossRef]
- Li, W.; Wei, D.; Yuan, H.; Ouyang, G. A Novel Method of WiFi Fingerprint Positioning Using Spatial Multi-Points Matching. In Proceedings of the International Conference on Indoor Positioning and Indoor Navigation, Alcala de Henares, Spain, 4–7 October 2016; pp. 1–8. [Google Scholar]
- Guo, X.; Shao, S.; Ansari, N.; Khreishah, A. Indoor Localization Using Visible Light via Fusion of Multiple Classifiers. IEEE Photonics J. 2017, 9, 1–16. [Google Scholar] [CrossRef]
- Schatzberg, U.; Banin, L.; Amizur, Y. Enhanced WiFi ToF Indoor Positioning System with MEMS-Based INS and Pedometric Information. In Proceedings of the 2014 IEEE/ION Position, Location and Navigation Symposium—PLANS 2014, Monterey, CA, USA, 5–8 May 2014; pp. 185–192. [Google Scholar]
- Arnau, J.; Atzeni, I.; Kountouris, M. Impact of LOS/NLOS Propagation and Path Loss in Ultra-Dense Cellular Networks. In Proceedings of the 2016 IEEE International Conference on Communications (ICC), Kuala Lumpur, Malaysia, 22–27 May 2016. [Google Scholar]
- Bahl, P.; Padmanabhan, V.N. RADAR: An In-Building RF-Based User Location and Tracking System. In Proceedings of the IEEE Infocom 2000. Conference on Computer Communications, Nineteenth Annual Joint Conference of the IEEE Computer and Communications Societies, Tel Aviv, Israel, 26–30 March 2000; pp. 775–784. [Google Scholar]
- Prasithsangaree, P.; Krishnamurthy, P.; Chrysanthis, P.K. On Indoor Position Location with Wireless LANs. In Proceedings of the IEEE International Symposium on Personal, Pavilhao Altantico, Lisboa, 18 September 2002. [Google Scholar]
- Niu, J.; Wang, B.; Shu, L.; Duong, T.Q.; Chen, Y. ZIL: An Energy-Efficient Indoor Localization System Using ZigBee Radio to Detect WiFi Fingerprints. IEEE J. Sel. Areas Commun. 2015, 33, 1431–1442. [Google Scholar] [CrossRef]
- Mirowski, P.; Steck, H.; Whiting, P.; Palaniappan, R.; MacDonald, M.; Ho, T.K. KL-Divergence Kernel Regression for Non-Gaussian Fingerprint Based Localization. In Proceedings of the International Conference on Indoor Positioning and Indoor Navigation, Guimaraes, Portugal, 21–23 September 2011; pp. 1–10. [Google Scholar]
- Wu, C.; Yang, Z.; Liu, Y.; Xi, W. WILL: Wireless Indoor Localization without Site Survey. IEEE Trans. Parallel Distrib. Syst. 2013, 24, 839–848. [Google Scholar] [Green Version]
- Khalajmehrabadi, A.; Gatsis, N.; Pack, D.; Akopian, D. A Joint Indoor WLAN Localization and Outlier Detection Scheme Using LASSO and Elastic-Net Optimization Techniques. IEEE Trans. Mob. Comput. 2017, 16, 2079–2092. [Google Scholar] [CrossRef] [Green Version]
- Gu, Z.; Chen, Z.; Zhang, Y.; Zhu, Y.; Lu, M.; Chen, A. Reducing Fingerprint Collection for Indoor Localization. Comput. Commun. 2016, 83, 56–63. [Google Scholar] [CrossRef]
- Wang, J.; Jiang, H.; Xiong, J.; Jamieson, K.; Chen, X.; Fang, D.; Xie, B. LiFS: Low Human-Effort, Device-Free Localization with Fine-Grained Subcarrier Information. In Proceedings of the International Conference on Mobile Computing and Networking, New York, NY, USA, 3–7 October 2016; pp. 243–256. [Google Scholar]
- Wang, X.; Gao, L.; Mao, S.; Pandey, S. CSI-Based Fingerprinting for Indoor Localization: A Deep Learning Approach. IEEE Trans. Veh. Technol. 2017, 66, 763–776. [Google Scholar] [CrossRef]
- Chen, H.; Zhang, Y.; Li, W.; Tao, X.; Zhang, P. ConFi: Convolutional Neural Networks Based Indoor Wi-Fi Localization Using Channel State Information. IEEE Access 2017, 5, 18066–18074. [Google Scholar] [CrossRef]
- Sanchez-Rodriguez, D.; Hernandez-Morera, P.; Quinteiro, J.M.; Alonso-Gonzalez, I. A Low Complexity System Based on Multiple Weighted Decision Trees for Indoor Localization. Sensors 2015, 15, 14809–14829. [Google Scholar] [CrossRef] [PubMed] [Green Version]
- Wang, B.; Chen, Q.; Yang, L.T.; Chao, H.C. Indoor Smartphone Localization Via Fingerprint Crowdsourcing: Challenges and Approaches. IEEE Wirel. Commun. 2016, 23, 82–89. [Google Scholar] [CrossRef]
- Zhuang, Y.; Syed, Z.; Li, Y.; EI-Sheimy, N. Evaluation of Two WiFi Positioning Systems Based on Autonomous Crowdsourcing of Handheld Devices for Indoor Navigation. IEEE Trans. Mob. Comput. 2016, 15, 1982–1995. [Google Scholar] [CrossRef]
- He, S.; Lin, W.; Chan SH, G. Indoor Localization and Automatic Fingerprint Update with Altered AP Signals. IEEE Trans. Mob. Comput. 2017, 16, 1897–1910. [Google Scholar] [CrossRef]
- Xue, W.; Hua, X.; Li, Q.; Yu, K.; Qiu, W.; Zhou, B.; Cheng, K. A New Weighted Algorithm Based on the Uneven Spatial Resolution of RSSI for Indoor Localization. IEEE Access 2018, 6, 26588–26595. [Google Scholar] [CrossRef]
- Razavi, A.; Valkama, M.; Lohan, E.S. K-Means Fingerprint Clustering for Low-Complexity Floor Estimation in Indoor Mobile Localization. In Proceedings of the GLOBECOM Workshops, San Diego, CA, USA, 6–10 December 2015. [Google Scholar]
- Sun, Y.; Xu, Y.; Ma, L.; Deng, Z. KNN-FCM Hybrid Algorithm for Indoor Location in WLAN. In Proceedings of the Power Electronics and Intelligent Transportation System, Shenzhen, China, 19–20 December 2009; pp. 251–254. [Google Scholar]
- He, C.; Guo, S.; Wu, Y.; Yang, Y. A novel radio map construction method to reduce collection effort for indoor localization. Measurement 2016, 94, 423–431. [Google Scholar] [CrossRef]
- Laitinen, E.; Lohan, E.S. On the Choice of Access Point Selection Criterion and Other Position Estimation Characteristics for WLAN-Based Indoor Positioning. Sensors 2016, 16, 737. [Google Scholar] [CrossRef] [PubMed]
- Zou, H.; Luo, Y.; Lu, X.; Jiang, H.; Xie, L. A Mutual Information Based Online Access Point Selection Strategy for WiFi Indoor Localization. In Proceedings of the IEEE International Conference on Automation Science and Engineering, Gothenburg, Sweden, 24–28 August 2015; pp. 180–185. [Google Scholar]
- Fang, S.H.; Lin, T. Principal Component Localization in Indoor WLAN Environments. IEEE Trans. Mob. Comput. 2012, 11, 100–110. [Google Scholar] [CrossRef]
- Lin, T.N.; Fang, S.H.; Tseng, W.H.; Lee, C.W.; Hsieh, J.W. A Group-Discrimination-Based Access Point Selection for WLAN Fingerprinting Localization. IEEE Trans. Veh. Technol. 2014, 63, 3967–3976. [Google Scholar] [CrossRef]
- Zhou, S.B.; Xu, Z.Y.; Tang, X.Q. Method for Determining Optimal Number of Clusters in K-Means Clustering Algorithm. J. Comput. Appl. 2010, 30, 1995–1998. [Google Scholar] [CrossRef]
- Suroso, D.J.; Cherntanomwong, P.; Sooraksa, P.; Takada, J. Fingerprint-Based Technique for Indoor Localization in Wireless Sensor Networks Using Fuzzy C-Means Clustering Algorithm. In Proceedings of the International Symposium on Intelligent Signal Processing & Communications Systems, Chiang Mai, Thailand, 7–9 December 2012. [Google Scholar]
- Honkavirta, V.; Perala, T.; Ali-Loytty, S.; Piche, R. A Comparative Survey of WLAN Location Fingerprinting Methods. In Proceedings of the Workshop on Positioning, Hannover, Germany, 19 March 2009. [Google Scholar]
- Chen, G.; Liu, Q.; Wei, Y.; Yu, Q. An Efficient Indoor Location System in WLAN Based on Database Partition and Euclidean Distance-Weighted Pearson Correlation Coefficient. In Proceedings of the IEEE International Conference on Computer & Communications, Chengdu, China, 14–17 October 2017. [Google Scholar]
- Mehta, D.S.; Chen, S. A Spearman Correlation Based Star Pattern Recognition. In Proceedings of the 2017 IEEE International Conference on Image Processing (ICIP), Beijing, China, 17–20 September 2017; pp. 4372–4376. [Google Scholar]
- Jekabsons, G.; Zuravlyov, V. Refining Wi-Fi Based Indoor Positioning. In Proceedings of the International Scientific Conference Applied Information and Communication Technologies, Jelgava, Latvia, 22–23 April 2010; pp. 87–95. [Google Scholar]
Figure 1.
Fingerprint localization method.

Figure 2.
Regional division based on IFCM.

Figure 3.
Structure of regional division.

Figure 4.
Distribution of RSS: (a) at different reference points, (b) at valid and invalid reference points.
Figure 4.
Distribution of RSS: (a) at different reference points, (b) at valid and invalid reference points.

Figure 5.
Layout of experiment context.

Figure 6.
Result of regional division.

Figure 7.
Effect of regional division.

Figure 8.
Probability of error: (a) Euclidean distance, (b) PCC, (c) Spearman coefficient, (d) Regional division.
Figure 8.
Probability of error: (a) Euclidean distance, (b) PCC, (c) Spearman coefficient, (d) Regional division.

Figure 9.
Probability of error of WKNN algorithm.

Figure 10.
Statistics of AP optimization in sub-regions.

Figure 11.
Comparison of positioning accuracy.

Figure 12.
Probability of error.

Figure 13.
Comparison of positioning error in terms of CDF.


Table 1.
BWP index of all reference points with different number of clusters.
| Clustering Number | 2 | 3 | 4 | 5 | 6 | 7 | 8 | 9 | 10 | 11 |
| BWP | 0.2407 | 0.2940 | 0.2632 | 0.2620 | 0.2514 | 0.2453 | 0.2459 | 0.2406 | 0.2581 | 0.2568 |
| Clustering Number | 12 | 13 | 14 | 15 | 16 | 17 | 18 | 19 | 20 | 21 |
| BWP | 0.2516 | 0.2524 | 0.2612 | 0.2453 | 0.2552 | 0.2494 | 0.2401 | 0.2383 | 0.2426 | 0.2239 |
Table 2.
BWP index of Z1 with different number of clusters.
| Clustering Number | 2 | 3 | 4 | 5 | 6 | 7 | 8 | 9 | 10 |
| BWP | 0.2787 | 0.2772 | 0.2752 | 0.2301 | 0.2444 | 0.2242 | 0.2178 | 0.2018 | 0.2013 |
Table 3.
BWP index of Z2 with different number of clusters.
| Clustering Number | 2 | 3 | 4 | 5 | 6 | 7 | 8 | 9 | 10 |
| BWP | 0.2326 | 0.2487 | 0.2493 | 0.2406 | 0.2506 | 0.2772 | 0.2817 | 0.2733 | 0.2610 |
Table 4.
BWP index of Z3 with different number of clusters.
| Clustering Number | 2 | 3 | 4 | 5 | 6 | 7 |
| BWP | 0.2453 | 0.2186 | 0.2095 | 0.2423 | 0.2422 | 0.2194 |
Table 5.
BWP index of Z11, Z12, Z112 and Z31 with different number of clusters.
| Area | Clustering Number | ||||
|---|---|---|---|---|---|
| 2 | 3 | 4 | 5 | 6 | |
| Z11 | 0.2753 | 0.1849 | 0.2188 | 0.2132 | 0.1723 |
| Z12 | 0.2538 | 0.3199 | 0.2445 | 0.2383 | 0.2307 |
| Z112 | 0.2307 | 0.2195 | 0.1677 | 0.1427 | 0.1103 |
| Z31 | 0.2723 | 0.2577 | 0.2833 | 0.2183 | 0.1496 |
Table 6.
BWP index of Z32 with different number of clusters.
| Clustering Number | 2 | 3 |
| BWP | 0.1500 | 0.2187 |
Table 7.
Time statistics before and after regional division.
| Algorithm | No Regional Division | Regional Division |
|---|---|---|
| Euclidean | 1.61 × 10⁻⁴ s | 5.16 × 10⁻⁵ s |
| Pearson | 1.58 × 10⁻² s | 1.80 × 10⁻³ s |
| Spearman | 2.4 × 10⁻² s | 1.30 × 10⁻³ s |
Table 8.
Time statistics before and after AP optimization.
| Algorithm | No AP Optimization | AP Optimization |
|---|---|---|
| Euclidean | 5.16 × 10⁻⁵ s | 4.61 × 10⁻⁵ s |
| Pearson | 1.80 × 10⁻³ s | 9.27 × 10⁻⁴ s |
| Spearman | 1.30 × 10⁻³ s | 1.20 × 10⁻³ s |
Table 9.
Comparison of positioning error.
| Algorithm | Mean Error (m) | Median (m) | RMSE (m) | Max (m) | 90th (m) |
|---|---|---|---|---|---|
| KNN | 2.8 | 2.5 | 3.1 | 8 | 4.6 |
| WKNN | 2.5 | 2.3 | 2.9 | 7 | 4.6 |
| FCM | 3.4 | 3.2 | 3.8 | 9 | 5.6 |
| we proposed | 2.4 | 2.4 | 2.8 | 7 | 4.2 |
© 2019 by the authors. Licensee MDPI, Basel, Switzerland. This article is an open access article distributed under the terms and conditions of the Creative Commons Attribution (CC BY) license (http://creativecommons.org/licenses/by/4.0/).
Share and Cite
MDPI and ACS Style
Li, J.; Gao, X.; Hu, Z.; Wang, H.; Cao, T.; Yu, L. Indoor Localization Method Based on Regional Division with IFCM. Electronics 2019, 8, 559. https://doi.org/10.3390/electronics8050559
AMA Style
Li J, Gao X, Hu Z, Wang H, Cao T, Yu L. Indoor Localization Method Based on Regional Division with IFCM. Electronics. 2019; 8(5):559. https://doi.org/10.3390/electronics8050559
Chicago/Turabian StyleLi, Junhuai, Xixi Gao, Zhiyong Hu, Huaijun Wang, Ting Cao, and Lei Yu. 2019. "Indoor Localization Method Based on Regional Division with IFCM" Electronics 8, no. 5: 559. https://doi.org/10.3390/electronics8050559
Note that from the first issue of 2016, this journal uses article numbers instead of page numbers. See further details here.