Limitations of Harmonics Control in Power Converters


Faculty of Electrical Engineering, University of Ljubljana, Tržaška 25, SI-1000 Ljubljana, Slovenia
*
Author to whom correspondence should be addressed.
Electronics 2019, 8(7), 739; https://doi.org/10.3390/electronics8070739
Submission received: 30 May 2019
/
Revised: 21 June 2019
/
Accepted: 26 June 2019
/
Published: 29 June 2019
(This article belongs to the Section Power Electronics)
Abstract
:In this paper, we analyze the constraints of harmonics control in power electronic systems. Based on an equivalent circuit of a typical power converter application and its parameters, we have derived an analytical expression for calculating the maximal amplitude of controlled harmonic current. This expression has been successfully verified on an experimental setup, designed around a single-phase grid-connected bidirectional inverter. The pulse width modulated (PWM) driven inverter has been controlled by multiple resonant controllers, each of them providing individual control of a selected harmonic current. By using the derived expression and taking into account the parameters of converter application, power electronics designers could quickly determine the limitations of harmonics control.
1. Introduction
Control algorithms in power electronics devices often include harmonics control. Many power converter applications require its implementation due to harmonics emission regulations [1,2], while others use it to improve efficiency [3]. Satisfactory results can be achieved only by advanced types of controllers that are usually implemented into the current control loop, e.g., resonant, multiple resonant, or repetitive controllers. Typical applications requiring a mitigation of harmonics are grid-connected in single-phase [4] and three-phase pulse width modulated (PWM) inverters [5,6], photovoltaic systems [7], uninterruptable power supplies [8,9], active power filters [10,11,12], and microgrids [13]. Moreover, harmonics control is used in permanent magnet synchronous machine drives to reduce torque ripple, to compensate for dead-time effects [14,15], or to improve efficiency [3].
While studies present various modifications or new approaches [4,13,16,17], all of them evaluate proposed solutions through comparison with other methods, instead of evaluating absolute performance. The current spectra or total harmonic distortion (THD) are compared in steady-state; the approach with the lowest harmonic content is deemed better. The absolute results were never discussed. Thus the methods, which should theoretically completely eliminate certain harmonics (e.g., proportional-resonant PR with multiple resonant controllers MRC in [18], H∞ repetitive control in [13], etc.), fail to do so without further comments by the authors. While in some cases additional harmonics can be caused due to the dead-time effects or output filter resonance, these two cases have been studied in detail and their effects and mitigations are well known [4,19]. In rare occasions when the authors noted the difference between the theoretical limits of their approach and measured results, these discrepancies were disregarded as either having a low enough amplitude [20,21,22] or occuring above the frequency band of interest [23]. The effects of output filters on the system performance have only been studied for passive devices [24].
In order to design a system able to suppress or generate specific harmonics, a multitude of system parameters must be evaluated. This paper focuses on limitations of current harmonics control in a single-phase grid-connected bidirectional inverter, i.e., the capability of a system to control particular harmonics at a given converter DC link voltage. An analytical expression for calculating the maximal amplitude of individually controlled current harmonic will be derived, taking into account circuit parameters and converter operating conditions. Based on this expression, all system parameters (DC-link voltage level, output filter parameters, dead time, etc.) could be determined in such a way that physical limitations of the harmonics control are not exceeded.
2. Methodology
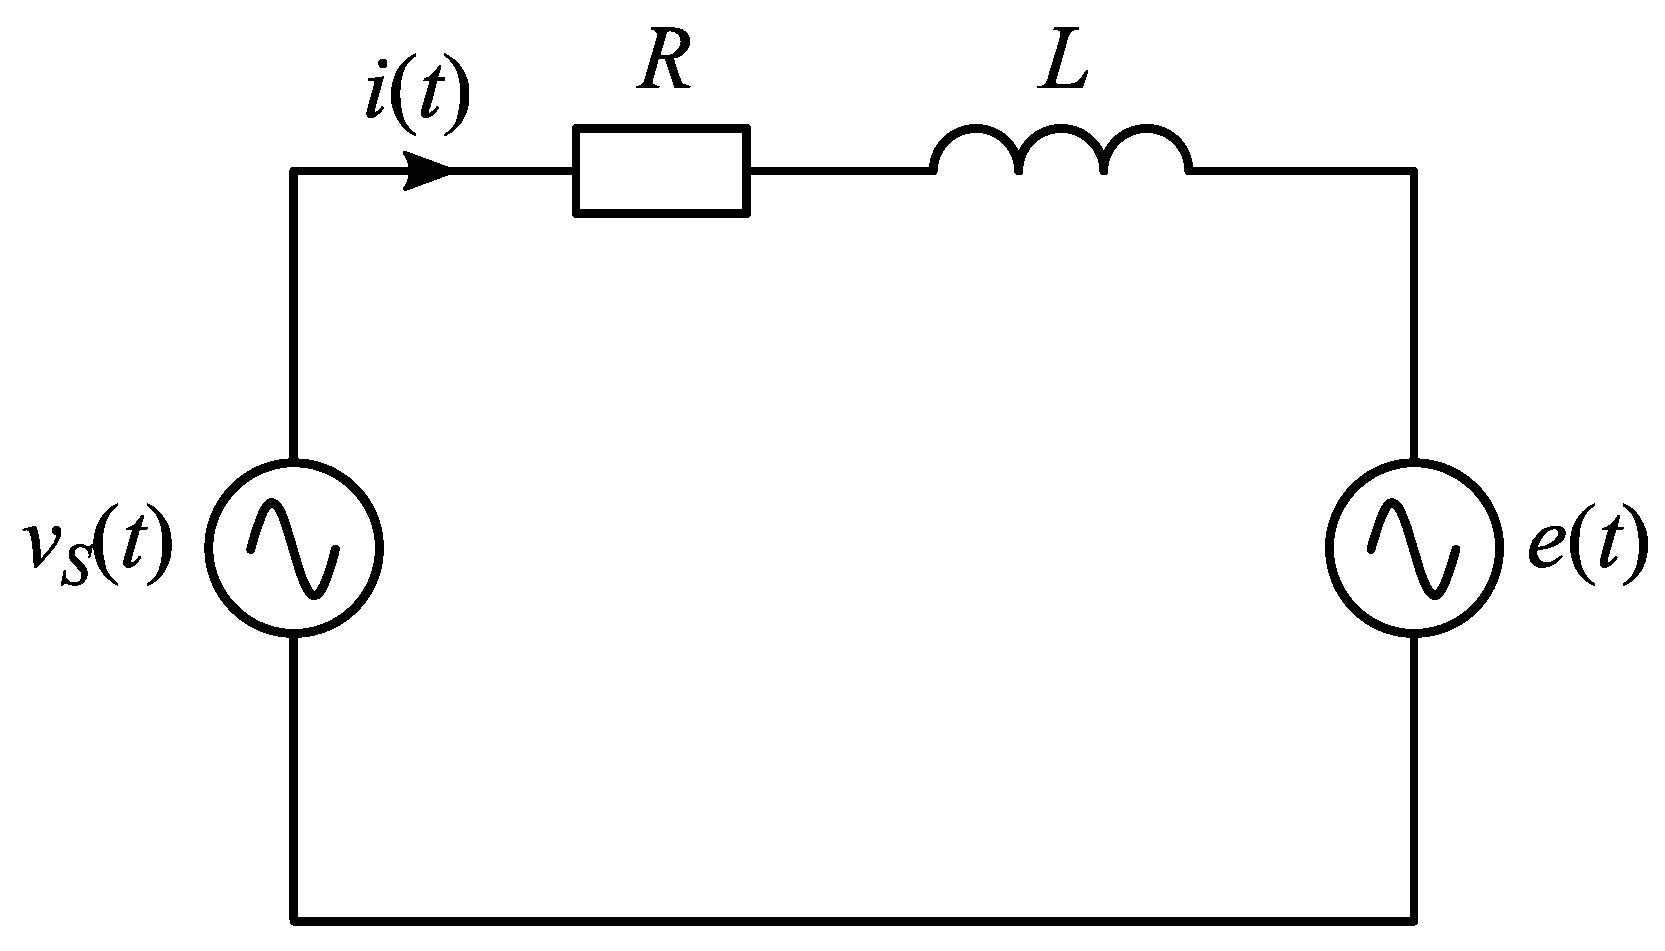
Many power electronics devices include a DC link and some kind of passive filter on the output or/and on the input. Typical representatives of these devices are grid connected converters and motor drive converters with L-filter. A simple generalized equivalent circuit of such a converter is shown in Figure 1, where the power converter is represented by an AC source with voltage vS(t) [25]. The task of a power converter is to generate fundamental, as well as higher harmonics. Thus, by properly generated voltage harmonics, the current harmonics can be controlled in steady-state.
The load is modeled by passive elements (resistance R and inductance L) and an additional AC source with voltage e(t), which represents an active load, e.g., grid supply voltage or back electromotive force (BEMF) voltage of an electrical machine. The load current i(t) depends on all aforementioned quantities, resulting in the following simple equation:
Fourier series of converter output voltage vS(t), load voltage e(t), and load current i(t) in steady-state can be written as the sums of individual harmonics:
with hmax being the highest harmonic to be controlled in a particular application.
Depending on the application, the power converter has to generate voltage harmonics in vS(t) to provide proper control of load current harmonics in i(t). After inserting Equations (2)–(4) and time derivative of Equation (4) into the differential Equation (1), the following steady-state expression is obtained:
The latter can be simplified to:
where Zh and φh are defined as:
Further, for the converter voltage vS(t), the amplitude of its individual harmonic and the corresponding phase angle φVh can be calculated as:
Power converter can provide maximal output voltage VSmax, which, along with other system parameters, listed in Table 1, determines its current generating capabilities. For bipolar PWM converters in single-phase systems, VSmax is equal to DC link voltage VDC, reduced by voltage loss Vd:
This voltage loss is caused by the converter’s inevitable safety feature, dead time implementation, and depends on the applied dead time td, DC link voltage VDC, and switching frequency fS [26]:
Consequently, load current harmonics in i(t) can be successfully controlled, if required converter voltage vS(t) remains below the saturation level:
Based on given VSmax, the objective is to calculate the maximal possible load current amplitude for each harmonic. In general, it is very hard to analytically derive these relationships due to the influence of all amplitudes and phase angles. For this reason, the worst-case scenario is taken into consideration.
The worst-case scenario for each harmonic occurs when from Equation (9) reaches its maximal value. The conditions for current harmonic control become most demanding, when for each individual harmonic, load current amplitude is maximal, and the phase difference between the corresponding load voltage angle (φEh) and load current angle (φIh) equals φh.
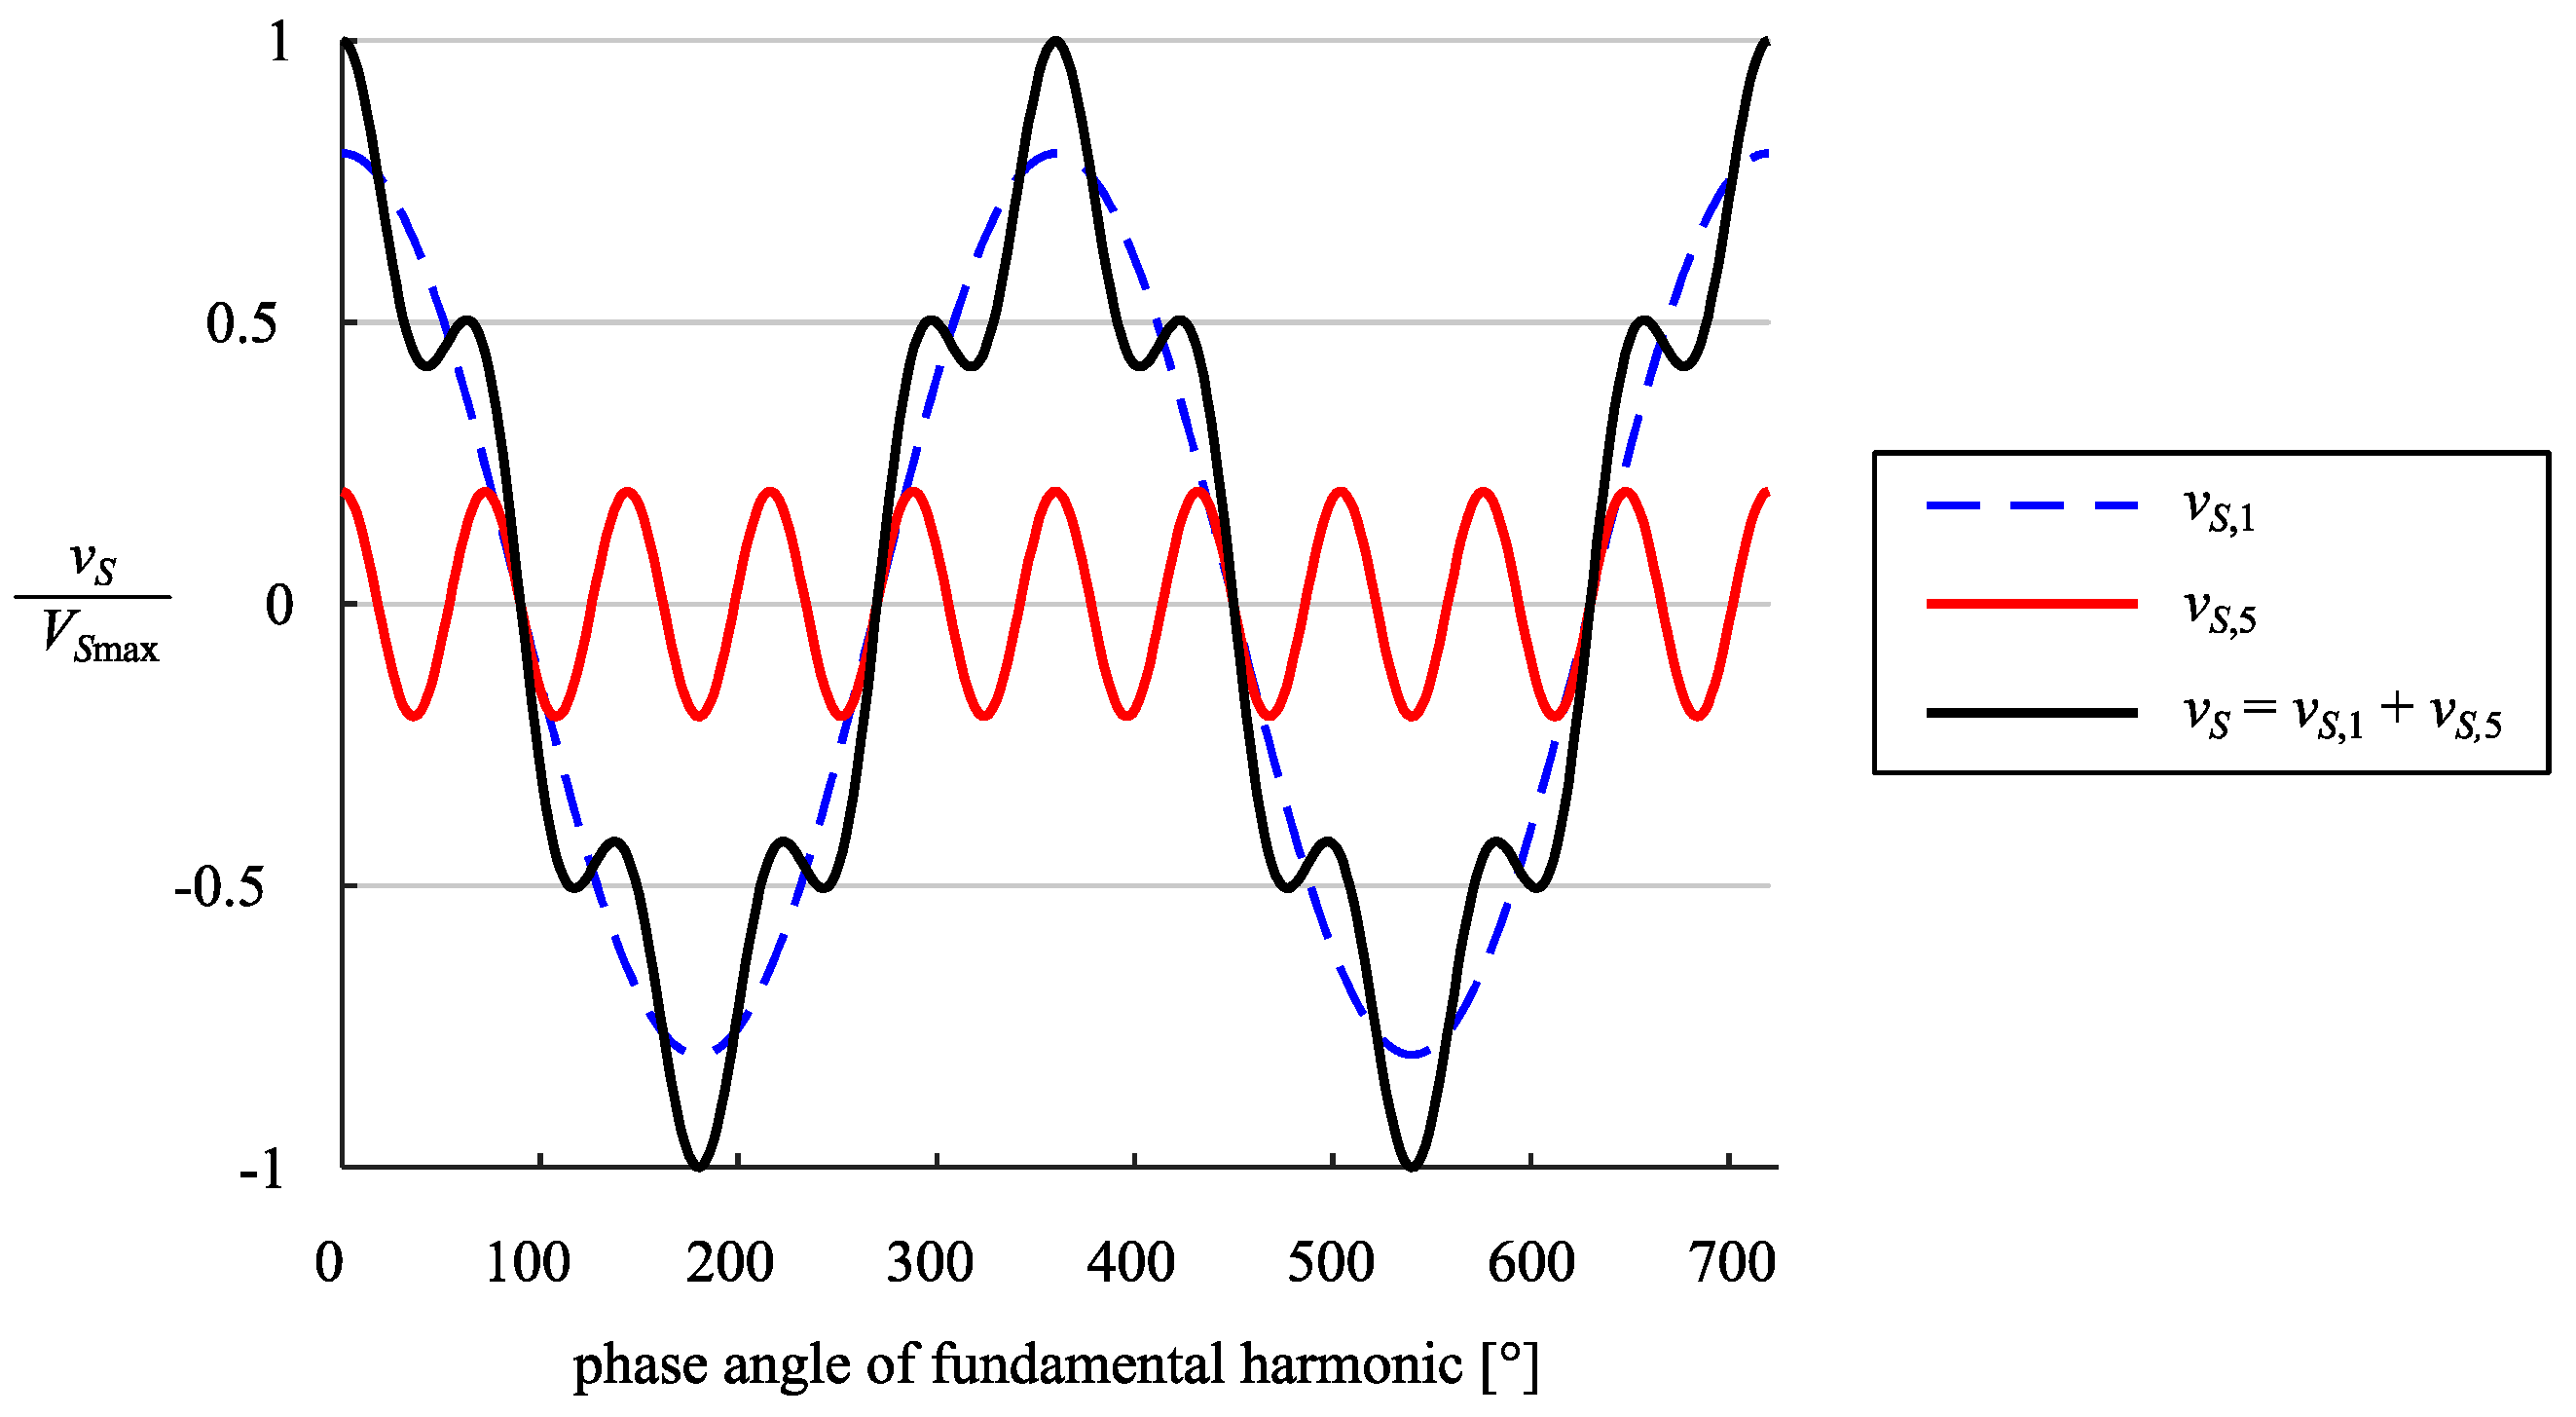
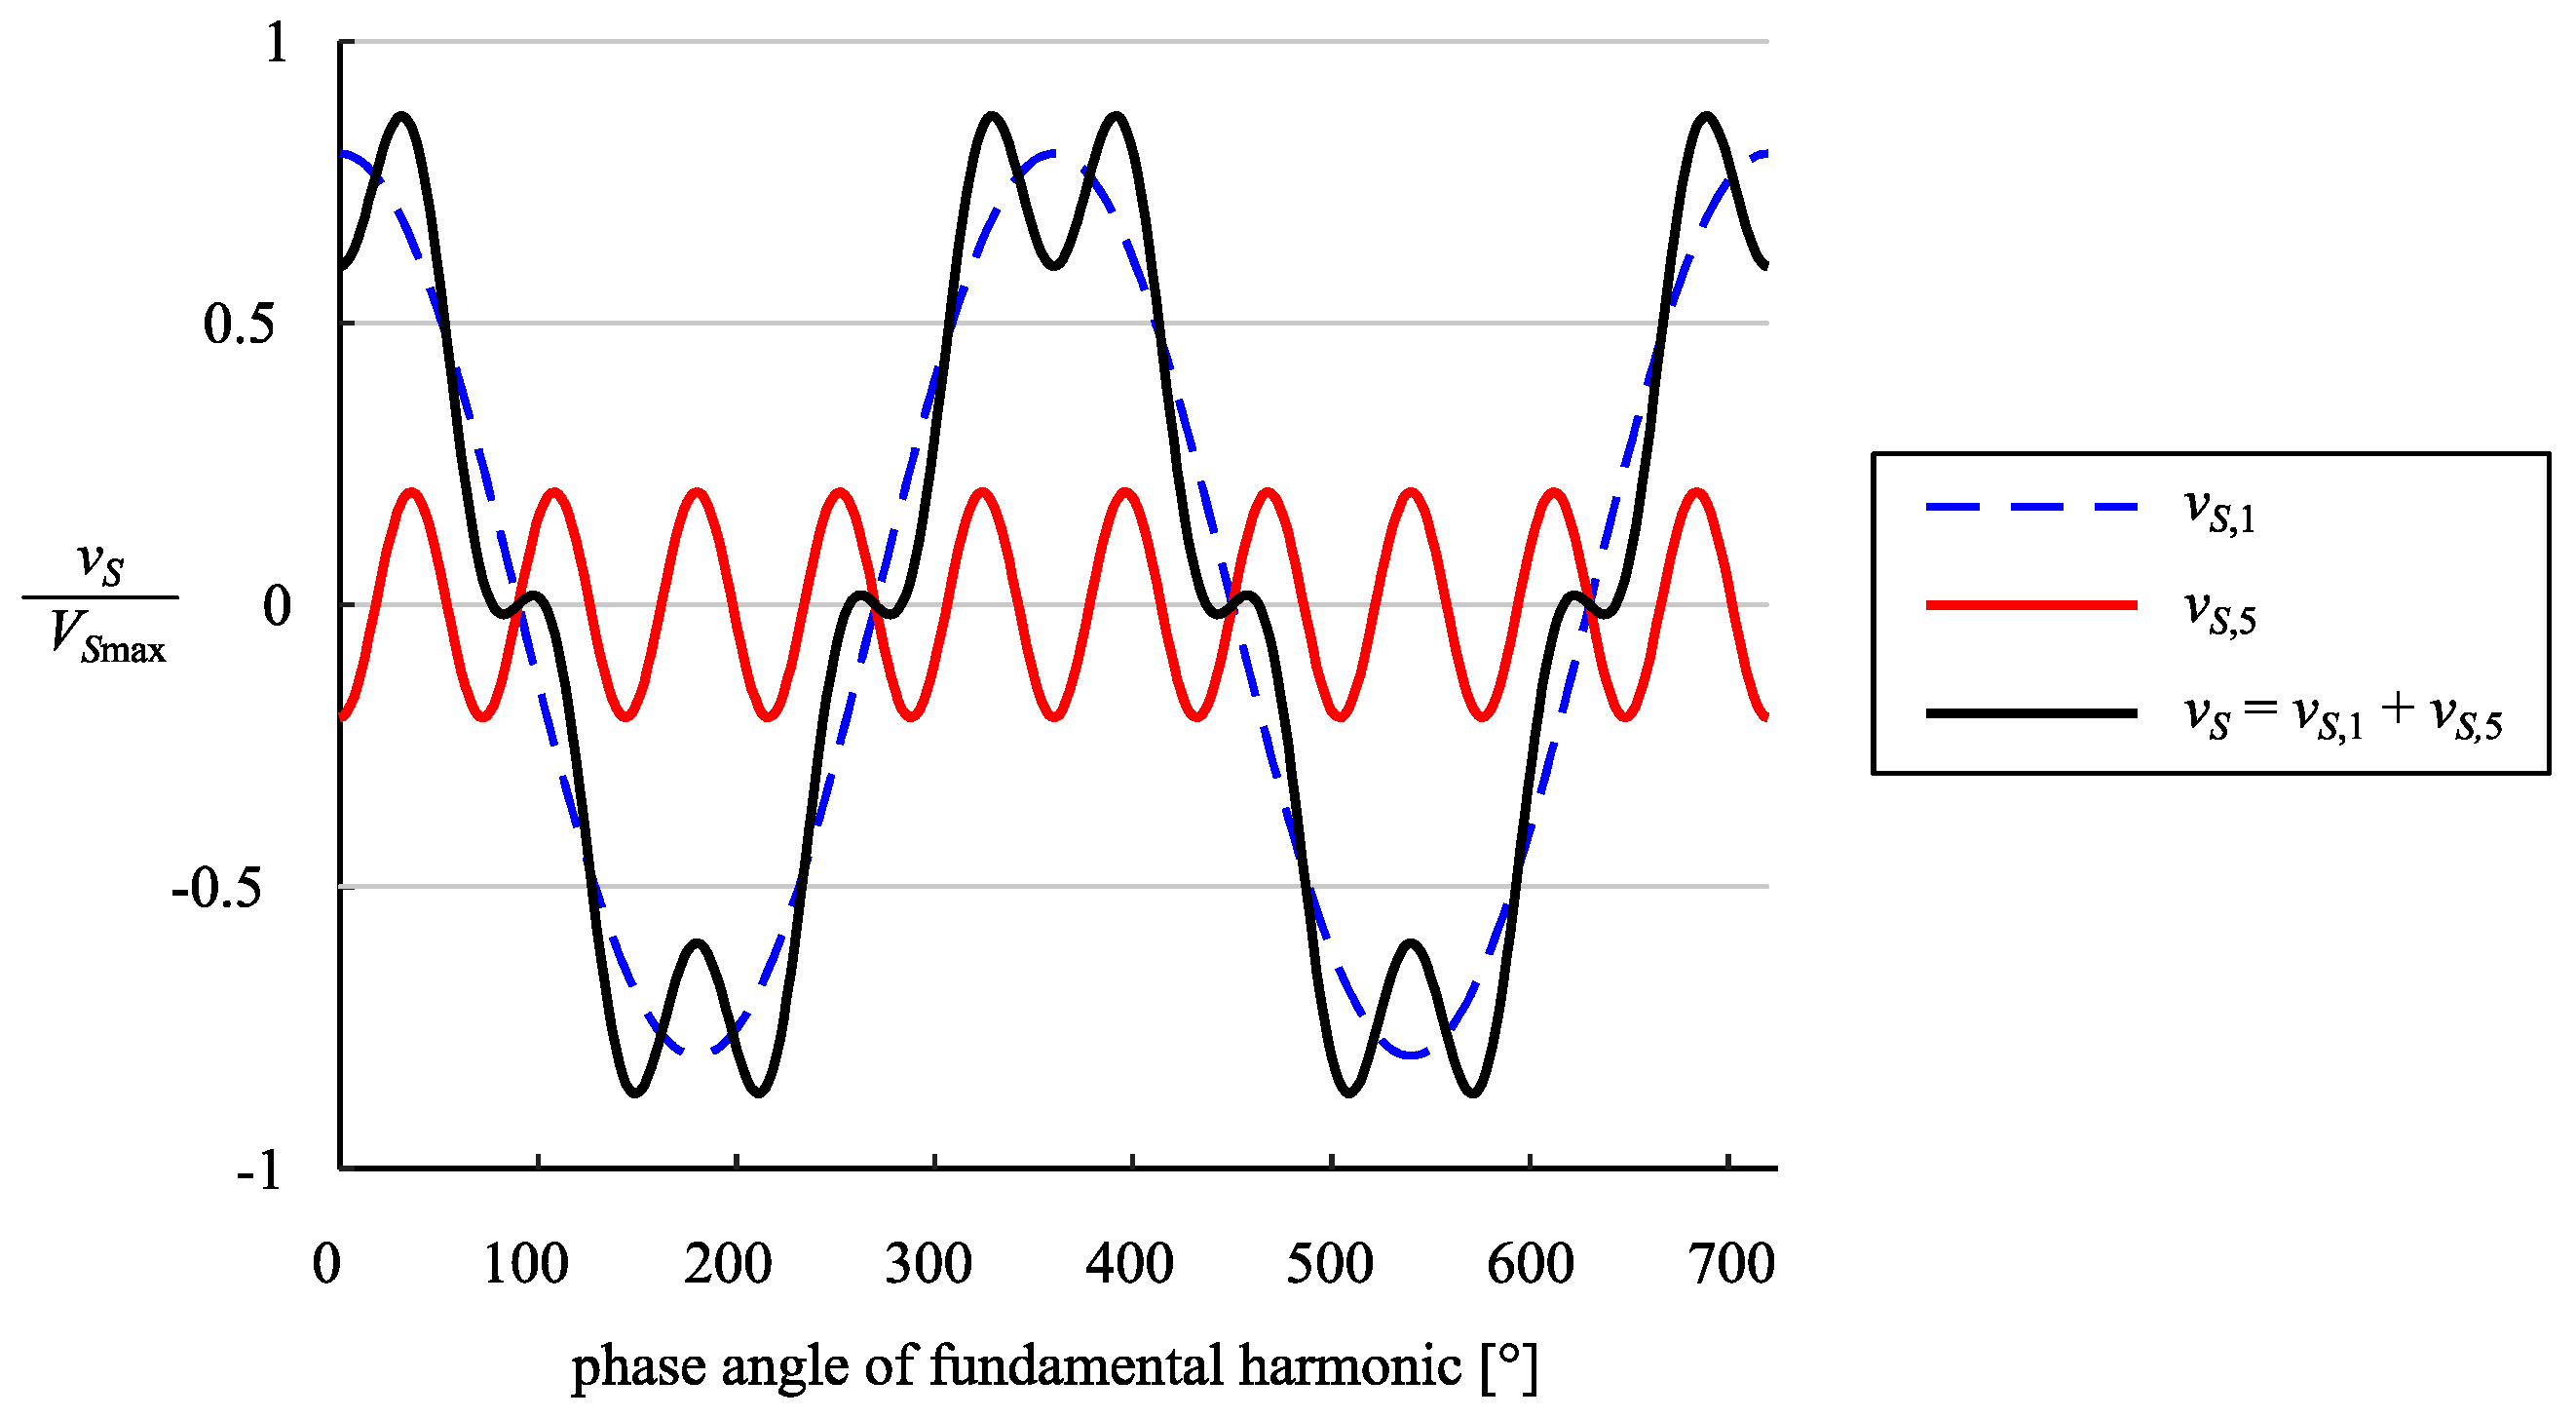
A worst-case example is illustrated in Figure 2, where the converter has to generate fundamental voltage harmonic vS,1 and the additional fifth harmonic vS,5; the latter exhibits its amplitude and its phase displacement φV5, so that the converter voltage vS reaches its maximal value VSmax. For the same fundamental voltage harmonic, vS,1 and the fifth harmonic with the same amplitude , but different phase displacement, the converter is not saturated (vS < VSmax), as shown in Figure 3.
Focusing on the worst case simplifies relations in Equations (9), (10), and (13), since all the converter voltage harmonics align exactly at the angle, where their contribution to vS is maximal. For this case, inserting Equation (2) into Equation (13) yields an expression:
where phase angles are not present any more, except for the converter voltage fundamental harmonic , which can be calculated by Equation (9) with h = 1.
Based on Equation (14), the maximal additional load current amplitude of specific harmonic h for the worst-case scenario can be calculated as:
where the term ci indicates, whether the application provides control of the i-th harmonic of load current (ci = 1) or not (ci = 0). As long as particular harmonic is not intended to be controlled, it does not need to be considered in the calculation of the maximal additional harmonic load current amplitude . The power converter generates just the harmonics, which are controlled via current control loop; no other harmonics contribute to the decrease of in Equation (15). If only fundamental harmonic of load current is controlled, the sum in numerator of Equation (15) becomes zero.
3. Experimental Setup
The derived analytical expression for calculating the maximal amplitude of controlled harmonic current by Equation (15) has been experimentally verified on a setup, designed around a single-phase grid-connected bidirectional inverter and L-filter are shown in Figure 4. The power transistors (metal-oxide semiconductor field effect transistors – MOSFETs) are triggered by bipolar PWM.
To comply with the model from Figure 1, the equivalent load resistance R and equivalent load inductance L for experimental setup are calculated from power stage parameters as:
In Equation (16) and Equation (17), RTR2 is AC resistance of transformer’s secondary winding, LTR2 is leakage inductance of transformer’s secondary winding, and RT is power transistor’s ON resistance.
The load current i is controlled by a proportional controller, which is supported by multiple resonant controllers, each of them providing separate control of selected harmonic current, as shown in Figure 5. This kind of control structure results in outstanding performance [18], thus any relevant deviations could only result from physical limitations of the system. The control algorithm has been implemented with Texas Instruments digital signal processor (DSP) TMS320F28377D. Parameters of the experimental setup (Figure 6) are given in Table 2.
The load current reference i* is determined within the DSP following Equation (4), according to the test requirements. Due to multiple resonant controllers the steady-state error is practically negligible, but only if the converter is not saturated. Namely, if modulation index M from Figure 5 exceeds 100%, the converter would be required to generate voltage vS(t) above its saturation level VSmax. Consequently, the current harmonic distortion occurs.
Figure 7a shows how actual load current i follows its reference value i*, which consists of fundamental harmonic with amplitude of 10 A and 3rd harmonic with amplitude of 1 A. Error signal is small, as the modulation index M remains slightly below 100 % (Figure 7b). Corresponding frequency spectra of the load current i and its reference i* are shown in Figure 7c.
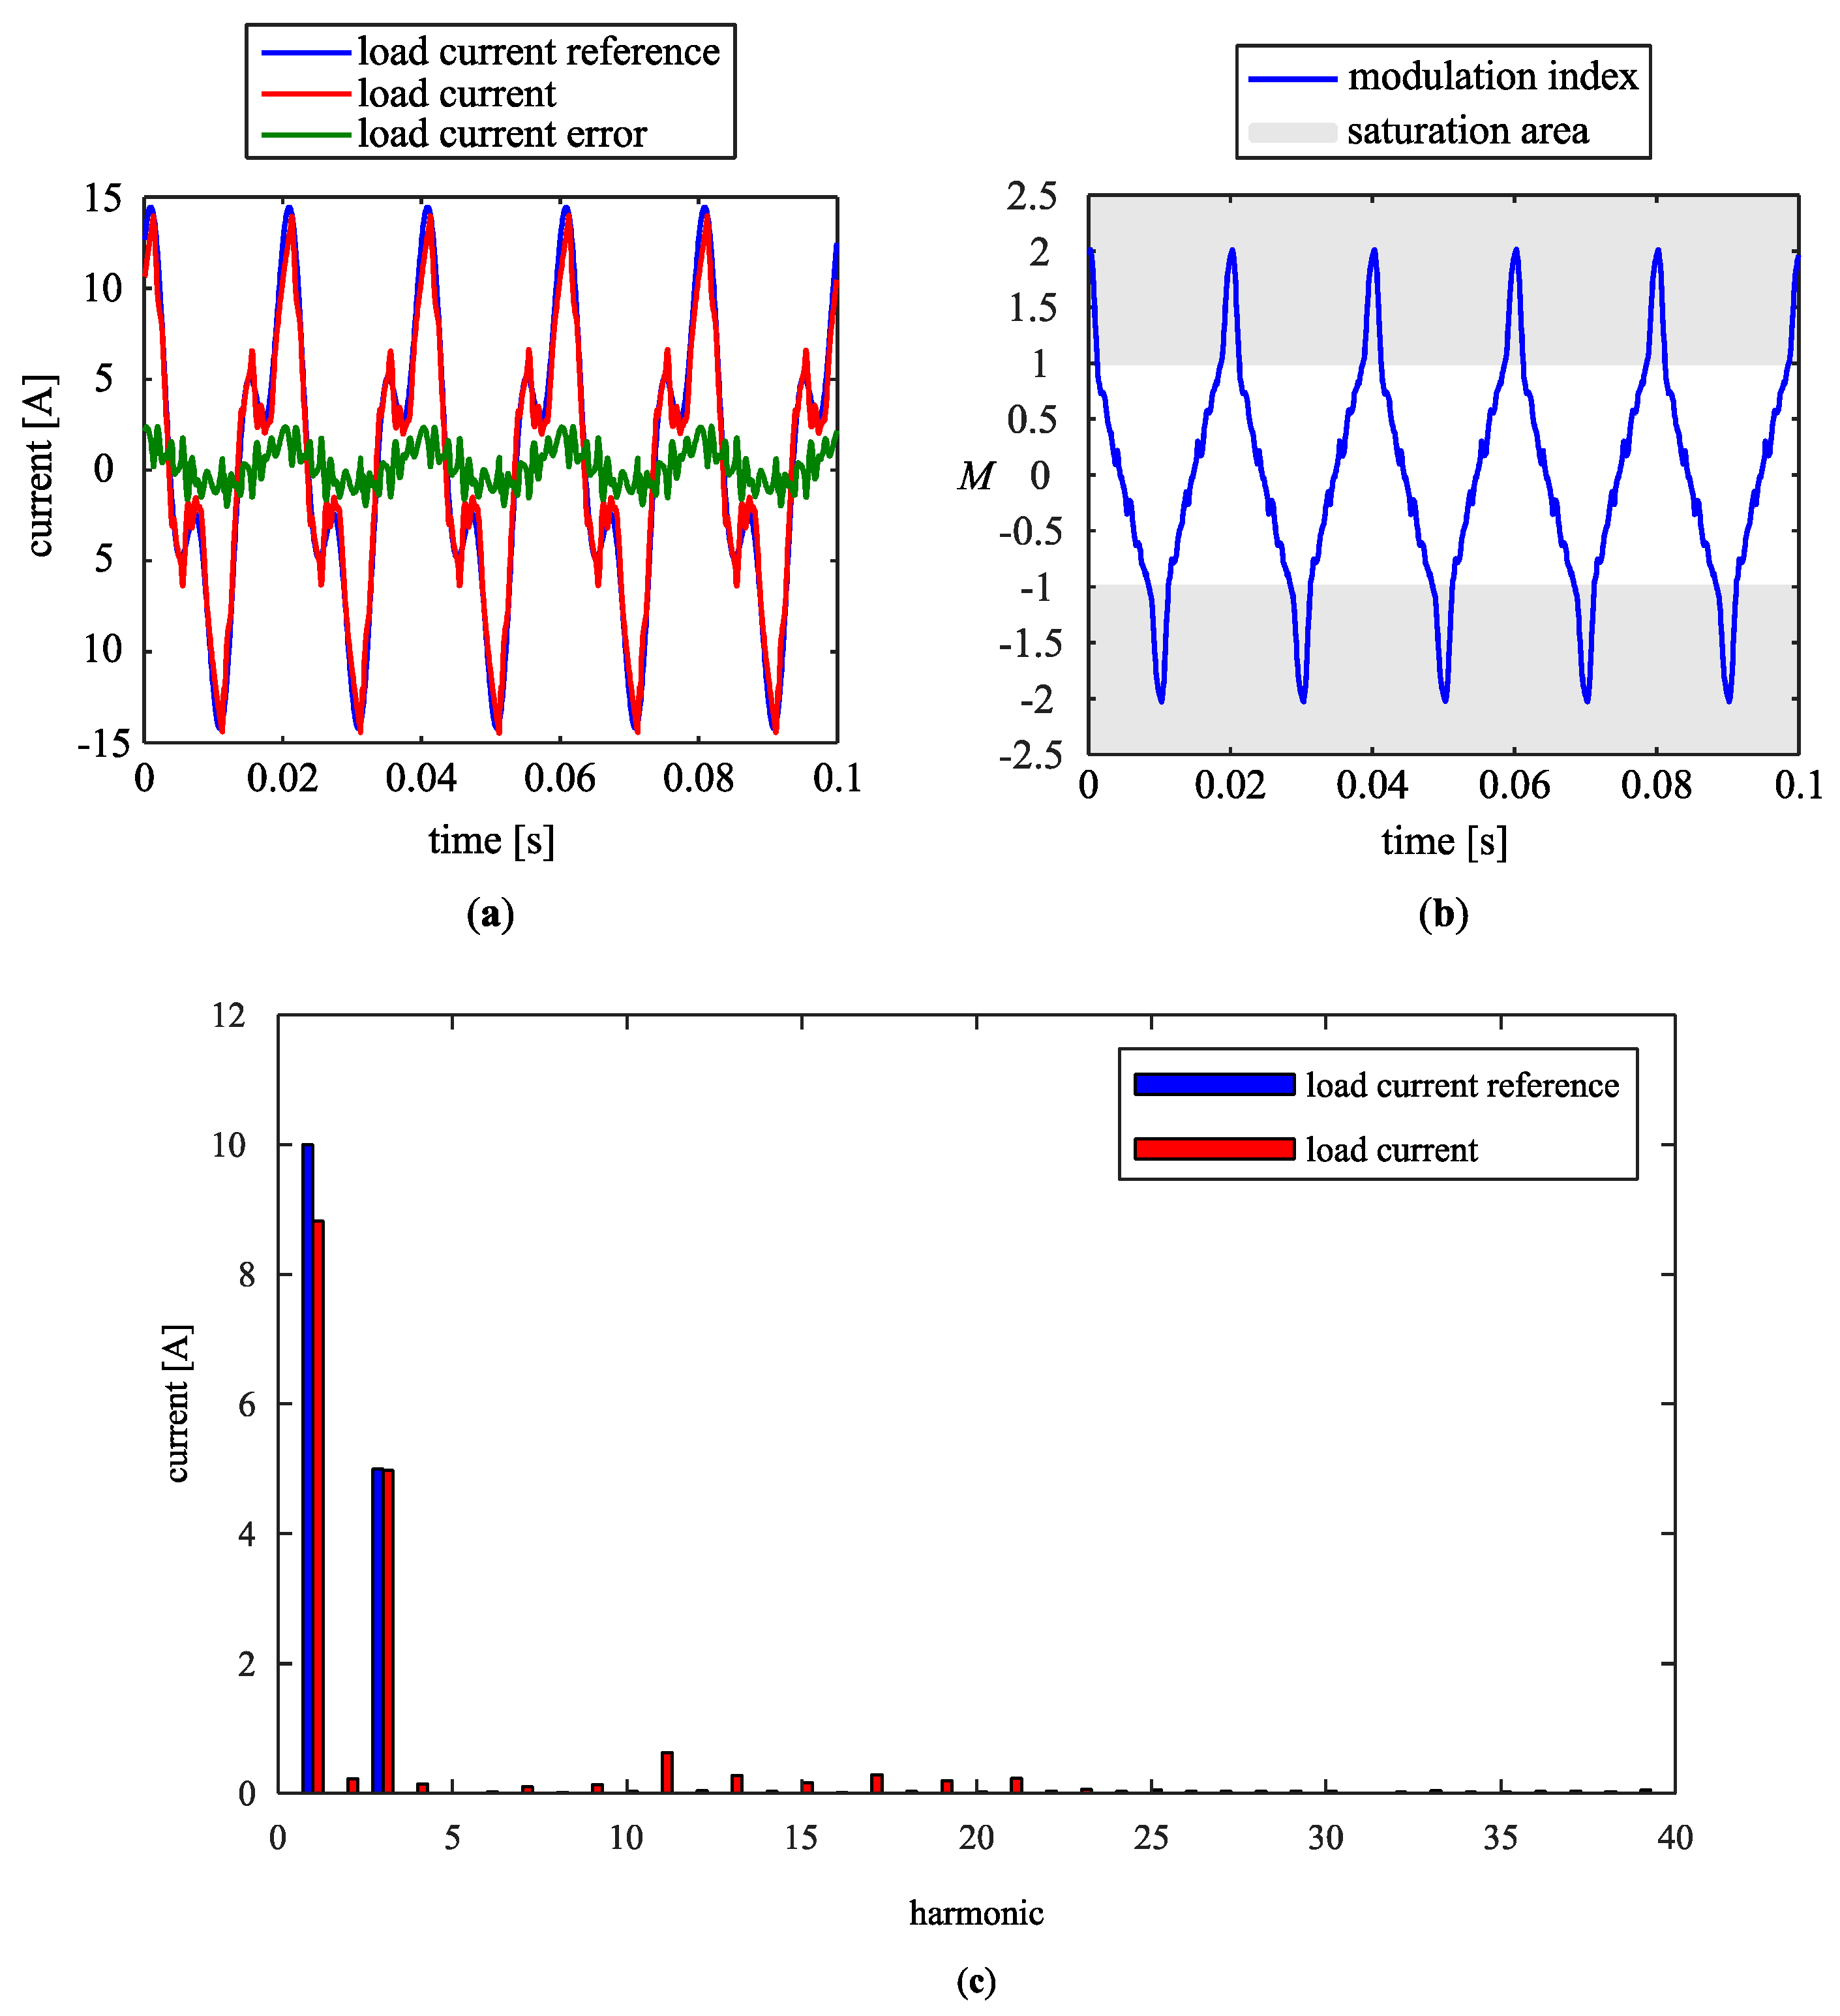
When the load current reference i* has been changed to contain fundamental harmonic with an amplitude of 10 A (as previously) and the third harmonic with amplitude increased to 2.3 A, the actual load current still behaves well (Figure 8a). As seen from Figure 8b, the modulation index M reaches 100%, leading the power converter just to the saturation limit. Consequently, harmonic distortion of the load current still does not occur (Figure 8c). Therefore, the fundamental load current and its third harmonic are generated properly.
Further increase of the load current reference third harmonic to 5 A (superposed to fundamental harmonic with amplitude of 10 A) is shown in Figure 9a. Load current i fails to follow its reference i*, as the modulation index M exceeds 100% (Figure 9b) and the converter is saturated. The difference between frequency spectra of load current reference i* and its actual value i is clearly presented in Figure 9c.
4. Results
In order to verify the theoretical findings, several measurements have been performed. The goal was to analyze what amplitude of a specific load current harmonic could converter generate additionally to the already generated current (basis). Consequently, the experimental load current reference i* is formed by adding the selected (h-th) load current harmonic reference to the load current basis. To measure the converter’s capability of generating maximal additional harmonic current amplitude , the converter is driven into saturation. The saturation is detected, if the modulation index M exceeds 100%; this is treated as the worst-case scenario. According to Equation (9), the saturation depends on the amplitude and the angle of load current harmonic φIh; hence, various combinations of those two parameters have to be tested. First, low amplitude of selected load current harmonic is set and the angle of load current harmonic φIh is incremented in small steps, until the saturation of the converter occurs (if it occurs). If no saturation is observed for this preset amplitude of selected load current harmonic and for any value of angle φIh, then the amplitude reference of this additionally controlled harmonic current is slightly increased. Again, the angle of load current harmonic (φIh) is gradually incremented from 0°, in expectation of eventual saturation.
The results of two representative tests are presented. In the first test, as the basis, only the load current fundamental harmonic at 50 Hz with an amplitude of 10 A has been considered.
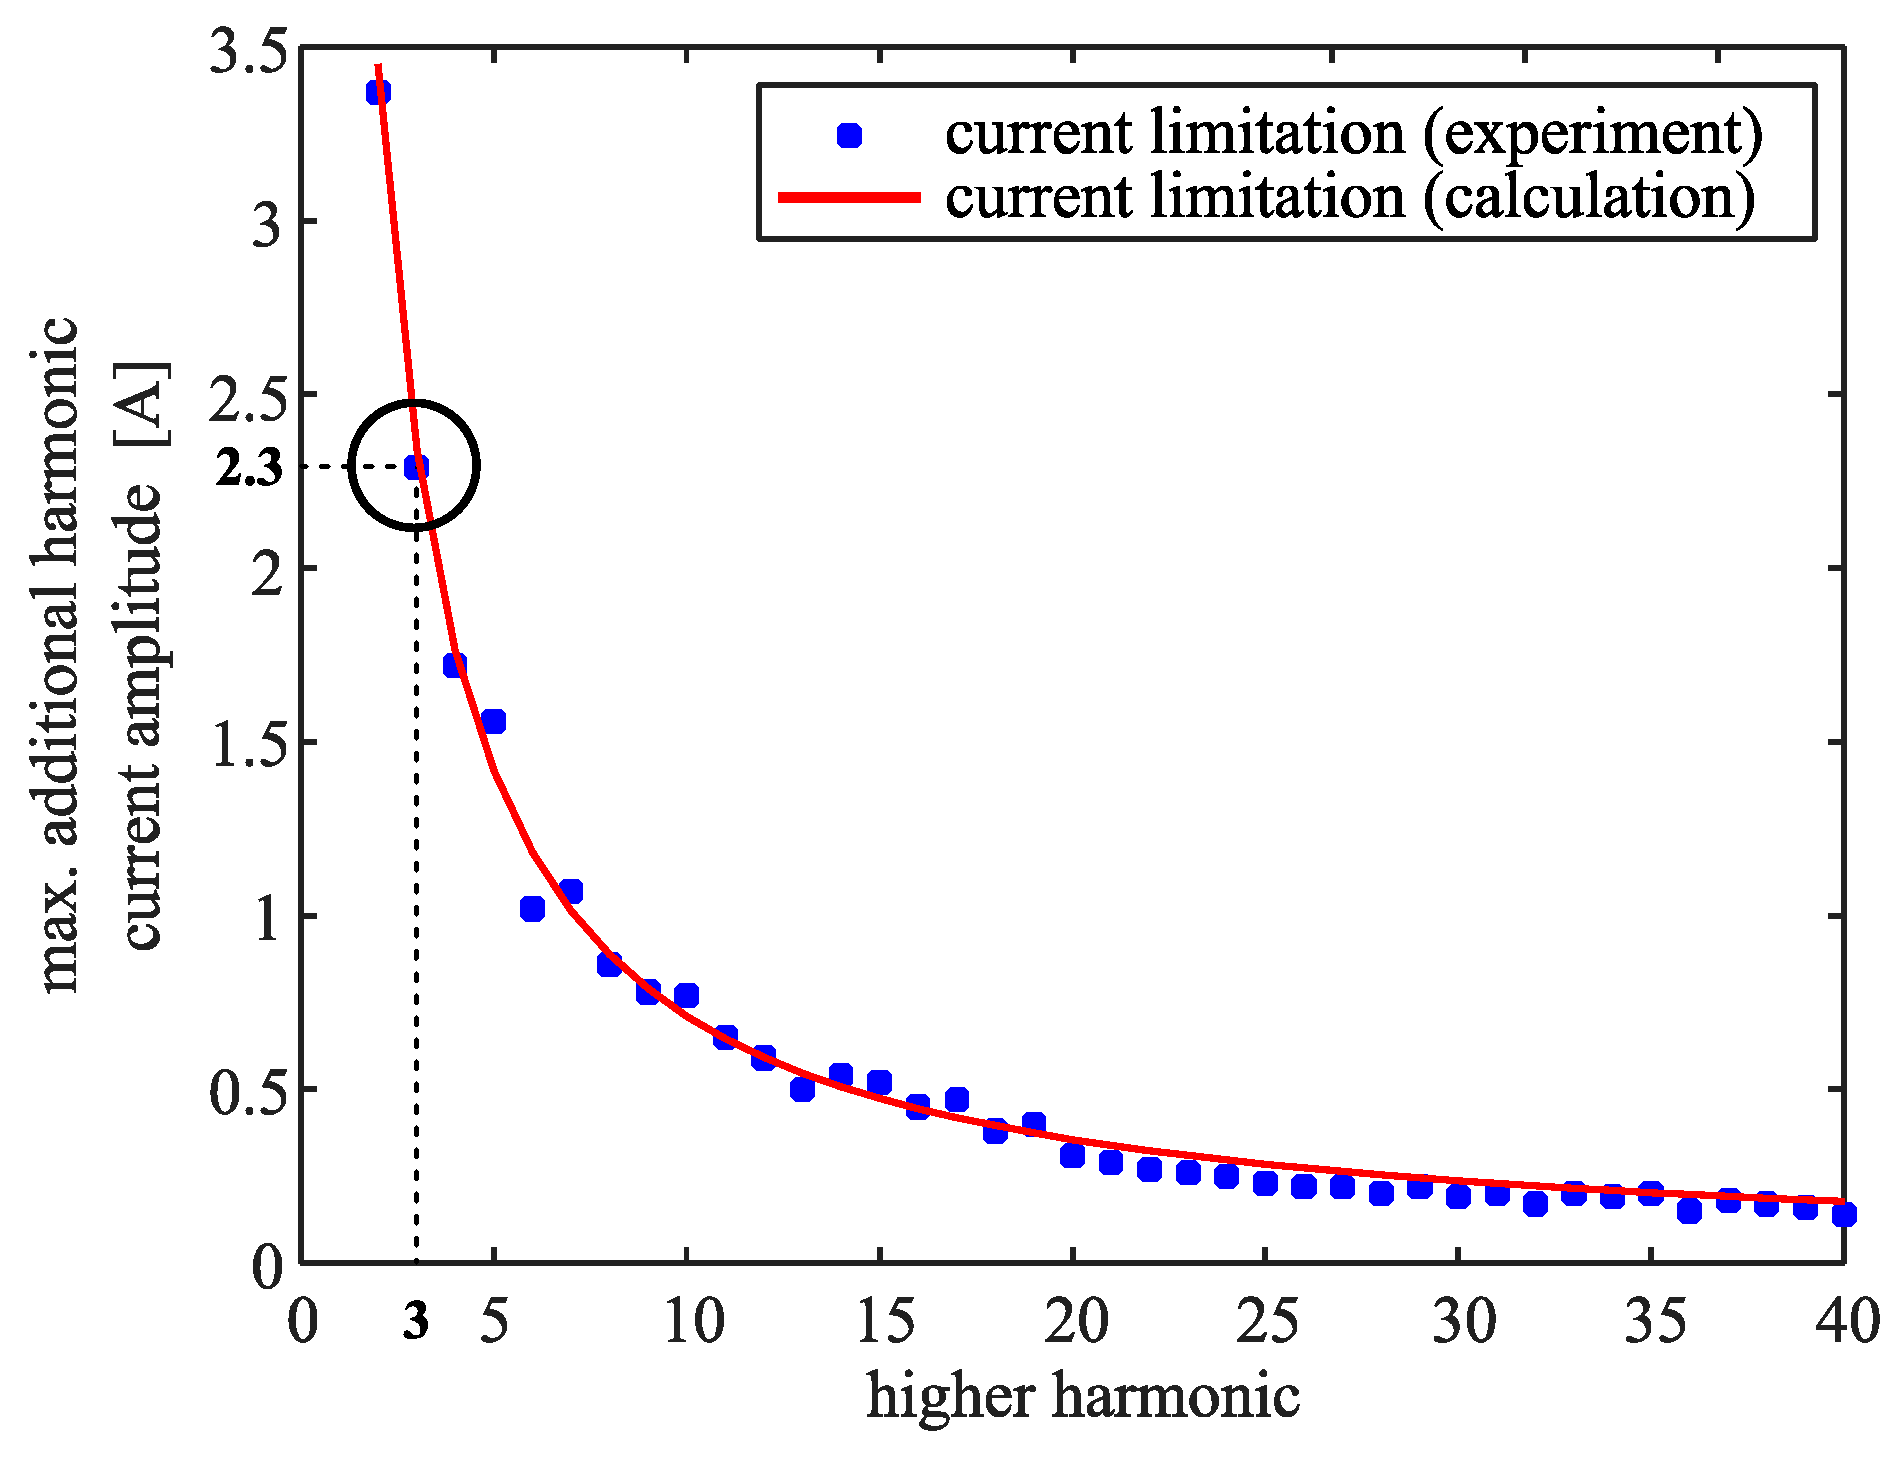
The procedure described above (variation of and φIh) for the converter’s saturation detection was repeated for each (h-th) harmonic from 2nd to 40th (in this case-study chosen as the highest one), giving an array of corresponding experimental maximal amplitudes . In Figure 10, these experimental results are shown in comparison to the maximal amplitudes of the controlled harmonic current , calculated by the derived analytical expression Equation (15). For example, the highlighted point at the third harmonic in Figure 10 has been obtained from the measurement, shown in Figure 8a, where the load current contains a fundamental harmonic with amplitude of 10 A and the third harmonic with an amplitude of 2.3 A; this load current led the converter to its saturation limit.
In the second test, the load current containing a fundamental harmonic with amplitude of 10 A and an additional third harmonic with an amplitude of 1 A was used as the basis. The same procedure as in the first test, i.e., adjusting the amplitude of load current harmonic and its angle φIh until saturation of the converter occurs, was followed to determine experimental maximal amplitudes from the 2nd to 40th harmonic. Comparison between calculated and experimental results for the second test is shown in Figure 11.
Good matching between the calculated and experimental results for both tests indicate that the derived analytical expression Equation (15) provides fast and reliable estimation of the converter harmonics limitations.
5. Conclusions
The derived analytical expression, used for calculating the maximal amplitude of controlled harmonic current, has been experimentally verified on the single-phase grid-connected bidirectional inverter with an L-filter. By applying the obtained expressions, power electronics designers can quickly determine required system parameters in order to avoid physical limitations of harmonic suppression/generation. Furthermore, if the harmonic suppression/generation does not act as expected (e.g. certain harmonics are not suppressed completely), this can be attributed either to physical limitations of the system or to inadequate control algorithm. In the former case, one can infer from the proposed expressions whether a simple increase of DC-link voltage is sufficient or if a complete system redesign is required.
Further research on this topic will be focused on the evaluation of the influence of temperature and parameter variation on the maximal amplitude of a controlled harmonic current. Limitations for single-phase converters with other types of passive filters (like LC, LCL, or CLC), as well as for converters in three-phase applications, will be considered.
Author Contributions
All authors have contributed equally to this work and all authors have read and approved the submitted manuscript. Conceptualization, D.S. and M.N.; Formal analysis, D.S.; Investigation, D.S. and M.N.; Methodology, D.S.; Resources, V.A. and D.N.; Software, D.S. and M.N.; Supervision, M.N., V.A. and D.N.; Validation, D.S. and D.N.; Visualization, V.A. and D.N.; Writing – original draft, D.S. and D.N.; Writing – review & editing, M.N., V.A. and D.N.
Funding
This research received no external funding.
Acknowledgments
This research was supported in part by Slovenian Research Agency; Javna agencija za raziskovalno dejavnost Republike Slovenije, Bleiweisova cesta 30, 1000 Ljubljana, Slovenia.
Conflicts of Interest
The authors declare no conflict of interest.
References
- IEC Standard for Harmonic Current Emissions; IEC 61000-3-2; IEC: Centurion, South Africa, 2001.
- IEEE Standard for Interconnecting Distributed Resources with Electric Power Systems; IEEE: Piscataway, NJ, USA, 2009; pp. 1547–2003.
- Catuogno, G.R.; Forchetti, D.G.; Leidhold, R.; Garcia, G.O. Power Flow Maximization in Permanent-Magnet Generators. IEEE Trans. Ind. Electron. 2014, 61, 6566–6573. [Google Scholar] [CrossRef]
- Yang, Y.; Zhou, K.; Wang, H.; Blaabjerg, F. Analysis and Mitigation of Dead-Time Harmonics in the Single-Phase Full-Bridge PWM Converter with Repetitive Controllers. IEEE Trans. Ind. Appl. 2018, 54, 5343–5354. [Google Scholar] [CrossRef]
- Schuelting, P.; van der Broeck, C.H.; Doncker, R. Analysis and Design of Repetitive Controllers for Applications in Distorted Distribution Grids. IEEE Trans. Power Electron. 2018, 34, 996–1004. [Google Scholar] [CrossRef]
- Lidozzi, A.; Ji, C.; Solero, L.; Zanchetta, P.; Crescimbini, F. Digital dead-beat and repetitive combined control for stand-alone four-leg VSI. IEEE Trans. Ind. Appl. 2017, 53, 5624–5633. [Google Scholar] [CrossRef]
- Lee, S.-H.; Cha, W.-J.; Kwon, B.-H.; Kim, M. Discrete-Time Repetitive Control of Flyback CCM Inverter for PV Power Applications. IEEE Trans. Ind. Electron. 2016, 63, 976–984. [Google Scholar] [CrossRef]
- Julian, A.L.; Oriti, G.; Ji, C.; Zanchetta, P. Single Phase Energy Management System Operating in Islanding Mode with Repetitive Control and Active Damping. IEEE Trans. Ind. Appl. 2018, 54, 5163–5172. [Google Scholar] [CrossRef]
- Lorenzini, C.; Flores, J.V.; Pereira, L.F.A.; Pereira, L.A. Resonant—Repetitive controller with phase correction applied to uninterruptible power supplies. Control Eng. Pract. 2018, 77, 118–126. [Google Scholar] [CrossRef]
- Herman, L.; Blazic, B.; Papic, I. A control strategy of a hybrid active filter for operation with harmonically unbalanced voltages and currents. In Proceedings of the 17th International Conference on Harmonics and Quality of Power (ICHQP), Belo Horizonte, Brazil, 16–19 October 2016; IEEE: Piscataway, NJ, USA, 2016; pp. 386–394. [Google Scholar]
- Mattavelli, P.; Marafao, F.P. Repetitive-Based Control for Selective Harmonic Compensation in Active Power Filters. IEEE Trans. Ind. Electron. 2004, 51, 1018–1024. [Google Scholar] [CrossRef]
- Sun, B. An Improved Repetitive Control Scheme for Active Power Filter with Frequency-Adaptive Capability. In Proceedings of the 18th International Conference on Electrical Machines and Systems (ICEMS), Pattaya, Thailand, 25–28 October 2015. [Google Scholar]
- Hornik, T.; Zhong, Q. A Current-Control Strategy for Voltage-Source Inverters in Microgrids Based on H∞ and Repetitive Control. IEEE Trans. Power Electron. 2011, 26, 943–952. [Google Scholar] [CrossRef]
- Tang, Z.; Akin, B. Suppression of Dead-Time Distortion Through Revised Repetitive Controller in PMSM Drives. IEEE Trans. Energy Convers. 2017, 32, 918–930. [Google Scholar] [CrossRef]
- Mattavelli, P.; Tubiana, L.; Zigliotto, M. Torque-Ripple Reduction in PM Synchronous Motor Drives Using Repetitive Current Control. IEEE Trans. Power Electron. 2005, 20, 1423–1431. [Google Scholar] [CrossRef]
- Yang, Y.; Zhou, K.; Blaabjerg, F. Enhancing the Frequency Adaptability of Periodic Current Controllers with a Fixed Sampling Rate for Grid-Connected Power Converters. IEEE Trans. Power Electron. 2016, 31, 7273–7285. [Google Scholar] [CrossRef]
- Chen, H.; Liu, H.; Xing, Y.; Hu, H. Enhanced DFT-Based Controller for Selective Harmonic Compensation in Active Power Filters. IEEE Trans. Power Electron. 2019, 34, 8017–8030. [Google Scholar] [CrossRef]
- Yang, Y.; Zhou, K.; Blaabjerg, F. Current Harmonics from Single-Phase Grid-Connected Inverters—Examination and Suppression. IEEE J. Emerg. Sel. Top. Power Electron. 2016, 4, 221–233. [Google Scholar] [CrossRef]
- Dannehl, J.; Wessels, C.; Fuchs, F.W. Limitations of Voltage-Oriented PI Current Control of Grid-Connected PWM Rectifiers with LCL Filters. IEEE Trans. Ind. Electron. 2009, 56, 380–388. [Google Scholar] [CrossRef]
- Lee, G.; Kim, S.; Hong, J.; Bahn, J. Torque Ripple Reduction of Interior Permanent Magnet Synchronous Motor Using Harmonic Injected Current. IEEE Trans. Magn. 2008, 44, 1582–1585. [Google Scholar]
- Liu, J.; Li, H.; Deng, Y. Torque Ripple Minimization of PMSM Based on Robust ILC Via Adaptive Sliding Mode Control. IEEE Trans. Power Electron. 2018, 33, 3655–3671. [Google Scholar] [CrossRef]
- Lai, C.; Feng, G.; Iyer, K.L.V.; Mukherjee, K.; Kar, N.C. Genetic Algorithm-Based Current Optimization for Torque Ripple Reduction of Interior PMSMs. IEEE Trans. Ind. Appl. 2017, 53, 4493–4503. [Google Scholar] [CrossRef]
- Xia, C.; Ji, B.; Yan, Y. Smooth Speed Control for Low-Speed High-Torque Permanent-Magnet Synchronous Motor Using Proportional–Integral–Resonant Controller. IEEE Trans. Ind. Electron. 2015, 62, 2123–2134. [Google Scholar] [CrossRef]
- Das, J.C. Passive Filters—Potentialities and Limitations. IEEE Trans. Ind. Appl. 2004, 40, 232–241. [Google Scholar] [CrossRef]
- Zhang, C. A Stationary-Frame Current Vector Control Strategy for Single-Phase PWM Rectifier. IEEE Trans. Veh. Technol. 2019, 68, 2640–2651. [Google Scholar] [CrossRef]
- Mattavelli, P.; Buso, S. Digital Control in Power Electronics, 2nd ed.; Morgan & Claypool: San Rafael, CA, USA, 2012. [Google Scholar]
Figure 1.
Equivalent circuit of a power converter application.

Figure 2.
Converter voltage vS consisting of the first and fifth harmonic with phase displacement, leading to saturation (worst case scenario).
Figure 2.
Converter voltage vS consisting of the first and fifth harmonic with phase displacement, leading to saturation (worst case scenario).

Figure 3.
Converter voltage vS consisting of the first and fifth harmonic with the same amplitudes as in Figure 2, but different phase displacement; no saturation occurs.
Figure 3.
Converter voltage vS consisting of the first and fifth harmonic with the same amplitudes as in Figure 2, but different phase displacement; no saturation occurs.

Figure 4.
Schematic of single-phase grid-connected bidirectional inverter in the experimental setup.
Figure 4.
Schematic of single-phase grid-connected bidirectional inverter in the experimental setup.

Figure 5.
Block diagram of load current harmonic control with proportional (P) and multiple resonant controllers (RES 1–RES h, where h denotes the highest controlled harmonic).
Figure 5.
Block diagram of load current harmonic control with proportional (P) and multiple resonant controllers (RES 1–RES h, where h denotes the highest controlled harmonic).

Figure 6.
Experimental setup photo.

Figure 7.
Power converter operating below the saturation level VSmax; (a) Load current reference i* (containing fundamental harmonic with amplitude of 10 A and the third harmonic with amplitude of 1 A), load current i and load current error ε; (b) modulation index M; (c) frequency spectra of load current reference i* and load current i.

Figure 8.
Power converter operating at the saturation limit VSmax; (a) Load current reference i* (containing fundamental harmonic with amplitude of 10 A and the third harmonic with amplitude of 2.3 A), load current i and load current error ε; (b) modulation index M; (c) frequency spectra of load current reference i* and load current i.

Figure 9.
Power converter operating above the saturation level VSmax; (a) Load current reference i* (containing fundamental harmonic with amplitude of 10 A and the third harmonic with amplitude of 5 A), load current i and load current error ε; (b) modulation index M; (c) frequency spectra of load current reference i* and load current i.

Figure 10.
Comparison of calculated (by Equation (15)) and experimental current limitations, based on load current containing only fundamental harmonic with amplitude of 10 A.
Figure 10.
Comparison of calculated (by Equation (15)) and experimental current limitations, based on load current containing only fundamental harmonic with amplitude of 10 A.

Figure 11.
Comparison of the calculated (by Equation (15)) and experimental current limitations, based on load current containing fundamental harmonic with an amplitude of 10 A and third harmonic with amplitude of 1 A.
Figure 11.
Comparison of the calculated (by Equation (15)) and experimental current limitations, based on load current containing fundamental harmonic with an amplitude of 10 A and third harmonic with amplitude of 1 A.


Table 1.
System parameters imposing harmonic control limitations.
| Symbol | Description |
|---|---|
| VSmax | power converter maximal output voltage |
| h | order of harmonic |
| ω1 | fundamental angular frequency of the load voltage and current |
| R | load resistance |
| L | load inductance |
| h | amplitude of load voltage h-th harmonic |
| h | amplitude of load current h-th harmonic |
| φEh | phase angle of load voltage h-th harmonic |
| φIh | phase angle of load current h-th harmonic |
| fS | sampling frequency |
| td | dead time during transistor switching |
| RT | transistor’s ON resistance |
Table 2.
Parameters of experimental setup.
| Symbol | Description | Test Case Values |
|---|---|---|
| Rfilter | filter AC resistance | 47 mΩ |
| Lfilter | filter inductance | 580 µH |
| RTR2 | transformer AC resistance (secondary winding) | 32 mΩ |
| LTR2 | transformer leakage inductance (secondary winding) | 8 µH |
| RT | transistor’s ON resistance | 7.2 mΩ |
| VDC | DC link voltage | 38 V |
| C | DC link capacitance | 41 mF |
| P | converter’s nominal power | 500 W |
| 1 | amplitude of load voltage 1st harmonic | 35.4 V |
| 1 | amplitude of load current 1st harmonic | 10 A |
| 3 | amplitude of load current 3rd harmonic | 1 A |
| f1 | fundamental frequency of load voltage and current | 50 Hz |
| fS | sampling frequency | 20 kHz |
| td | dead time during transistor switching | 200 ns |
© 2019 by the authors. Licensee MDPI, Basel, Switzerland. This article is an open access article distributed under the terms and conditions of the Creative Commons Attribution (CC BY) license (http://creativecommons.org/licenses/by/4.0/).
Share and Cite
MDPI and ACS Style
Sušin, D.; Nemec, M.; Ambrožič, V.; Nedeljković, D. Limitations of Harmonics Control in Power Converters. Electronics 2019, 8, 739. https://doi.org/10.3390/electronics8070739
AMA Style
Sušin D, Nemec M, Ambrožič V, Nedeljković D. Limitations of Harmonics Control in Power Converters. Electronics. 2019; 8(7):739. https://doi.org/10.3390/electronics8070739
Chicago/Turabian StyleSušin, Denis, Mitja Nemec, Vanja Ambrožič, and David Nedeljković. 2019. "Limitations of Harmonics Control in Power Converters" Electronics 8, no. 7: 739. https://doi.org/10.3390/electronics8070739
Note that from the first issue of 2016, this journal uses article numbers instead of page numbers. See further details here.