

Investigating the Incidence of Dyslipidemia among Brazilian Children and Adolescents Diagnosed with Type 1 Diabetes Mellitus: A Cross-Sectional Study


 , , , and
Abstract
:1. Introduction
2. Materials and Methods
2.1. Study Design
2.2. Study Population
2.3. Study Variables
2.4. Data Analysis
3. Results
4. Discussion
5. Conclusions
Author Contributions
Funding
Institutional Review Board Statement
Informed Consent Statement
Data Availability Statement
Conflicts of Interest
References
- Westfall, E.; Viere, A.B.; Genewick, J.E. Preventing CVD in Women: Common Questions and Answers. Am. Fam. Physician 2023, 108, 595–604. [Google Scholar] [PubMed]
- Doumbia, L.; Findley, S.; Ba, H.O.; Maiga, B.; Ba, A.; Béréthé, R.K.; Sangaré, H.M.; Kachur, S.P.; Besançon, S.; Doumbia, S. Formative research to adapt the ‘Diabetes Prevention Program- Power to Prevent’ for implementation in Bamako, Mali. BMC Health Serv. Res. 2024, 24, 61. [Google Scholar] [CrossRef] [PubMed]
- Silveira Rossi, J.L.; Barbalho, S.M.; Reverete de Araujo, R.; Bechara, M.D.; Sloan, K.P.; Sloan, L.A. Metabolic syndrome and cardiovascular diseases: Going beyond traditional risk factors. Diabetes/Metab. Res. Rev. 2022, 38, e3502. [Google Scholar] [CrossRef] [PubMed]
- Gregory, G.A.; Robinson, T.I.G.; Linklater, S.E.; Wang, F.; Colagiuri, S.; de Beaufort, C.; Donaghue, K.C.; Magliano, D.J.; Maniam, J.; Orchard, T.J.; et al. Global incidence, prevalence, and mortality of type 1 diabetes in 2021 with projection to 2040: A modelling study. Lancet Diabetes Endocrinol. 2022, 10, 741–760. [Google Scholar] [CrossRef] [PubMed]
- Vanderniet, J.A.; Jenkins, A.J.; Donaghue, K.C. Epidemiology of Type 1 Diabetes. Curr. Cardiol. Rep. 2022, 24, 1455–1465. [Google Scholar] [CrossRef] [PubMed]
- Evans, M.; Ellis, D.A.; Vesco, A.T.; Feldman, M.A.; Weissberg-Benchell, J.; Carcone, A.I.; Miller, J.; Boucher-Berry, C.; Buggs-Saxton, C.; Degnan, B.; et al. Diabetes distress in urban Black youth with type 1 diabetes and their caregivers: Associations with glycemic control, depression, and health behaviors. J. Pediatr. Psychol. 2024; ahead of print. [Google Scholar] [CrossRef]
- Kugathasan, L.; Sridhar, V.S.; Tommerdahl, K.L.; Xu, C.; Bjornstad, P.; Advani, A.; Cherney, D.Z.I. Minireview: Understanding and targeting inflammatory, hemodynamic and injury markers for cardiorenal protection in type 1 diabetes. Metab. Clin. Exp. 2024, 153, 155785. [Google Scholar] [CrossRef]
- ElSayed, N.A.; Aleppo, G.; Aroda, V.R.; Bannuru, R.R.; Brown, F.M.; Bruemmer, D.; Collins, B.S.; Hilliard, M.E.; Isaacs, D.; Johnson, E.L.; et al. Addendum. 2. Classification and Diagnosis of Diabetes: Standards of Care in Diabetes—2023. Diabetes Care 2023;46(Suppl. 1):S19–S40. Diabetes Care 2023, 46, 1715. [Google Scholar] [CrossRef]
- Cichosz, S.L.; Jensen, M.H.; Olesen, S.S. Development and Validation of a Machine Learning Model to Predict Weekly Risk of Hypoglycemia in Patients with Type 1 Diabetes Based on Continuous Glucose Monitoring. Diabetes Technol. Ther. 2024; ahead of print. [Google Scholar] [CrossRef]
- Cuerda Del Pino, A.; Martín-San Agustín, R.; Laguna Sanz, A.J.; Diez, J.L.; Palanca, A.; Rossetti, P.; Gumbau-Gimenez, M.; Ampudia-Blasco, F.J.; Bondia, J. Accuracy of Two Continuous Glucose Monitoring Devices During Aerobic and High-Intensity Interval Training in Individuals with Type 1 Diabetes. Diabetes Technol. Ther. 2024; ahead of print. [Google Scholar] [CrossRef]
- Abraham, M.B.; Smith, G.; Dart, J.; Davis, E.A.; Jones, T.W. Clinical outcomes with MiniMedTM 780G Advanced Hybrid Closed Loop Therapy in 2- to 6-year-old children with Type 1 diabetes. Diabetes Technol. Ther. 2024; ahead of print. [Google Scholar] [CrossRef]
- Seget, S.; Chobot, A.; Tarasiewicz, M.; Bielawska, A.; Rusak, E.; Ochab, A.; Polanska, J.; Jarosz-Chobot, P. Glycemic control in children with type 1 diabetes treated with the advanced hybrid closed loop system 2-year prospective, observational, two-center study. Frontiers in endocrinology 2024, 15, 1332418. [Google Scholar] [CrossRef]
- Moniotte, S.; Owen, M.; Barrea, T.; Robert, A.; Lysy, P.A. Outcomes of algorithm-based modifications of insulinotherapy during exercise in MDI vs insulin pump-treated children with type 1 diabetes: Results from the TREAD-DIAB study. Pediatr. Diabetes 2017, 18, 925–933. [Google Scholar] [CrossRef]
- Philis-Tsimikas, A.; Bajaj, H.S.; Begtrup, K.; Cailleteau, R.; Gowda, A.; Lingvay, I.; Mathieu, C.; Russell-Jones, D.; Rosenstock, J. Rationale and design of the phase 3a development programme (ONWARDS 1-6 trials) investigating once-weekly insulin icodec in diabetes. Diabetes Obes. Metab. 2023, 25, 331–341. [Google Scholar] [CrossRef]
- Almurashi, A.M.; Rodriguez, E.; Garg, S.K. Emerging Diabetes Technologies: Continuous Glucose Monitors/Artificial Pancreases. J. Indian Inst. Sci. 2023; ahead of print. [Google Scholar] [CrossRef]
- Moça, A.B.F.; Girotto, R.; Perozo, A.F.D.F.; Marques, T.; de Queiroz, L.L.; Pagung, L.S. Fatores preditores do bom e mau controle glicêmico dos pacientes com diabetes mellitus tipo 2 acompanhados em um serviço especializado no Rio de Janeiro. Rev. Eletrôn. Acervo Saúde 2024, 24, e14621. [Google Scholar] [CrossRef]
- Catamo, E.; Robino, A.; Dovc, K.; Tinti, D.; Tamaro, G.; Bonfanti, R.; Franceschi, R.; Rabbone, I.; Battelino, T.; Tornese, G. Screening of lipids and kidney function in children and adolescents with Type 1 Diabetes: Does age matter? Front. Endocrinol. 2023, 14, 1186913. [Google Scholar] [CrossRef]
- Valerio, G.; Iafusco, D.; Zucchini, S.; Maffeis, C. Abdominal adiposity and cardiovascular risk factors in adolescents with type 1 diabetes. Diabetes Res. Clin. Pract. 2012, 97, 99–104. [Google Scholar] [CrossRef]
- Zeng, Q.; Chen, X.J.; He, Y.T.; Ma, Z.M.; Wu, Y.X.; Lin, K. Body composition and metabolic syndrome in patients with type 1 diabetes. World J. Diabetes 2024, 15, 81–91. [Google Scholar] [CrossRef]
- Bezerra, M.F.; Neves, C.; Neves, J.S.; Carvalho, D. Time in range and complications of diabetes: A cross-sectional analysis of patients with Type 1 diabetes. Diabetol. Metab. Syndr. 2023, 15, 244. [Google Scholar] [CrossRef] [PubMed]
- Oboza, P.; Ogarek, N.; Olszanecka-Glinianowicz, M.; Kocelak, P. Can type 1 diabetes be an unexpected complication of obesity? Front. Endocrinol. 2023, 14, 1121303. [Google Scholar] [CrossRef] [PubMed]
- Fagerberg, A.; Borch, L.; Kristensen, K.; Hjelle, J.S. Prevalence, safety and metabolic control among Danish children and adolescents with Type 1 Diabetes using Open-Source Automated Insulin Delivery Systems. Diabetes Technol. Ther. 2024; ahead of print. [Google Scholar] [CrossRef]
- Nattero-Chávez, L.; Insenser, M.; Amigó, N.; Samino, S.; Martínez-Micaelo, N.; Dorado Avendaño, B.; Quintero Tobar, A.; Escobar-Morreale, H.F.; Luque-Ramírez, M. Quantification of lipoproteins by proton nuclear magnetic resonance spectroscopy ((1)H-NMRS) improves the prediction of cardiac autonomic dysfunction in patients with type 1 diabetes. J. Endocrinol. Investig. 2024. [Google Scholar] [CrossRef] [PubMed]
- Corpeleijn, W.E.; de Waal, W.J.; Schipper, H.S.; Wiegman, A. Dyslipidaemia as a target for atherosclerotic cardiovascular disease prevention in children with type 1 diabetes: Lessons learned from familial hypercholesterolaemia. Diabetologia 2024, 67, 19–26. [Google Scholar] [CrossRef] [PubMed]
- Drozd, I.; Weiskorn, J.; Lange, K.; Biester, T.; Datz, N.; Kapitzke, K.; Reschke, F.; von dem Berge, T.; Weidemann, J.; Danne, T.P.A.; et al. Prevalence of LDL-hypercholesterolemia and other cardiovascular risk factors in young people with type 1 diabetes. J. Clin. Lipidol. 2023, 17, 483–490. [Google Scholar] [CrossRef] [PubMed]
- Wu, F.; Juonala, M.; Jacobs Jr, D.R.; Daniels, S.R.; Kähönen, M.; Woo, J.G.; Sinaiko, A.R.; Viikari, J.S.; Bazzano, L.A.; Burns, T.L.; et al. Childhood Non-HDL Cholesterol and LDL Cholesterol and Adult Atherosclerotic Cardiovascular Events. Circulation 2024, 149, 217–226. [Google Scholar] [CrossRef] [PubMed]
- Albers, J.J.; Marcovina, S.M.; Imperatore, G.; Snively, B.M.; Stafford, J.; Fujimoto, W.Y.; Mayer-Davis, E.J.; Petitti, D.B.; Pihoker, C.; Dolan, L.; et al. Prevalence and determinants of elevated apolipoprotein B and dense low-density lipoprotein in youths with type 1 and type 2 diabetes. J. Clin. Endocrinol. Metab. 2008, 93, 735–742. [Google Scholar] [CrossRef]
- de Onis, M.; Onyango, A.W.; Borghi, E.; Siyam, A.; Nishida, C.; Siekmann, J. Development of a WHO growth reference for school-aged children and adolescents. Bull. World Health Organ. 2007, 85, 660–667. [Google Scholar] [CrossRef] [PubMed]
- Beck, F.; Marzi, I.; Eisenreich, A.; Seemüller, S.; Tristram, C.; Reimers, A.K. Determination of cut-off points for the Move4 accelerometer in children aged 8–13 years. BMC Sports Sci. Med. Rehabil. 2023, 15, 163. [Google Scholar] [CrossRef] [PubMed]
- Calcaterra, V.; Biganzoli, G.; Ferraro, S.; Verduci, E.; Rossi, V.; Vizzuso, S.; Bosetti, A.; Borsani, B.; Biganzoli, E.; Zuccotti, G. A Multivariate Analysis of “Metabolic Phenotype” Patterns in Children and Adolescents with Obesity for the Early Stratification of Patients at Risk of Metabolic Syndrome. J. Clin. Med. 2022, 11, 1856. [Google Scholar] [CrossRef]
- Bouchard, C.; Tremblay, A.; Leblanc, C.; Lortie, G.; Savard, R.; Thériault, G. A method to assess energy expenditure in children and adults. Am. J. Clin. Nutr. 1983, 37, 461–467. [Google Scholar] [CrossRef] [PubMed]
- Wang, X.; Mao, D.; Xu, Z.; Wang, Y.; Yang, X.; Zhuo, Q.; Tian, Y.; Huan, Y.; Li, Y. Predictive Equation for Basal Metabolic Rate in Normal-Weight Chinese Adults. Nutrients 2023, 15, 4185. [Google Scholar] [CrossRef] [PubMed]
- Henry, C.J. Basal metabolic rate studies in humans: Measurement and development of new equations. Public Health Nutr. 2005, 8, 1133–1152. [Google Scholar] [CrossRef] [PubMed]
- Human energy requirements. Scientific background papers from the Joint FAO/WHO/UNU Expert Consultation. October 17-24, 2001. Rome, Italy. Public Health Nutr. 2005, 8, 929–1228. [Google Scholar] [CrossRef]
- de Faria, R.R.; de Siqueira, S.F.; Haddad, F.A.; Del Monte Silva, G.; Spaggiari, C.V.; Martinelli Filho, M. Os Seis Pilares da Medicina do Estilo de Vida no Manejo de Doenças Não Transmissíveis–As Lacunas nas Diretrizes Atuais. Arq. Bras. Cardiol. 2024, 120, e20230408. [Google Scholar] [CrossRef]
- Morat, B.; Lucidarme, N.; Gibert, A.; Harbulot, C.; Lachaume, N.; Gréteau, S.; Basmaci, R. Impact of lockdown on children with type-1 diabetes: Returning to the community was associated with a decrease in HbA1c. Front. Pediatr. 2023, 11, 1245861. [Google Scholar] [CrossRef]
- Sibal, L.; Neely, R.D.; Jones, A.; Home, P.D. Friedewald equation underestimates low-density lipoprotein cholesterol at low concentrations in young people with and without Type 1 diabetes. Diabet. Med. 2010, 27, 37–45. [Google Scholar] [CrossRef]
- Gujral, J.; Gupta, J. Pediatric Dyslipidemia. In StatPearls; StatPearls Publishing LLC.: Treasure Island, FL, USA, 2023. [Google Scholar]
- Askari, S.; Ogle, G.D.; Eigenmann, C.A. Diabetes in children and adolescents. In BIDE’s Diabetes Desk Book; Elsevier: Amsterdam, The Netherlands, 2024; pp. 293–315. [Google Scholar]
- Herzog, K.; Andersson, T.; Grill, V.; Hammar, N.; Malmström, H.; Talbäck, M.; Walldius, G.; Carlsson, S. Alterations in Biomarkers Related to Glycemia, Lipid Metabolism, and Inflammation up to 20 Years Before Diagnosis of Type 1 Diabetes in Adults: Findings From the AMORIS Cohort. Diabetes Care 2022, 45, 330–338. [Google Scholar] [CrossRef]
- Menegucci, T.; Chagas, E.F.B.; de Oliveira Zanuso, B.; Quesada, K.; Dos Santos Haber, J.F.; Menegucci Zutin, T.L.; Felipe Pimenta, L.; Cressoni Araújo, A.; Landgraf Guiguer, E.; Rucco, P.D.C.; et al. The Influence of Body Fat and Lean Mass on HbA1c and Lipid Profile in Children and Adolescents with Type 1 Diabetes Mellitus. Diseases 2023, 11, 125. [Google Scholar] [CrossRef]
- de Ferranti, S.D.; Newburger, J.W. Dyslipidemia in Children and Adolescents: Definition, Screening, and Diagnosis; UpToDate: Waltham, MA, USA, 2020. [Google Scholar]
- da Silva, T.P.R.; Mendes, L.L.; Barreto, V.M.J.; Matozinhos, F.P.; Duarte, C.K. Total cholesterol and low-density lipoprotein alterations in children and adolescents from Brazil: A prevalence meta-analysis. Arch. Endocrinol. Metab. 2022, 67, 19–44. [Google Scholar] [CrossRef] [PubMed]
- Zhu, J.; Volkening, L.K.; Laffel, L.M. Determination of Pubertal Status in Youths With Type 1 Diabetes Using Height Velocity and Trajectories. J. Clin. Endocrinol. Metab. 2019, 104, 74–82. [Google Scholar] [CrossRef]
- Silverio, R.N.C.; de Aquino Lacerda, E.M.; Fortins, R.F.; de Lima, G.C.F.; Scancetti, L.B.; do Carmo, C.N.; da Cunha, L.V.S.; Luescher, J.L.; de Carvalho Padilha, P. Predictive factors of non-HDL cholesterol in children and adolescents with type 1 diabetes mellitius: A cross-sectional study. Diabetes Res. Clin. Pract. 2019, 154, 9–16. [Google Scholar] [CrossRef] [PubMed]
- Fornari, E.; Piona, C.; Rabbone, I.; Cardella, F.; Mozzillo, E.; Predieri, B.; Lo Presti, D.; Cherubini, V.; Patera, I.P.; Suprani, T.; et al. Cardiovascular risk factors in children and adolescents with type 1 diabetes in Italy: A multicentric observational study. Pediatr. Diabetes 2020, 21, 1546–1555. [Google Scholar] [CrossRef]
- Bertoluci, M.C.; Moreira, R.O.; Faludi, A.; Izar, M.C.; Schaan, B.D.; Valerio, C.M.; Bertolami, M.C.; Chacra, A.P.; Malachias, M.V.B.; Vencio, S.J.D.; et al. Brazilian guidelines on prevention of cardiovascular disease in patients with diabetes: A position statement from the Brazilian Diabetes Society (SBD), the Brazilian Cardiology Society (SBC) and the Brazilian Endocrinology and Metabolism Society (SBEM). Diabetol. Metab. Syndr. 2017, 9, 1–36. [Google Scholar] [CrossRef] [PubMed]
- de Oliveira Izar, M.C.; Fonseca, F.A.H.; Árpád, A.; de Araújo, D.B. Estratificação de risco em pessoas com diabetes. Manejo Risco Cardiovasc. Dislipidemia 2022, 12, 14. [Google Scholar]
- Vaid, S.; Hanks, L.; Griffin, R.; Ashraf, A.P. Body mass index and glycemic control influence lipoproteins in children with type 1 diabetes. J. Clin. Lipidol. 2016, 10, 1240–1247. [Google Scholar] [CrossRef] [PubMed]
- Magge, S.N. Cardiovascular risk in children and adolescents with type 1 and type 2 diabetes mellitus. Curr. Cardiovasc. Risk Rep. 2012, 6, 591–600. [Google Scholar] [CrossRef]
- Cai, L.; Horowitz, M.; Islam, M.S. Potential therapeutic targets for the prevention of diabetic nephropathy: Glycyrrhetinic acid. World J. Diabetes 2023, 14, 1717–1720. [Google Scholar] [CrossRef]
- Maia, F.F.; Araújo, L.R. Continuous glucose monitoring system (CGMS) in type 1 diabetic patients during 4 (96 h) or 5 (120 h) days: There is advantage? Arq. Bras. Endocrinol. Metabol. 2008, 52, 499–505. [Google Scholar] [CrossRef] [PubMed]
- Perak, A.M.; Ning, H.; Kit, B.K.; De Ferranti, S.D.; Van Horn, L.V.; Wilkins, J.T.; Lloyd-Jones, D.M. Trends in levels of lipids and apolipoprotein B in US youths aged 6 to 19 years, 1999–2016. JAMA 2019, 321, 1895–1905. [Google Scholar] [CrossRef]
- Macedoni, M.; Hovnik, T.; Plesnik, E.; Kotnik, P.; Bratina, N.; Battelino, T.; Groselj, U. Metabolic control, ApoE genotypes, and dyslipidemia in children, adolescents and young adults with type 1 diabetes. Atherosclerosis 2018, 273, 53–58. [Google Scholar] [CrossRef] [PubMed]
- Bauman, C.D.; Bauman, J.M.; Mourão, D.M.; Pinho, L.d.; Brito, M.F.S.F.; Carneiro, A.L.G.; Silveira, M.F. Dyslipidemia prevalence in adolescents in public schools. Rev. Bras. Enferm. 2020, 73, e20180523. [Google Scholar] [CrossRef]
- Selvaraj, M.; Prasad, H.K.; White, S.; Prasanna, B.; Sangaralingam, T. Prevalence and determinants of occurrence of dyslipidemia in subjects with type 1 diabetes mellitus. Indian J. Pediatr. 2023, 90, 118–123. [Google Scholar] [CrossRef]
- Shah, N.; Khadilkar, A.; Gondhalekar, K.; Khadilkar, V. Prevalence of dyslipidemia in Indian children with poorly controlled type 1 diabetes mellitus. Pediatr. Diabetes 2020, 21, 987–994. [Google Scholar] [CrossRef]
- Oza, C.; Khadilkar, A.; Mondkar, S.A.; Gondhalekar, K.; Khadilkar, V. Longitudinal trends in lipid profile in indian children and youth with type-1 diabetes: A 5-year follow up from a single centre. Endocrine 2023, 79, 313–322. [Google Scholar] [CrossRef] [PubMed]
- Monteiro, A.L.; de Andre Cardoso-Demartini, A.; Fritz, C.K.; de Araujo Porchat Leão, A.; Cat, M.L.N.; de Carvalho Kraemer, G.; França, S.N. Lipid profile of children and adolescents with type 1 diabetes mellitus. Soc. Bras. Pediatr. 2020, 170, 170–199. [Google Scholar] [CrossRef]
- Bulut, T.; Demirel, F.; Metin, A. The prevalence of dyslipidemia and associated factors in children and adolescents with type 1 diabetes. J. Pediatr. Endocrinol. Metab. 2017, 30, 181–187. [Google Scholar] [CrossRef]
- Homma, T.K.; Endo, C.M.; Saruhashi, T.; Mori, A.P.I.; Noronha, R.M.D.; Monte, O.; Calliari, L.E.P. Dyslipidemia in young patients with type 1 diabetes mellitus. Arch. Endocrinol. Metab. 2015, 59, 215–219. [Google Scholar] [CrossRef] [PubMed]
- Vergès, B. Dyslipidemia in type 1 diabetes: A masked danger. Trends Endocrinol. Metab. 2020, 31, 422–434. [Google Scholar] [CrossRef] [PubMed]
- Malmström, H.; Walldius, G.; Carlsson, S.; Grill, V.; Jungner, I.; Gudbjörnsdottir, S.; Kosiborod, M.; Hammar, N. Elevations of metabolic risk factors 20 years or more before diagnosis of type 2 diabetes: Experience from the AMORIS study. Diabetes Obes. Metab. 2018, 20, 1419–1426. [Google Scholar] [CrossRef] [PubMed]
- Sierra-Johnson, J.; Romero-Corral, A.; Somers, V.K.; Lopez-Jimenez, F.; Walldius, G.; Hamsten, A.; Hellénius, M.L.; Fisher, R.M. ApoB/apoA-I ratio: An independent predictor of insulin resistance in US non-diabetic subjects. Eur. Heart J. 2007, 28, 2637–2643. [Google Scholar] [CrossRef]
- Maahs, D.M.; Nadeau, K.; Snell-Bergeon, J.K.; Schauer, I.; Bergman, B.; West, N.A.; Rewers, M.; Daniels, S.R.; Ogden, L.G.; Hamman, R.F.; et al. Association of insulin sensitivity to lipids across the lifespan in people with Type 1 diabetes. Diabet. Med. 2011, 28, 148–155. [Google Scholar] [CrossRef]
- Gomes, M.; Negrato, C. Adherence to insulin therapeutic regimens in patients with type 1 diabetes. A nationwide survey in Brazil. Diabetes Res. Clin. Pract. 2016, 120, 47–55. [Google Scholar] [CrossRef]
- Elhenawy, Y.I.; Abdelmageed, R.I.; Zaafar, D.K.; Abdelaziz, A.W. Adherence to insulin therapy among children with type 1 diabetes: Reliability and validity of the Arabic version of the 4-item morisky medication adherence scale. Patient Prefer. Adherence 2022, 7, 1415–1421. [Google Scholar] [CrossRef]
- Vuralli, D.; Jalilova, L.; Alikasifoglu, A.; Ozon, Z.A.; Gonc, E.N.; Kandemir, N. Cardiovascular Risk Factors in Adolescents with Type 1 Diabetes: Prevalence and Gender Differences. J. Clin. Res. Pediatr. Endocrinol. 2023; ahead of print. [Google Scholar]
- Smigoc Schweiger, D.; Battelino, T.; Groselj, U. Sex-related differences in cardiovascular disease risk profile in children and adolescents with type 1 diabetes. Int. J. Mol. Sci. 2021, 22, 10192. [Google Scholar] [CrossRef] [PubMed]
- Noras, K.; Rusak, E.; Jarosz-Chobot, P. The Problem of Abnormal Body Weight and Dyslipidemia as Risk Factors for Cardiovascular Diseases in Children and Adolescents with Type 1 Diabetes. J. Diabetes Res. 2021, 2021, 5555149. [Google Scholar] [CrossRef] [PubMed]
- Mosca, S.; Araújo, G.; Costa, V.; Correia, J.; Bandeira, A.; Martins, E.; Mansilha, H.; Tavares, M.; Coelho, M.P. Dyslipidemia diagnosis and treatment: Risk stratification in children and adolescents. J. Nutr. Metab. 2022, 2022, 4782344. [Google Scholar] [CrossRef] [PubMed]
- Kosteria, I.; Schwandt, A.; Davis, E.; Jali, S.; Prieto, M.; Rottembourg, D.; SWEET Study Group. Lipid profile is associated with treatment regimen in a large cohort of children and adolescents with Type 1 diabetes mellitus: A study from the international SWEET database. Diabet. Med. 2019, 36, 1294–1303. [Google Scholar] [CrossRef] [PubMed]

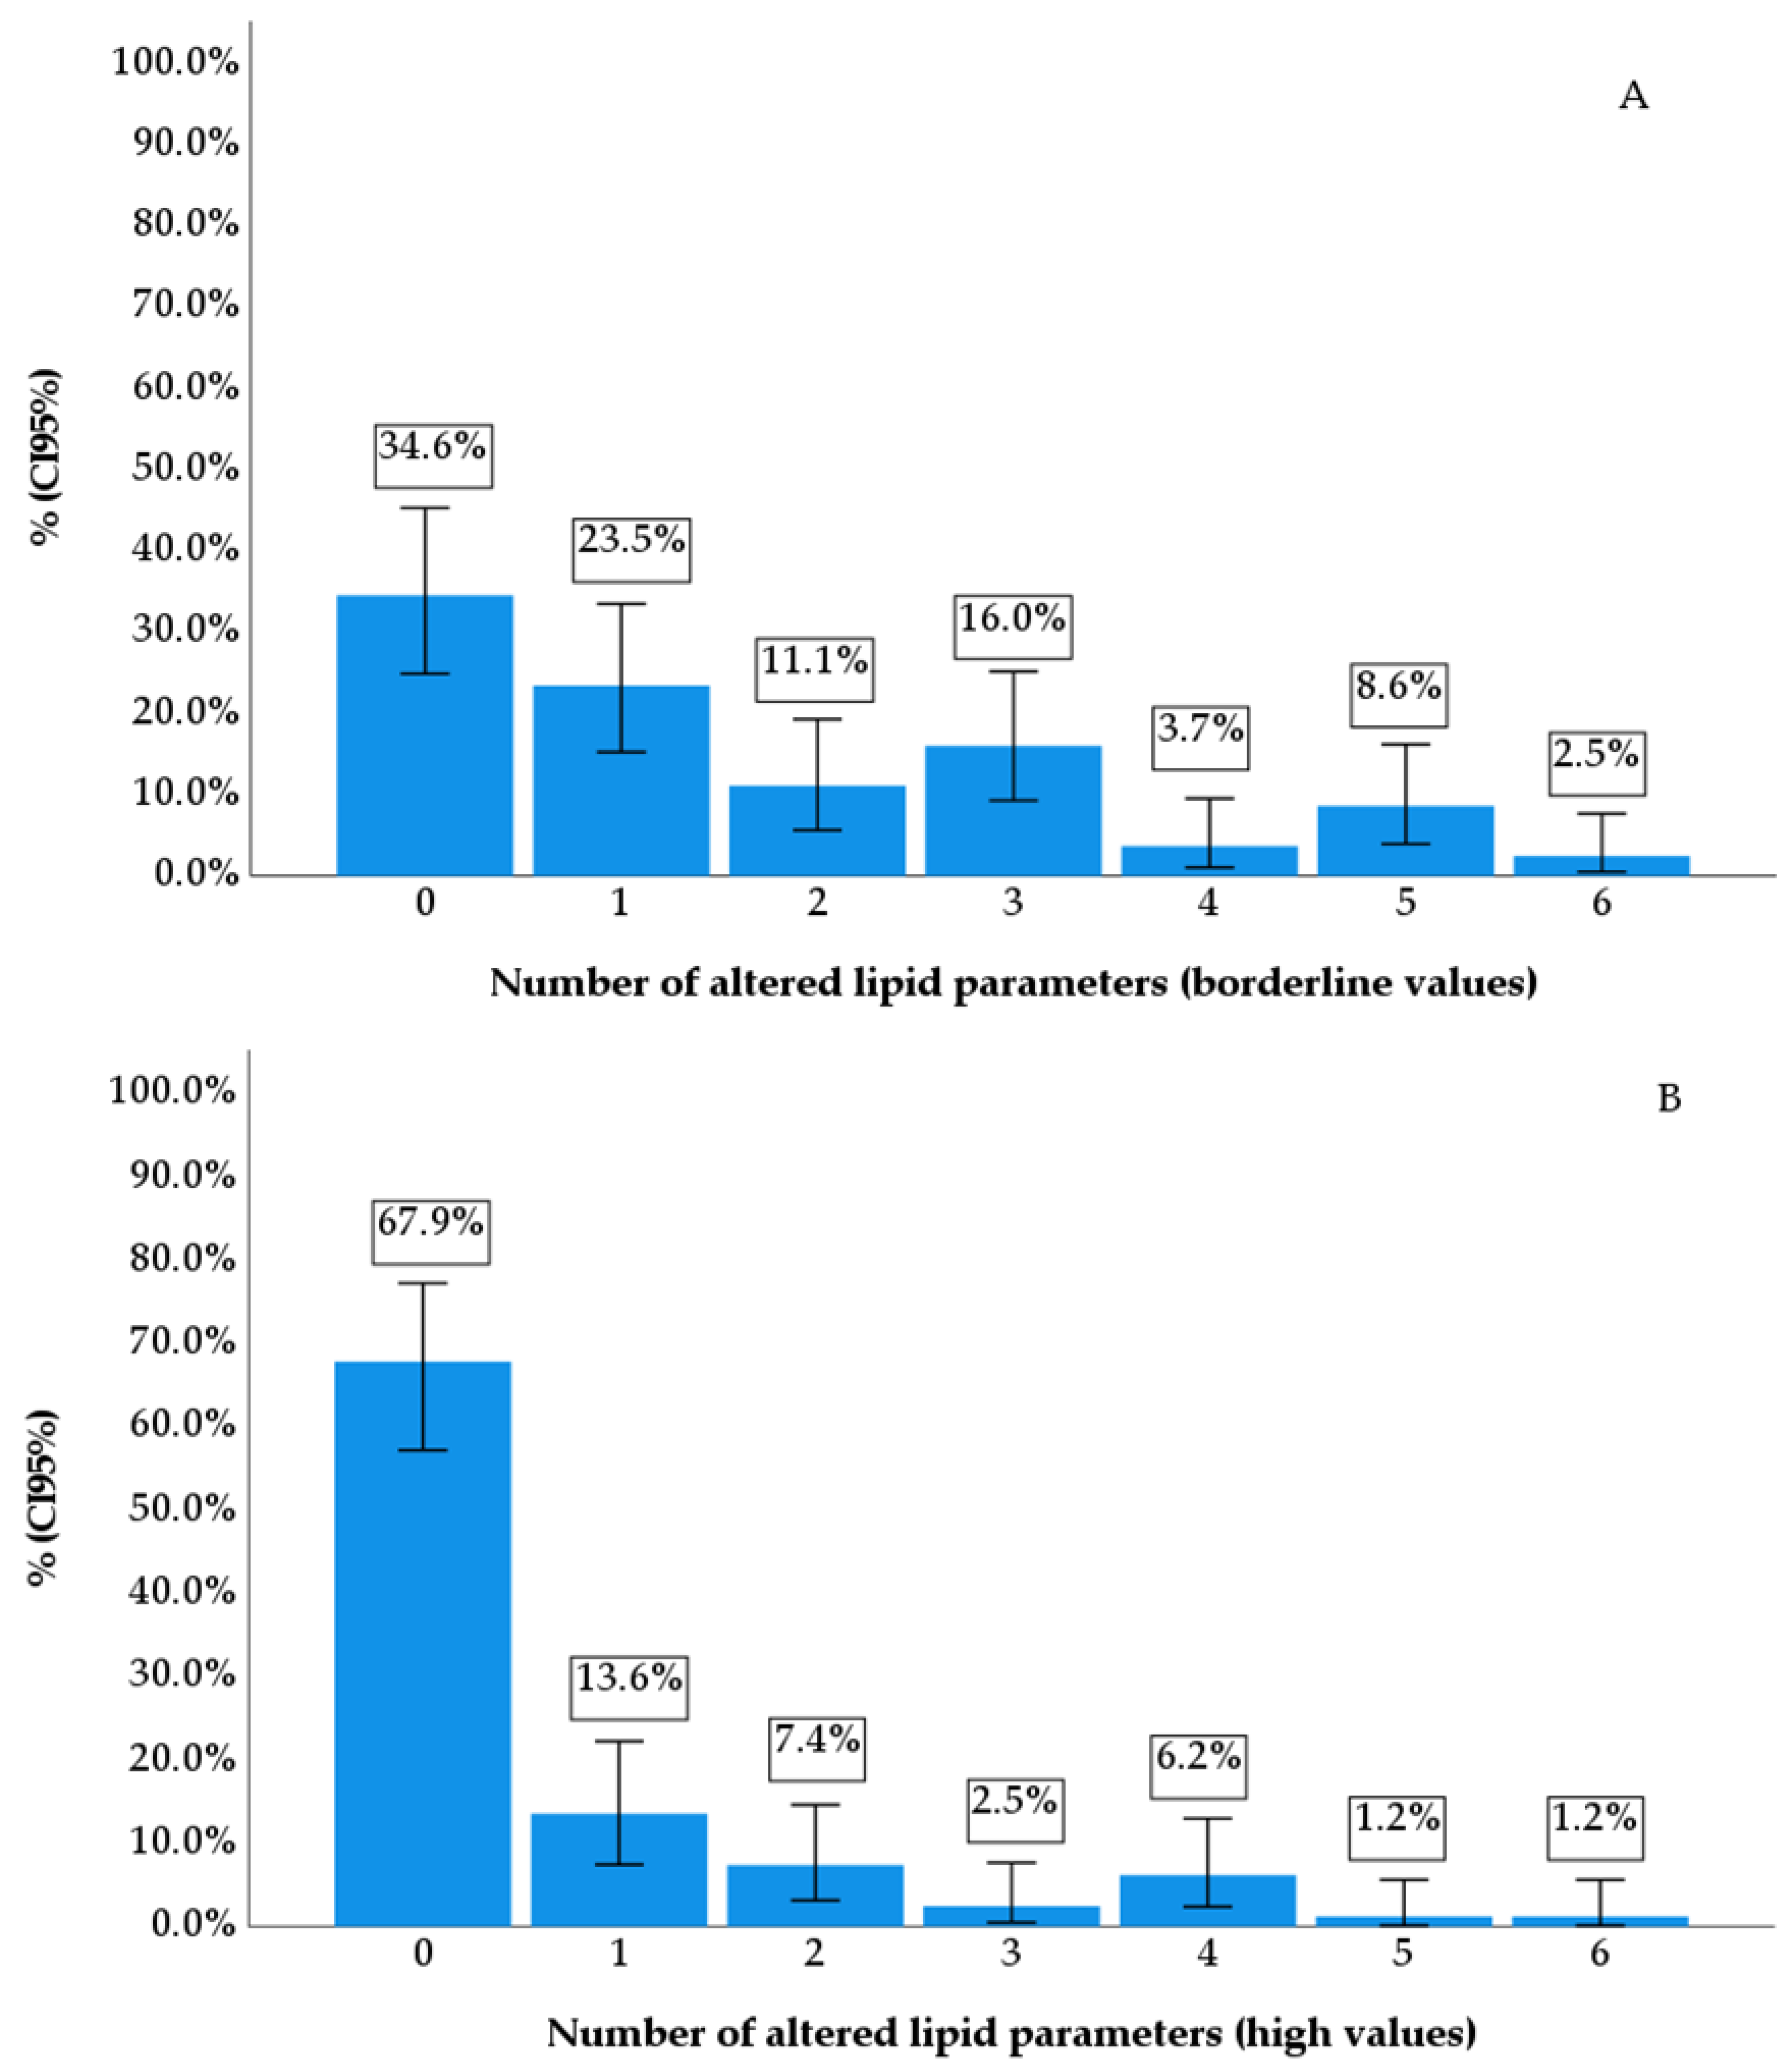

| Parameters | f | % | CI95% | ||
|---|---|---|---|---|---|
| LL | UL | ||||
| Gender | Male | 48 | 59.3 | 48.1 | 70.3 |
| Female | 33 | 40.7 | 29.7 | 51.9 | |
| Diagnostic time | <5 years | 46 | 56.8 | 45.7 | 66.7 |
| >5 years | 35 | 43.2 | 33.3 | 54.3 | |
| Pubertal staging | Pre-pubescent | 21 | 25.9 | 17.3 | 35.8 |
| Pubescent | 28 | 34.6 | 24.7 | 45.7 | |
| Post-pubertal | 32 | 39.5 | 28.4 | 50.6 | |
| Associated comorbidities | Yes | 5 | 6.2 | 1.2 | 11.1 |
| No | 76 | 93.8 | 88.9 | 98.8 | |
| PAL | Low active | 70 | 86.4 | 77.8 | 93.8 |
| Moderate active | 11 | 13.6 | 6.2 | 22.2 | |
| Insulin administration | CIIS | 22 | 27.2 | 18.5 | 37.0 |
| MDI | 59 | 72.8 | 63.0 | 81.5 | |
| Glycated hemoglobin | <7% | 20 | 24.4 | 14.6 | 34.1 |
| 7 a 7.9% | 15 | 18.3 | 11.0 | 26.8 | |
| ≥8% | 47 | 57.3 | 46.3 | 67.1 | |
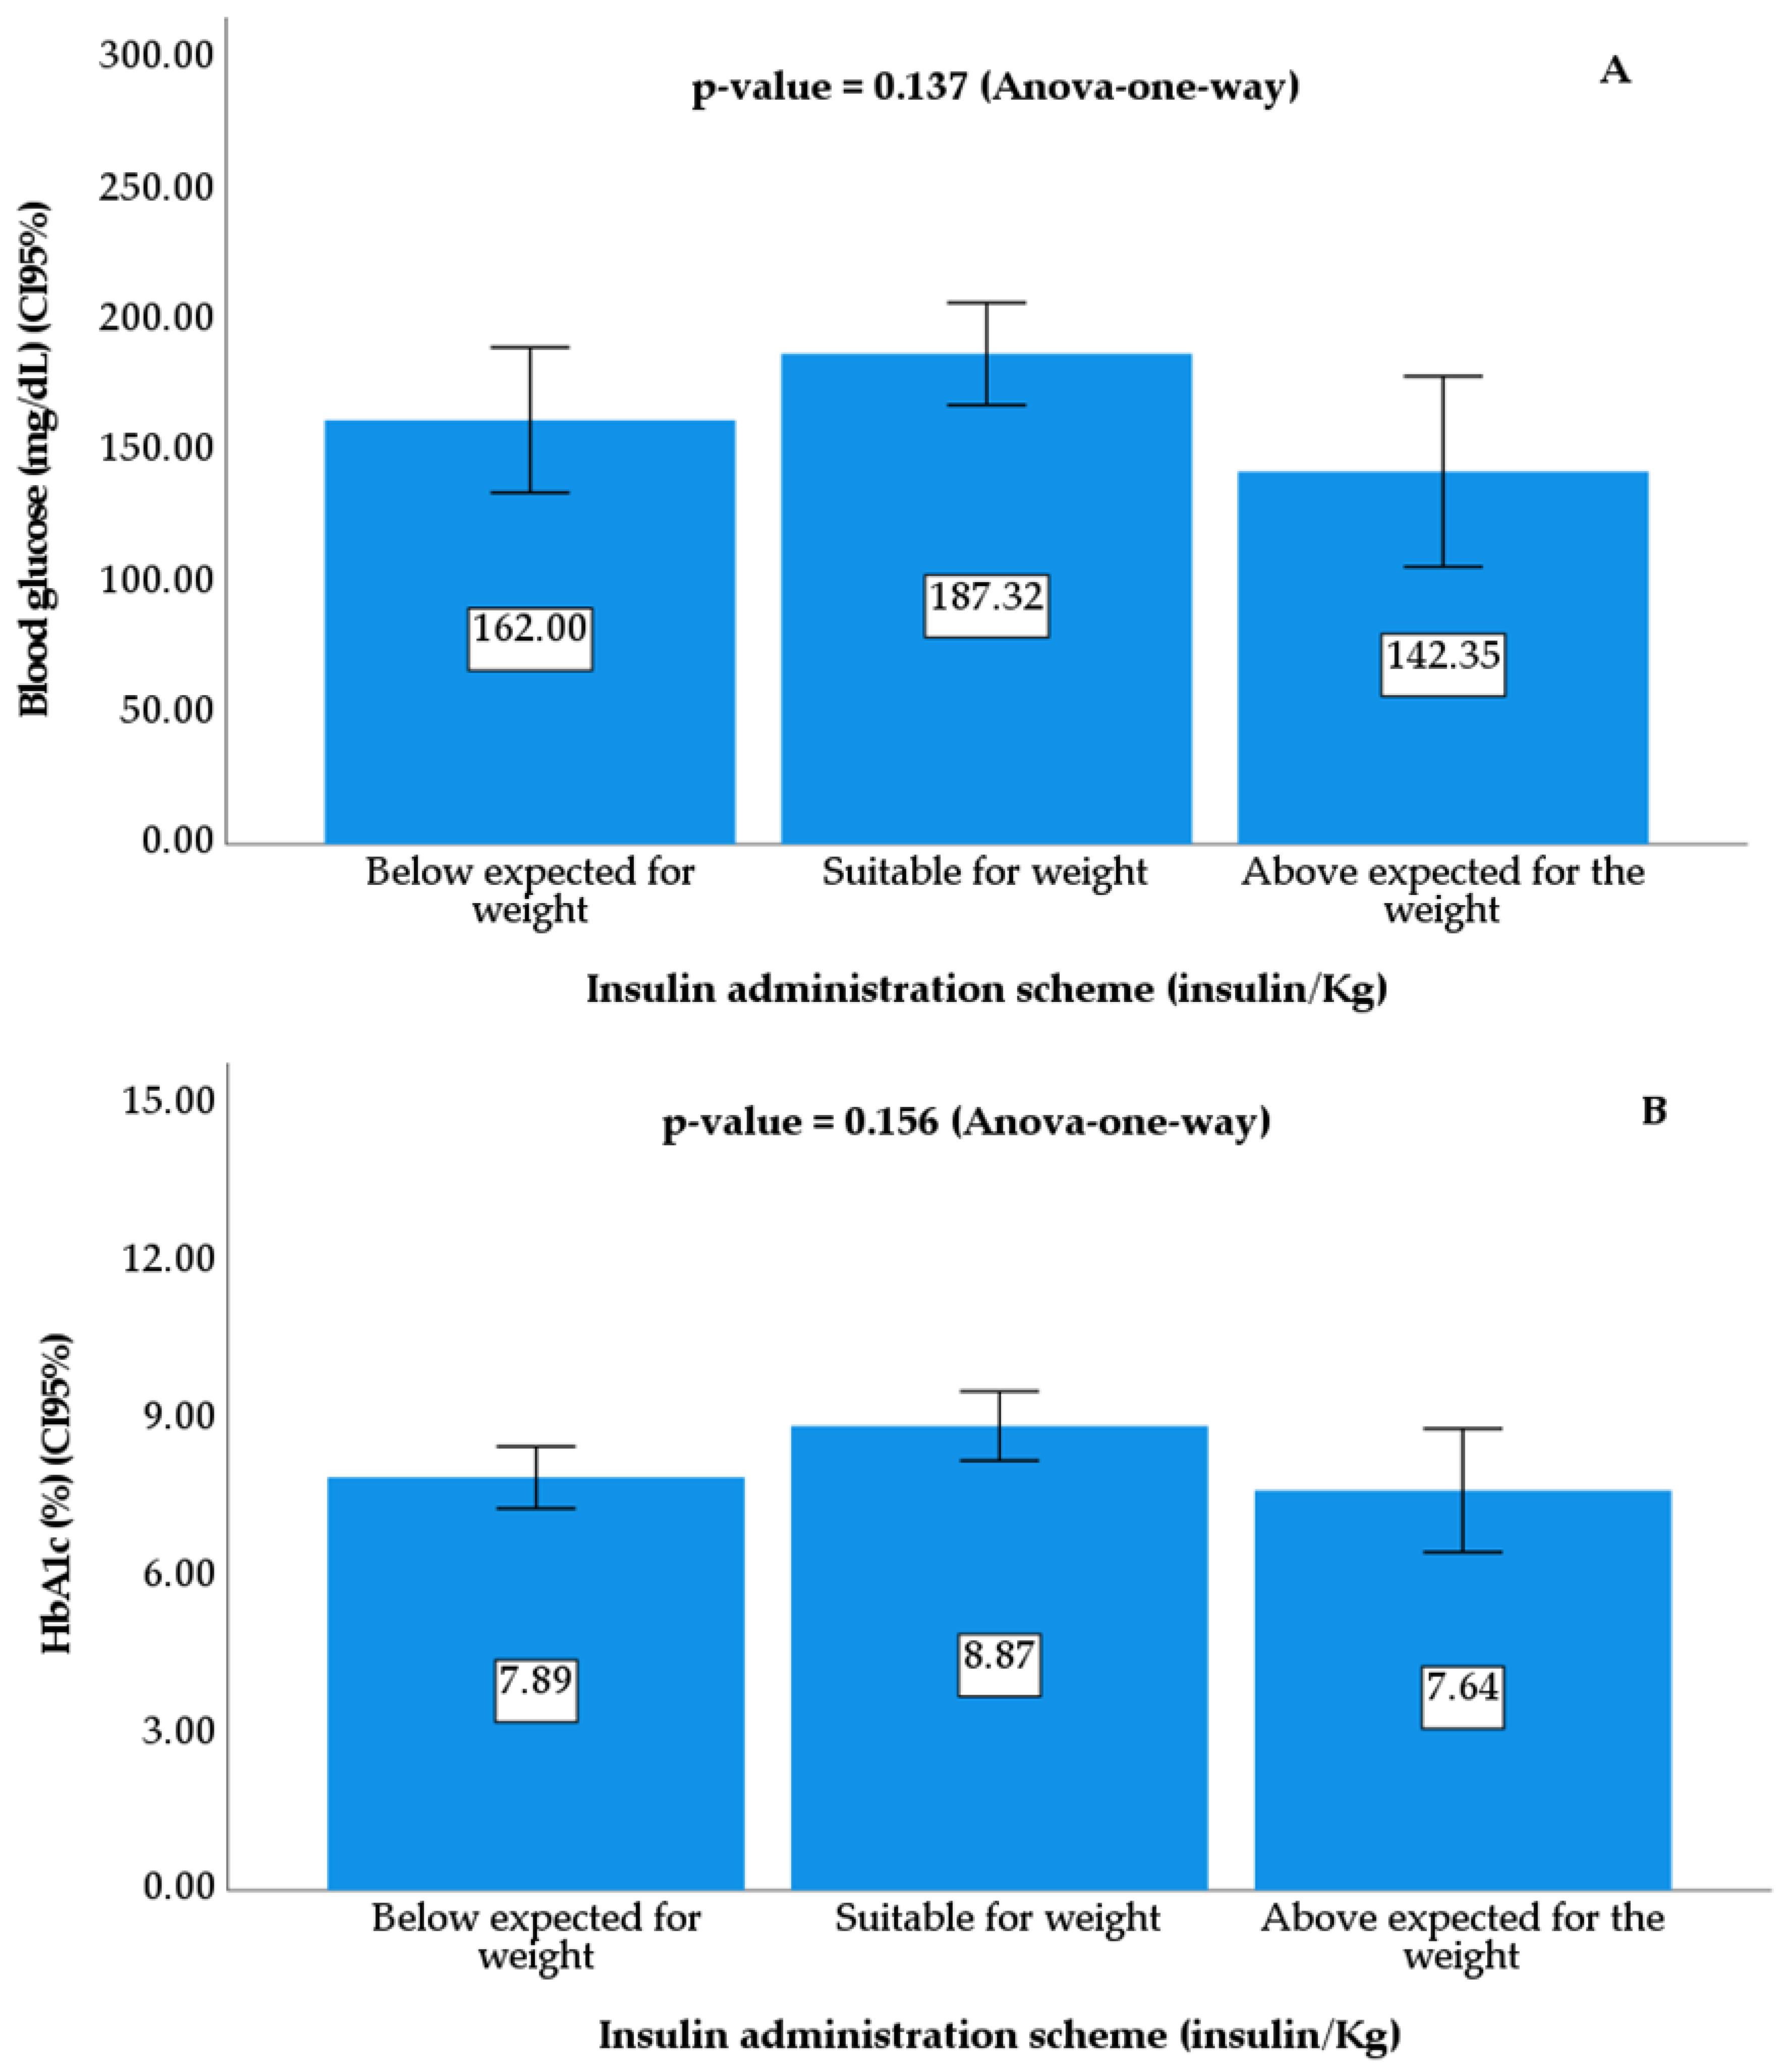
| Insulin/kg | Below expected for weight | 15 | 18.5 | 9.9 | 27.2 |
| Adequate for weight | 58 | 71.6 | 60.5 | 81.5 | |
| Above expected for the weight | 8 | 9.9 | 3.7 | 17.3 | |
| MI-z nutritional status | Underweight | 9 | 11.1 | 4.9 | 18.5 |
| Normal weight | 52 | 64.2 | 53.1 | 75.3 | |
| Overweight | 18 | 22.2 | 13.6 | 32.1 | |
| Obese | 2 | 2.5 | 0.0 | 6.2 | |
| Obesity (fat %) | Obese | 19 | 23.5 | 14.8 | 32.1 |
| Not obese | 62 | 76.5 | 67.9 | 85.2 | |
| Lipid Profile | f | % | CI95% | ||
|---|---|---|---|---|---|
| LL | UL | ||||
| TC | Borderline | 34 | 42.0 | 30.9 | 51.9 |
| Elevated | 14 | 17.3 | 9.9 | 25.9 | |
| TG | Borderline | 27 | 33.3 | 23.5 | 44.4 |
| Elevated | 13 | 16.0 | 8.6 | 24.7 | |
| LDL-c | Borderline | 13 | 16.0 | 8.6 | 24.7 |
| Elevated | 7 | 8.6 | 3.7 | 14.8 | |
| HDL-c | Borderline | 14 | 17.3 | 9.9 | 25.9 |
| Elevated | 5 | 6.2 | 1.2 | 12.3 | |
| non-HDL-c | Borderline | 29 | 35.8 | 25.9 | 46.9 |
| Elevated | 13 | 16.0 | 8.6 | 23.5 | |
| ApoA-1 | Borderline | 2 | 2.5 | 0.0 | 6.2 |
| Elevated | 2 | 2.5 | 0.0 | 6.2 | |
| ApoB | Borderline | 16 | 19.8 | 12.3 | 29.6 |
| Elevated | 6 | 7.4 | 2.5 | 13.6 | |
| Dyslipidemia | Borderline | 53 | 65.4 | 54.3 | 75.3 |
| Elevated | 26 | 32.1 | 22.3 | 42.0 | |
| Parameters | HbA1c | p-Value | ||||||||
|---|---|---|---|---|---|---|---|---|---|---|
| <7% (n = 20) | 7 a 7.9% (n = 15) | ≥8% (n = 46) | ||||||||
| Mean | CI 95% | Mean | CI 95% | Mean | CI 95% | |||||
| LL | UL | LL | UL | LL | UL | |||||
| Age (years) | 12.8 | 11.0 | 14.5 | 14.1 | 12.7 | 15.5 | 12.1 | 11.0 | 13.2 | 0.159 |
| Diagnosis time (year) | 4.8 | 3.6 | 6.0 | 4.9 | 3.0 | 6.7 | 3.9 | 3.0 | 4.8 | 0.415 |
| PAL (score) | 1.20 | 1.10 | 1.30 | 1.30 | 1.18 | 1.41 | 1.24 | 1.18 | 1.30 | 0.366 |
| BMI (z-score) | 0.67 | 0.10 | 1.23 | 0.76 | −0.05 | 1.56 | −0.09 | −0.41 | 0.23 | 0.014 |
| Conicity index | 1.14 | 1.09 | 1.18 | 1.15 | 1.10 | 1.21 | 1.14 | 1.12 | 1.16 | 0.789 |
| Fat (%) | 21.3 | 17.1 | 25.4 | 25.6 | 21.6 | 29.5 | 20.8 | 18.6 | 22.9 | 0.108 |
| Lean mass (%) | 78.9 | 75.0 | 82.8 | 76.4 | 71.9 | 80.9 | 78.5 | 76.3 | 80.7 | 0.604 |
| TC (mg/dL) | 177.5 | 165.3 | 189.7 | 152.2 | 136.2 | 168.1 | 164.2 | 153.3 | 175.2 | 0.084 |
| TG (mg/dL) | 90.9 | 67.2 | 114.6 | 91.3 | 50.4 | 132.3 | 76.1 | 62.7 | 89.4 | 0.449 |
| LDL-c (mg/dL) | 93.1 | 83.6 | 102.7 | 79.8 | 71.5 | 88.2 | 90.8 | 81.2 | 100.5 | 0.316 |
| HDL-c(mg/dL) | 59.7 | 53.5 | 65.8 | 51.1 | 44.5 | 57.8 | 54.4 | 51.9 | 56.8 | 0.049 * |
| Não-HDL-c (mg/dL) | 117.8 | 104.5 | 131.1 | 101.0 | 86.7 | 115.3 | 109.9 | 98.3 | 121.4 | 0.363 |
| ApoA (mg/dL) | 158.3 | 149.0 | 167.7 | 140.0 | 129.9 | 150.0 | 147.9 | 143.4 | 152.4 | 0.007 * |
| ApoB (mg/dL) | 78.5 | 71.3 | 85.7 | 70.3 | 61.0 | 79.5 | 78.9 | 72.9 | 84.9 | 0.282 |
| Parameters | HbA1c | |||||||||||
|---|---|---|---|---|---|---|---|---|---|---|---|---|
| <7% (n = 20) | 7 a 7.9% (n = 15) | ≥8% (n = 46) | ||||||||||
| f | % | CI95% | f | % | CI95% | f | % | CI95% | ||||
| LL | UL | LL | UL | LL | UL | |||||||
| CT >170 mg/dL | 6 | 30.0 | 10.0 | 50.0 | 7 | 46.7 | 20.0 | 73.3 | 21 | 45.7 | 30.4 | 60.9 |
| TG >75 ou >90 mg/dL | 7 | 35.0 | 15.0 | 55.0 | 6 | 40.0 | 13.3 | 66.7 | 14 | 30.4 | 17.4 | 43.5 |
| LDL-c >110 mg/dL | 2 | 10.0 | 0.0 | 25.0 | 6 | 40.0 | 13.3 | 66.7 | 5 | 10.9 | 2.2 | 21.7 |
| HDL-c <45 mg/dL | 5 | 25.0 | 10.0 | 45.0 | 2 | 13.3 | 0.0 | 33.3 | 7 | 15.2 | 4.4 | 26.1 |
| Non-HDL-c >120 mg/dL | 6 | 30.0 | 10.0 | 50.0 | 6 | 40.0 | 13.3 | 66.7 | 17 | 37.0 | 23.9 | 52.1 |
| ApoB >90 mg/dL | 6 | 30.0 | 10.0 | 50.0 | 4 | 26.7 | 6.7 | 46.7 | 6 | 13.0 | 4.3 | 23.9 |
| ApoA-I<120 mg/dL | 0 | 0.0 | 0.0 | 0.0 | 1 | 6.7 | 0.0 | 20.0 | 1 | 2.2 | 0.0 | 6.5 |
| Dyslipidemia | 12 | 60.0 | 35.0 | 80.0 | 11 | 73.3 | 46.7 | 93.3 | 30 | 65.2 | 52.2 | 78.3 |
| Parameters | B | CI95% (B) | p-Value | Model | |||
|---|---|---|---|---|---|---|---|
| Dependent | Independent | LL | UL | p-Value | R2 | ||
| CT (mg/dL) | (Constant) | 92.24 | 59.82 | 124.66 | <0.001 * | <0.001 ⱡ | 0.216 |
| Gender | 14.92 | 1.27 | 28.57 | 0.033 * | |||
| HbA1c (%) | 6.07 | 3.10 | 9.05 | <0.001 * | |||
| TG (mg/dL) | (Constant) | −58.15 | −138.02 | 21.72 | 0.151 | <0.001 ⱡ | 0.364 |
| Age (years) | −6.95 | −13.88 | −0.03 | 0.049 * | |||
| Diagnostic time (years) | 7.84 | 3.94 | 11.73 | <0.001 * | |||
| HbA1c (%) | 6.65 | 2.28 | 11.02 | 0.003 * | |||
| Pubertal staging | 41.41 | 9.87 | 72.96 | 0.011 * | |||
| Insulin/kg | 25.69 | 1.55 | 49.83 | 0.037 * | |||
| LDL-c (mg/dL) | (Constant) | 44.91 | 23.25 | 66.56 | <0.001 * | <0.001 ⱡ | 0.184 |
| HbA1c (%) | 5.19 | 2.75 | 7.64 | <0.001 * | |||
| HDL-c (mg/dL) | (Constant) | 48.03 | 41.03 | 55.03 | <0.001 * | 0.037 ⱡ | 0.054 |
| Gender | 5.00 | 0.30 | 9.70 | 0.037 * | |||
| Non-HDL-C (mg/dL) | (Constant) | 55.28 | 27.97 | 82.58 | <0.001 * | <0.001 ⱡ | 0.178 |
| HbA1c (%) | 6.41 | 3.33 | 9.50 | <0.001 * | |||
| ApoA-I (mg/dL) | (Constant) | 131.23 | 119.91 | 142.55 | <0.001 * | 0.001 ⱡ | 0.122 |
| Gender | 12.63 | 5.04 | 20.22 | 0.001 * | |||
| ApoB (mg/dL) | (Constant) | 48.99 | 34.08 | 63.90 | <0.001 * | <0.001 ⱡ | 0.161 |
| HbA1c (%) | 3.29 | 1.61 | 4.98 | <0.001 * | |||
Disclaimer/Publisher’s Note: The statements, opinions and data contained in all publications are solely those of the individual author(s) and contributor(s) and not of MDPI and/or the editor(s). MDPI and/or the editor(s) disclaim responsibility for any injury to people or property resulting from any ideas, methods, instructions or products referred to in the content. |
© 2024 by the authors. Licensee MDPI, Basel, Switzerland. This article is an open access article distributed under the terms and conditions of the Creative Commons Attribution (CC BY) license (https://creativecommons.org/licenses/by/4.0/).
Share and Cite
Fagundes Melo, R.; Laurindo, L.F.; Sloan, K.P.; Sloan, L.A.; Cressoni Araújo, A.; Bitelli, P.; Laís Menegucci Zutin, T.; Haber Mellen, R.; Junqueira Mellen, L.; Landgraf Guiguer, E.; et al. Investigating the Incidence of Dyslipidemia among Brazilian Children and Adolescents Diagnosed with Type 1 Diabetes Mellitus: A Cross-Sectional Study. Diseases 2024, 12, 45. https://doi.org/10.3390/diseases12030045
Fagundes Melo R, Laurindo LF, Sloan KP, Sloan LA, Cressoni Araújo A, Bitelli P, Laís Menegucci Zutin T, Haber Mellen R, Junqueira Mellen L, Landgraf Guiguer E, et al. Investigating the Incidence of Dyslipidemia among Brazilian Children and Adolescents Diagnosed with Type 1 Diabetes Mellitus: A Cross-Sectional Study. Diseases. 2024; 12(3):45. https://doi.org/10.3390/diseases12030045
Chicago/Turabian StyleFagundes Melo, Rafael, Lucas Fornari Laurindo, Katia Portero Sloan, Lance Alan Sloan, Adriano Cressoni Araújo, Piero Bitelli, Tereza Laís Menegucci Zutin, Rodrigo Haber Mellen, Luciano Junqueira Mellen, Elen Landgraf Guiguer, and et al. 2024. "Investigating the Incidence of Dyslipidemia among Brazilian Children and Adolescents Diagnosed with Type 1 Diabetes Mellitus: A Cross-Sectional Study" Diseases 12, no. 3: 45. https://doi.org/10.3390/diseases12030045