Digital Maturity and Corporate Performance: The Case of the Baltic States


Engineering Economics and Management, Riga Technical University, LV-1048 Riga, Latvia
*
Author to whom correspondence should be addressed.
J. Open Innov. Technol. Mark. Complex. 2019, 5(3), 54; https://doi.org/10.3390/joitmc5030054
Submission received: 23 June 2019
/
Revised: 5 August 2019
/
Accepted: 7 August 2019
/
Published: 9 August 2019
(This article belongs to the Special Issue Second IT Revolution and Dynamic Open Innovation: From Smart City, Autonomous Car, Intelligent Robot, and Block Chain to Sharing Economy)
Abstract
:Enterprise digitalization is a way for companies to make their processes more efficient, to enhance their marketing strategies, and improve their competitive moat within the global competitive landscape. To see how fast Baltic companies are adapting to digitalization trend and, therefore, how good they are at keeping or improving their competitive advantage, we have developed a digital maturity assessment methodology, which was applied to the listed enterprises in Estonia, Latvia, and Lithuania. This methodology allowed us to detect certain digital maturity trends, such as the significant growth of the attention paid towards concepts related to ‘process automation’. Further, it was clear that many companies are concerned with online business, which can be well-seen from the analyzed annual reports. Additionally, we have compared the level and dynamics of the company’s digital maturity to its financial and market performance. We have concluded that, although there is a positive relationship between several financial indicators (e.g., sales growth), it is too early to see the positive effect of digital maturity on a company’s stock performance.
1. Introduction
Digitalization is inevitable due to the rapid development of technologies. Today, every individual, business, and government has become a part of the new digital era [1,2]. To be able to survive in the modern economy, companies and states had to move towards digitalization, applying innovative solutions. Digitalization processes has accelerated the development of all industries by making them connected, fast, and controllable, while also providing easy access to data and necessary information [3]. The companies who promptly implement digitalization manage to enhance their competitive edges and have additional tailwind in the global competitive race, while the ones who lag behind in terms of the digitalization process often find themselves in the laggard group, thereby facing difficulties in sustaining their marginal profitability.
Acknowledging this fact, we conducted a research on Baltic listed companies in order to determine the level of their digital maturity to understand how far they have developed in terms of digitalization and how well they address this fact to their shareholders based on their rhetoric in annual reports. The analysis was done based on pre-defined semantic fields within the digital maturity linguistic field using NVIVO software, which was applied to the annual reports of Baltic companies. The results showed that Baltic companies within the last five years significantly improved in terms of digital maturity, with Latvian companies improving the fastest (their digital maturity score, proxied by the digital maturity notions frequency, grew at a 26% annual rate since 2013).
The second phase of the research was devoted to the analysis of Baltic companies’ digital maturity in the context of its corporate performance, when we examined the hypothesis that digital maturity positively influences corporate financial results and stock performance. The basic financial indicators, such as capital profitability, marginal profitability, and earnings growth were selected for research purposes, when the correlation method and visual representation were primarily applied. The obtained results allowed to state that the market does not yet recognize the achievements in digital maturity. They are only realized in higher revenue growth and, partially, also in returns on assets.
The present research contributes to the scientific literature on digital maturity by providing research results on the Baltic listed companies’ digital maturity development phase and, additionally, disclosing the discovered relationship between the digital maturity and financial and market performance of the company.
This research paper is structured as follows. First, we provide a theoretical framework for the research with insight into the relevant literature. Then, the methodology part follows, where the analysis sample as well as the selection of the ratios are described and the description of the selected semantic fields is provided. The next part is devoted to the results of the digital maturity analysis, which are followed by the main findings in the conclusions.
2. Theoretical Framework
As it was defined in the report “Measuring industry digitalization”, digitalization is the pervasive adoption of a wide variety of digital, real-time, and networked technologies, products, and services that will enable people, companies, governments, and even machines to stay connected and communicate with one another, gathering, analyzing, and exchanging massive amounts of information on all kinds of activities (pp. 5–6, [4]).
In view of trends in the literature, it is possible to find various terms and definitions related to digitalization. This phenomenon has been actively studied from different perspectives—for example, management of the digitalization processes to achieve the most efficient method, the development of new models and their applications, and practical studies in this area. The concept of Digital transformation has recently become a popular term. The most detailed definition of this concept was proposed by D. Schallmo, C. A. Williams, and L. Boardman, gathering several definitions from other authors [5]. The Digital transformation (DT) framework includes the networking of actors, such as businesses and customers, across all value-added chain segments and the application of new technologies. As such, DT requires skills that involve the extraction and exchange of data, as well as the analysis and conversion of that data into actionable information. This information should be used to calculate and evaluate options, in order to enable decisions and/or initiate activities. In order to increase the performance and reach of a company, the DT involves companies, business models, processes, relationships, products, and others [5].
Successful DT may bring such benefits as greater customer insight and reach, higher productivity, and the creation of new business models [4]. A PWC global survey carried out in 2018 revealed that just 10 percent of global manufacturing companies are Digital Champions [6].
The scientific literature suggests the term, “Digital maturity”, which describes willingness and ability of the company to change and apply innovative technologies, depending on the trends, in order to remain competitive in the market. According to Deloitte and MIT Sloan management, digital maturity is about adapting an organization to compete effectively in an increasingly digital environment. Therefore, it is a continuous and ongoing process [7]. The Deloitte and TM Forum has developed a Digital maturity model (DMM), which is a multiple digital assessment tool. DMM evaluates digital capabilities across 5 business dimensions: customers, strategies, technologies, operations, organizations, and culture. The five core dimensions are divided into 28 sub-dimensions, which in turn breakdown into 179 individual criteria on which the digital maturity of a company is assessed. The DMM can be used in each phase of transformation to help a company identify where there are gaps, establish key areas to focus on, and determine where to start [8].
BCG research has shown that an increase of digital maturity enables one to attain superior performance and cost efficiency, effects for product quality, and customer satisfaction [9].
The European Union has also payed special attention to the development of technologies and digitalization progress in its member countries. The European commission introduced the Digital Economy and Society Index (DESI) and performs comparative analyses of received data on a yearly basis. The Digital Economy and Society Index (DESI) is a composite index that summarizes relevant indicators of Europe’s digital performance and tracks the progress of EU Member States in digital competitiveness [10].
In 2017, Latvia ranked 19th according to DESI. Europe’s digital progress report mentions that, even though more Latvians go online and use eGovernment services, enterprises use technologies limitedly. However, the number of ICT specialists increased compared to the previous year. In Latvia, the National development plan for 2014–2020 and the Education development guidelines for 2014–2020 include actions and strategies to enhance digital skills [11]. The vice-president of the European Commission, Valdis Dombrovskis, drew attention to the ability of economies to grow and expand for successful FinTech implementation in Europe [12].
3. Methodology of the Research
In order to evaluate the digital maturity status of Baltic companies, the annual reports of companies included in the Baltic main list of the Nasdaq were analyzed.
The Baltic main list includes companies listed on the Tallinn, Riga, and Vilnius stock exchanges, which have at least 3 years of operating history, not less than EUR 4 million for their market cap and a free float of 25%, or are worth at least EUR 10 million. At the moment of the research, there were 31 blue-chip companies in the Baltic main list (see Appendix A).
The data were collected from official sources, such as nasdaqbaltic.com, firmas.lv, and the web pages of the companies. Annual reports were analyzed in NVIVO 12 and Microsoft Excel software using the predetermined key semantic fields.
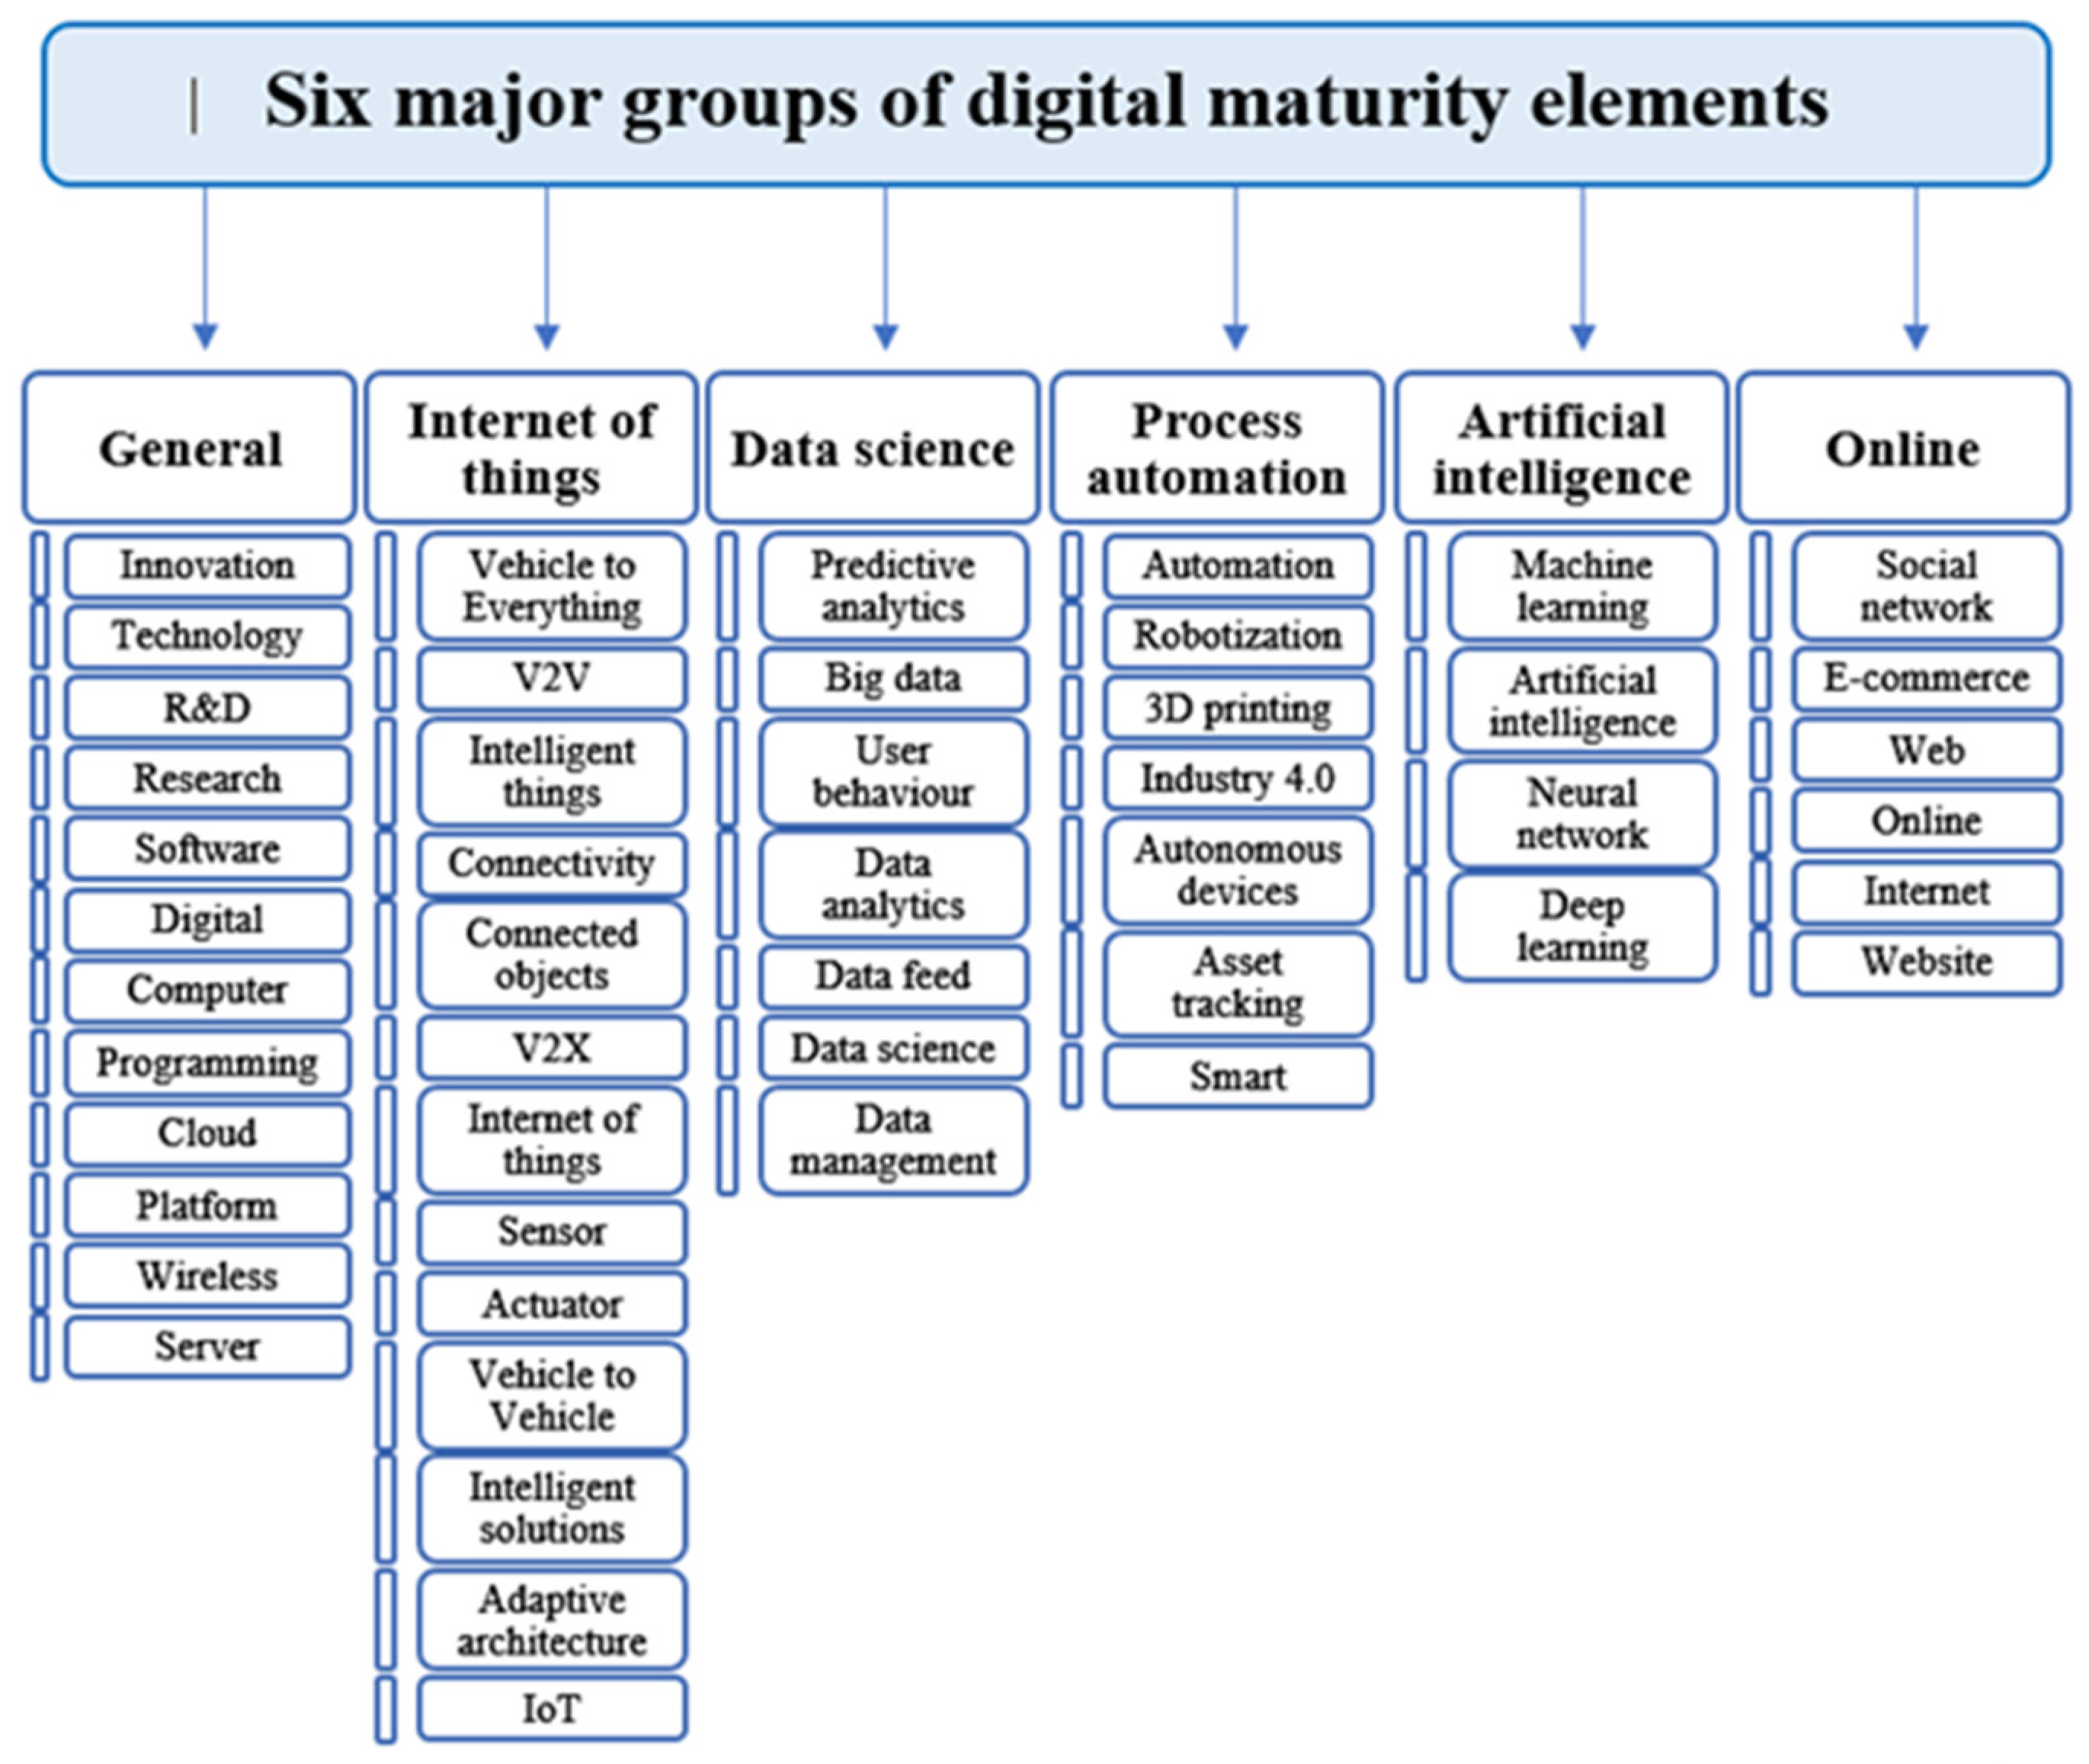
The predetermined key semantic fields were input and saved as nodes. Afterwards, with the tool “Text query”, we searched for the key words and phrases in the reports of companies. The key semantic fields were defined with a literature analysis of scientific articles in cooperation with CE Services SIA. There are 6 groups of key words, as shown in Figure 1:
The group “General” includes 12 basic terms that relate to digital maturity. Factors such as technology, computers, software, and others, which are important and basic parts of modern life, represent the foundations of the digitalization process and further digital maturing.
The Internet of Things (IoT) is a dynamic network where physical and virtual entities have identities and attributes and use intelligent interfaces (p. 235, [13]). This group refers to the overall connectivity among modern objects and vehicles within one network. These terms are rather topical and are trending nowadays. Therefore, the “Internet of things” is a major group among factor groups and includes 13 concepts. Connected units provide the opportunity to access information faster with less labor input, which is one of the aims of digitalization.
Digitalization is often associated with large databases with information about customers and suppliers, statistical data of previous years, record keeping, and other significantly important information. These data are an inevitable part of the analyses and forecasts used for the stable operations and sustainable growth of the company. The group “Data science” includes 8 concepts, such as user behavior, data management, and predictive analytics.
Process automation is a group that refers to the integration of technologies in the operational processes of a business. Factors included in this group suggest the existence of technological and technical innovation.
It is well known that artificial intelligence (AI) refers to intelligent machines. These are programs that simulate human cognitive abilities. At present, speaking about AI scientists often refer to machine learning and deeps learning technologies. While machine learning is not a new term, describing ability of computers to learn by themselves, the notion “deep learning” is quite new and topical today. Deep learning is one of the approaches to machine learning, which refers to multi-layer neural networks [14].
“Online” refers to activities performed on the global network. Various businesses or government structures provide online services, collect and distribute information, and interact with customers and partners. The “Online” group includes such factors as e-commerce, websites, and social networks.
All reports were analyzed separately in order to see statistics for each company for every year. Later the data were grouped by years, countries, and GICS sector names to gain a better understanding of the general tendencies and trends. In Microsoft Excel, the correlation coefficient for the received data from the NVIVO 12 and financial indicators was calculated, in order to understand relationship between these sets of variables. The Pearson product–moment correlation is calculated by Formula (1) (p. 415, [15]):
where,
- n—number of observations;
- —value of observation x;
- —value of observation y;
- —mean of x;
- —mean of y.
The following financial indicators were used for correlation analysis: Sales Growth, Eearnings per share (EPS) Growth, Return on equity (ROE), Gross Profit/Assets, Gross Profit Margin, Operating Profit Margin, Net Profit Margin, and Total shareholders’ return (TSR) (see Appendix B).
4. Result of the Research: Assessment of the Baltic States’ Digital Maturity
The analysis of digital maturity aims to assess the Baltic companies listed in the Main list of the Nasdaq as they relate to the digital maturity concepts discussed in the first part of this paper.
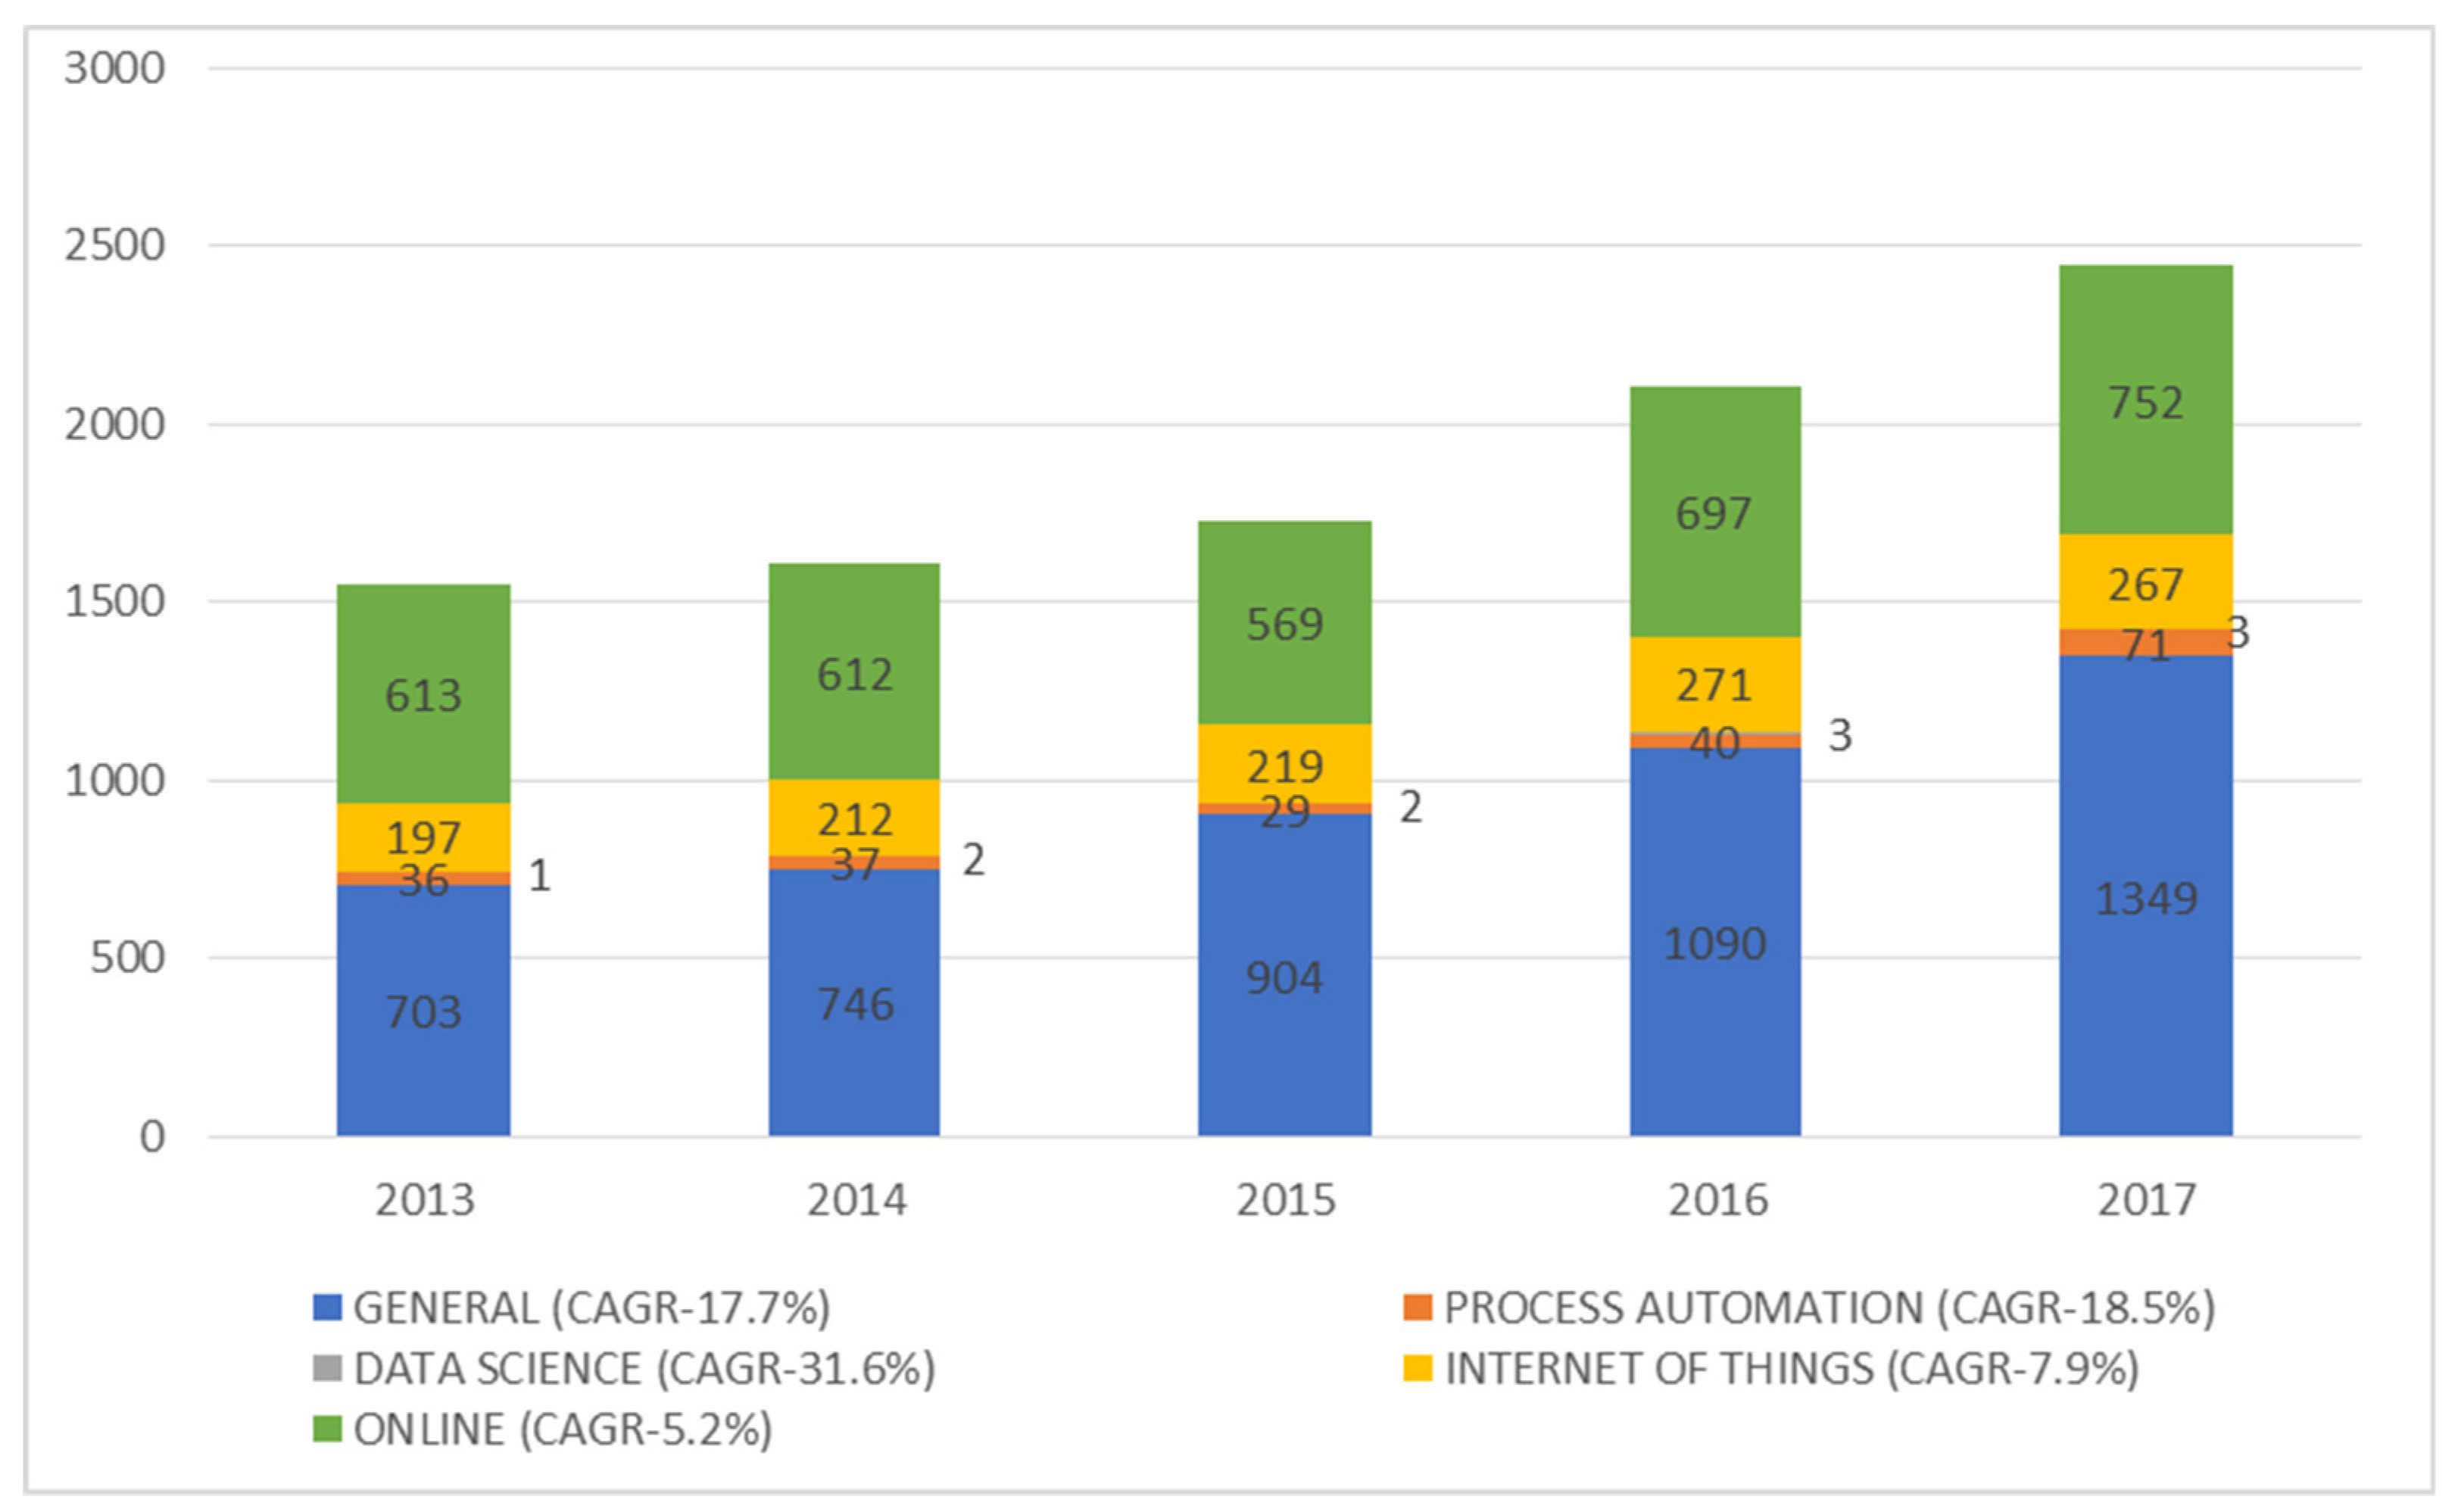
The digital maturity of the Baltic States shows a positive trend. In the last 2 years, the growth of IT-related concepts discussed by companies has become especially prolific. The frequency of the mentioned concepts increased by 16.2% in 2017 compared to the previous year, 2016. As can be seen from the graph, the largest part of the digital maturity concept for the entire analyzed period consists of two groups, General and Online (55.2% and 30.8%, respectively, for 2017) (see Figure 2).
Meanwhile, there are two groups of key semantic fields, artificial intelligence and data science, which have no, or almost no, significance. The artificial intelligence group has zero indicators in all the companies and within the whole analyzed period, which is why it is not shown in the graphs. Data science is a minor group, which grew during 2013–2017. However, in absolute values, it has low indicators from 1 to 3 (see Figure 2).
The stable growth in the frequency of discussion on digital maturity-related key semantic fields over the period demonstrates the growing attention and interest in the digitalization and integration of innovations in the development strategies of the companies, reflected in annual reports. This fact shows that there is a certain level of stability in the economic environment within the Baltic States, which offers the possibility for them to grow and compete with companies from other countries. The Compound Annual Growth Rate (CAGR) describes the growth of specific groups within the whole period. The highest tangible growth is visible for the process automation and general IT-related topics, whose CAGR indicators are 18.5% and 17.7%, respectively (see Figure 2). While the compound annual growth rate of the online and internet of things groups is less than 10%.
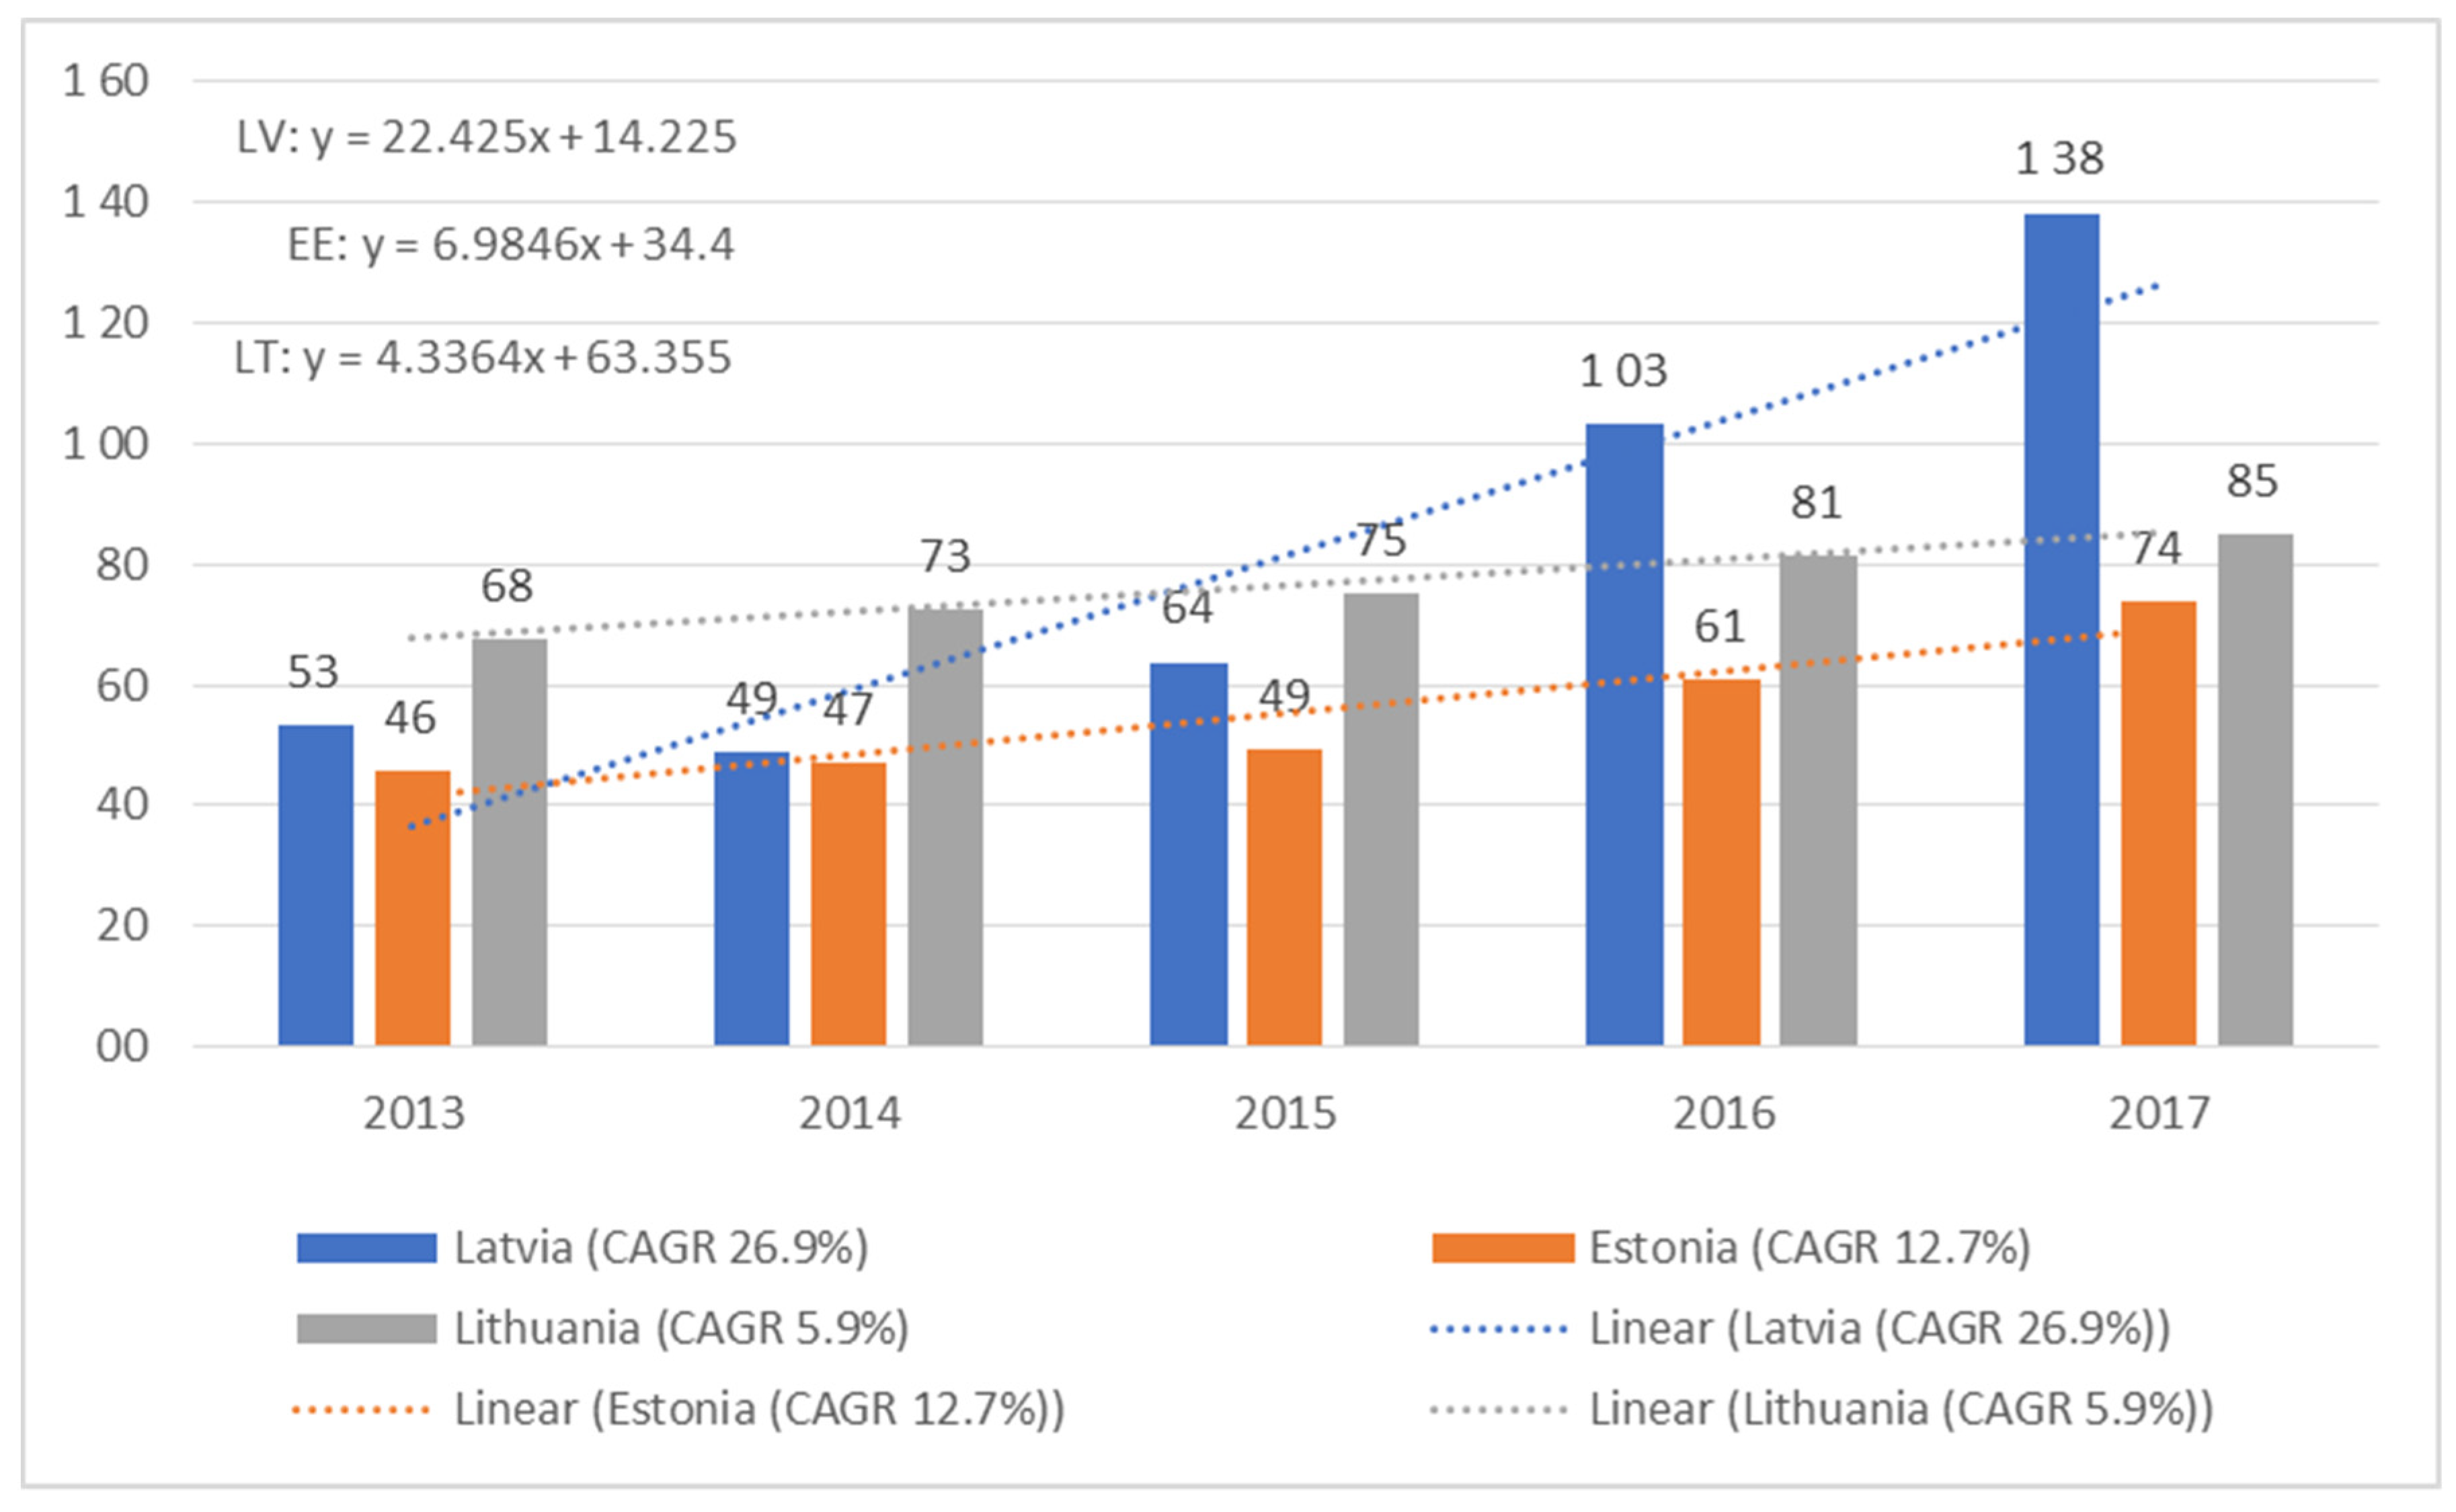
The sample of 28 companies included 13 Estonian companies, 11 Lithuanian companies, and 4 Latvian companies. To compare these countries, the indicators were reduced to the average value for one company (see Figure 2). Latvia appears to be a leader in discussing IT-related concepts in the annual reports for 2017, followed by Lithuania and Estonia. In Latvia, the most active companies in terms of digital maturity appeared to be HansaMatrix and SAF Tehnika. Estonia, despite its efforts at the state level to create an image as the most developed IT country, is lagging behind its Baltic peers with regards to public companies being conscious about their digital maturity.
The trend lines reflect positive tendencies over the period 2013–2017 in Latvia, Estonia, and Lithuania. The trend line of Latvia has the steepest rise compared to the others, and its slope of 22.425 is about three times higher than the slopes of the Estonian and Lithuanian trend lines (6.9846 and 4.3364). Latvia shows rapid growth within the analyzed period. The compound annual growth rate indicates an increase in the usage of Digital maturity concepts by 26.9% in Latvia, which is the highest growth rate among the three countries. The Estonian CAGR is 12.7%, which is 14.2% less than the Latvian CAGR, and the Lithuanian CAGR is 5.9%, which is the lowest rate among the Baltic States (see Figure 3).
It is important to note that, despite the best growth rate, at the beginning of the analyzed period, Latvia showed a decline. In 2014, the indicators slightly decreased. Therefore, the main growth occurred from 2015 to 2017, ahead of Lithuania and Estonia. Other Baltic countries show a slow but steady growth throughout the period. This illustrates the development of Baltic public companies towards digitalization, in order to stay competitive in the market. In addition, Latvian companies demonstrate rapid technological leaps, which can be explained as the readiness of Latvian companies to improve the status of digital maturity and develop quickly in this direction (see Figure 3).
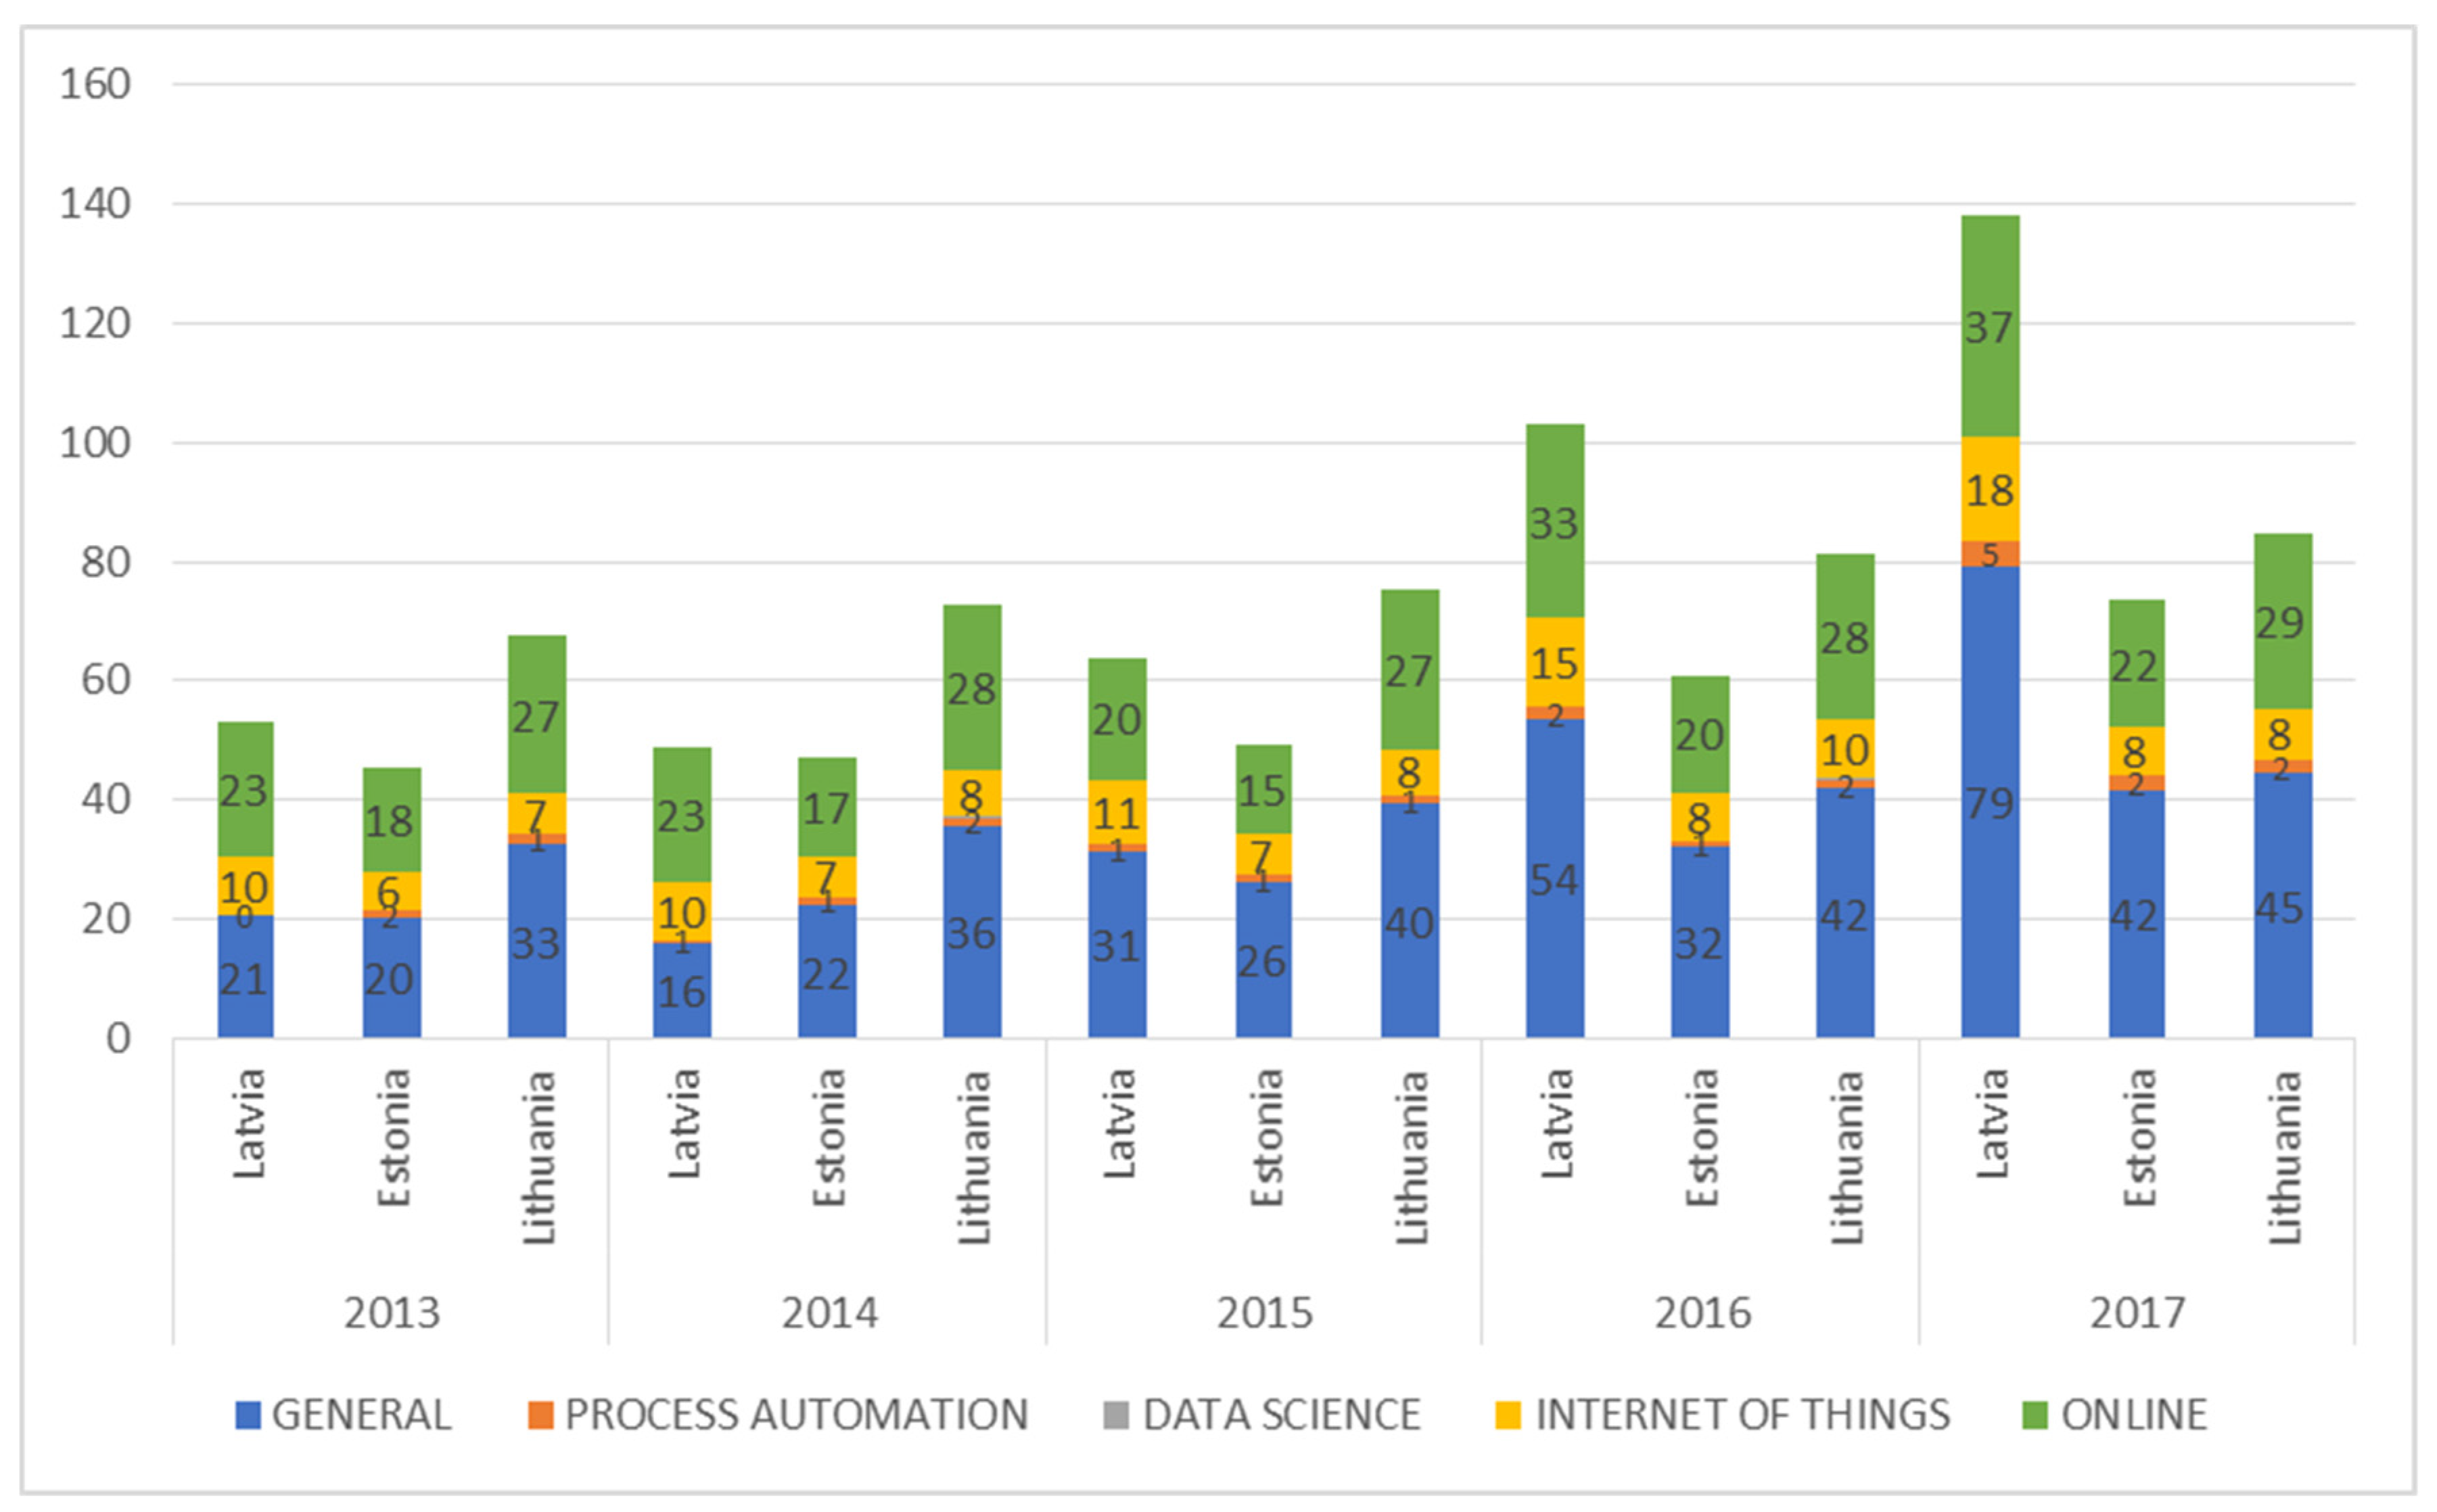
Figure 4 illustrates the structure of the elements forming digital maturity in the Baltic States. The following graph presents the average values of frequencies for the digital maturity elements of each country (see Figure 4). A detailed analysis of the key semantic fields revealed that the general and online groups built the major part of the companies’ digital maturity. Despite the fact that the total indicators of countries differ in absolute values, the percentage shares of the constituent groups of the digital maturity keywords do not differ significantly.
Thus in 2017, indicators of the general semantic fields for the Latvian company were 79, for the Lithuanian company—45, and for the Estonian company—42. However, in terms of shares, the general group forms 57% for Latvia, 53% for Lithuania, and 57% for Estonia. Similarly, the online group in 2017 indicates different frequencies—for Latvia, 37; for Estonia, 22; and 29 for Lithuania. The shares for the Latvian online group represent 26,81%, 29.26% for Estonia, and 34.73% for Lithuania. Consequently, there are no abnormal and incomprehensible deviations (see Figure 4).
Table 1 presents the percentage share of each element for the digital maturity of Baltic countries, over the whole analyzed period (see Table 1).
The most significant growth is in the general group. In 2016–2017, the increase of the general group is the most obvious, both in absolute values and in terms of shares. As mentioned earlier, the general group includes such key words as innovation, research, R&D, and digital. Hence, it is possible to state that in 2016–2017, public companies payed more attention to research and innovation, while in 2013–2014, the online concepts were almost of the same importance as the general ones. Within the analyzed period, the online group shows a moderate but stable growth in its absolute values. However, the percentage of shares as a constituent group of digital maturity decreased insignificantly. The internet of things group shows moderately stable growth with minor changes. The IoT indicator of Latvian companies in 2017 is the highest indicator compared to other Baltic companies.
The above analysis gave insight into the digital maturity of the Baltic States and IT-related concepts discussed by public companies. Therefore, it is possible to state that the hypothesis should be accepted. (hypothesis: that there is a positive trend in the digital maturity of Baltic States—accepted).
5. Digital Maturity and Corporate Performance
To gain a deeper understanding of the role of digital maturity in public companies, our research included a correlation analysis of corporate digital maturity and corporate performance.
The obtained data were structured into a table, representing the correlation coefficients of 29 companies as they relate to values above the financial ratios. As can be seen in the table, coefficients can vary from strongly positive to strongly negative. Indicators with an absolute value higher than 0.5 are marked in bold (see Table 2)
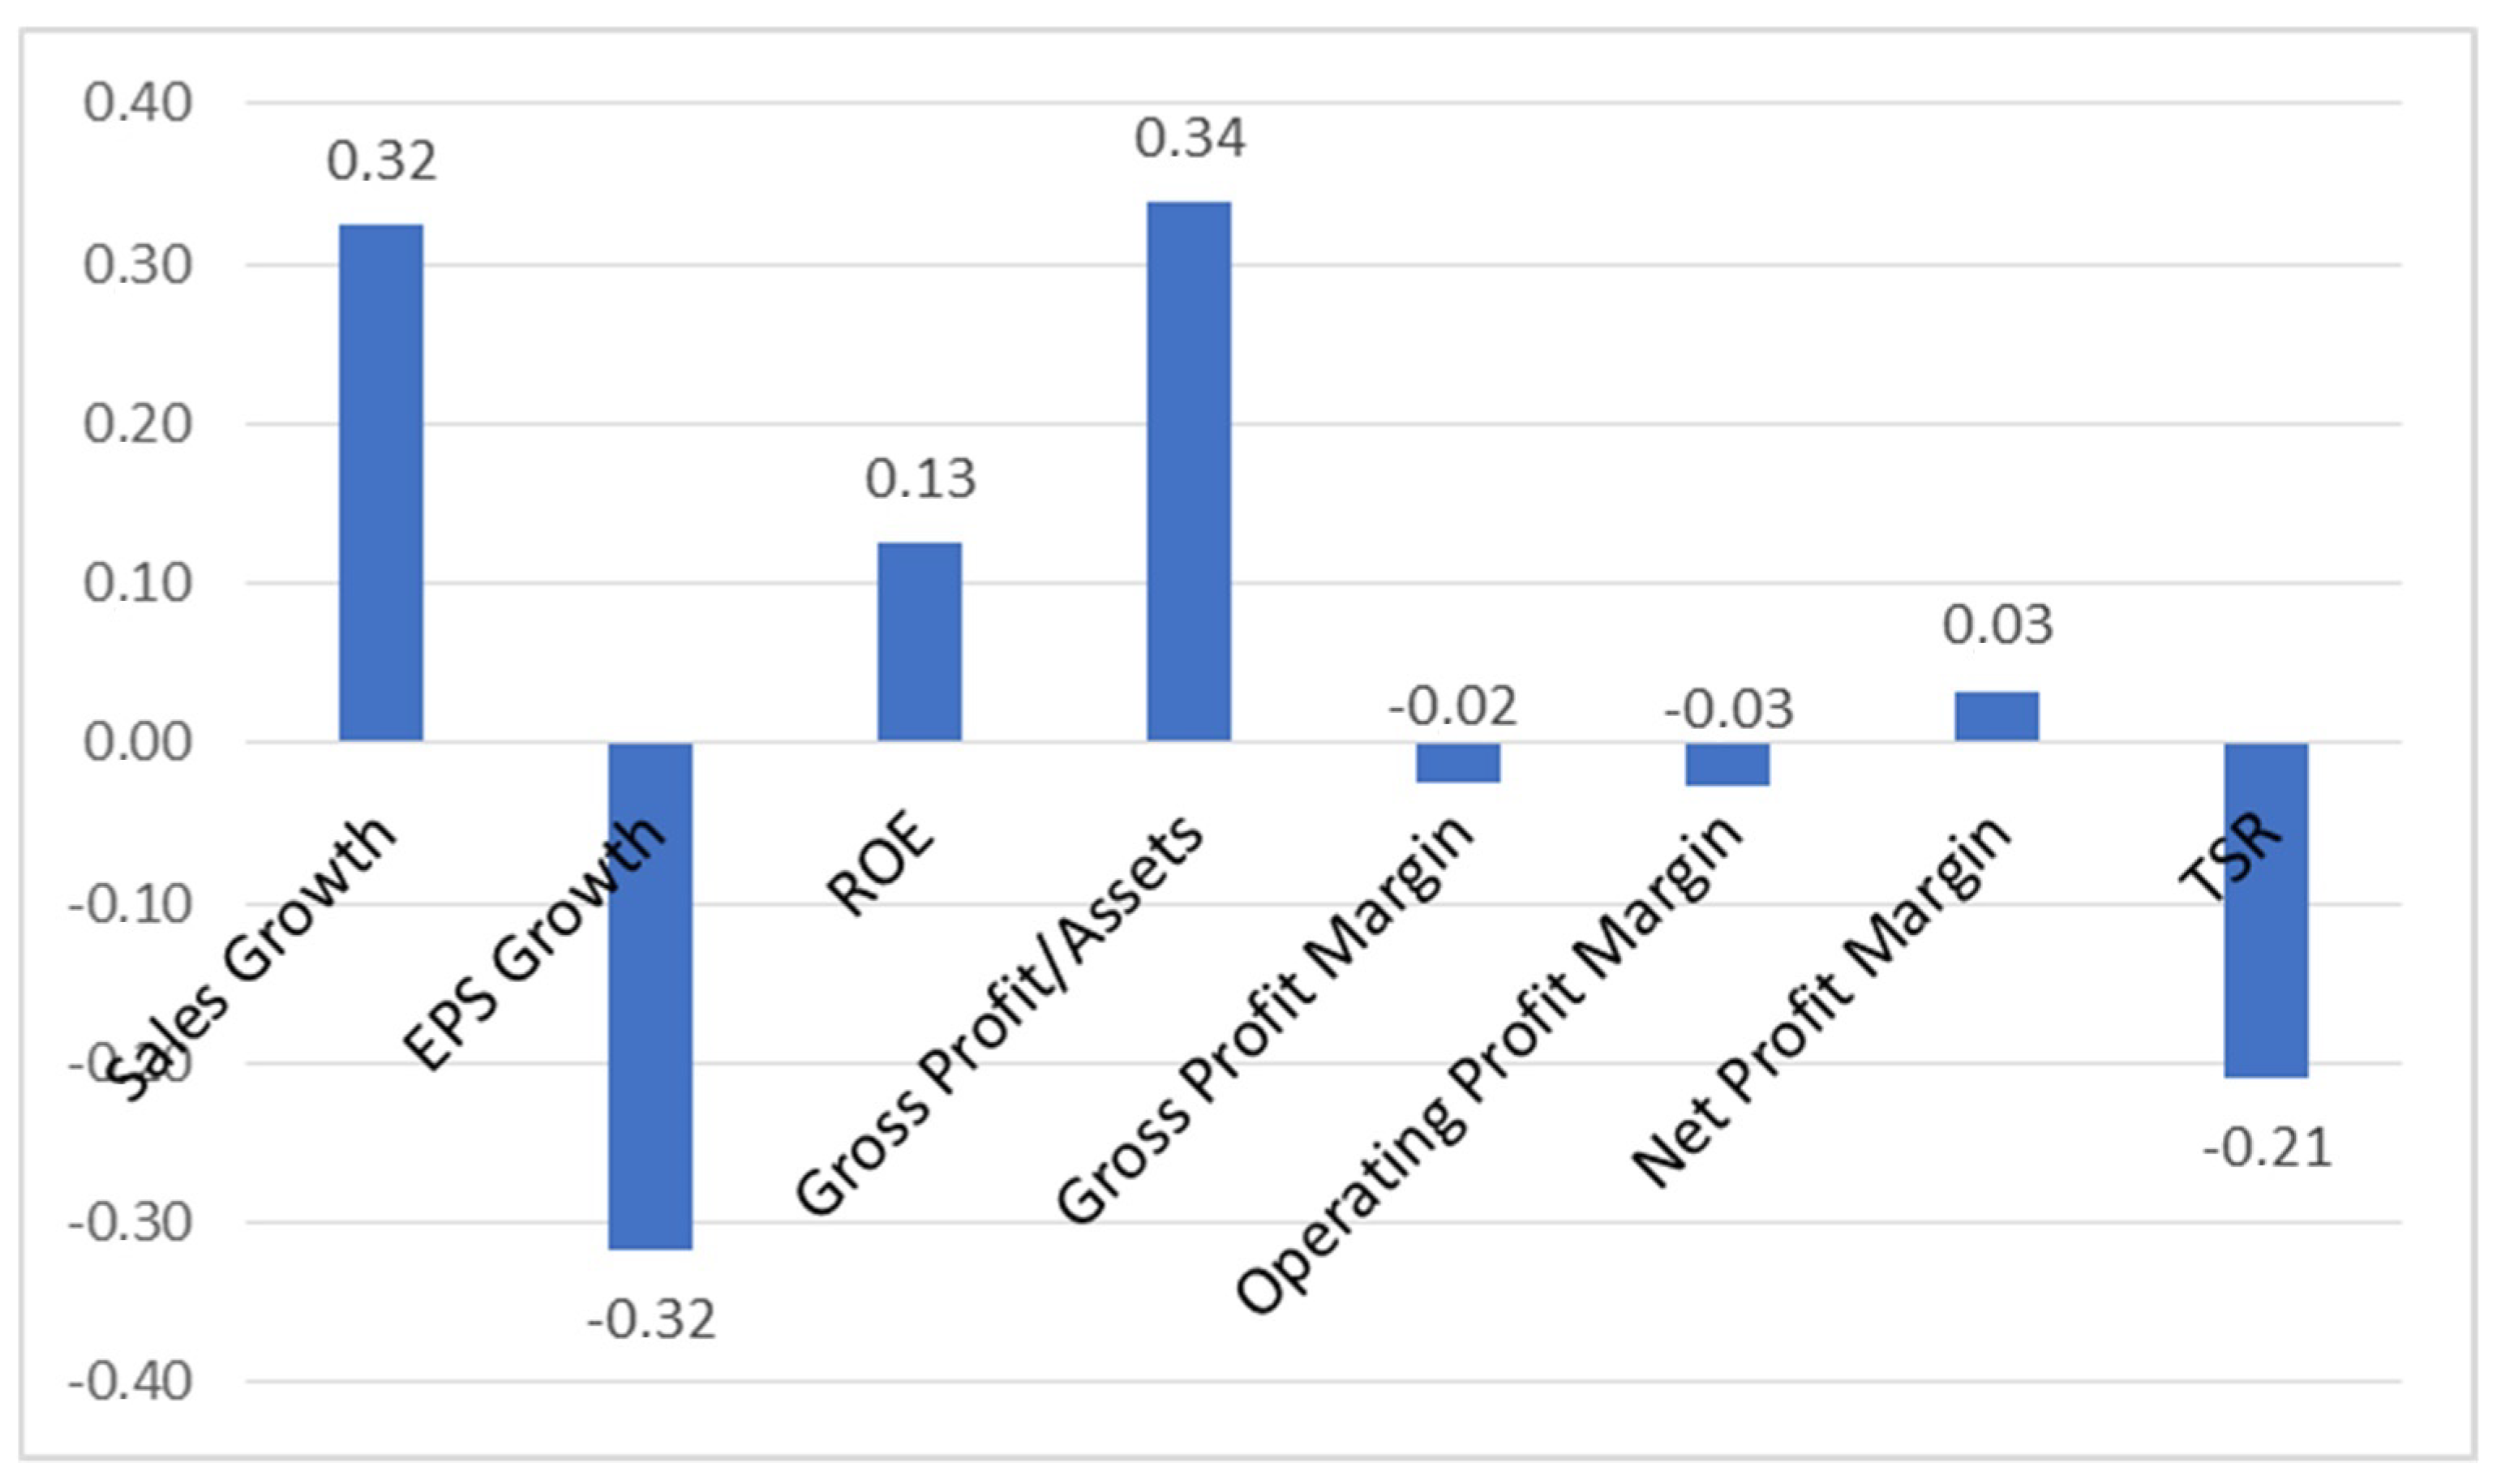
To summarize, the findings and visually illustrated results of the medians for each financial indicator are calculated and presented in the graph. The median is the middle score for a set of data that has been arranged in order of magnitude (Laerd Statistics, n.d.). The received indicators of the correlation have a skewed distribution. Therefore, the median is a more appropriate measure of the central tendency for this research (see Figure 5).
Since sales growth indicates changes in sales revenue over a certain period of time, and ROE refers to the return earned by a company on its equity capital [16]. A positive correlation between digital maturity and a company’s sales growth, and the ROE can be explained by the fact that improvements in digital status provide new distribution channels for sales, which in turn leads to positive changes in revenue. Considering that the online group has a significant weight in the digital maturity of business entities, the introduction of new methods for the promotion of goods, new tools on marketing analysis, and new communication channels with clients can vastly increase sales and support sustainable enlargement of market shares.
Given that there is a positive correlation with return on equity and gross profit over assets, it is possible to say that digital maturity allows a company to at least partially increase the profitability of its invested capital.
There is a negative correlation with shareholders’ return, since digital maturity is not yet realized completely in companies’ net earnings/dividends and, therefore, not realized in their total return. The market has not yet managed to respond to these improvements. This result is also supported by the fact that in the initial stages of digital maturity development, more investments are required.
The sophistication of IT related concepts discussed by companies moderately correlates to gross profits and assets. Positive changes in digital maturity lead to the improved use of available resources, and could make the firm’s assets more profitable. The general group includes such key words as software, computer, and server. These basic terms provide the opportunity to create innovative products and thus increase revenue. The correlation between gross profit margin, operating profit margin, and net profit margin is insignificant.
6. Conclusions and Proposals
Research on the digital maturity of the Baltic listed companies revealed that the importance of digitalization trends, and adaptations to them, have been acknowledged by Baltic enterprises as they become more mature in terms of their digitalization. In particular, the usage growth of ‘process automation’ concepts is most vivid, though it makes up only a tiny portion of all the digital rhetoric used in the annual reports of the companies. The bulk of the attention of executives has been turned to ‘general’ digital terminology and ‘online’ terminology, which includes such terms as internet, e-commerce, websites, and social networks. This phenomenon corresponds to the massive global trend of e-commerce, as shopping moves online, and ‘brick-and-mortar’ malls are faced with the bitter truth of continuously low customer flows.
Even though all Baltic companies have positive trends, Latvia appears to be the absolute leader in discussions on IT-related concepts and their frequency dynamics in annual reports for 2016 and 2017, followed by Lithuania and Estonia. This is partially explained by the industry bias of the quoted companies—a number of Latvian companies operating in the ICT industry are listed on the Riga stock exchange, in contrast to the neighboring countries.
Overall, the industry analysis shows that the most digitally mature companies listed on the Baltic stock exchanges are companies operating in the telecom, IT, health care, and energy industries, while the main laggards are the real estate and materials industries. Comparing the obtained results to the findings of BCG research [9], it can be stated that telecoms, and technology in the Baltics follow the digitalization trend to a similar extent as in Europe. However, Baltic pharmaceutical companies show deeper advances into digital maturity as compared to same sector companies in Europe. In contrast, the consumer sector in Baltics lags behind its European peers.
A correlation analysis of the corporate digital maturity and corporate performance offers a deeper understanding of the role of digital maturity in public companies. There is a positive correlation between the digital maturity and company’s sales growth and capital profitability. This relationship can be explained by the additional tailwind contributing to sales growth as company’s digitalization often means more efficient sales and marketing processes, as well as the expansion of distribution channels. New tools for promotion, marketing analysis, and new communication channels with clients can vastly increase sales and support sustainable enlargement of a company’s market shares. In addition, the positive correlation between return on equity and gross profit over assets indicates that digital maturity may allow the firm to at least partially contribute to the profitability of the invested capital. However, the relationship with earnings growth is negative, which might be explained by the huge investments required to implement improvements in a company’s digitalization status. This research did not reveal any significant relationship between digital maturity and a company’s stock performance. This result was quite expected, as Baltic markets are driven mainly by the dividend payers and fundamental performance is not always recognized by the market participants.
The obtained results indicate that there is a certain relationship between digital maturity and corporate performance. However, this relationship cannot be applied to all considered ratios, and the relationship (in most cases) was rather weak, thereby precluding unambiguous conclusions. Therefore, the hypothesis cannot be rejected or accepted, therefore paving the way for further research by expanding the analytical sample and including longer time period.
Author Contributions
Conceptualization, N.L.; Methodology, J.B., Y.E.; Software, Y.E.; Validation, Y.E., N.L. and J.B.; Formal Analysis Y.E.; Investigation, Y.E., N.L., J.B.; Resources, Y.E.; Data Curation, J.B.; Writing-Original Draft Preparation, Y.E.; Writing-Review & Editing, N.L., J.B.; Visualization, Y.E.; Supervision, N.L.; Project Administration, N.L.; Funding Acquisition, N.L.
Funding
This research was funded by Department of Corporate Finance and Economics at Faculty of Engineering Economics and Management of Riga Technical University.
Conflicts of Interest
The authors declare no conflict of interest.
Appendix A. Sample of Baltic Main List Companies

Table A1.
Baltic Main List Companies.
| No. | Company Name | Country | GICS Sector Name |
|---|---|---|---|
| 1 | APB Apranga | Lithuania | Consumer Discretionary |
| 2 | Arco Vara AS | Estonia | Real Estate |
| 3 | Baltika AS | Estonia | Consumer Discretionary |
| 4 | EfTEN Real Estate Fund III AS | Estonia | - |
| 5 | Ekspress Grupp AS | Estonia | Consumer Discretionary |
| 6 | Energijos Skirstymo Operatorius AB | Lithuania | Utilities |
| 7 | Grigeo AB | Lithuania | Materials |
| 8 | Grindeks AS | Latvia | Health Care |
| 9 | HansaMatrix AS | Latvia | Information Technology |
| 10 | Harju Elekter AS | Estonia | Industrials |
| 11 | Klaipėdos nafta AB | Lithuania | Energy |
| 12 | LHV Group AS | Estonia | Financials |
| 13 | Lietuvos energijos gamyba AB | Lithuania | Utilities |
| 14 | Linas Agro Group AB | Lithuania | Consumer Staples |
| 15 | Merko Ehitus AS | Estonia | Industrials |
| 16 | Nordecon AS | Estonia | Industrials |
| 17 | Olainfarm AS | Latvia | Health Care |
| 18 | Olympic Entertainment Group AS | Estonia | Consumer Discretionary |
| 19 | Panevėžio statybos trestas AB | Lithuania | Industrials |
| 20 | Pieno žvaigždės AB | Lithuania | Consumer Staples |
| 21 | PRFoods AS | Estonia | Consumer Staples |
| 22 | Rokiškio sūris AB | Lithuania | Consumer Staples |
| 23 | SAF Tehnika AS | Latvia | Information Technology |
| 24 | Silvano Fashion Group AS | Estonia | Consumer Discretionary |
| 25 | Skano Group AS | Estonia | Consumer Discretionary |
| 26 | Šiaulių bankas AB | Lithuania | Financials |
| 27 | Tallink Grupp AS | Estonia | Industrials |
| 28 | Tallinna Kaubamaja Grupp AS | Estonia | Consumer Staples |
| 29 | Tallinna Vesi AS | Estonia | Utilities |
| 30 | Telia Lietuva AB | Lithuania | Telecommunication Services |
| 31 | Vilkyškių pieninė AB | Lithuania | Consumer Staples |
Appendix B. Financial Indicators Used for Correlation Analysis
Sales Growth: Indicates changes in the sales revenue over a certain period of time. It is estimated by Formula (A1):
EPS Growth: Indicates a change in the amount of income earned during a period, per share of a common stock [16]. It is estimated by Formula (A3):
ROE: Profitability ratio, which refers to the return earned by a company for its equity capital [16]. It is estimated by Formula (A4):
Gross Profit/Assets: It is calculated as revenue minus the cost of goods sold divided by total assets. This ratio indicates whether or not the firm’s assets are profitable [17]. It is estimated by Formula (A5):
Gross Profit Margin: The profitability ratio, which represents the percentage of revenue available to cover operating and other expenses, and to generate profit [16]. It is estimated by Formula (A6):
Operating Profit Margin: The ratio indicates how much profit a company makes after paying for variable costs. It is also expressed as a percentage of sales and then shows the efficiency of a company in controlling the costs and expenses associated with business operations [16]. It is estimated by Formula (A7):
Net Profit Margin: The profitability ratio, which shows the percentage of actual profit in every unit of revenue [16]. It is estimated by Formula (A8):
TSR: The total shareholders’ return measures the combined return from change in stock price and dividends [18]. It is estimated by Formula (A9):
References
- Lee, M.; Yun, J.; Pyka, A.; Won, D.; Kodama, F.; Schiuma, G.; Yan, M.R. How to respond to the Fourth Industrial Revolution, or the Second Information Technology Revolution? Dynamic new combinations between technology, market, and society through open innovation. J. Open Innov. Technol. Mark. Complex. 2018, 4, 21. [Google Scholar] [CrossRef]
- Kodama, F. Learning Mode and Strategic Concept for the 4th Industrial Revolution. J. Open Innov. Technol. Mark. Complex. 2018, 4, 32. [Google Scholar] [CrossRef]
- Shim, S.O.; Park, K.; Choi, S. Sustainable Production Scheduling in Open Innovation Perspective under the Fourth Industrial Revolution. J. Open Innov. Technol. Mark. Complex. 2018, 4, 42. [Google Scholar] [CrossRef]
- Friedrich, D.; Merle, M.; Gröne, F.; Koster, A. Measuring Industry Digitization: Leaders and Laggards in the Digital Economy; Strategy&. Booz & Company: London, UK, 2011. [Google Scholar]
- Schallmo, D.; Williams, C.A.; Boardman, L. Digital Transformation of Business Models—Best Practice, Enablers and Roadmap. Int. J. Innov. Manag. 2017, 21, 1740014. [Google Scholar] [CrossRef]
- Global Digital Operations Study 2018 Digital Champions. How Industry Leaders Build Integrated Operations Ecosystems to Deliver End-To-End Customer Solutions. Available online: https://www.strategyand.pwc.com/media/file/Global-Digital-Operations-Study_Digital-Champions.pdf (accessed on 30 July 2019).
- Kane, G.C.; Palmer, D.; Nguyen-Phillips, A.; Kiron, D.; Buckley, N. Achieving digital maturity. MIT Sloan Manag. Rev. 2017, 59. [Google Scholar]
- Digital Maturity Model. Achieving Digital Maturity to Drive Growth. Available online: https://www2.deloitte.com/content/dam/Deloitte/global/Documents/Technology-Media-Telecommunications/deloitte-digital-maturity-model.pdf (accessed on 27 April 2018).
- Digital Maturity is Paying Off. Available online: http://image-src.bcg.com/Images/BCG-Digital-Maturity-Is-Paying-Off-June-2018_tcm9-195218.pdf (accessed on 31 July 2019).
- European Commission. The Digital Economy and Society Index (DESI). Available online: https://ec.europa.eu/digital-single-market/en/desi (accessed on 21 February 2018).
- European Commission. Europe’s Digital Progress Report (EDPR) 2017 Country Profile Latvia. Available online: http://ec.europa.eu/newsroom/document.cfm?doc_id=44316 (accessed on 21 February 2018).
- Collier, M. Latvian Banks Plan for Future Despite Present Troubles. LSM.LV. Available online: https://eng.lsm.lv/article/economy/banks/latvian-banks-plan-for-future-despite-present-troubles.a272422/ (accessed on 27 April 2018).
- Sikorski, J.J.; Haughton, J.; Kraft, M. Blockchain technology in the chemical industry: Machine-to-machine electricity market. Appl. Energy 2017, 195, 234–246. [Google Scholar] [CrossRef]
- Cao, L. Artificial Intelligence, Machine Learning, and Deep Learning: A Primer. Enterprising Investor: Practical Analysis for Investment Professionals. Available online: https://blogs.cfainstitute.org/investor/2018/02/13/artificial-intelligence-machine-learning-and-deep-learning-in-investment-management-a-primer/ (accessed on 11 April 2018).
- Hothorn, T.; Everitt, B. Handbook of Statistical Analysis; CRC Press: London, UK, 2014. [Google Scholar]
- Institute CFA. Reporting and Analysis; Level 1; Institute CFA: Central, Hong Kong, China, 2017; Volume 3. [Google Scholar]
- Bajkowski, J. Combining Quality Growth with Value and Momentum. Retrieved from AAII American Association of Individual Investors. Available online: http://www.aaii.com/journal/article/combining-quality-growth-with-value-and-momentum (accessed on 27 April 2018).
- Accountingverse. TSR. Available online: http://www.accountingverse.com/ (accessed on 27 April 2018).
Figure 1.
The six major groups of the digital maturity elements (authors).

Figure 2.
Digital maturity of Baltic companies (frequency of mentioned concepts in annual reports).

Figure 3.
The average usage frequency for one company.

Figure 4.
The structure of elements forming digital maturity in Baltic States.

Figure 5.
Median of correlation between corporate digital maturity and corporate performance.

Table 1.
Percentage share of digital maturity elements for Baltic States.
| Year | Country | General | Process Automation | Data Science | Internet of Things | Online | Total |
|---|---|---|---|---|---|---|---|
| 1 | 2 | 3 | 4 | 5 | 6 | 7 | 8 |
| 2013 | Latvia | 38.50% | 0.00% | 0.00% | 18.78% | 42.72% | 100.00% |
| Estonia | 44.81% | 3.14% | 0.00% | 14.15% | 37.89% | 100.00% | |
| Lithuania | 48.39% | 2.15% | 0.13% | 10.08% | 39.25% | 100.00% | |
| 2014 | Latvia | 32.65% | 1.02% | 0.00% | 19.90% | 46.43% | 100.00% |
| Estonia | 47.69% | 2.93% | 0.00% | 14.04% | 35.34% | 100.00% | |
| Lithuania | 48.94% | 2.13% | 0.25% | 10.76% | 37.92% | 100.00% | |
| 2015 | Latvia | 49.02% | 1.96% | 0.00% | 17.25% | 31.76% | 100.00% |
| Estonia | 52.52% | 1.87% | 0.00% | 14.39% | 31.22% | 100.00% | |
| Lithuania | 52.72% | 1.33% | 0.24% | 10.28% | 35.43% | 100.00% | |
| 2016 | Latvia | 51.82% | 2.18% | 0.00% | 14.29% | 31.72% | 100.00% |
| Estonia | 51.77% | 1.65% | 0.00% | 13.68% | 32.90% | 100.00% | |
| Lithuania | 51.34% | 1.90% | 0.33% | 11.94% | 34.49% | 100.00% | |
| 2017 | Latvia | 57.25% | 3.26% | 0.00% | 12.68% | 26.81% | 100.00% |
| Estonia | 56.64% | 3.24% | 0.00% | 10.87% | 29.26% | 100.00% | |
| Lithuania | 52.63% | 2.36% | 0.32% | 9.97% | 34.73% | 100.00% |
Table 2.
Correlation coefficients of corporate digital maturity and financial indicators. TSR, total shareholders’ return.
Table 2.
Correlation coefficients of corporate digital maturity and financial indicators. TSR, total shareholders’ return.
| Company Name | Sales Growth | EPS Growth | ROE | Gross Profit/Assets | Gross Profit Margin | Operating Profit Margin | Net Profit Margin | TSR |
|---|---|---|---|---|---|---|---|---|
| Apranga | 0.36 | 0.34 | 0.84 | 0.69 | 0.91 | 0.82 | 0.85 | 0.35 |
| Arco Vara | 0.71 | 0.13 | 0.50 | 0.72 | 0.20 | −0.04 | 0.09 | 0.75 |
| Baltika | −0.54 | −0.46 | −0.62 | 0.14 | −0.84 | −0.52 | −0.39 | −0.45 |
| Ekspress Grupp | 0.28 | −0.60 | −0.06 | 0.18 | −0.49 | −0.32 | −0.16 | −0.59 |
| Grindeks | 0.85 | 0.50 | 0.79 | 0.82 | 0.59 | 0.73 | 0.70 | 0.89 |
| Grigeo | −0.96 | −0.80 | −0.69 | −0.55 | −0.67 | −0.74 | −0.65 | −0.31 |
| Harju Elekter | 0.28 | −0.84 | −0.66 | 0.80 | −0.44 | 0.59 | −0.68 | −0.76 |
| Klaipedos Nafta | 0.48 | 0.60 | 0.43 | 0.05 | −0.88 | −0.99 | −0.93 | 0.83 |
| Linas Adro Group | −0.74 | −0.39 | −0.35 | −0.53 | −0.05 | −0.07 | −0.08 | −0.71 |
| Merko Ehitus | −0.79 | −0.79 | −0.91 | −0.15 | 0.47 | −0.78 | −0.96 | −0.35 |
| Nordecon | 0.69 | 0.54 | 0.48 | 0.84 | 0.78 | 0.92 | 0.25 | −0.10 |
| Olainfarm | −0.71 | −0.50 | −0.78 | −0.87 | −0.90 | −0.99 | −0.82 | −0.03 |
| Olympic Entertainment Group | 0.53 | −0.36 | −0.24 | −0.75 | −0.41 | 0.18 | 0.20 | 0.21 |
| Pieno žvaigždės | 0.97 | 0.33 | 0.15 | −0.12 | −0.53 | −0.02 | 0.13 | −0.65 |
| PRFoods | 0.91 | −0.76 | 0.43 | −0.01 | −0.36 | 0.27 | 0.43 | −0.30 |
| Skano Group | −0.41 | −0.66 | −0.97 | 0.17 | 0.03 | −0.95 | −0.96 | −0.39 |
| Tallinna Kaubamaja Grupp | 0.22 | −0.32 | 0.10 | 0.71 | 0.39 | 0.20 | 0.10 | −0.40 |
| Telia Lietuva | 0.74 | 0.26 | 0.67 | 0.81 | −0.22 | 0.16 | −0.09 | −0.70 |
| Vilkyškių pieninė | −0.32 | −0.67 | −0.96 | −0.95 | 0.00 | −0.98 | −0.83 | −0.30 |
| Lietuvos energijos gamyba | −0.80 | −0.67 | 0.42 | −0.45 | 0.64 | 0.64 | 0.52 | −0.12 |
| Panevėžio statybos trestas | 0.74 | 0.34 | 0.63 | 0.75 | −0.62 | −0.41 | 0.64 | −0.03 |
| Rokiškio sūris | −0.57 | 0.68 | 0.59 | 0.62 | 0.90 | 0.71 | 0.72 | 0.69 |
| SAF Tehnika | 0.91 | −0.31 | 0.94 | 0.88 | 0.91 | 0.94 | 0.90 | 0.72 |
| Silvano Fashion Group | −0.72 | −0.05 | 0.58 | 0.65 | 0.62 | 0.73 | 0.80 | 0.81 |
| Tallink Grupp | 0.43 | −0.31 | −0.13 | 0.49 | 0.32 | −0.18 | −0.03 | 0.36 |
| Tallinna Vesi | 0.84 | 0.48 | 0.05 | 0.73 | −0.69 | −0.73 | −0.14 | −0.83 |
© 2019 by the authors. Licensee MDPI, Basel, Switzerland. This article is an open access article distributed under the terms and conditions of the Creative Commons Attribution (CC BY) license (http://creativecommons.org/licenses/by/4.0/).
Share and Cite
MDPI and ACS Style
Eremina, Y.; Lace, N.; Bistrova, J. Digital Maturity and Corporate Performance: The Case of the Baltic States. J. Open Innov. Technol. Mark. Complex. 2019, 5, 54. https://doi.org/10.3390/joitmc5030054
AMA Style
Eremina Y, Lace N, Bistrova J. Digital Maturity and Corporate Performance: The Case of the Baltic States. Journal of Open Innovation: Technology, Market, and Complexity. 2019; 5(3):54. https://doi.org/10.3390/joitmc5030054
Chicago/Turabian StyleEremina, Yulia, Natalja Lace, and Julija Bistrova. 2019. "Digital Maturity and Corporate Performance: The Case of the Baltic States" Journal of Open Innovation: Technology, Market, and Complexity 5, no. 3: 54. https://doi.org/10.3390/joitmc5030054