1. Introduction
Structural elucidation and identification of small molecules plays an essential role in many areas of biology and medicine. Mass spectrometry (MS) is a key analytical technique for analyzing these compounds. Compared with nuclear magnetic resonance spectroscopy, MS is orders of magnitude more sensitive.
In principle, LC-MS/MS enables the identification of small molecules. However, the automated interpretation of such data is still in its infancy. Searches in spectral libraries often fail due to their incompleteness and the varying LC-MS/MS spectra between different instruments [
1,
2]. Although, at least for some libraries, the variability of fragmentation seems to be a minor problem, it does complicate the search and, especially, the decision of whether or not a spectrum only matches by chance. The development of computational methods for small molecular MS is further impeded by the absence of openly available benchmark test sets. These provide developers of novel approaches to the problem with the required input for training and evaluation of their methods. Recently, a first benchmark dataset for identifying small molecules by GC-MS and LC-MS data was made available for the Critical Assessment of Small Molecule Identification (CASMI) challenge.
Several promising methods for automated structural elucidation have recently been developed [
3,
4,
5]. All these approaches perform searches in molecular structure databases, which are filtered by the mass of the molecular ion within a given range. Even with this filtering, this subset can be quite large. In order to reduce the search space, and with it, false identifications, it would be useful to determine the molecular formula of the compound before starting a search. Here, we describe how our method, SIRIUS
2 [
6,
7], can be used to determine molecular formulas based on isotope pattern analysis and calculation of fragmentation trees.
Our paper is submitted as part of the Critical Assessment of Small Molecule Identification (CASMI) contest, 2012. More detailed descriptions of the methods have previously been published elsewhere, see [
6,
8,
9,
10,
11,
12]. We focus on the compounds provided by the CASMI challenge, describing in detail the performance of, and issues with, our method.
Since SIRIUS2 can only identify the molecular formula and not the structure of compounds, we restricted ourselves to the first category of the contest. GC/MS challenges were not attempted because they have only unit mass resolution. The first category consists of 14 challenges: six compounds measured on a TOF instrument (Bruker micrOTOF-Q) and eight compounds measured on a Thermo Orbitrap instrument. Each measurement consists of MS and MS2 spectra.
2. Methods
SIRIUS
2 analyzes the isotope pattern in MS spectra, together with the fragmentation pattern of MS
2 spectra, to determine the molecular formula of the measured compound. Isotope pattern analysis is described in detail in [
6]. We first decompose the monoisotopic peak and filter the list of candidate formulas using Senior’s rule [
13]. Unless specified otherwise, we use the most common naturally occurring elements carbon (C), hydrogen (H), nitrogen (N), oxygen (O), phosphorus (P) and sulfur (S). Without any knowledge of the ionization of the compound, it is not possible to restrict our search to formulas with integer ring double bond equivalent (RDBE) values. We filter out all candidates with RDBE values lower than −0.5. For the remaining decompositions, we compute a theoretical isotope pattern by convoluting isotope distributions. Again, when not stated otherwise, we assume that the measured compounds contain naturally distributed isotopes. We then compare the theoretical isotope pattern with the measured one and compute a likelihood. See
Section 2.1 below for details.
MS
2 spectra are analyzed using fragmentation trees [
10], see [
12] for the evaluation protocol. We merge MS
2 spectra and decompose all fragment peaks. For each decomposition of the parent peak, we build a fragmentation graph, which contains all possible explanations for each peak, as well as all possible fragmentation reactions between the peak explanations. We weight the edges, using a scoring scheme loosely based on the logarithmized likelihood that a certain fragmentation reaction occurs. We then compute a subtree of maximum weight. This tree decides, implicitly for each peak, whether it is noise, and if not assigns it the molecular formula of the corresponding fragment, as well as the fragmentation cascades. The score of the tree is the sum of its edge weights. See
Section 2.2 for details.
For each candidate, we combine both scores by multiplying the isotope pattern score by a factor of 5 and adding it to the fragmentation tree score. This weighting reflects the higher reliability of isotope patterns compared with fragmentation patterns. Molecular formulas are then ranked by combined score. Finally, we try to determine the molecular formula of the neutral compound by testing different ionizations and searching for the molecular formula of the molecule in PubChem.
2.3. Data Processing
Rather than picking peaks from raw data, peak lists provided by CASMI were used. This analysis was done using the SIRIUS
2 0.9.5 command line tool (The command line tool SIRIUS
2 version 0.9.5 will be made available at [
16]). The molecular formula identification of SIRIUS
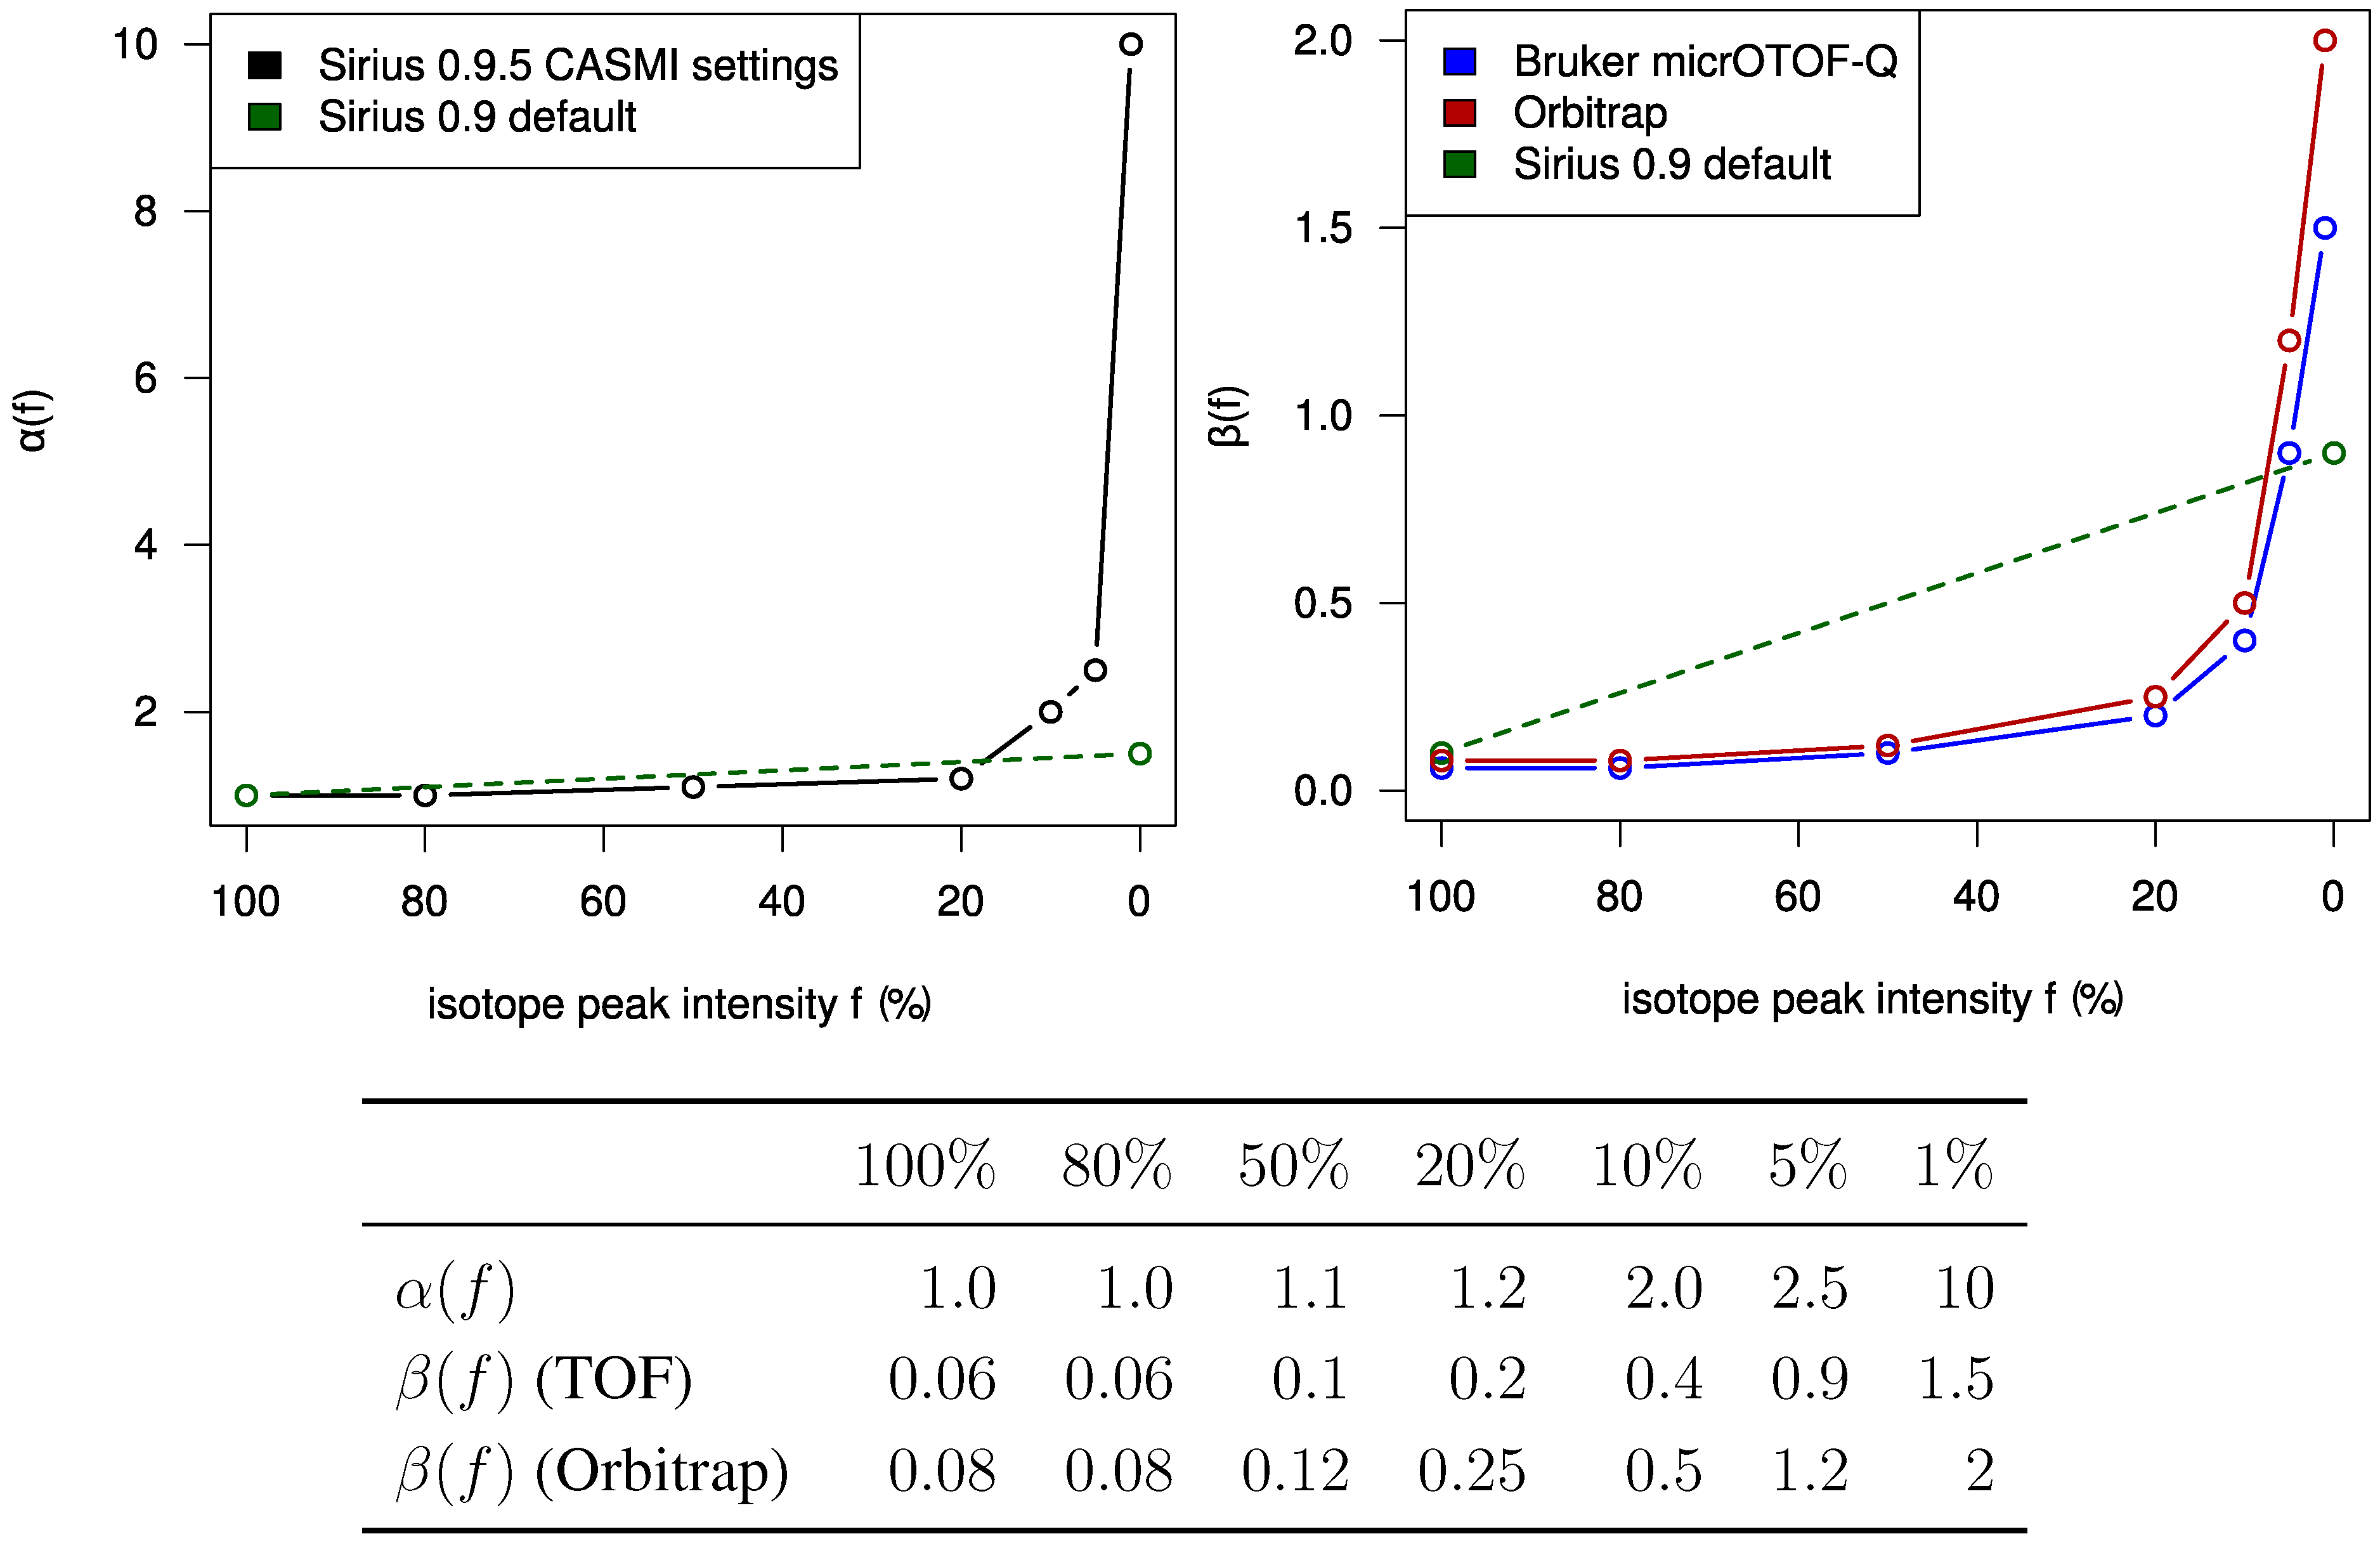
2 operates without user interaction, other than assigning of parameters (ppm,
α and
β). Different parameters for TOF and Orbitrap data as well as positive and negative mode spectra were selected. For the two negative mode spectra, we used a relative intensity threshold of 0.5%, as these spectra appear to contain an exceptionally high number of noise peaks. For Challenges 11, 12 and 13 more than one compound was found in the MS spectrum. Here, we repeated the analysis for each separate isotope pattern and chose the compound and molecular formula whose isotope pattern scored the highest.
The compound in Challenge 16 undergoes in-source fragmentation. That is, the MS spectrum potentially does not contain the parent peak but fragment peaks and isotopes of them. We merged the fragmentation patterns, manually inserted the compound mass of m/z 359.1481 from the challenge description and computed fragmentation trees, which include the isotope scores of the fragments at m/z 150 and m/z 170, into the scoring of its vertices.
The results of our software are logarithmized probability values, together with the formulas of the ion. Because CASMI allows only positive scores and neutral formulas, we had to do some post processing: Positive scores were calculated by taking the exponential of the log probabilities. For the ionization of positive mode spectra, we had to distinguish between protonated compounds and intrinsically charged molecules. Other ionizations such as [M + Na]+ were also tested but these did not result in top scores and were omitted from further analysis. As we were unsure of how to directly derive the ionization from the data (using, say, the RDBE value) we instead relied solely on PubChem to distinguish these two cases. For the protonation hypothesis a single hydrogen was extracted from the TOP 5 molecular formulas and these formulas were used to search in PubChem. In cases where a hit is found, the search stops and protonation assumed. If no hit is found, we search with the molecular formula of the ion itself in PubChem. Due to the relative rarity of intrinsically charged molecules, the protonated version of the compound is also added, with a lower score, to our output list. When neither the protonated nor the ionic molecular formula can be found in PubChem, we return the molecular formula, minus a single hydrogen and assume that the compound is not currently stored in PubChem. For negative mode spectra, we distinguish between deprotonated and intrinsically charged molecules.
Other information from PubChem such as chemical or biological reasonability of the compound was not used. On application of the software, this could be performed as post-processing, but SIRIUS2 provides a pure, de-novo approach for analyzing mass spectra.
3. Results and Discussion
The first category of the contest consists of 14 challenges: six compounds measured on a TOF instrument and eight compounds measured with an Orbitrap instrument. Four of the TOF measurements had much higher mass deviations than stated in the contest description. These compounds were unidentifiable by SIRIUS2 for obvious reasons. After the contest, new, recalibrated spectra were uploaded by the CASMI organizers. We repeated the analysis, with the same parameters, on this data. For Challenge 5 the data initially provided proved to be more accurate than the recalibrated data. The recalibrated spectra showed a higher mass deviation and the results were therefore of less use than the initial spectra. For the other compounds, our results improved greatly and often allow identification of the correct molecular formula solely from the isotope pattern data.
For the recalibrated TOF spectra we scored four out of the six compounds with rank 2. In fact, we found that for these compounds we were able to identify the correct molecular formula using only the isotope pattern data due to high isotope pattern accuracy. By contrast, the best rank of any correct molecular formula in the fragmentation pattern data analysis is 7. This gives combined scores with worse identification levels than the pure isotope pattern analysis. For the Orbitrap data, we identified 6 of 8 compounds with rank 1. One of these compounds was predicted with the wrong number of hydrogens. Here, we see that both the isotope pattern analysis and the fragmentation pattern analysis provide good identification results. All in all, our analysis identified the correct molecular formula for 10 out of the 14 compounds with a rank of 1 or 2. Using solely the isotope pattern data, the molecular formulas of these 10 compounds were correctly identified as the top rank. See
Table 1 for details. In contrast to these results, we have shown in a previous study that fragmentation pattern analysis of SIRIUS
2 improves molecular formula identification [
11]. Here, 28 of the 37 compounds were ranked at 1 by solely using isotope pattern analysis, but eight compounds were only ranked top by taking into account additional information from fragmentation trees. The relatively large errors in some of the fragmentation spectra have complicated the calculation of good fragmentation trees. However, using the example of Challenge 3 for which the combined rank outperforms the two single ranks, we can see the potential of fragmentation trees for molecular formula identification.
A possible explanation for the poor performance of SIRIUS2 on TOF fragmentation data is the relatively poor mass accuracy of this data: In our analysis we assumed a mass accuracy of 10 ppm, which implies that 99.7% of the measured fragment peaks fall within this mass deviation. However, as we also assume a normal distribution of mass deviation, this implies that 68.2% of the peak mass deviations are less than 3.33 ppm. When using the correct molecular formula as the root, the fragmentation trees computed by our approach show much higher mass deviations. Possibly, the mass accuracy of the TOF measurements is insufficient for fragmentation tree analysis. This idea was further supported by manual analysis of the fragmentation trees computed with correct molecular formulas, which showed somewhat strange “topological features”.
Table 1.
Details of the challenge compounds and rank of the correct molecular formula for isotope pattern data, fragmentation pattern data and a combination of both scores. TOF data (1–6) and Orbitrap data (10–17). For Challenges 2, 4, 6 we used the recalibrated data. For Challenge 5 we used the original data, as mass accuracy after recalibration appears to be even worse.
| Chal. No. | molecular formula | parent peak (m/z) | mode | No. of isotopes | rank isot. pattern | rank frag. pattern | combined rank |
|---|
| 1 | C18H36N4O11 | 485.245 | positive | 3 | 15 | 7 | 3 |
| 2 | C28H32O14 | 591.171 | negative | 4 | 1 | 604 | 2 |
| 3 | C14H27NO9S3 | 448.075 | negative | 5 | 8 | 12 | 8 |
| 4 | C19H17NO4 | 324.122 | positive | 3 | 1 | 8 | 2 |
| 5 | C19H23NO4 | 330.171 | positive | 4 | 1 | 18 | 2 |
| 6 | C21H21NO6 | 384.144 | positive | 4 | 1 | 15 | 2 |
| 10 | C14H9NO2 | 224.071 | APCI positive | 3 | 1 | 5 | 1 |
| 11 | C17H12O | 231.080 * | APCI positive | 2 * | 1 * | 5 * | 1 * |
| 12 | C17H16N4O4 | 341.126 | APCI positive | 2 | 13 | 21 | 18 |
| 13 | C19H17OP | 293.110 | ESI positive | 3 | 1 | 2 | 1 |
| 14 | C12H9N | 168.080 | APCI positive | 2 | 1 | 1 | 1 |
| 15 | C12H13NO2 | 204.102 | APCI positive | 2 | 1 | 1 | 1 |
| 16 | C18H21N3O5 | - | APCI positive | - | N/A | 5 (2 **) | 5 (2 **) |
| 17 | C13H13N3 | 212.119 | ESI positive | 3 | 1 | 2 | 1 |
The CASMI contest provides spectra from different instruments, ionization modes and shows several pitfalls; but for each of these categories, the number of spectra is very small. Although this is a good way to evaluate the flexibility of the competing tools, using only the number of correct identifications complicates the interpretation of results. To this end, we discuss the complications and problems we have run into.
For Challenge 1, it appears that the mass accuracy for both the isotope pattern and fragmentation data was simply not sufficient for our analysis. Given this low mass accuracy, the possible explanations for the fragments and hence the size of the fragmentation graph explode. In such a graph, incorrect common losses can be inserted purely by chance. This decreases the discriminating power between the correct and incorrect trees and thus complicates identification of the correct molecular formula.
For Challenge 2 the fragmentation pattern analysis completely fails. The correct fragmentation tree is ranked in 604. We found that the mass deviation of the fragments is too high for reasonable analysis.
For Challenge 3 the correct answer was assigned rank 8. This was due to the low quality of the isotope pattern. The fragmentation tree from fragmentation pattern analysis was empty. A closer look into the data shows that the intensities of the MS2 spectra are dominated by the parent peak. We assumed that the peaks at m/z 96 and m/z 97 were noise peaks as no molecular formulas matched the masses within 10 mDa. The remaining peaks have very low relative intensities, below 2%. Because SIRIUS2 uses relative intensities normalized over the merged spectra in its scoring, all peaks, apart from the parent peak, are labelled as noise. Setting the intensity of the parent peak to zero increases the relative intensities of the other peaks. Most of the fragment peaks are now annotated, resulting in the correct identification of the compound at rank 1. Challenge 3 exposes a shortcoming in the fragmentation pattern analysis of SIRIUS2: It fails if the intensity of the parent peak is too large in comparison with the fragment peaks. A simple solution for this problem is to normalize the spectra without the parent peak.
The molecular formula for Challenge 11 was not found by SIRIUS2. Here it suggested the molecular formula C17H11O, whereas the correct answer is C17H12O. Because the challenge description contains no information about the parent peak, we mistakenly assumed the peak at m/z 231.0798 to be the parent peak and interpreted the real parent peak, at m/z 232.0831, as an isotope peak. This assumption seemed to be reasonable as the resulting isotope pattern is very accurate.
In Challenge 12, we chose the wrong parent peak. We assumed that the MS/MS spectrum belongs to the peak at m/z 363.1079. With this as parent peak, we predicted a compound with formula C18H18O8. The correct parent peak is at m/z 341.1260 with formula C17H16N4O4. The peak at m/z 363.1079 seems to be a sodium adduct of the compound. In principle, our algorithm can handle different adducts, but it must be explicitly stated which fragmentation spectrum belongs to which parent peak. After calibrated spectra were uploaded, the correct parent mass was added to the challenge description. Unfortunately, SIRIUS2 ranked the correct molecular formula at rank 18. We found that practically all peaks show a mass bias of about 6 ppm.
In Challenge 16 the parent peak was not contained in the MS spectrum due to strong in-source fragmentation. The neutral mass of the parent peak was, however, provided in the challenge description. Here, we incorrectly used the neutral mass instead of the ionized mass as input. This is not an issue of SIRIUS2 but rather an operating error. The correct compound was again predicted at rank 5 with the wrong number of hydrogen atoms. SIRIUS2 expects ionized masses and subtracts an H+ from the input mass. This lead to an erroneous number of hydrogens and, further, to a shift in the mass difference between hydrogen and proton. If we redo the analysis with the correct mass we get the correct molecular formula at rank 2.
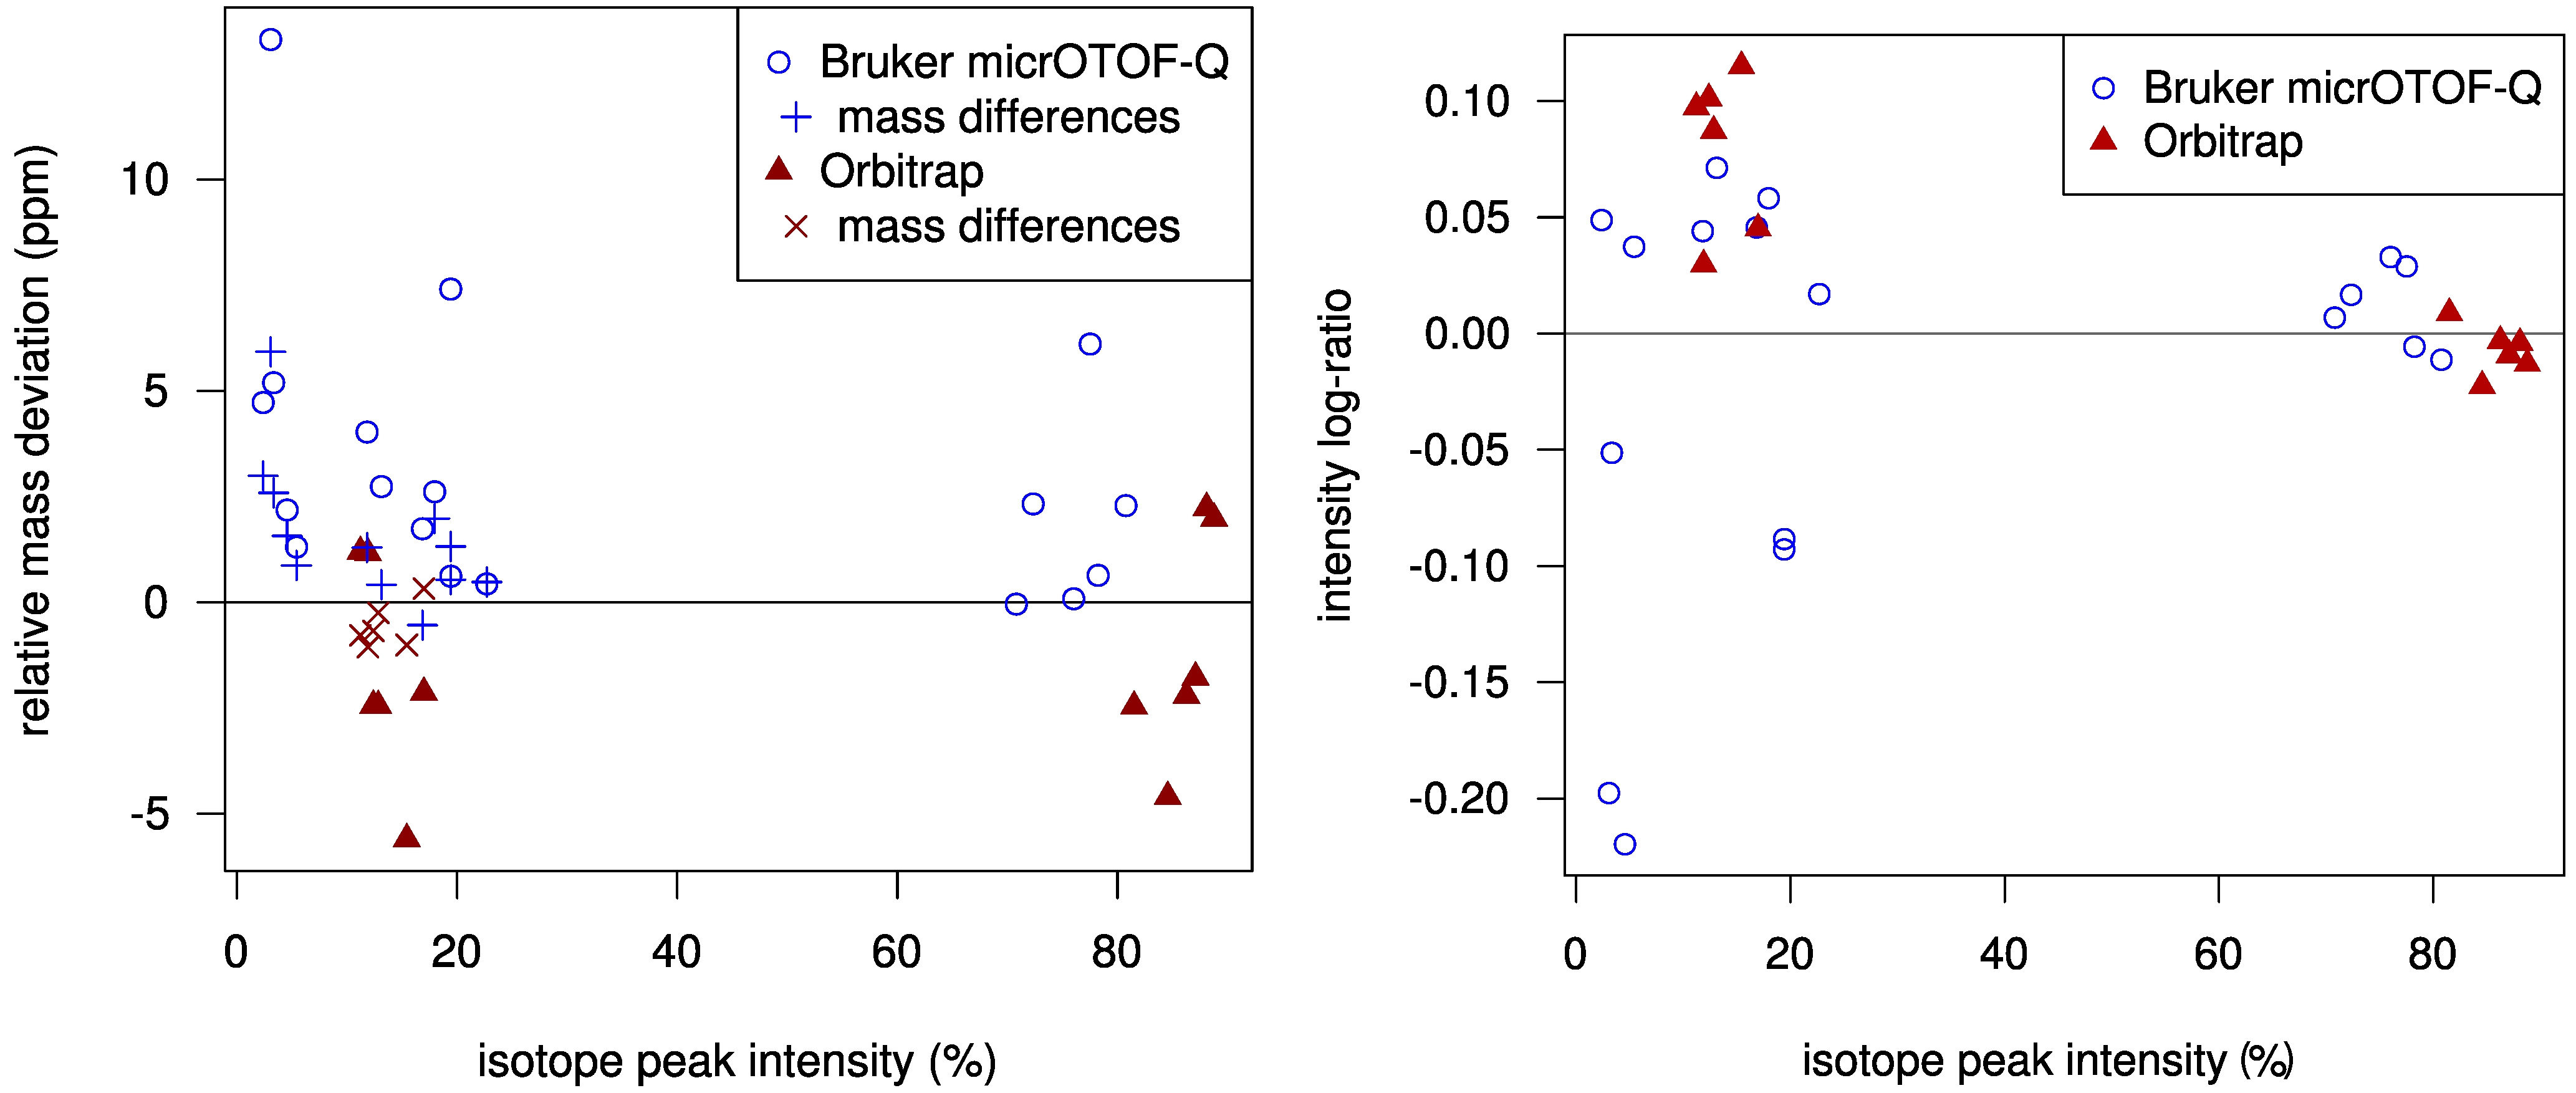
Using a statistical model for the scoring allows us to check how well the challenge data fits our model. In
Figure 2 we plot the mass deviations of the isotope peaks from the simulated isotope patterns. We find that deviations in mass differences of isotope peaks are usually smaller than deviations in the monoisotopic peak mass. We evaluate the intensity deviations analogously, see again
Figure 2. For most Orbitrap spectra, our intensity offset of 0.2% was reasonable. In contrast, for the TOF spectra we correctly decided to set this offset to zero. Possibly, this offset is a bias typical for Orbitrap measurements. Finally, it appears that we slightly underestimated the intensity accuracy for both instruments.
Figure 2.
Left: Relative mass deviation plotted against relative intensities of isotope peaks. For all but the monoisotopic peak, we use the mass deviation of the difference between the peak mass and the monoisotopic peak mass; Right: Logarithmic ratio of measured to theoretical isotopic peak intensity (log-ratio) plotted against relative peak intensities. For Orbitrap data, the log-ratio of the monoisotopic peaks is mostly negative and is always positive for the +1 peaks. The variance of the log-ratios is higher for lower intensities.
4. Conclusions
SIRIUS
2 is a software tool for automatically determining the molecular formula of compounds from their mass spectral data alone. Combining isotope and fragmentation pattern analysis, it requires no user interaction, and no compound databases or spectral libraries are accessed. SIRIUS
2 identified the chemical formulas of the majority of the compounds measured on an Orbitrap instrument, whereas, for TOF measurements, the correct molecular formula was within the first two suggestions in most cases. We have highlighted some pitfalls and how they might be avoided in the future. “Side-products” of the SIRIUS
2 analysis are fragmentation trees. These can be used for further classification and clustering of the compounds [
12].
The failed challenges indicate a potential direction for improvements of SIRIUS
2: We require an automated approach for detecting such errors. In addition, recalibration can help to improve identification results: Experimental results show that a recalibration based on uniquely decomposable peaks improves performance significantly [
17]. Our evaluation also indicates that we should use different mass deviation functions for monoisotopic peak masses and the more accurate peak mass differences.
Many challenges in the CASMI contest deal with atmospheric pressure chemical ionization (APCI). SIRIUS
2, however, was developed for and evaluated with electrospray ionization (ESI) in combination with collision-induced dissociation (CID) tandem MS data but was not developed for phenomena such as in-source fragmentation. In Challenge 16, for example, we had to write a manual workaround to handle this. Hufsky
et al. [
18] have developed a method for analyzing Electron Ionization (EI) fragmentation data, which could possibly be adapted for in-source fragmentation data.
SIRIUS2 outputs a candidate list with scores based on posterior probabilities. These depend heavily on the chosen model and parameters. At the moment, our results should be interpreted as a way of ranking the potential molecular formula, but cannot be used as an estimate whether the answer is correct.
Generally, the number of spectra and compounds analyzed is much higher than the 14 compounds from CASMI. For large datasets SIRIUS2 may perform better if its parameters are trained on reference measurements. Despite this, the current challenge setup favors a semi-automated analysis. For future challenges, we propose using a different setup: A batch of compound spectra (around 100) measured on a single instrument should be given to the contestants to train the method’s parameters. Then, another batch of spectra (possibly another 100) measured on the same instrument should be analyzed in a fully automated manner, using the parameters from the first batch.


