Microextraction by Packed Sorbent (MEPS) and Solid-Phase Microextraction (SPME) as Sample Preparation Procedures for the Metabolomic Profiling of Urine


Abstract
:
1. Introduction

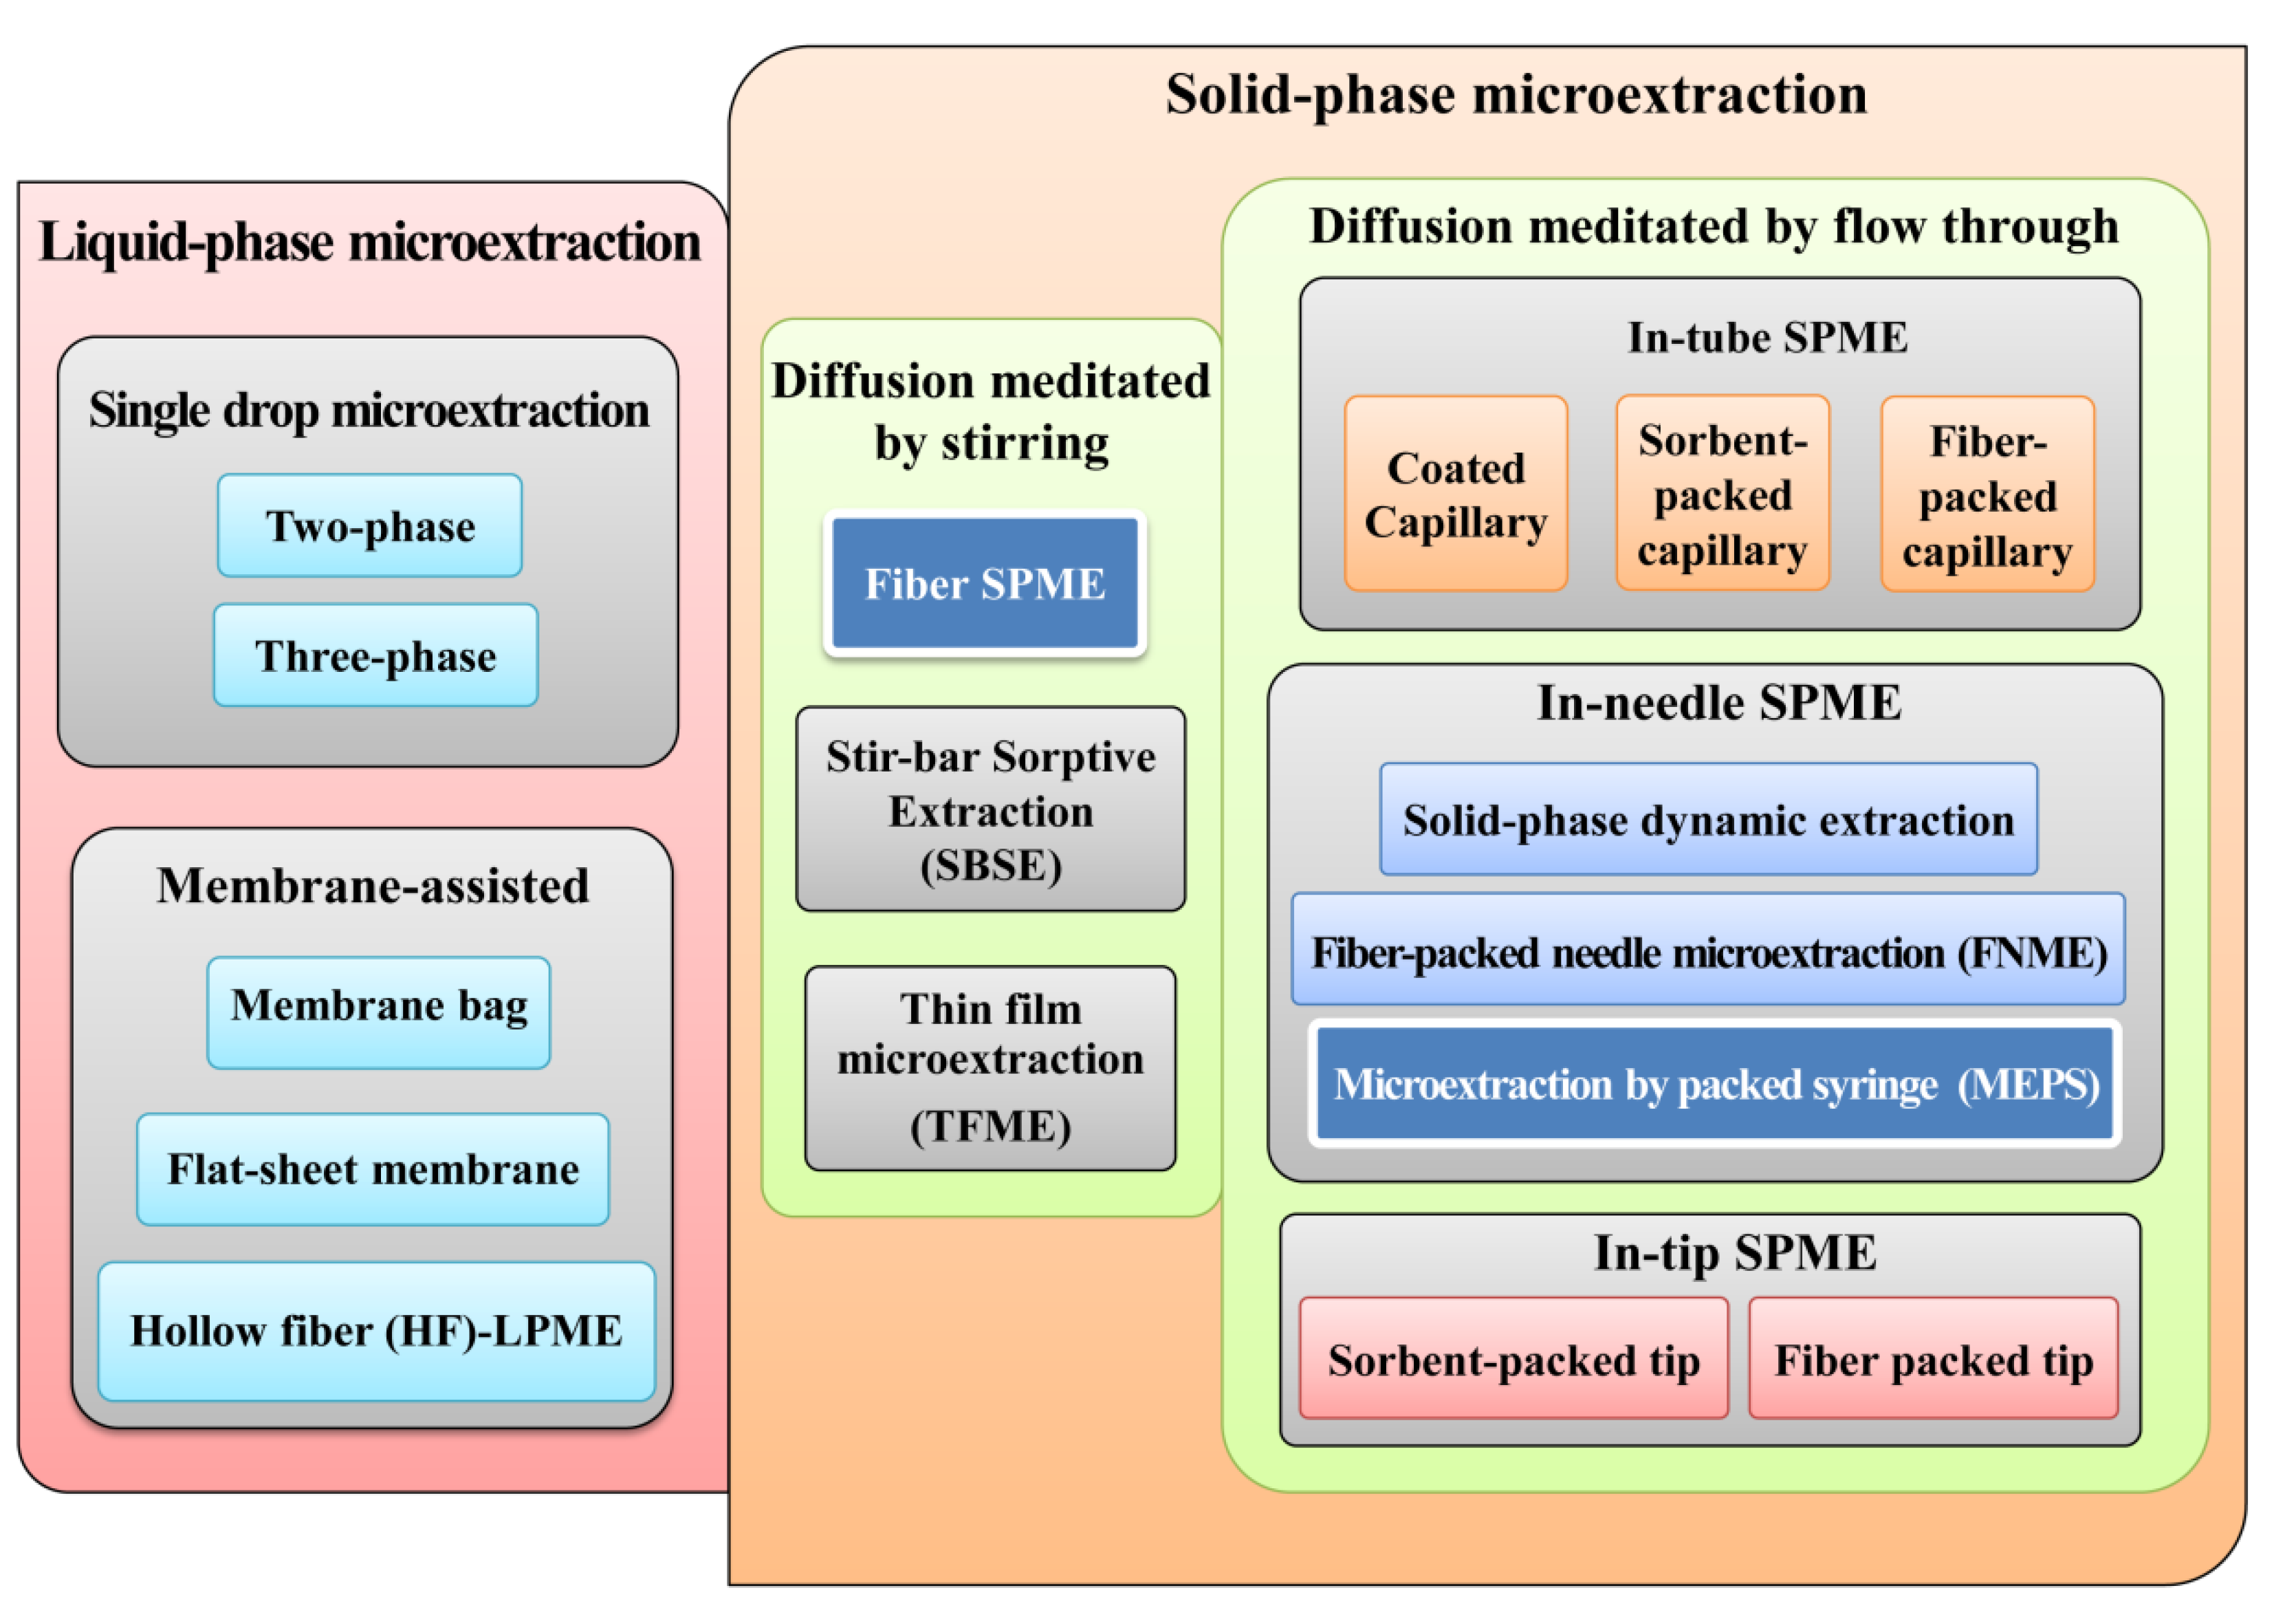
2. Extraction Techniques
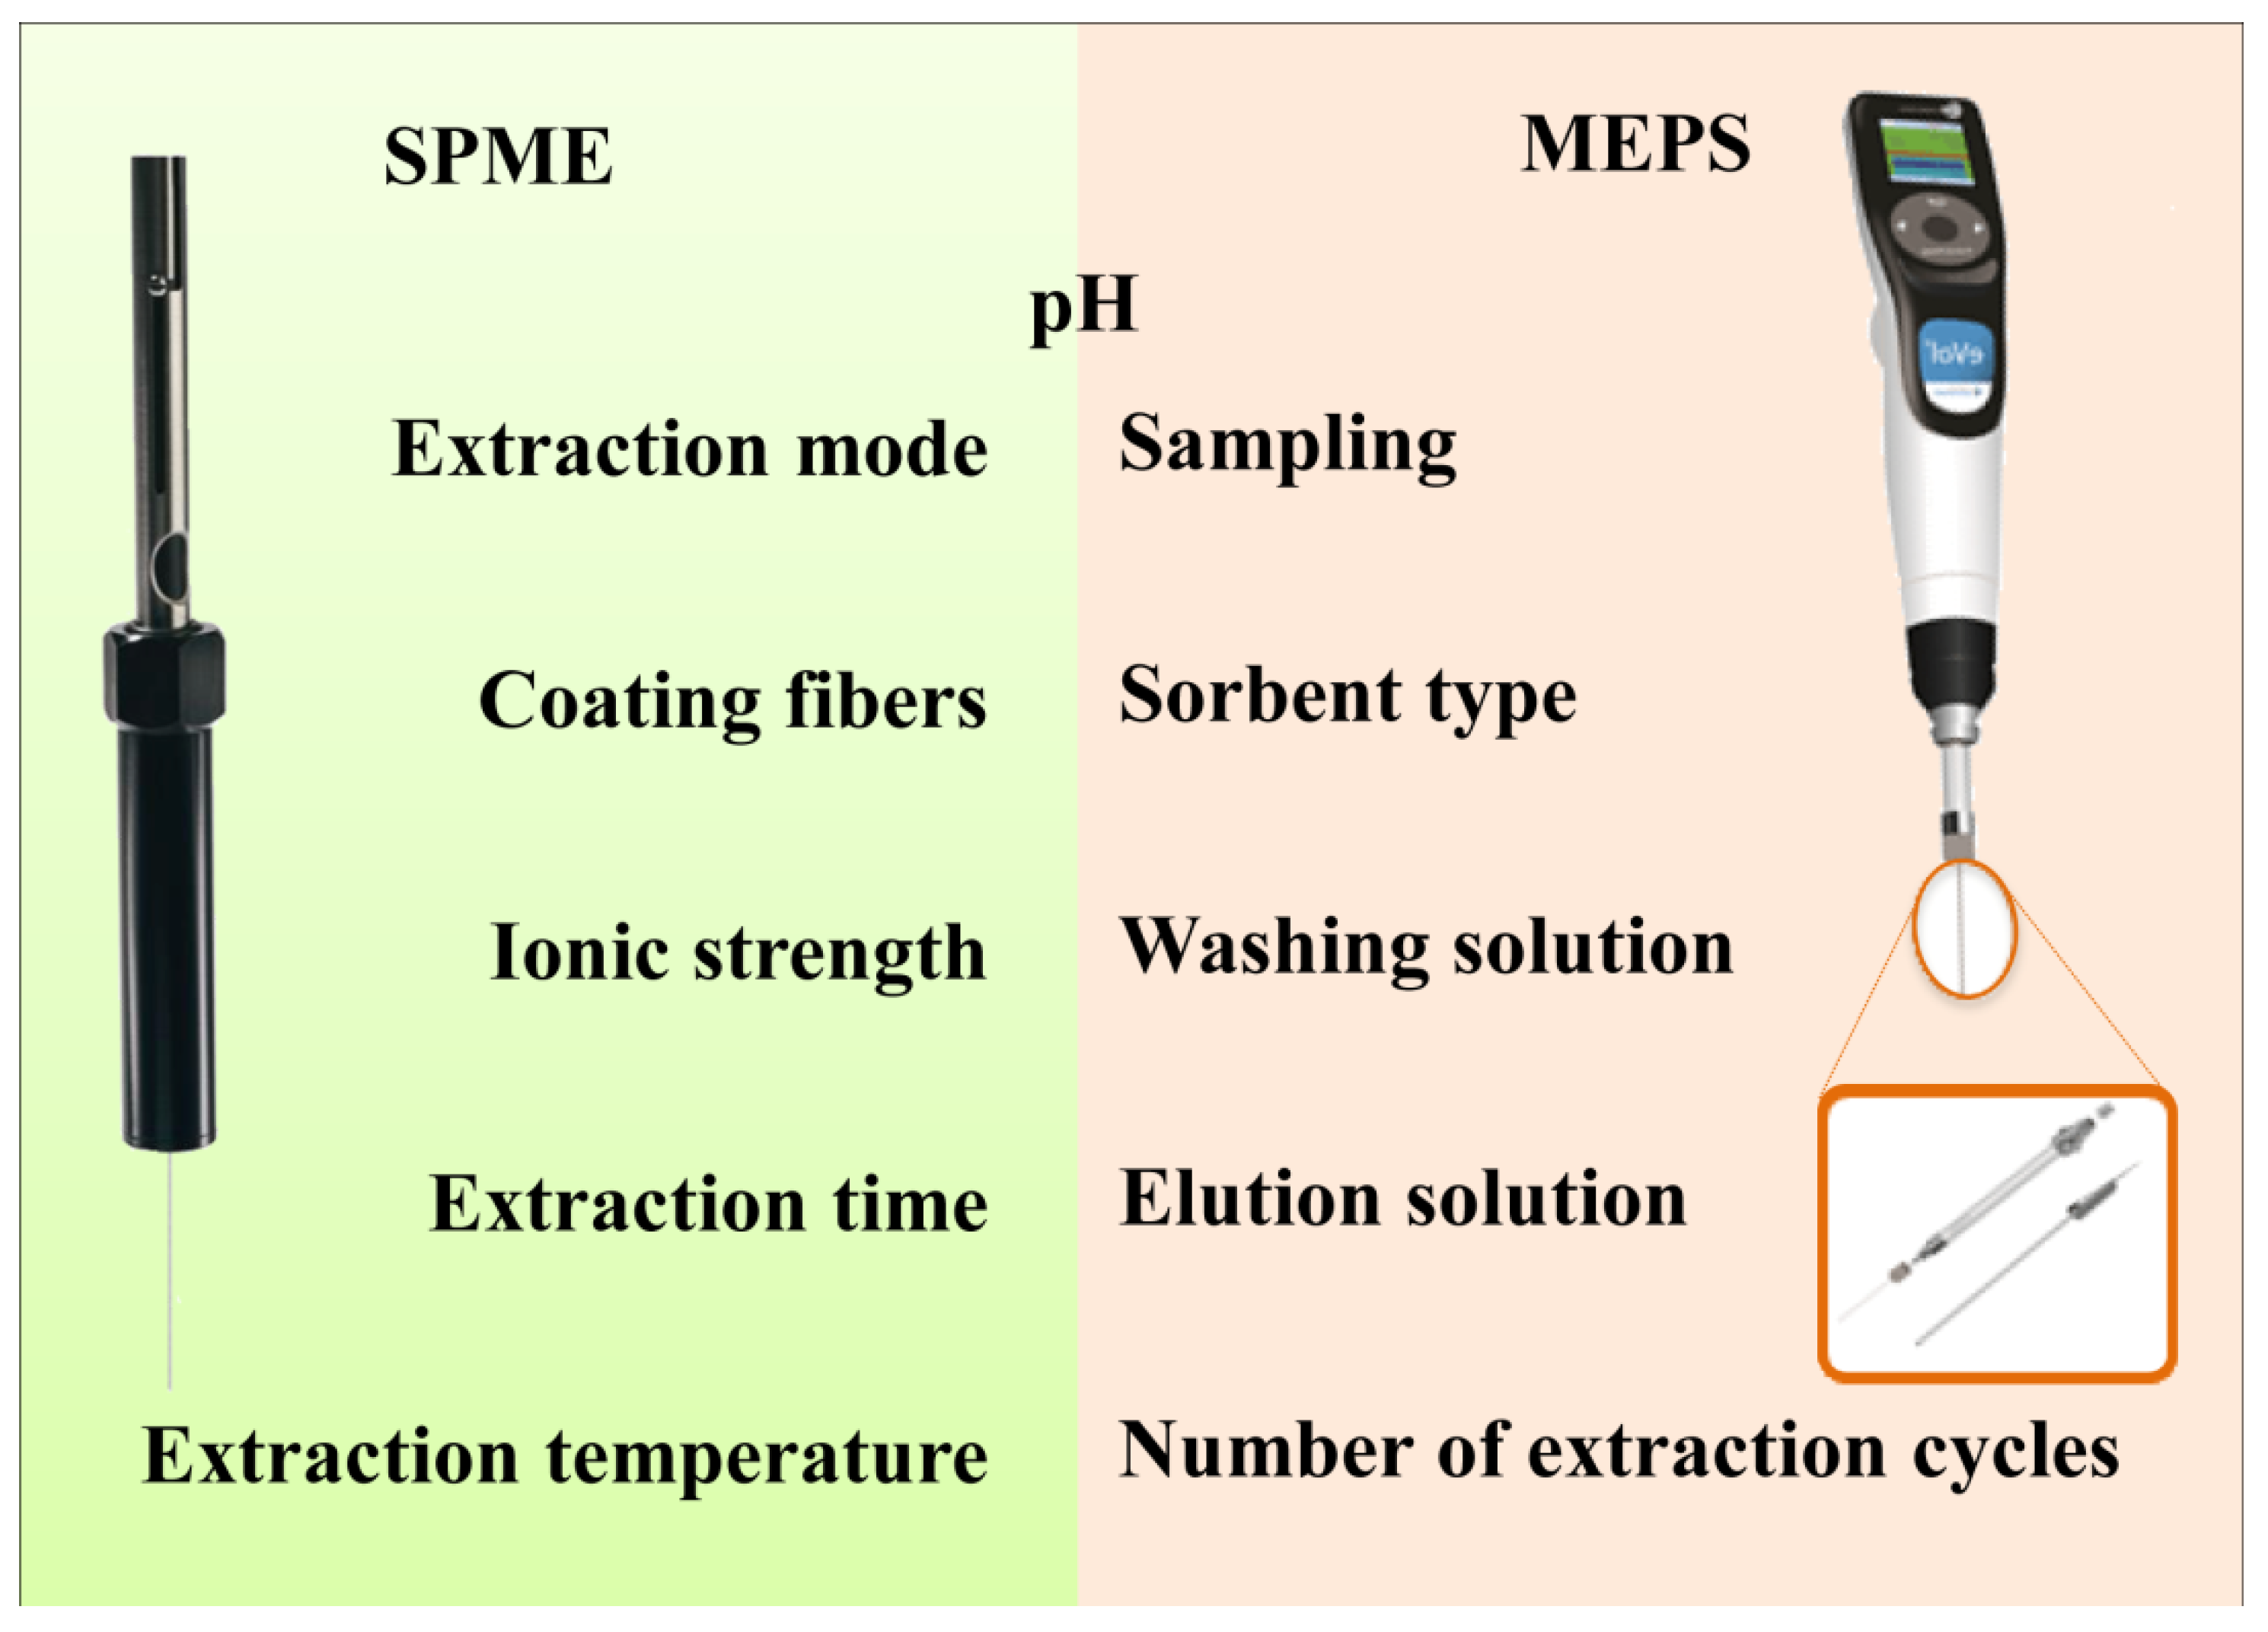
2.1. Solid-Phase Microextraction (SPME)
2.1.1. SPME Technical Aspects and Analytical Performance
2.1.1.1. Extraction Mode
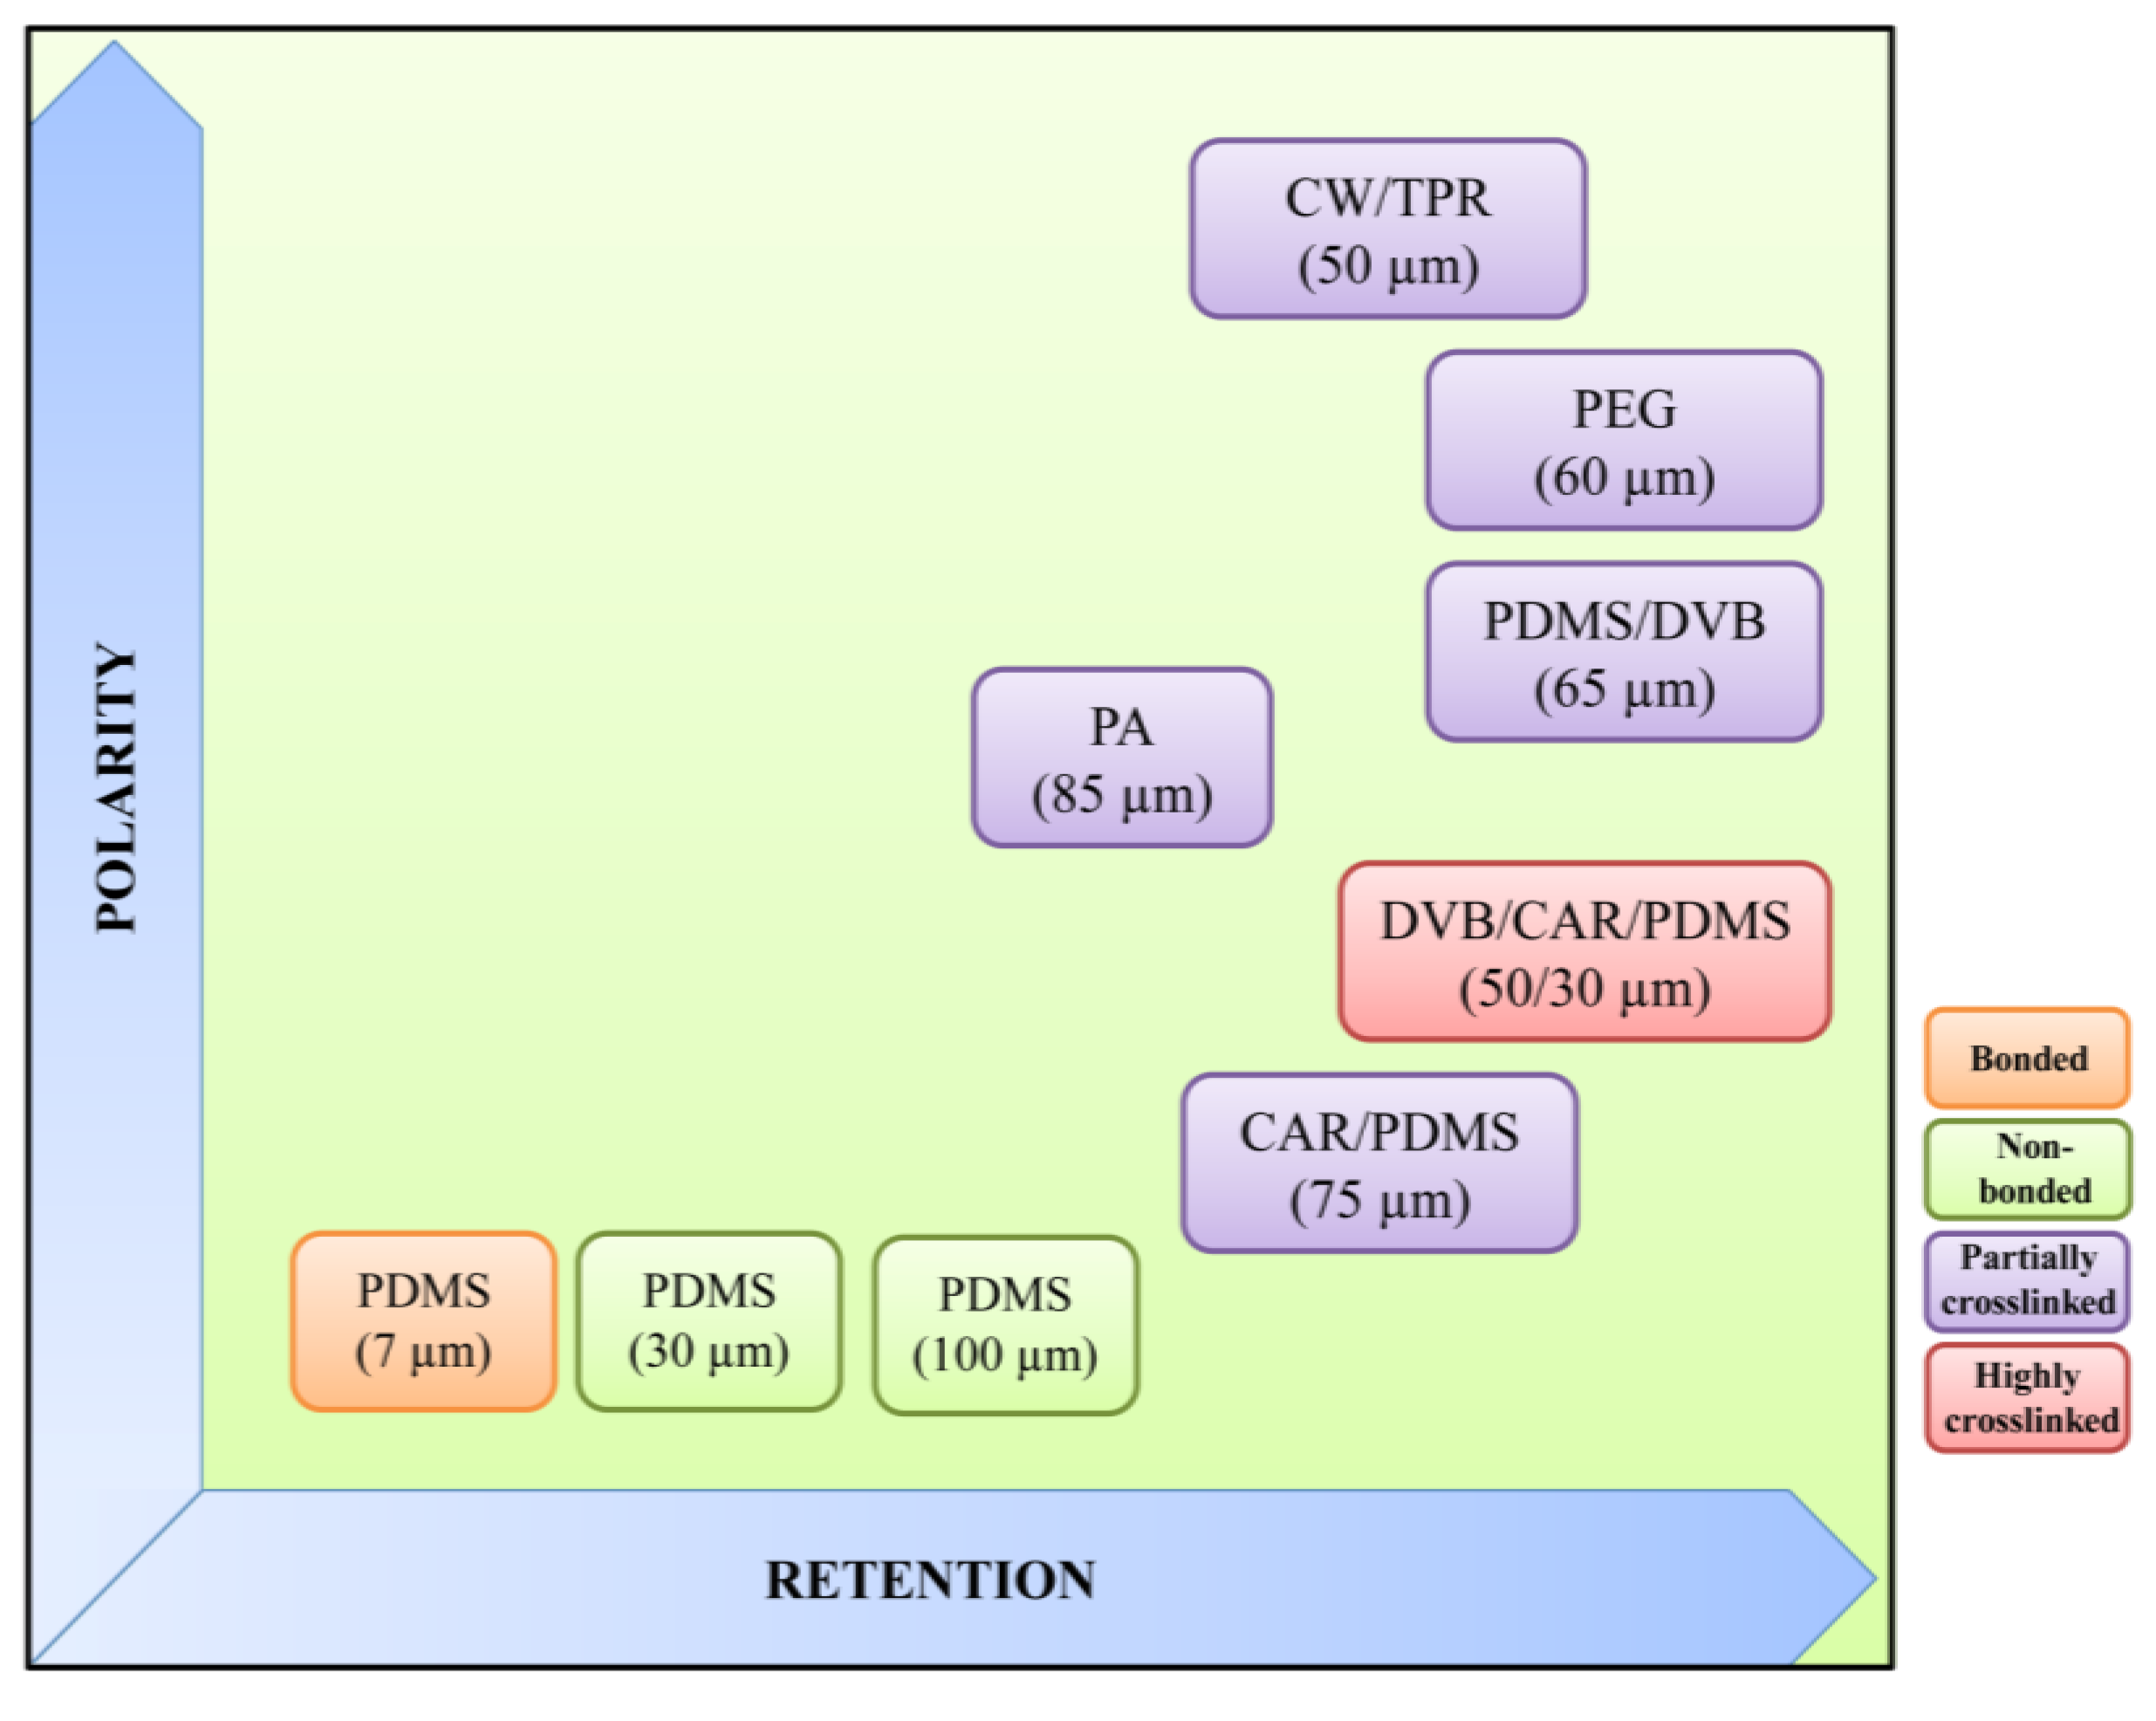
2.1.1.2. Coating Fibers

2.1.1.3. Extraction Time and Temperature
2.1.1.4. Ionic Strength
2.2. Microextraction by Packed Sorbent (MEPS)

2.2.1. MEPS Influencing Parameters
2.2.1.1. Sampling
2.2.1.2. Number of Extraction Cycles (Draw-Eject)
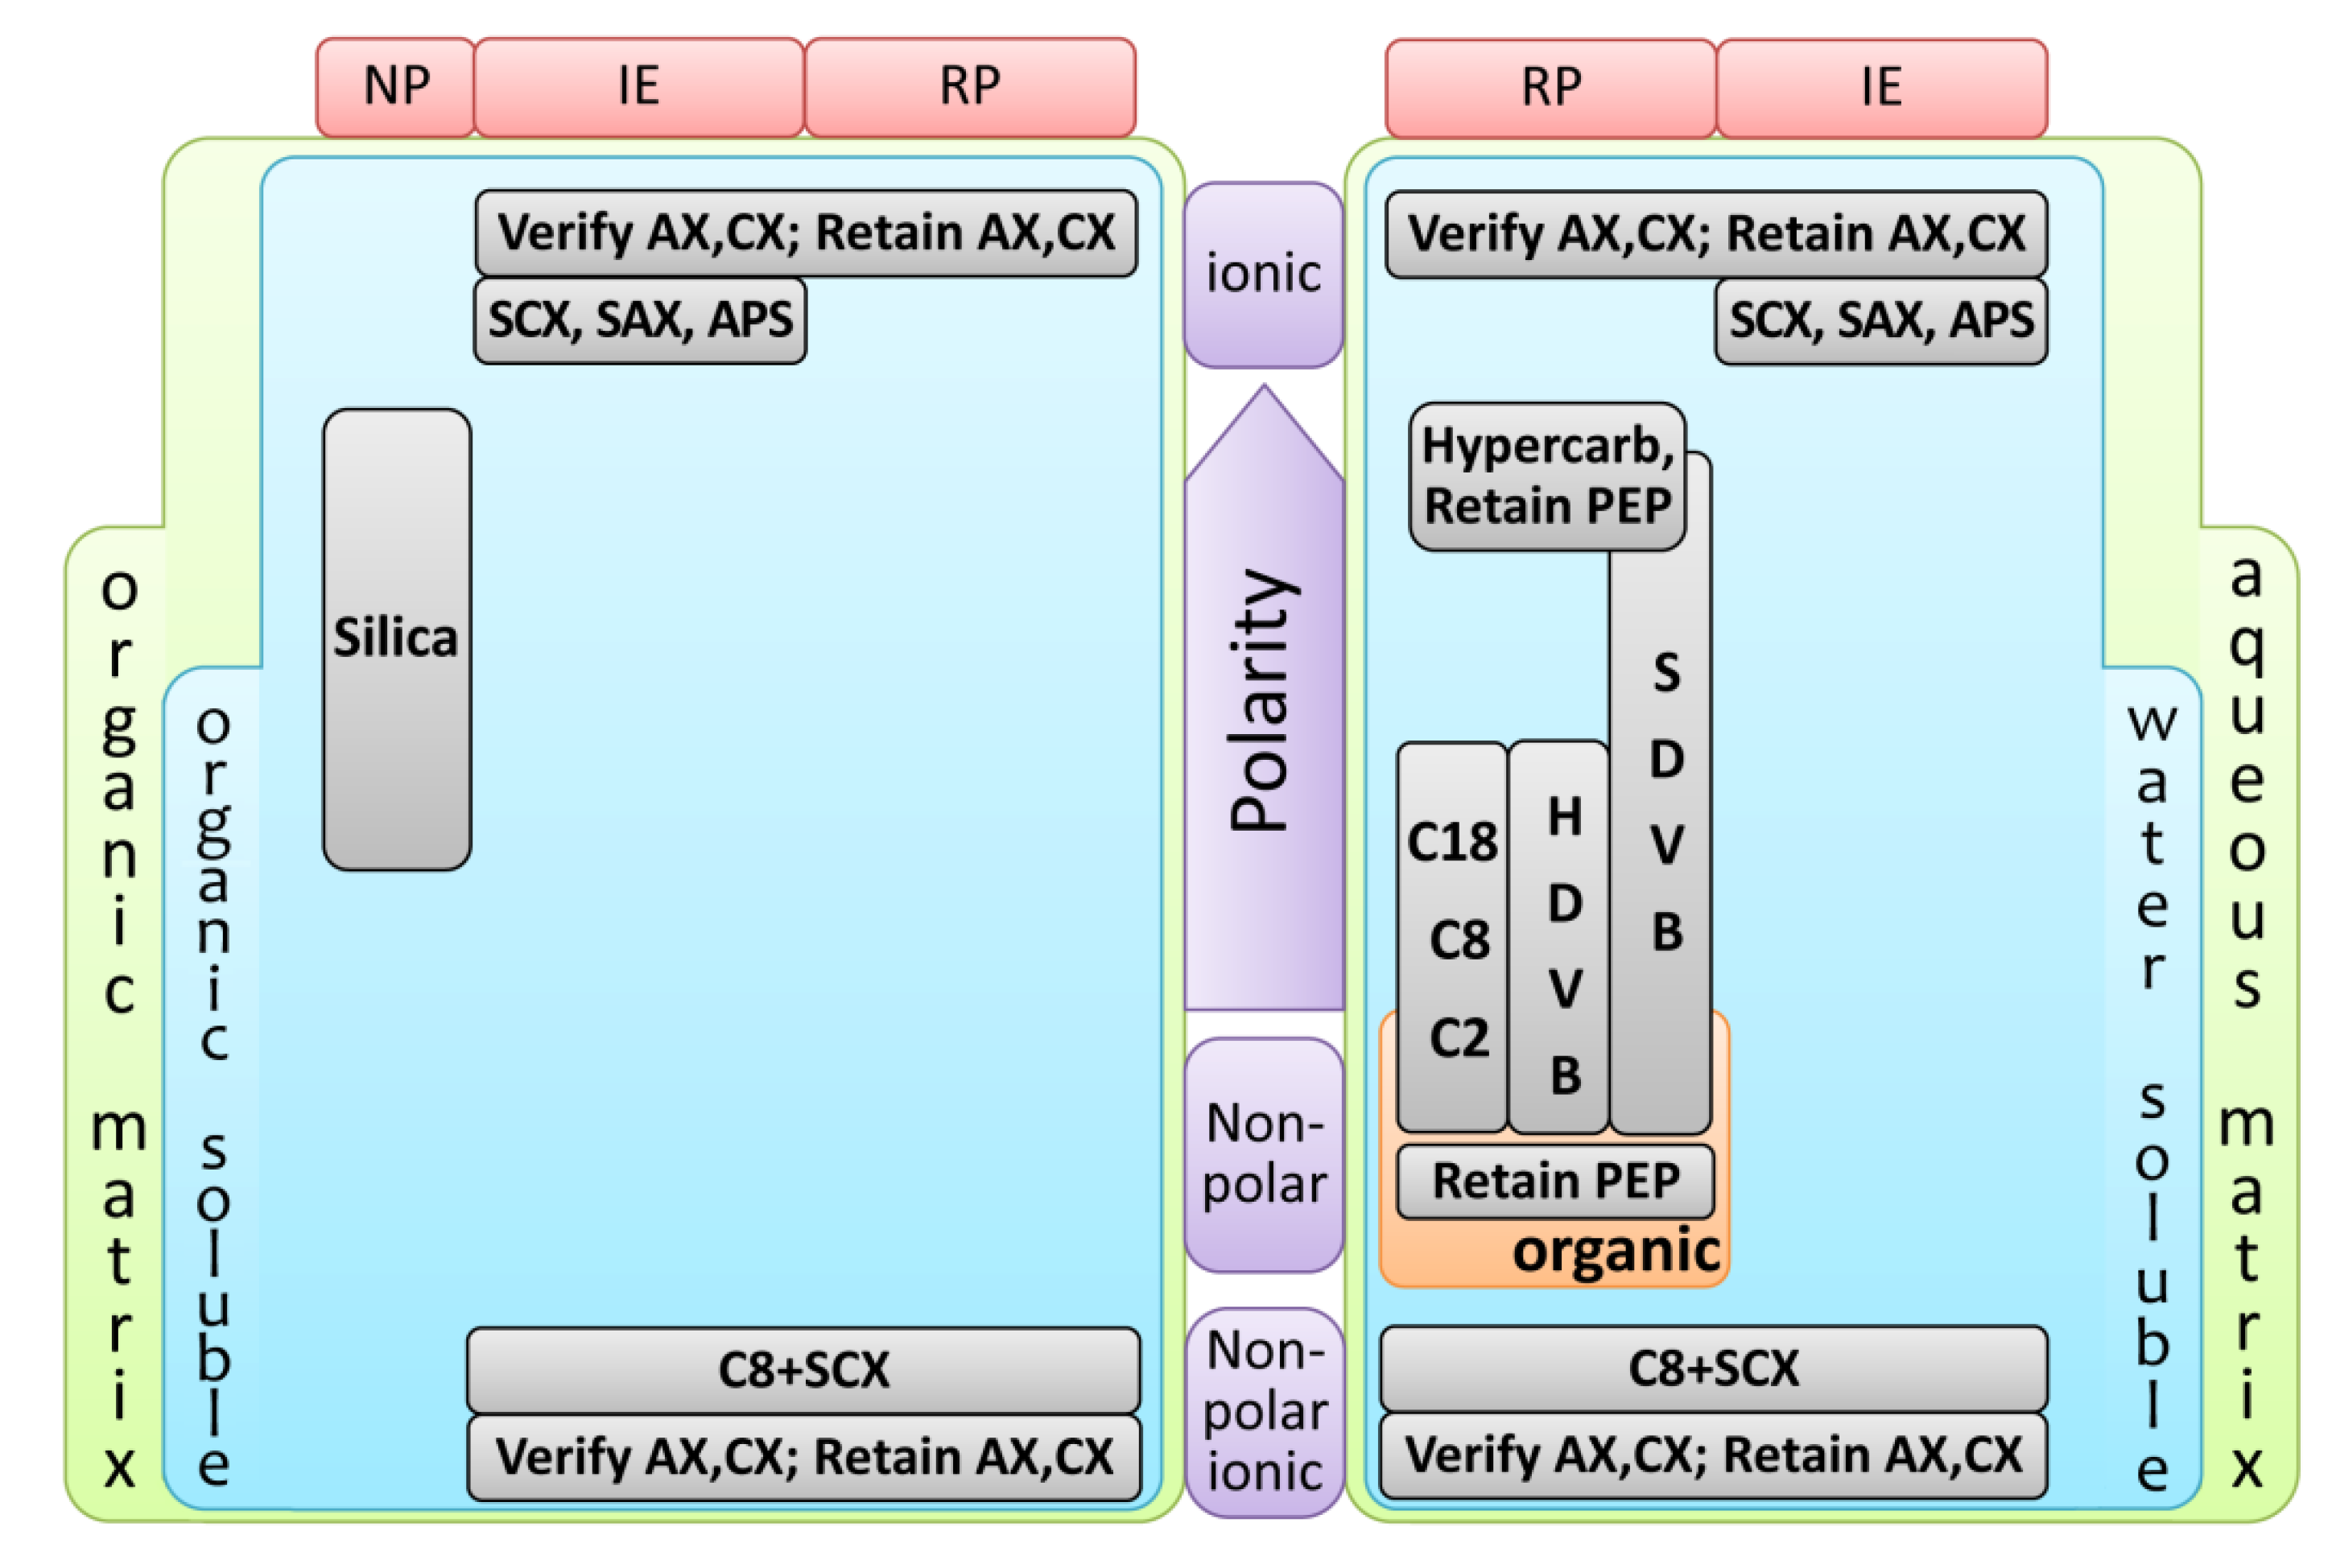
2.2.1.3. Sorbent Type
2.2.1.4. Washing Solution
2.2.1.5. Elution Solution


| Factor | MEPS | SPE | SPME |
|---|---|---|---|
| Sorbent amount | 0.5–4 mg | 50–2,000 mg | 150 mm Thickness |
| Sample preparation time | 1–2 min | 10–15 min | 10–40 min |
| BIN (Barrel insert and needle) use | 40 to 100 extractions | Single use | 50–100 extractions |
| Sample throughput | low | high | high |
| Recovery | good | good | low |
| Sensitivity | good | good | low |
| Carryover | low | high | high |
| Cost | low | high | high |
3. Metabolic Profiling of Urine: Recent Trends

3.1. MEPS and SPME Advantages for the Metabolic Profile of Urine
3.2. Early Diagnosis of Highly Prevalent Diseases, Such As Cardiovascular, Oncologic and Neurodegenerative Ones
| Target diseases or analytes | LOD | LOQ | Analytical method | Reference |
|---|---|---|---|---|
| (ng·mL−1 by default) | ||||
| CVDs | ||||
| F2-Isoprostanes (oxidative damage biomarker) | - | - | SPE/LC-MS | [70,71,72,73] |
| - | - | SPE/GC-MS | [74,75] | |
| a-KG, L-CAR and acetyl-L-CAR (cardiac cell metabolism) | - | 0.04–0.08 | SPME/LC-MS | [76] |
| CVDs drugs | ||||
| Aliskiren, prasugrel and rivaroxaban | - | 0.5–5.0 pg·mL−1 | MEPS/LC-MS/MS | [77] |
| Pravastatin and pravastatin lactone | 1.5 nM | 5 nM | SPME/LC-MS | [78] |
| Stimulants and β-blockers | 0.1–1.2 | - | SPME/LC-MS | [79] |
| Acebutolol and metoprolol | - | 1.0 | MEPS/LC-MS/MS | [80] |
| Propranolol | 4–7 | 13–20 | SPME/CEC | [81] |
| Verapamil, propranolol and metoprolol | - | - | MEPS/µPESI-MS/MS | [82] |
| Verapamil, gallopamil, norverapamil | 52–63, 5–8 | - | SPME/LC-UV (LC-MS) | [83] |
| Lidocaine | 1.0 | 5.0 | MEPS/LC-MS/MS | [36,84] |
| ODs | ||||
| Hexanal and heptanal (lung cancer) | 0.10–0.11 | 0.21–0.23 | SPME/GC-MS | [85] |
| Breast cancer VOCs | - | - | [41] | |
| Prostate cancer VOCs | 0.10 | 0.16 | [86] | |
| Sarcosine and N-ethylglycine | - | 0.03–0.06 | [87] | |
| Neuroendocrine tumor markers (HVA, VMA, 5-HIAA) | 0.046–24.3 | 0.063–49.6 | SPME/GC-QqQ-MS | [88] |
| Unrelated cancer forms | - | - | SPME/GC-MS | [89] |
| 5-HMUra and 8-oxodG (oxidatively damaged DNA) | 0.05–4.0 | 0.23–130.0 | MEPS/LC-PDA | [90] |
| 8-hydroxy-2′-deoxyguanosine (oxidatively damaged DNA) | 2.04 nM | 7.12 nM | SPME/LC-UV | [91] |
| 2.61 nM | 8.63 nM | SPME/CE-ECD | [92] | |
| ODs | ||||
| 17β-estradiol and 2-methoxyestradiol (potential angiogenesis modulators) | - | - | SPME/GC–MS | [93] |
| Roscovitine (potential anticancer drug) | 0.5 | 1.0 | MEPS/LC-MS/MS | [94] |
| Olomoucine (potential anticancer drug) | 0.5 | 1.0 | MEPS/LC-MS/MS | [95] |
| Acrolein (lipid peroxidation by-product and metabolite of cyclophosphamide and ifosfamide (anticancer drugs)) | - | - | SPME/GC-MS | [96] |
| NDDs | ||||
| Selegiline and desmethylselegiline (PD drugs) | 0.01–0.05 | 0.05–20 | SPME/GC–MS | [97] |
| Catecholamines (elevated in several CVDs an NDDs) | ||||
| Serotonin, dopamine and noradrenaline | 2–20 | 5–50 | MEPS/LC-ECD | [98] |
| Dopamine and serotonin | 1 | 50 | MEPS/LC-MS/MS | [99] |
| Dopamine | 1.2 | 4.0 | SPME/LC-ESI-MS/MS | [100] |
| Dopamine, epinephrine and norepinephrine | 4.8–7.4 (nM) | - | SPME/EC-UV | [101] |
| non-polar heterocyclic amines (high carcinogenic potential) | 1.6–5.6 | 5.5–18.7 | MEPS/CLC-FLD | [102] |
3.2.1. CVDs
3.2.2. Oncologic Diseases (ODs)
3.2.3. Neurodegenerative Diseases (NDDs)
4. Concluding Remarks

Acknowledgments
Author Contributions
Conflicts of Interest
References
- Kataoka, H. Automated sample preparation using in-tube solid-phase microextraction and its application—a review. Anal. Bioanal. Chem. 2002, 373, 31–45. [Google Scholar] [CrossRef]
- Kataoka, H.; Ishizaki, A.; Nonaka, Y.; Saito, K. Developments and applications of capillary microextraction techniques: A review. Anal. Chim. Acta 2009, 655, 8–29. [Google Scholar] [CrossRef]
- Kataoka, H. New trends in sample preparation for clinical and pharmaceutical analysis. Trends Anal. Chem. 2003, 22, 232–244. [Google Scholar] [CrossRef]
- Mitra, S. Sample Preparation Techniques in Analytical Chemistry; John Wiley & Sons Inc.: Hoboken, NJ, USA, 2004; Volume 237. [Google Scholar]
- Mendes, B.; Gonçalves, J.; Câmara, J.S. Effectiveness of high-throughput miniaturized sorbent-and solid phase microextraction techniques combined with gas chromatography-mass spectrometry analysis for a rapid screening of volatile and semi-volatile composition of wines—a comparative study. Talanta 2012, 88, 79–94. [Google Scholar] [CrossRef]
- Perestrelo, R.; Nogueira, J.; Câmara, J. Potentialities of two solventless extraction approaches—stir bar sorptive extraction and headspace solid-phase microextraction for determination of higher alcohol acetates, isoamyl esters and ethyl esters in wines. Talanta 2009, 80, 622–630. [Google Scholar] [CrossRef]
- Silva, C.L.; Gonçalves, J.L.; Câmara, J.S. A sensitive microextraction by packed sorbent-based methodology combined with ultra-high pressure liquid chromatography as a powerful technique for analysis of biologically active flavonols in wines. Anal. Chim. Acta 2012, 739, 89–98. [Google Scholar] [CrossRef]
- Jeleń, H.H.; Majcher, M.; Dziadas, M. Microextraction techniques in the analysis of food flavor compounds: A review. Anal. Chim. Acta 2012, 738, 13–26. [Google Scholar] [CrossRef]
- Pereira, J.; Gonçalves, J.; Alves, V.; Câmara, J. Microextraction using packed sorbent as an effective and high-throughput sample extraction technique: Recent applications and future trends. Sample Prep. 2013, 1, 38–53. [Google Scholar]
- Kataoka, H.; Saito, K. Recent advances in spme techniques in biomedical analysis. J. Pharm. Biomed. Anal. 2011, 54, 926–950. [Google Scholar] [CrossRef]
- Abdel-Rehim, M. Recent advances in microextraction by packed sorbent for bioanalysis. J. Chromatogr. A 2010, 1217, 2569–2580. [Google Scholar]
- Nováková, L.; Vlčková, H. A review of current trends and advances in modern bio-analytical methods: Chromatography and sample preparation. Anal. Chim. Acta 2009, 656, 8–35. [Google Scholar] [CrossRef]
- Pereira, J.; Silva, C.L.; Perestrelo, R.; Gonçalves, J.; Alves, V.; Câmara, J.S. Re-exploring the high-throughput potential of microextraction techniques, spme and meps, as powerful strategies for medical diagnostic purposes. Innovative approaches, recent applications and future trends. Anal. Bioanal. Chem. 2014. [Google Scholar] [CrossRef]
- Alves, G.; Rodrigues, M.; Fortuna, A.; Falcão, A.; Queiroz, J. A critical review of microextraction by packed sorbent as a sample preparation approach in drug bioanalysis. Bioanalysis 2013, 5, 1409–1442. [Google Scholar] [CrossRef]
- Arthur, C.L.; Pawliszyn, J. Solid phase microextraction with thermal desorption using fused silica optical fibers. Anal. Chem. 1990, 62, 2145–2148. [Google Scholar] [CrossRef]
- Zambonin, C.G.; Quinto, M.; de Vietro, N.; Palmisano, F. Solid-phase microextraction-gas chromatography mass spectrometry: A fast and simple screening method for the assessment of organophosphorus pesticides residues in wine and fruit juices. Food Chem. 2004, 86, 269–274. [Google Scholar] [CrossRef]
- Perestrelo, R.; Petronilho, S.; Câmara, J.S.; Rocha, S.M. Comprehensive two-dimensional gas chromatography with time-of-flight mass spectrometry combined with solid phase microextraction as a powerful tool for quantification of ethyl carbamate in fortified wines. The case study of madeira wine. J. Chromatogr. A 2010, 1217, 3441–3445. [Google Scholar] [CrossRef]
- Ferreira, L.; Perestrelo, R.; Caldeira, M.; Câmara, J.S. Characterization of volatile substances in apples from rosaceae family by headspace solid-phase microextraction followed by GC-qMS. J. Sep. Sci. 2009, 32, 1875–1888. [Google Scholar] [CrossRef]
- Oliveira e Silva, H.; de Pinho, P.G.; Machado, B.P.; Hogg, T.; Marques, J.; Câmara, J.S.; Albuquerque, F.; Silva Ferreira, A.C. Impact of forced-aging process on madeira wine flavor. J. Agric. Food Chem. 2008, 56, 11989–11996. [Google Scholar] [CrossRef]
- Perestrelo, R.; Caldeira, M.; Rodrigues, F.; Camara, J.S. Volatile flavour constituent patterns of terras madeirenses red wines extracted by dynamic headspace solid-phase microextraction. J. Sep. Sci. 2008, 31, 1841–1850. [Google Scholar] [CrossRef]
- Câmara, J.; Marques, J.; Alves, A.; Ferreira, A.S. Heterocyclic acetals in madeira wines. Anal. Bioanal. Chem. 2003, 375, 1221–1224. [Google Scholar]
- Ouyang, G.; Pawliszyn, J. A critical review in calibration methods for solid-phase microextraction. Anal. Chim. Acta 2008, 627, 184–197. [Google Scholar] [CrossRef]
- Dietz, C.; Sanz, J.; Cámara, C. Recent developments in solid-phase microextraction coatings and related techniques. J. Chromatogr. A 2008, 1103, 183–192. [Google Scholar]
- Turiel, E.; Martín‐Esteban, A. Molecularly imprinted polymers for solid-phase microextraction. J. Sep. Sci. 2009, 32, 3278–3284. [Google Scholar] [CrossRef]
- Spietelun, A.; Pilarczyk, M.; Kloskowski, A.; Namieśnik, J. Current trends in solid-phase microextraction (SPME) fibre coatings. Chem. Soc. Rev. 2010, 39, 4524–4537. [Google Scholar] [CrossRef]
- Pawliszyn, J.; Pedersen-Bjergaard, S. Analytical microextraction: Current status and future trends. J. Chromatogr. Sci. 2006, 44, 291–307. [Google Scholar] [CrossRef]
- Spietelun, A.; Kloskowski, A.; Chrzanowski, W.; Namieśnik, J. Understanding solid-phase microextraction: Key factors influencing the extraction process and trends in improving the technique. Chem. Rev. 2012, 113, 1667–1685. [Google Scholar]
- Pawliszyn, J. Theory of solid-phase microextraction. J. Chromatogr. Sci. 2000, 38, 270–278. [Google Scholar] [CrossRef]
- Vas, G.; Vekey, K. Solid-phase microextraction: A powerful sample preparation tool prior to mass spectrometric analysis. J. Mass Spectrom. 2004, 39, 233–254. [Google Scholar] [CrossRef]
- Vuckovic, D.; Zhang, X.; Cudjoe, E.; Pawliszyn, J. Solid-phase microextraction in bioanalysis: New devices and directions. J. Chromatogr. A 2010, 1217, 4041–4060. [Google Scholar]
- Kataoka, H.; Lord, H.L.; Pawliszyn, J. Applications of solid-phase microextraction in food analysis. J. Chromatogr. A 2000, 880, 35–62. [Google Scholar] [CrossRef]
- Perestrelo, R.; Barros, A.S.; Rocha, S.M.; Câmara, J.S. Optimisation of solid-phase microextraction combined with gas chromatography-mass spectrometry based methodology to establish the global volatile signature in pulp and skin of vitis vinifera l. Grape varieties. Talanta 2011, 85, 1483–1493. [Google Scholar] [CrossRef]
- Gonçalves, J.; Câmara, J.S. New method for determination of (E)-resveratrol in wine based on microextraction using packed sorbent and ultra-performance liquid chromatography. J. Sep. Sci. 2011, 34, 2376–2384. [Google Scholar] [CrossRef]
- Abdel-Rehim, A.; Abdel-Rehim, M. Screening and determination of drugs in human saliva utilizing microextraction by packed sorbent and liquid chromatography-tandem mass spectrometry. Biomed. Chromatogr. 2013, 27, 1188–1191. [Google Scholar] [CrossRef]
- Abdel-Rehim, M. Microextraction by packed sorbent (MEPS): A tutorial. Anal. Chim. Acta 2011, 701, 119–128. [Google Scholar] [CrossRef]
- Abdel-Rehim, M. New trend in sample preparation: On-line microextraction in packed syringe for liquid and gas chromatography applications: I. Determination of local anaesthetics in human plasma samples using gas chromatography-mass spectrometry. J. Chromatogr. B 2004, 801, 317–321. [Google Scholar] [CrossRef]
- Zhang, A.; Sun, H.; Wang, P.; Han, Y.; Wang, X. Recent and potential developments of biofluid analyses in metabolomics. J. Proteomics 2012, 75, 1079–1088. [Google Scholar] [CrossRef]
- Zhang, A.; Sun, H.; Wu, X.; Wang, X. Urine metabolomics. Clin. Chim. Acta 2012, 414, 65–69. [Google Scholar] [CrossRef]
- Ryan, D.; Robards, K.; Prenzler, P.D.; Kendall, M. Recent and potential developments in the analysis of urine: A review. Anal. Chim. Acta 2011, 684, 17–29. [Google Scholar] [CrossRef]
- Dong, H.; Zhang, A.; Sun, H.; Wang, H.; Lu, X.; Wang, M.; Ni, B.; Wang, X. Ingenuity pathways analysis of urine metabolomics phenotypes toxicity of chuanwu in wistar rats by UPLC-Q-TOF-HDMS coupled with pattern recognition methods. Mol. Biosyst. 2012, 8, 1206–1221. [Google Scholar] [CrossRef]
- Silva, C.L.; Passos, M.; Câmara, J.S. Solid phase microextraction, mass spectrometry and metabolomic approaches for detection of potential urinary cancer biomarkers—a powerful strategy for breast cancer diagnosis. Talanta 2012, 89, 360–368. [Google Scholar] [CrossRef]
- Kemperman, R.F.; Horvatovich, P.L.; Hoekman, B.; Reijmers, T.H.; Muskiet, F.A.; Bischoff, R. Comparative urine analysis by liquid chromatography-mass spectrometry and multivariate statistics: Method development, evaluation, and application to proteinuria. J. Proteome Res. 2007, 6, 194–206. [Google Scholar] [CrossRef]
- Denkert, C.; Bucher, E.; Hilvo, M.; Salek, R.; Orešič, M.; Griffin, J.; Brockmöller, S.; Klauschen, F.; Loibl, S.; Barupal, D.K.; et al. Metabolomics of human breast cancer: New approaches for tumor typing and biomarker discovery. Genome Med. 2012, 4, 37–37. [Google Scholar]
- Zhang, Y.; Wang, G.-J.; Song, T.T.; Murphy, P.A.; Hendrich, S. Urinary disposition of the soybean isoflavones daidzein, genistein and glycitein differs among humans with moderate fecal isoflavone degradation activity. J. Nutr. 1999, 129, 957–962. [Google Scholar]
- Wang, X.; Zhang, A.; Han, Y.; Wang, P.; Sun, H.; Song, G.; Dong, T.; Yuan, Y.; Yuan, X.; Zhang, M.; et al. Urine metabolomics analysis for biomarker discovery and detection of jaundice syndrome in patients with liver disease. Mol. Cell. Proteomics 2012, 11, 370–380. [Google Scholar] [CrossRef]
- Temmerman, L.; de Livera, A.; Bowne, J.; Sheedy, J.; Callahan, D.; Nahid, A.; de Souza, D.; Schoofs, L.; Tull, D.; McConville, M.; et al. Cross-platform urine metabolomics of experimental hyperglycemia in type 2 diabetes. J. Diabetes Metab. 2012, 6. [Google Scholar] [CrossRef]
- Carrola, J.; Rocha, C.U.M.; Barros, A.N.S.; Gil, A.M.; Goodfellow, B.J.; Carreira, I.M.; Bernardo, J.O.; Gomes, A.; Sousa, V.; Carvalho, L.; et al. Metabolic signatures of lung cancer in biofluids: NMR-based metabonomics of urine. J. Proteome Res. 2010, 10, 221–230. [Google Scholar]
- Slupsky, C.M.; Steed, H.; Wells, T.H.; Dabbs, K.; Schepansky, A.; Capstick, V.; Faught, W.; Sawyer, M.B. Urine metabolite analysis offers potential early diagnosis of ovarian and breast cancers. Clin. Cancer Res. 2010, 16, 5835–5841. [Google Scholar] [CrossRef]
- Serkova, N.J.; Glunde, K. Metabolomics of Cancer. In Tumor Biomarker Discovery; Springer: Berlin, Germany, 2009; pp. 273–295. [Google Scholar]
- Cho, S.H.; Jung, B.H.; Lee, S.H.; Lee, W.Y.; Kong, G.; Chung, B.C. Direct determination of nucleosides in the urine of patients with breast cancer using column-switching liquid chromatography-tandem mass spectrometry. Biomed. Chromatogr. 2006, 20, 1229–1236. [Google Scholar] [CrossRef]
- Loft, S.; Olsen, A.; Moller, P.; Poulsen, H.E.; Tjonneland, A. Association between 8-oxo-7, 8-dihydro-2′-deoxyguanosine excretion and risk of postmenopausal breast cancer: Nested case-control study. Cancer Epidemiol. Biomark. Prev. 2013, 22, 1289–1296. [Google Scholar] [CrossRef]
- Nam, H.; Chung, B.C.; Kim, Y.; Lee, K.; Lee, D. Combining tissue transcriptomics and urine metabolomics for breast cancer biomarker identification. Bioinformatics 2009, 25, 3151–3157. [Google Scholar] [CrossRef]
- Kim, D.S.; Choi, Y.D.; Moon, M.; Kang, S.; Lim, J.-B.; Kim, K.M.; Park, K.M.; Cho, N.H. Composite three-marker assay for early detection of kidney cancer. Cancer Epidemiol. Biomark. Prev. 2013, 22, 390–398. [Google Scholar] [CrossRef]
- Taylor, S.L.; Ganti, S.; Bukanov, N.O.; Chapman, A.; Fiehn, O.; Osier, M.; Kim, K.; Weiss, R.H. A metabolomics approach using juvenile cystic mice to identify urinary biomarkers and altered pathways in polycystic kidney disease. Am. J. Physiol. Renal Physiol. 2010, 298, F909–F922. [Google Scholar] [CrossRef]
- McClay, J.L.; Adkins, D.E.; Isern, N.G.; O’Connell, T.M.; Wooten, J.B.; Zedler, B.K.; Dasika, M.S.; Webb, B.T.; Webb-Robertson, B.-J.; Pounds, J.G.; et al. 1H nuclear magnetic resonance metabolomics analysis identifies novel urinary biomarkers for lung function. J. Proteome Res. 2010, 9, 3083–3090. [Google Scholar] [CrossRef]
- Michell, A.W.; Mosedale, D.; Grainger, D.J.; Barker, R.A. Metabolomic analysis of urine and serum in parkinson’s disease. Metabolomics 2008, 4, 191–201. [Google Scholar] [CrossRef]
- Caldeira, M.; Barros, A.S.; Bilelo, M.J.; Parada, A.; Câmara, J.S.; Rocha, S.M. Profiling allergic asthma volatile metabolic patterns using a headspace-solid phase microextraction/gas chromatography based methodology. J. Chromatogr. A 2011, 1218, 3771–3780. [Google Scholar]
- Mattarucchi, E.; Baraldi, E.; Guillou, C. Metabolomics applied to urine samples in childhood asthma; differentiation between asthma phenotypes and identification of relevant metabolites. Biomed. Chromatogr. 2012, 26, 89–94. [Google Scholar] [CrossRef] [Green Version]
- Rocha, S.M.; Caldeira, M.; Carrola, J.; Santos, M.; Cruz, N.; Duarte, I.F. Exploring the human urine metabolomic potentialities by comprehensive two-dimensional gas chromatography coupled to time of flight mass spectrometry. J. Chromatogr. A 2012, 1252, 155–163. [Google Scholar] [CrossRef]
- Jung, J.Y.; Lee, H.-S.; Kang, D.-G.; Kim, N.S.; Cha, M.H.; Bang, O.-S.; Hwang, G.-S. 1H-NMR-based metabolomics study of cerebral infarction. Stroke 2011, 42, 1282–1288. [Google Scholar] [CrossRef]
- Bojko, B.; Cudjoe, E.; Pawliszyn, J.; Wasowicz, M. Solid-phase microextraction. How far are we from clinical practice? Trends Anal. Chem. 2011, 30, 1505–1512. [Google Scholar] [CrossRef]
- Vuckovic, D. High-throughput solid-phase microextraction in multi-well-plate format. Trends Anal. Chem. 2013, 45, 136–153. [Google Scholar] [CrossRef] [Green Version]
- Emerit, J.; Edeas, M.; Bricaire, F. Neurodegenerative diseases and oxidative stress. Biomed. Pharmacother. 2004, 58, 39–46. [Google Scholar] [CrossRef]
- Gagliardi, A.; Miname, M.H.; Santos, R.D. Uric acid: A marker of increased cardiovascular risk. Atherosclerosis 2009, 202, 11–17. [Google Scholar] [CrossRef]
- Strobel, N.A.; Fassett, R.G.; Marsh, S.A.; Coombes, J.S. Oxidative stress biomarkers as predictors of cardiovascular disease. Int. J. Cardiol. 2011, 147, 191–201. [Google Scholar] [CrossRef]
- Ziech, D.; Franco, R.; Georgakilas, A.G.; Georgakila, S.; Malamou-Mitsi, V.; Schoneveld, O.; Pappa, A.; Panayiotidis, M.I. The role of reactive oxygen species and oxidative stress in environmental carcinogenesis and biomarker development. Chem. Biol. Interact. 2010, 188, 334–339. [Google Scholar] [CrossRef]
- Catapano, A.L. Antioxidant effect of flavonoids. Angiology 1997, 48, 39–44. [Google Scholar] [CrossRef]
- Witztum, J.L. The oxidation hypothesis of atherosclerosis. Lancet 1994, 344, 793–795. [Google Scholar] [CrossRef]
- Farhadi, K.; Hatami, M.; Matin, A.A. Microextraction techniques in therapeutic drug monitoring. Biomed. Chromatogr. 2012, 26, 972–989. [Google Scholar]
- Lee, C.-Y.J.; Jenner, A.M.; Halliwell, B. Rapid preparation of human urine and plasma samples for analysis of F2-isoprostanes by gas chromatography-mass spectrometry. Biochem. Biophys. Res. Commun. 2004, 320, 696–702. [Google Scholar] [CrossRef]
- Prasain, J.K.; Arabshahi, A.; Taub, P.R.; Sweeney, S.; Moore, R.; Sharer, J.D.; Barnes, S. Simultaneous quantification of F2-isoprostanes and prostaglandins in human urine by liquid chromatography tandem-mass spectrometry. J. Chromatogr. B 2012, 913–914, 161–168. [Google Scholar]
- Welsh, T.N.; Hubbard, S.; Mitchell, C.M.; Mesiano, S.; Zarzycki, P.K.; Zakar, T. Optimization of a solid phase extraction procedure for prostaglandin E2, F2α and their tissue metabolites. Prostag. Other Lipid Mediat. 2007, 83, 304–310. [Google Scholar]
- Zhang, B.; Saku, K. Control of matrix effects in the analysis of urinary F2-isoprostanes using novel multidimensional solid-phase extraction and LC-MS/MS. J. Lipid Res. 2007, 48, 733–744. [Google Scholar] [CrossRef]
- Langhorst, M.L.; Hastings, M.J.; Yokoyama, W.H.; Hung, S.-C.; Cellar, N.; Kuppannan, K.; Young, S.A. Determination of F2-isoprostanes in urine by online solid phase extraction coupled to liquid chromatography with tandem mass spectrometry. J. Agric. Food Chem. 2010, 58, 6614–6620. [Google Scholar] [CrossRef]
- Liu, W.; Morrow, J.D.; Yin, H. Quantification of F2-isoprostanes as a reliable index of oxidative stress in vivo using gas chromatography–mass spectrometry (GC-MS) method. Free Radic. Biol. Med. 2009, 47, 1101–1107. [Google Scholar] [CrossRef]
- Magiera, S.; Baranowska, I.; Kusa, J.; Baranowski, J. A liquid chromatography and tandem mass spectrometry method for the determination of potential biomarkers of cardiovascular disease. J. Chromatogr. B 2013, 919, 20–29. [Google Scholar]
- Magiera, S. Fast, simultaneous quantification of three novel cardiac drugs in human urine by MEPS–UHPLC–MS/MS for therapeutic drug monitoring. J. Chromatogr. B 2013, 938, 86–95. [Google Scholar] [CrossRef]
- Vlčková, H.; Rabatinová, M.; Mikšová, A.; Kolouchová, G.; Mičuda, S.; Solich, P.; Nováková, L. Determination of pravastatin and pravastatin lactone in rat plasma and urine using UHPLC-MS/MS and microextraction by packed sorbent. Talanta 2012, 90, 22–29. [Google Scholar] [CrossRef]
- Kataoka, H.; Lord, H.L.; Yamamoto, S.; Narimatsu, S.; Pawliszyn, J. Development of automated in-tube SPME/LC/MS method for drug analysis. J. Microcolumn Sep. 2000, 12, 493–500. [Google Scholar] [CrossRef]
- El-Beqqali, A.; Kussak, A.; Blomberg, L.; Abdel-Rehim, M. Microextraction in packed syringe/liquid chromatography/electrospray tandem mass spectrometry for quantification of acebutolol and metoprolol in human plasma and urine samples. J. Liq. Chromatogr. Relat. Technol. 2007, 30, 575–586. [Google Scholar] [CrossRef]
- Lin, B.; Zheng, M.M.; Ng, S.C.; Feng, Y.Q. Development of in-tube solid-phase microextraction coupled to pressure-assisted cec and its application to the analysis of propranolol enantiomers in human urine. Electrophoresis 2007, 28, 2771–2780. [Google Scholar] [CrossRef]
- Nielsen, K.; Lauritsen, F.R.; Nissilä, T.; Ketola, R.A. Rapid screening of drug compounds in urine using a combination of microextraction by packed sorbent and rotating micropillar array electrospray ionization mass spectrometry. Rapid Commun. Mass Spectrom. 2012, 26, 297–303. [Google Scholar] [CrossRef]
- Walles, M.; Mullett, W.; Levsen, K.; Borlak, J.; Wünsch, G.; Pawliszyn, J. Verapamil drug metabolism studies by automated in-tube solid phase microextraction. J. Pharm. Biomed. Anal. 2002, 30, 307–319. [Google Scholar] [CrossRef]
- Daryanavard, S.M.; Jeppsson‐Dadoun, A.; Andersson, L.I.; Hashemi, M.; Colmsjö, A.; Abdel‐Rehim, M. Molecularly imprinted polymer in microextraction by packed sorbent for the simultaneous determination of local anesthetics: Lidocaine, ropivacaine, mepivacaine and bupivacaine in plasma and urine samples. Biomed. Chromatogr. 2013, 27, 1481–1488. [Google Scholar] [CrossRef]
- Guadagni, R.; Miraglia, N.; Simonelli, A.; Silvestre, A.; Lamberti, M.; Feola, D.; Acampora, A.; Sannolo, N. Solid-phase microextraction-gas chromatography-mass spectrometry method validation for the determination of endogenous substances: Urinary hexanal and heptanal as lung tumor biomarkers. Anal. Chim. Acta 2011, 701, 29–36. [Google Scholar] [CrossRef]
- Cavaliere, B.; Macchione, B.; Monteleone, M.; Naccarato, A.; Sindona, G.; Tagarelli, A. Sarcosine as a marker in prostate cancer progression: A rapid and simple method for its quantification in human urine by solid-phase microextraction-gas chromatography-triple quadrupole mass spectrometry. Anal. Bioanal. Chem. 2011, 400, 2903–2912. [Google Scholar] [CrossRef]
- Bianchi, F.; Dugheri, S.; Musci, M.; Bonacchi, A.; Salvadori, E.; Arcangeli, G.; Cupelli, V.; Lanciotti, M.; Masieri, L.; Serni, S. Fully automated solid-phase microextraction-fast gas chromatography-mass spectrometry method using a new ionic liquid column for high-throughput analysis of sarcosine and n-ethylglycine in human urine and urinary sediments. Anal. Chim. Acta 2011, 707, 197–203. [Google Scholar] [CrossRef]
- Monteleone, M.; Naccarato, A.; Sindona, G.; Tagarelli, A. A reliable and simple method for the assay of neuroendocrine tumor markers in human urine by solid-phase microextraction-gas chromatography-triple quadrupole mass spectrometry. Anal. Chim. Acta 2012, 759, 66–73. [Google Scholar]
- Silva, C.; Passos, M.; Câmara, J. Investigation of urinary volatile organic metabolites as potential cancer biomarkers by solid-phase microextraction in combination with gas chromatography-mass spectrometry. Br. J. Cancer 2011, 105, 1894–1904. [Google Scholar] [CrossRef]
- Mendes, B.; Silva, P.; Aveiro, F.; Pereira, J.; Câmara, J.S. A micro-extraction technique using a new digitally controlled syringe combined with uhplc for assessment of urinary biomarkers of oxidatively damaged DNA. PLoS One 2013, 8, e58366. [Google Scholar]
- Zhang, S.-W.; Xing, J.; Cai, L.-S.; Wu, C.-Y. Molecularly imprinted monolith in-tube solid-phase microextraction coupled with HPLC/UV detection for determination of 8-hydroxy-2′-deoxyguanosine in urine. Anal. Bioanal. Chem. 2009, 395, 479–487. [Google Scholar] [CrossRef]
- Zhang, S.; Song, X.; Zhang, W.; Luo, N.; Cai, L. Determination of low urinary 8-hydroxy-2-deoxyguanosine excretion with capillary electrophoresis and molecularly imprinted monolith solid phase microextraction. Sci. Total Environ. 2013, 450, 266–270. [Google Scholar]
- Bianchi, F.; Mattarozzi, M.; Careri, M.; Mangia, A.; Musci, M.; Grasselli, F.; Bussolati, S.; Basini, G. An SPME-GC-MS method using an octadecyl silica fibre for the determination of the potential angiogenesis modulators 17β-estradiol and 2-methoxyestradiol in culture media. Anal. Bioanal. Chem. 2010, 396, 2639–2645. [Google Scholar] [CrossRef]
- Vita, M.; Skansen, P.; Hassan, M.; Abdel-Rehim, M. Development and validation of a liquid chromatography and tandem mass spectrometry method for determination of roscovitine in plasma and urine samples utilizing on-line sample preparation. J. Chromatogr. B 2005, 817, 303–307. [Google Scholar] [CrossRef]
- Abdel-Rehim, M.; Skansen, P.; Vita, M.; Hassan, Z.; Blomberg, L.; Hassan, M. Microextraction in packed syringe/liquid chromatography/electrospray tandem mass spectrometry for quantification of olomoucine in human plasma samples. Anal. Chim. Acta 2005, 539, 35–39. [Google Scholar] [CrossRef]
- Takamoto, S.; Sakura, N.; Namera, A.; Yashiki, M. Monitoring of urinary acrolein concentration in patients receiving cyclophosphamide and ifosphamide. J. Chromatogr. B 2004, 806, 59–63. [Google Scholar] [CrossRef]
- Kuriki, A.; Kumazawa, T.; Lee, X.-P.; Hasegawa, C.; Kawamura, M.; Suzuki, O.; Sato, K. Simultaneous determination of selegiline and desmethylselegiline in human body fluids by headspace solid-phase microextraction and gas chromatography-mass spectrometry. J. Chromatogr. B 2006, 844, 283–291. [Google Scholar] [CrossRef]
- Oppolzer, D.; Moreno, I.; Fonseca, B.; Passarinha, L.; Barroso, M.; Costa, S.; Queiroz, J.A.; Gallardo, E. Analytical approach to determine biogenic amines in urine using microextraction in packed syringe and liquid chromatography coupled to electrochemical detection. Biomed. Chromatogr. 2013, 27, 608–614. [Google Scholar] [CrossRef]
- El-Beqqali, A.; Kussak, A.; Abdel-Rehim, M. Determination of dopamine and serotonin in human urine samples utilizing microextraction online with liquid chromatography/electrospray tandem mass spectrometry. J. Sep. Sci. 2007, 30, 421–424. [Google Scholar] [CrossRef]
- He, J.; Liu, Z.; Ren, L.; Liu, Y.; Dou, P.; Qian, K.; Chen, H.-Y. On-line coupling of in-tube boronate affinity solid phase microextraction with high performance liquid chromatography-electrospray ionization tandem mass spectrometry for the determination of cis-diol biomolecules. Talanta 2010, 82, 270–276. [Google Scholar] [CrossRef]
- Zhang, X.; Xu, S.; Lim, J.-M.; Lee, Y.-I. Molecularly imprinted solid phase microextraction fiber for trace analysis of catecholamines in urine and serum samples by capillary electrophoresis. Talanta 2012, 99, 270–276. [Google Scholar] [CrossRef]
- De Andrés, F.; Zougagh, M.; Castañeda, G.; Sánchez-Rojas, J.L.; Ríos, A. Screening of non-polar heterocyclic amines in urine by microextraction in packed sorbent-fluorimetric detection and confirmation by capillary liquid chromatography. Talanta 2011, 83, 1562–1567. [Google Scholar] [CrossRef]
- Sun, X.; Jia, Z. A brief review of biomarkers for preventing and treating cardiovascular diseases. J. Cardiovasc. Dis. Res. 2012, 3, 251–254. [Google Scholar] [CrossRef]
- Il’yasova, D.; Scarbrough, P.; Spasojevic, I. Urinary biomarkers of oxidative status. Clin. Chim. Acta 2012, 413, 1446–1453. [Google Scholar] [CrossRef]
- Cracowski, J.-L.; Ormezzano, O. Isoprostanes, emerging biomarkers and potential mediators in cardiovascular diseases. Eur. Heart J. 2004, 25, 1675–1678. [Google Scholar] [CrossRef]
- Davies, S.S.; Roberts, L.J., II. F2-isoprostanes as an indicator and risk factor for coronary heart disease. Free Radic. Biol. Med. 2011, 50, 559–566. [Google Scholar] [CrossRef]
- Roest, M.; Voorbij, H.A.; van der Schouw, Y.T.; Peeters, P.H.; Teerlink, T.; Scheffer, P.G. High levels of urinary F2-isoprostanes predict cardiovascular mortality in postmenopausal women. J. Clin. Lipidol. 2008, 2, 298–303. [Google Scholar] [CrossRef]
- Medina, S.; Domínguez-Perles, R.; Gil, J.; Ferreres, F.; García-Viguera, C.; Martínez-Sanz, J.; Gil-Izquierdo, A. A ultra-pressure liquid chromatography/triple quadrupole tandem mass spectrometry method for the analysis of 13 eicosanoids in human urine and quantitative 24 hour values in healthy volunteers in a controlled constant diet. Rapid Commun. Mass Spectrom. 2012, 26, 1249–1257. [Google Scholar] [CrossRef]
- Il’yasova, D.; Morrow, J.D.; Ivanova, A.; Wagenknecht, L.E. Epidemiological marker for oxidant status: Comparison of the elisa and the gas chromatography/mass spectrometry assay for urine 2, 3-dinor-5, 6-dihydro-15-F2-isoprostane. Ann. Epidemiol. 2004, 14, 793–797. [Google Scholar] [CrossRef]
- Mendes, B.; Silva, P.; Mendonça, I.; Pereira, J.; Câmara, J.S. A new and fast methodology to assess oxidative damage in cardiovascular diseases risk development through eVol-MEPS-UHPLC analysis of four urinary biomarkers. Talanta 2013, 116, 164–172. [Google Scholar] [CrossRef]
- Baranowska, I.; Magiera, S.; Baranowski, J. Clinical applications of fast liquid chromatography: A review on the analysis of cardiovascular drugs and their metabolites. J. Chromatogr. B 2013, 927, 54–79. [Google Scholar] [CrossRef]
- Kataoka, H.; Narimatsu, S.; Lord, H.L.; Pawliszyn, J. Automated in-tube solid-phase microextraction coupled with liquid chromatography/electrospray ionization mass spectrometry for the determination of β-blockers and metabolites in urine and serum samples. Anal. Chem. 1999, 71, 4237–4244. [Google Scholar] [CrossRef]
- Mullett, W.M.; Martin, P.; Pawliszyn, J. In-tube molecularly imprinted polymer solid-phase microextraction for the selective determination of propranolol. Anal. Chem. 2001, 73, 2383–2389. [Google Scholar] [CrossRef]
- Beger, R. A review of applications of metabolomics in cancer. Metabolites 2013, 3, 552–574. [Google Scholar] [CrossRef]
- Cornu, J.-N.; Cancel-Tassin, G.; Ondet, V.; Girardet, C.; Cussenot, O. Olfactory detection of prostate cancer by dogs sniffing urine: A step forward in early diagnosis. Eur. Urol. 2011, 59, 197–201. [Google Scholar] [CrossRef]
- Toyokuni, S. Molecular mechanisms of oxidative stress-induced carcinogenesis: From epidemiology to oxygenomics. IUBMB Life 2008, 60, 441–447. [Google Scholar] [CrossRef]
- Kwak, J.; Preti, G. Challenges in the Investigation of Volatile Disease Biomarkers in Urine. In Volatile Biomarkers; Amann, A., Smith, D., Eds.; Elsevier: Amsterdam, The Netherlands, 2013; pp. 394–404. [Google Scholar]
- Peaston, R.T.; Weinkove, C. Measurement of catecholamines and their metabolites. Ann. Clin. Biochem. 2004, 41, 17–38. [Google Scholar] [CrossRef]
- Barocas, D.A.; Motley, S.; Cookson, M.S.; Chang, S.S.; Penson, D.F.; Dai, Q.; Milne, G.; Roberts, L.J., II; Morrow, J.; Concepcion, R.S.; et al. Oxidative stress measured by urine F2-isoprostane level is associated with prostate cancer. J. Urol. 2011, 185, 2102–2107. [Google Scholar] [CrossRef]
- Hegde, M.L.; Mantha, A.K.; Hazra, T.K.; Bhakat, K.K.; Mitra, S.; Szczesny, B. Oxidative genome damage and its repair: Implications in aging and neurodegenerative diseases. Mech. Ageing Dev. 2012, 133, 157–168. [Google Scholar] [CrossRef]
- Migliore, L.; Fontana, I.; Colognato, R.; Coppede, F.; Siciliano, G.; Murri, L. Searching for the role and the most suitable biomarkers of oxidative stress in alzheimer’s disease and in other neurodegenerative diseases. Neurobiol. Aging 2005, 26, 587–595. [Google Scholar] [CrossRef]
- Bolner, A.; Pilleri, M.; de Riva, V.; Nordera, G. Plasma and urinary HPLC-ED determination of the ratio of 8-OHdG/2-dG in parkinson’s disease. Clin. Lab. 2011, 57, 859–866. [Google Scholar]
- Bogdanov, M.; Matson, W.R.; Wang, L.; Matson, T.; Saunders-Pullman, R.; Bressman, S.S.; Beal, M.F. Metabolomic profiling to develop blood biomarkers for parkinson’s disease. Brain 2008, 131, 389–396. [Google Scholar] [CrossRef]
- Bohnstedt, K.C.; Karlberg, B.; Wahlund, L.-O.; Jönhagen, M.E.; Basun, H.; Schmidt, S. Determination of isoprostanes in urine samples from alzheimer patients using porous graphitic carbon liquid chromatography-tandem mass spectrometry. J. Chromatogr. B 2003, 796, 11–19. [Google Scholar] [CrossRef]
- Connolly, J.; Siderowf, A.; Clark, C.M.; Mu, D.; Pratico, D. F2 isoprostane levels in plasma and urine do not support increased lipid peroxidation in cognitively impaired parkinson disease patients. Cogn. Behav. Neurol. 2008, 21, 83–86. [Google Scholar] [CrossRef]
- Kim, K.M.; Jung, B.H.; Paeng, K.-J.; Kim, I.; Chung, B.C. Increased urinary F2-isoprostanes levels in the patients with alzheimer’s disease. Brain Res. Bull. 2004, 64, 47–51. [Google Scholar] [CrossRef]
- Montine, K.S.; Quinn, J.F.; Zhang, J.; Fessel, J.P.; Roberts, L.J., II; Morrow, J.D.; Montine, T.J. Isoprostanes and related products of lipid peroxidation in neurodegenerative diseases. Chem. Phys. Lipids 2004, 128, 117–124. [Google Scholar] [CrossRef]
- Mufson, E.J.; Leurgans, S. Inability of plasma and urine F2A-isoprostane levels to differentiate mild cognitive impairment from alzheimer’s disease. Neurodegener. Dis. 2010, 7, 139–142. [Google Scholar] [CrossRef]
- Sundelöf, J.; Kilander, L.; Helmersson, J.; Larsson, A.; Rönnemaa, E.; Degerman-Gunnarsson, M.; Sjögren, P.; Basun, H.; Lannfelt, L.; Basu, S. Systemic tocopherols and F(2)-isoprostanes and the risk of alzheimer’s disease and dementia: A prospective population-based study. J. Alzheimers Dis. 2009, 18, 71–78. [Google Scholar]
- Tuppo, E.; Forman, L.; Spur, B.; Chan-Ting, R.; Chopra, A.; Cavalieri, T. Sign of lipid peroxidation as measured in the urine of patients with probable alzheimer’s disease. Brain Res. Bull. 2001, 54, 565–568. [Google Scholar] [CrossRef]
- Cecchi, C.; Fiorillo, C.; Sorbi, S.; Latorraca, S.; Nacmias, B.; Bagnoli, S.; Nassi, P.; Liguri, G. Oxidative stress and reduced antioxidant defenses in peripheral cells from familial alzheimer’s patients. Free Radic. Biol. Med. 2002, 33, 1372–1379. [Google Scholar] [CrossRef]
- Davidson, D.; Grosset, K.; Grosset, D. Parkinson’s disease: The effect of L-dopa therapy on urinary free catecholamines and metabolites. Ann. Clin. Biochem. 2007, 44, 364–368. [Google Scholar] [CrossRef]
- Bouatra, S.; Aziat, F.; Mandal, R.; Guo, A.C.; Wilson, M.R.; Knox, C.; Bjorndahl, T.C.; Krishnamurthy, R.; Saleem, F.; Liu, P.; et al. The human urine metabolome. PLoS One 2013, 8, e73076. [Google Scholar] [CrossRef]
© 2014 by the authors; licensee MDPI, Basel, Switzerland. This article is an open access article distributed under the terms and conditions of the Creative Commons Attribution license (http://creativecommons.org/licenses/by/3.0/).
Share and Cite
Silva, C.; Cavaco, C.; Perestrelo, R.; Pereira, J.; Câmara, J.S. Microextraction by Packed Sorbent (MEPS) and Solid-Phase Microextraction (SPME) as Sample Preparation Procedures for the Metabolomic Profiling of Urine. Metabolites 2014, 4, 71-97. https://doi.org/10.3390/metabo4010071
Silva C, Cavaco C, Perestrelo R, Pereira J, Câmara JS. Microextraction by Packed Sorbent (MEPS) and Solid-Phase Microextraction (SPME) as Sample Preparation Procedures for the Metabolomic Profiling of Urine. Metabolites. 2014; 4(1):71-97. https://doi.org/10.3390/metabo4010071
Chicago/Turabian StyleSilva, Catarina, Carina Cavaco, Rosa Perestrelo, Jorge Pereira, and José S. Câmara. 2014. "Microextraction by Packed Sorbent (MEPS) and Solid-Phase Microextraction (SPME) as Sample Preparation Procedures for the Metabolomic Profiling of Urine" Metabolites 4, no. 1: 71-97. https://doi.org/10.3390/metabo4010071