Short-Term Intra-Subject Variation in Exhaled Volatile Organic Compounds (VOCs) in COPD Patients and Healthy Controls and Its Effect on Disease Classification

Abstract
:1. Introduction
- (1)
- The relationship between blood and breath VOCAccurate sampling is often based on the assumption of partial pressures of VOCs in the alveolar regions in the lung being in equilibrium with the bloodstream. However, the presence of lung disease itself will affect the delivery of breath to the sampler. Chronic obstructive and interstitiallung disease impairs pulmonary gas exchange leading to wasted ventilation (alveolar dead space) and wasted perfusion (venous admixture) and hence the composition of chemicals differs in the sample. Any co-morbidities affecting cardiovascular, hepatic or renal systems will alter how the body generates, metabolizes and excretes chemicals in the body that contribute to breath VOCs. Moreover, changes in even healthy metabolism can occur over the short term [10,11,12].
- (2)
- Ability to deliver a breath sampleThe presence of lung disease will itself affect the ability of the subject to deliver breath to the sampler in a reliable and controlled fashion; particularly from the alveolar part of the lung. Another potential source of variation is the subjective element of the sampling, with a dependence on the effort and individual makes to exhale into the sampler [13].
- (3)
- Response to exertionVOC expression varies in response to any exertion (e.g., compensatory increases in heart rate or ventilation: perfusion matching) [14]. This is likely to be different for healthy and diseased states. Subtle changes in lung function and breathing patterns prior to testing may affect VOC expression, whether these are endogenous or exogenous in origin [15]. The act of giving a breath sample may itself cause changes in subsequent samples.
2. Experimental Section
2.1. Subjects

| Variable (Mean ± SD) | COPD (n = 118) | Controls (n = 63) | |
|---|---|---|---|
| Age (years) | 67.0 ± 8.4 | 67.4 ± 9.7 | |
| Male | 61% | 47% | |
| Smoking Status | -never | 0 | 39 |
| -ex | 78 | 18 | |
| -current | 40 | 6 | |
| Body Mass Index (kg/m2) | 25.6 ± 4.5 | 27.0 ± 4.4 | |
| Predicted % FEV1 | 49.6 ± 18 | 98 ± 16 | |
| Oxygen saturation % | 95.0 ± 2.4 | 95.8 ± 2.3 | |
2.2. Breath Sampling Procedure
2.3. Data Normalization
2.4. Analysis of Intra Subject Variability in VOC Levels
2.5. Classification into COPD and Control Groups Using Machine Learning Methods
- (1)
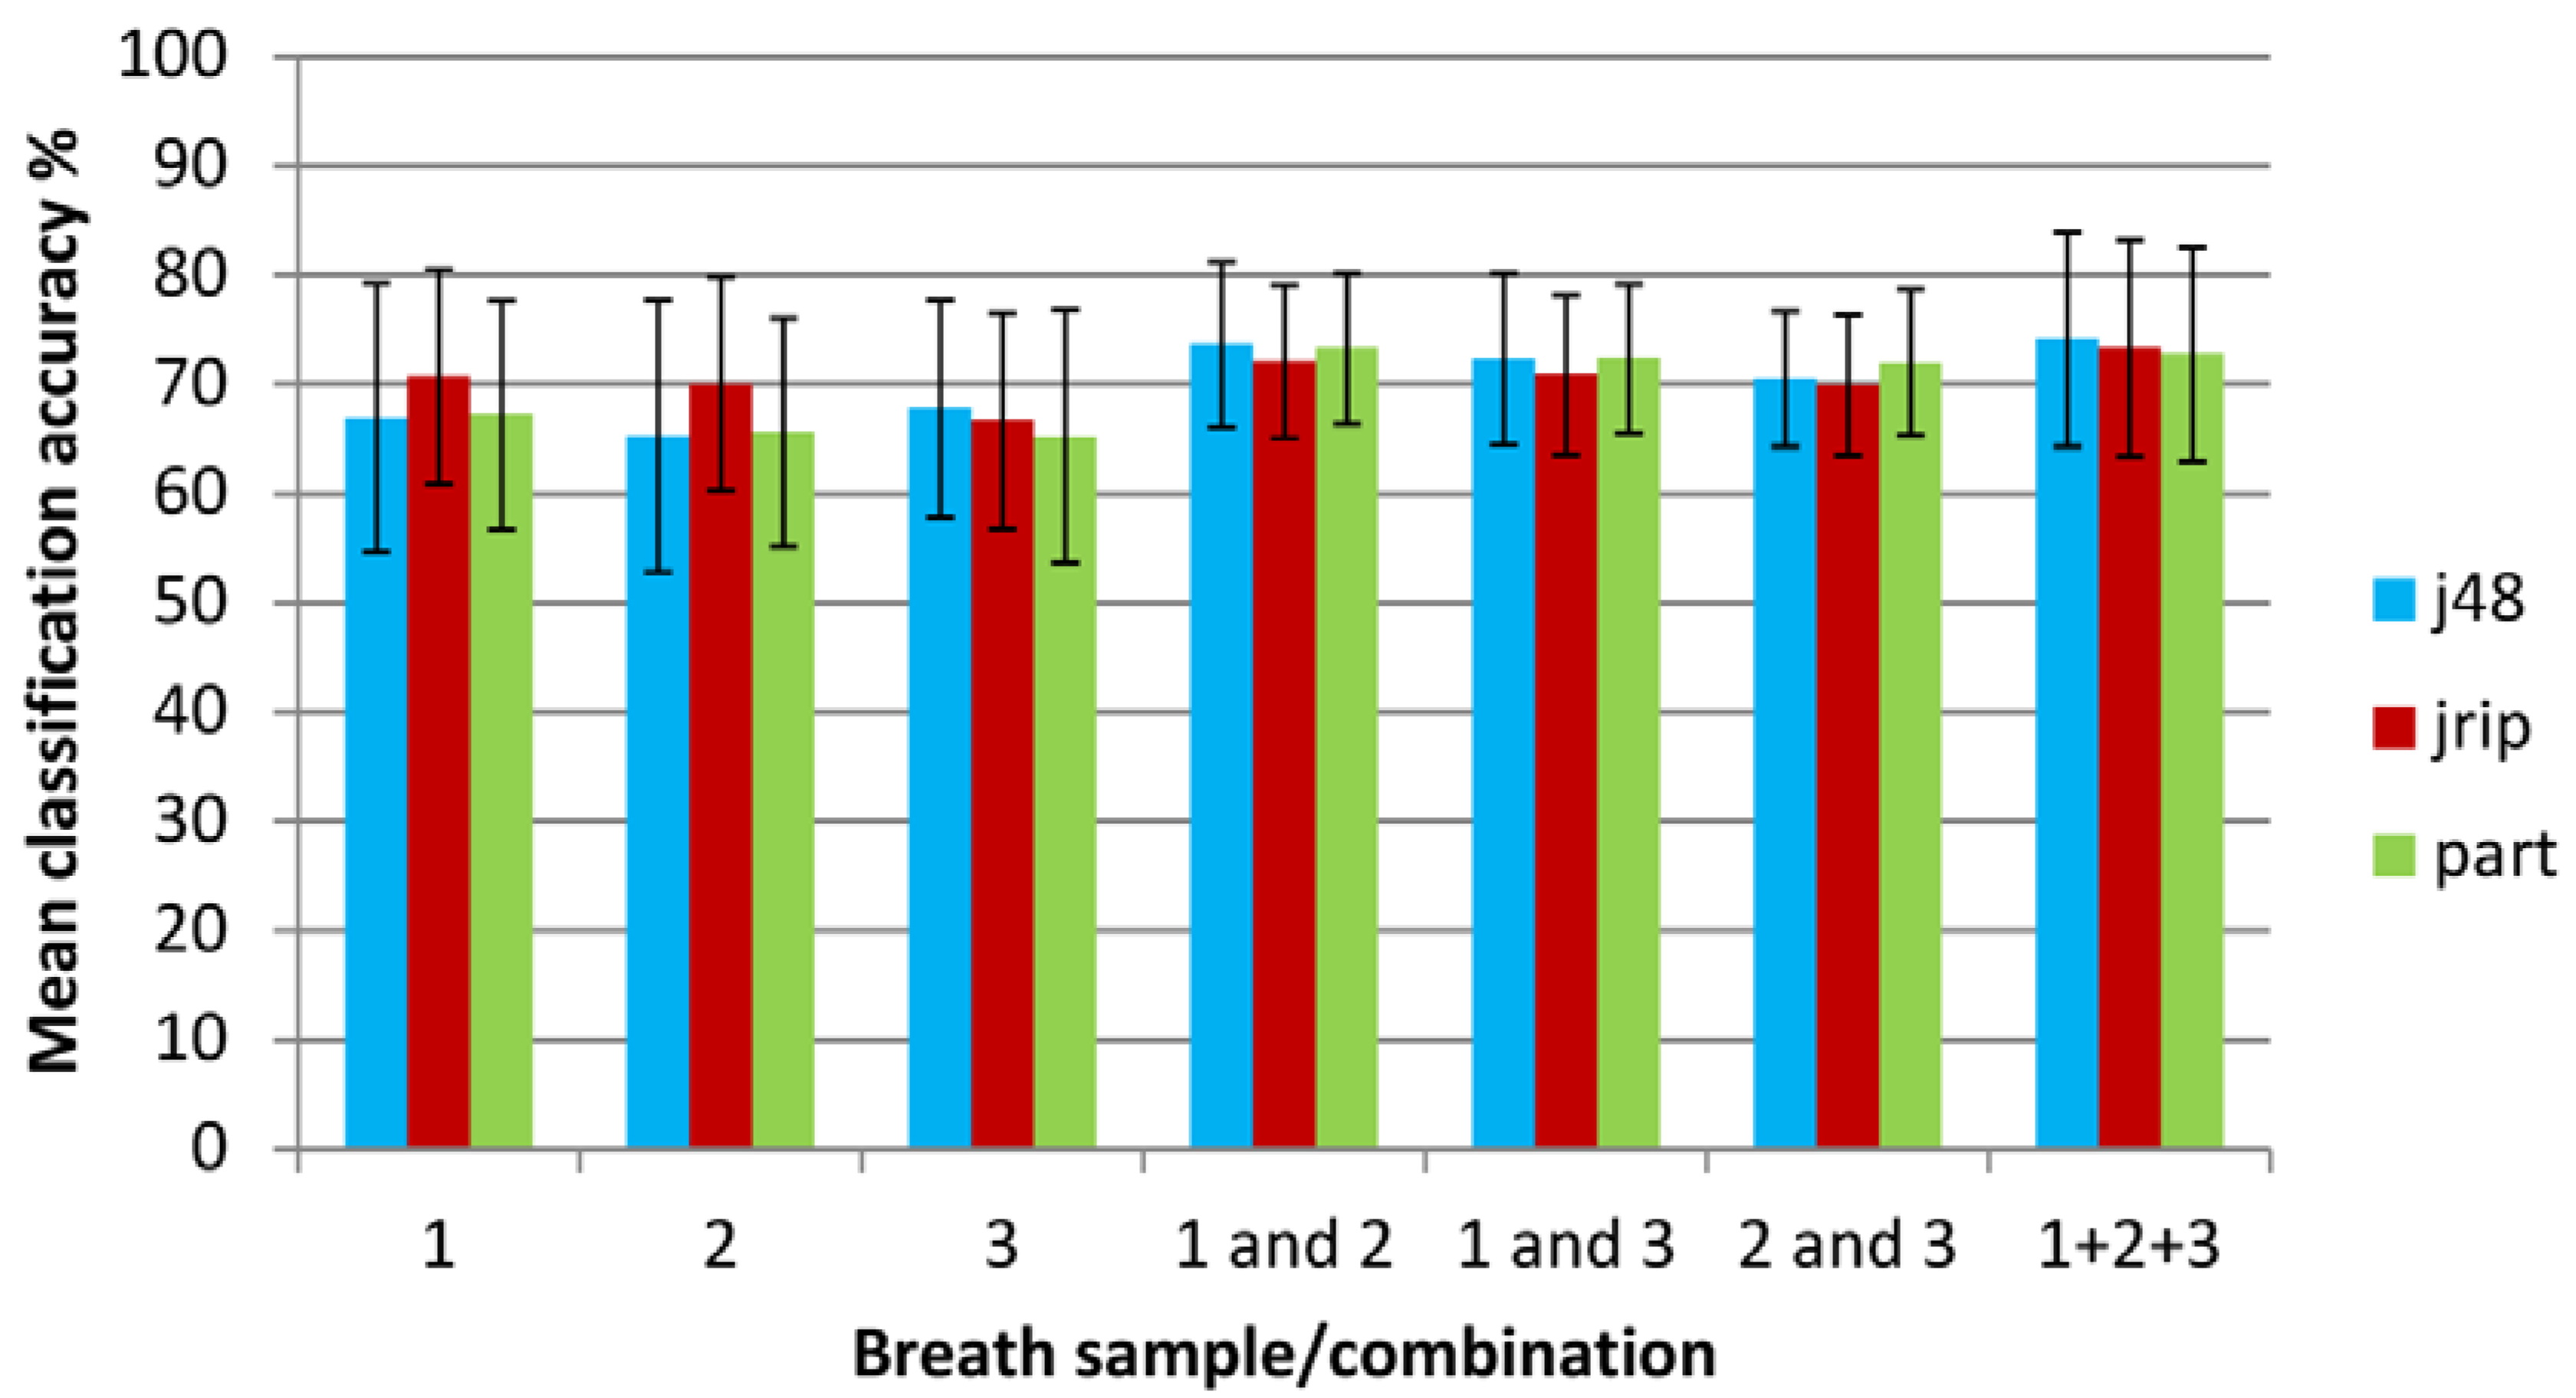
- The individual breath samples (1, 2 and 3) were analyzed in isolation for their ability to discriminate COPD from healthy status. That is, all breath 1 samples from COPD and controls were combined into a single dataset prior to analysis. The same procedure was implemented for breath 2 and for breath 3.
- (2)
- Combinations of subsets of data were formed (breath samples 1 and 2, 1 and 3, and 2 and 3) were combined into three different datasets respectively. This means that only the data objects (samples) for the respective breaths were included, with each dataset containing 364 (182 + 182) data objects. Note that data objects relating to the same subject were not allowed to appear simultaneously during the training and testing phases of the cross-validation.
- (3)
- Breaths for each subject were summed to form single data sets for the subject and analyzed for their ability to discriminate (Summing all breaths was found, in preliminary studies, to be the most robust method for aggregating data, with consistency across a large range of classifiers. Other methods trialed included mean, maxima and minima, and ordered weighted aggregation (OWA) [22], which are shown in the supplementary data file. Note that no subjective or a-priori domain information was used in any of the aggregation processes).
3. Results and Discussion
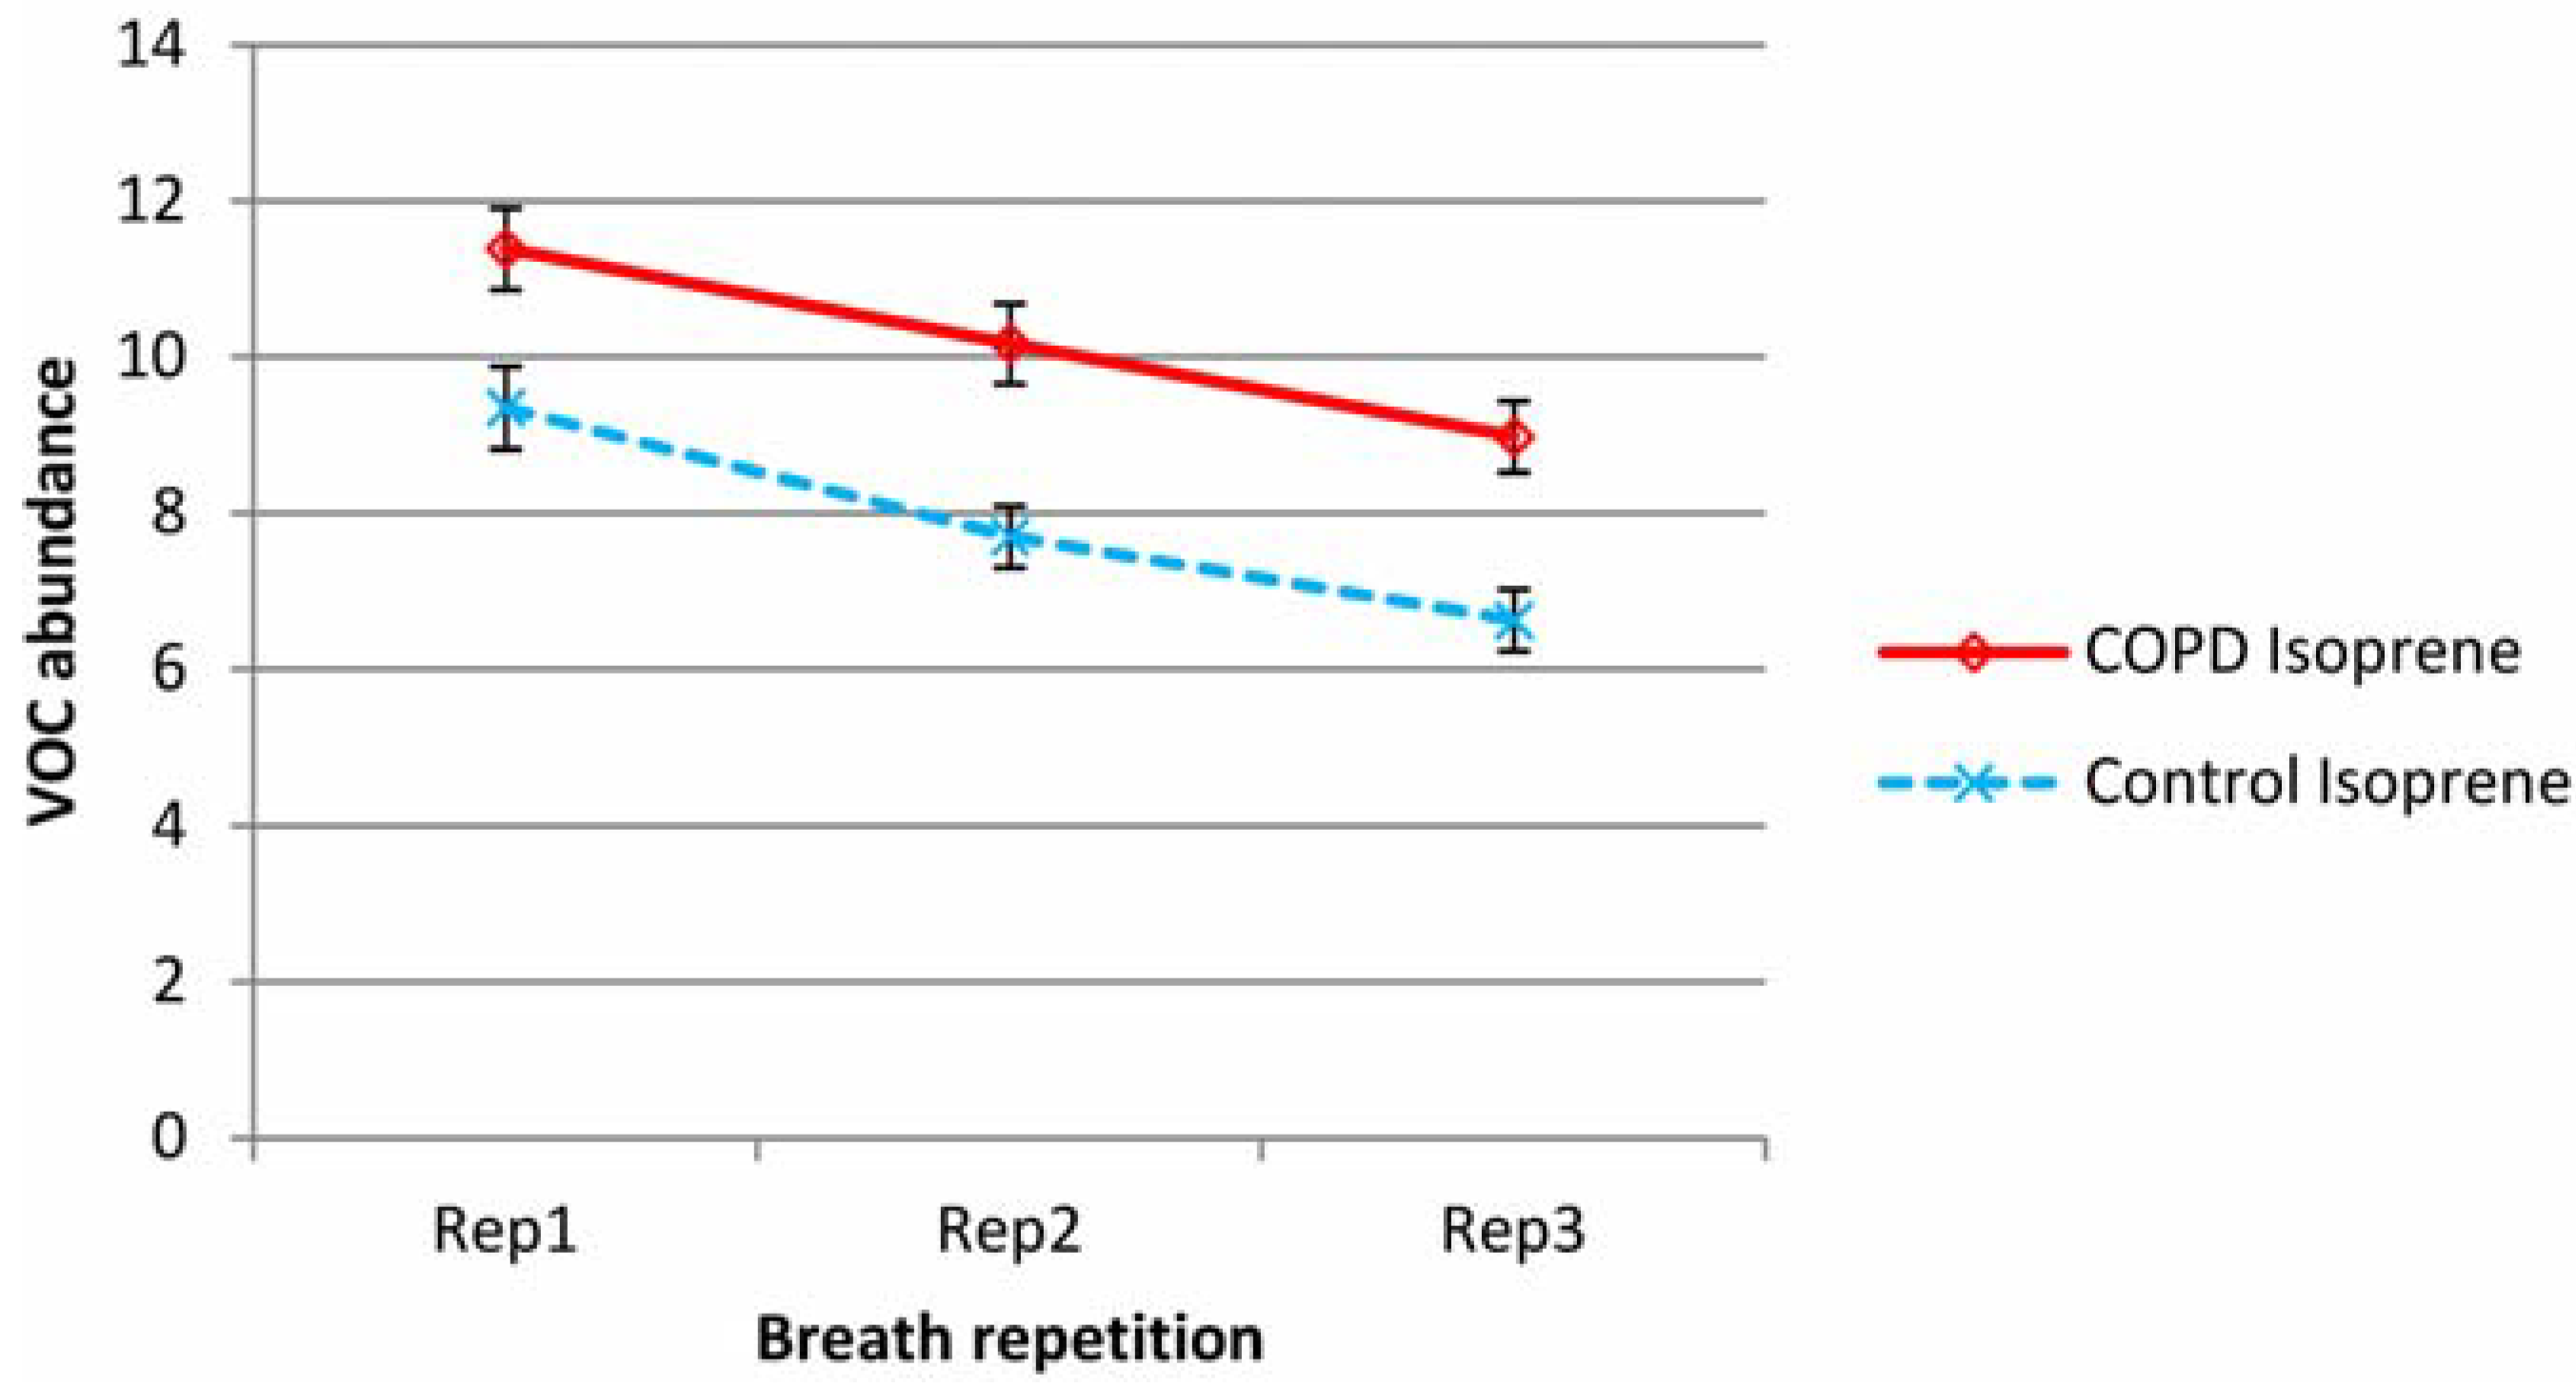
3.1. Variation between Breaths 1, 2 and 3


| VOC | COPD | Control | |||
|---|---|---|---|---|---|
| 2/1 | 3/1 | 2/1 | 3/1 | ||
| Median | Isoprene | 0.930 | 0.750 | 0.755 | 0.678 |
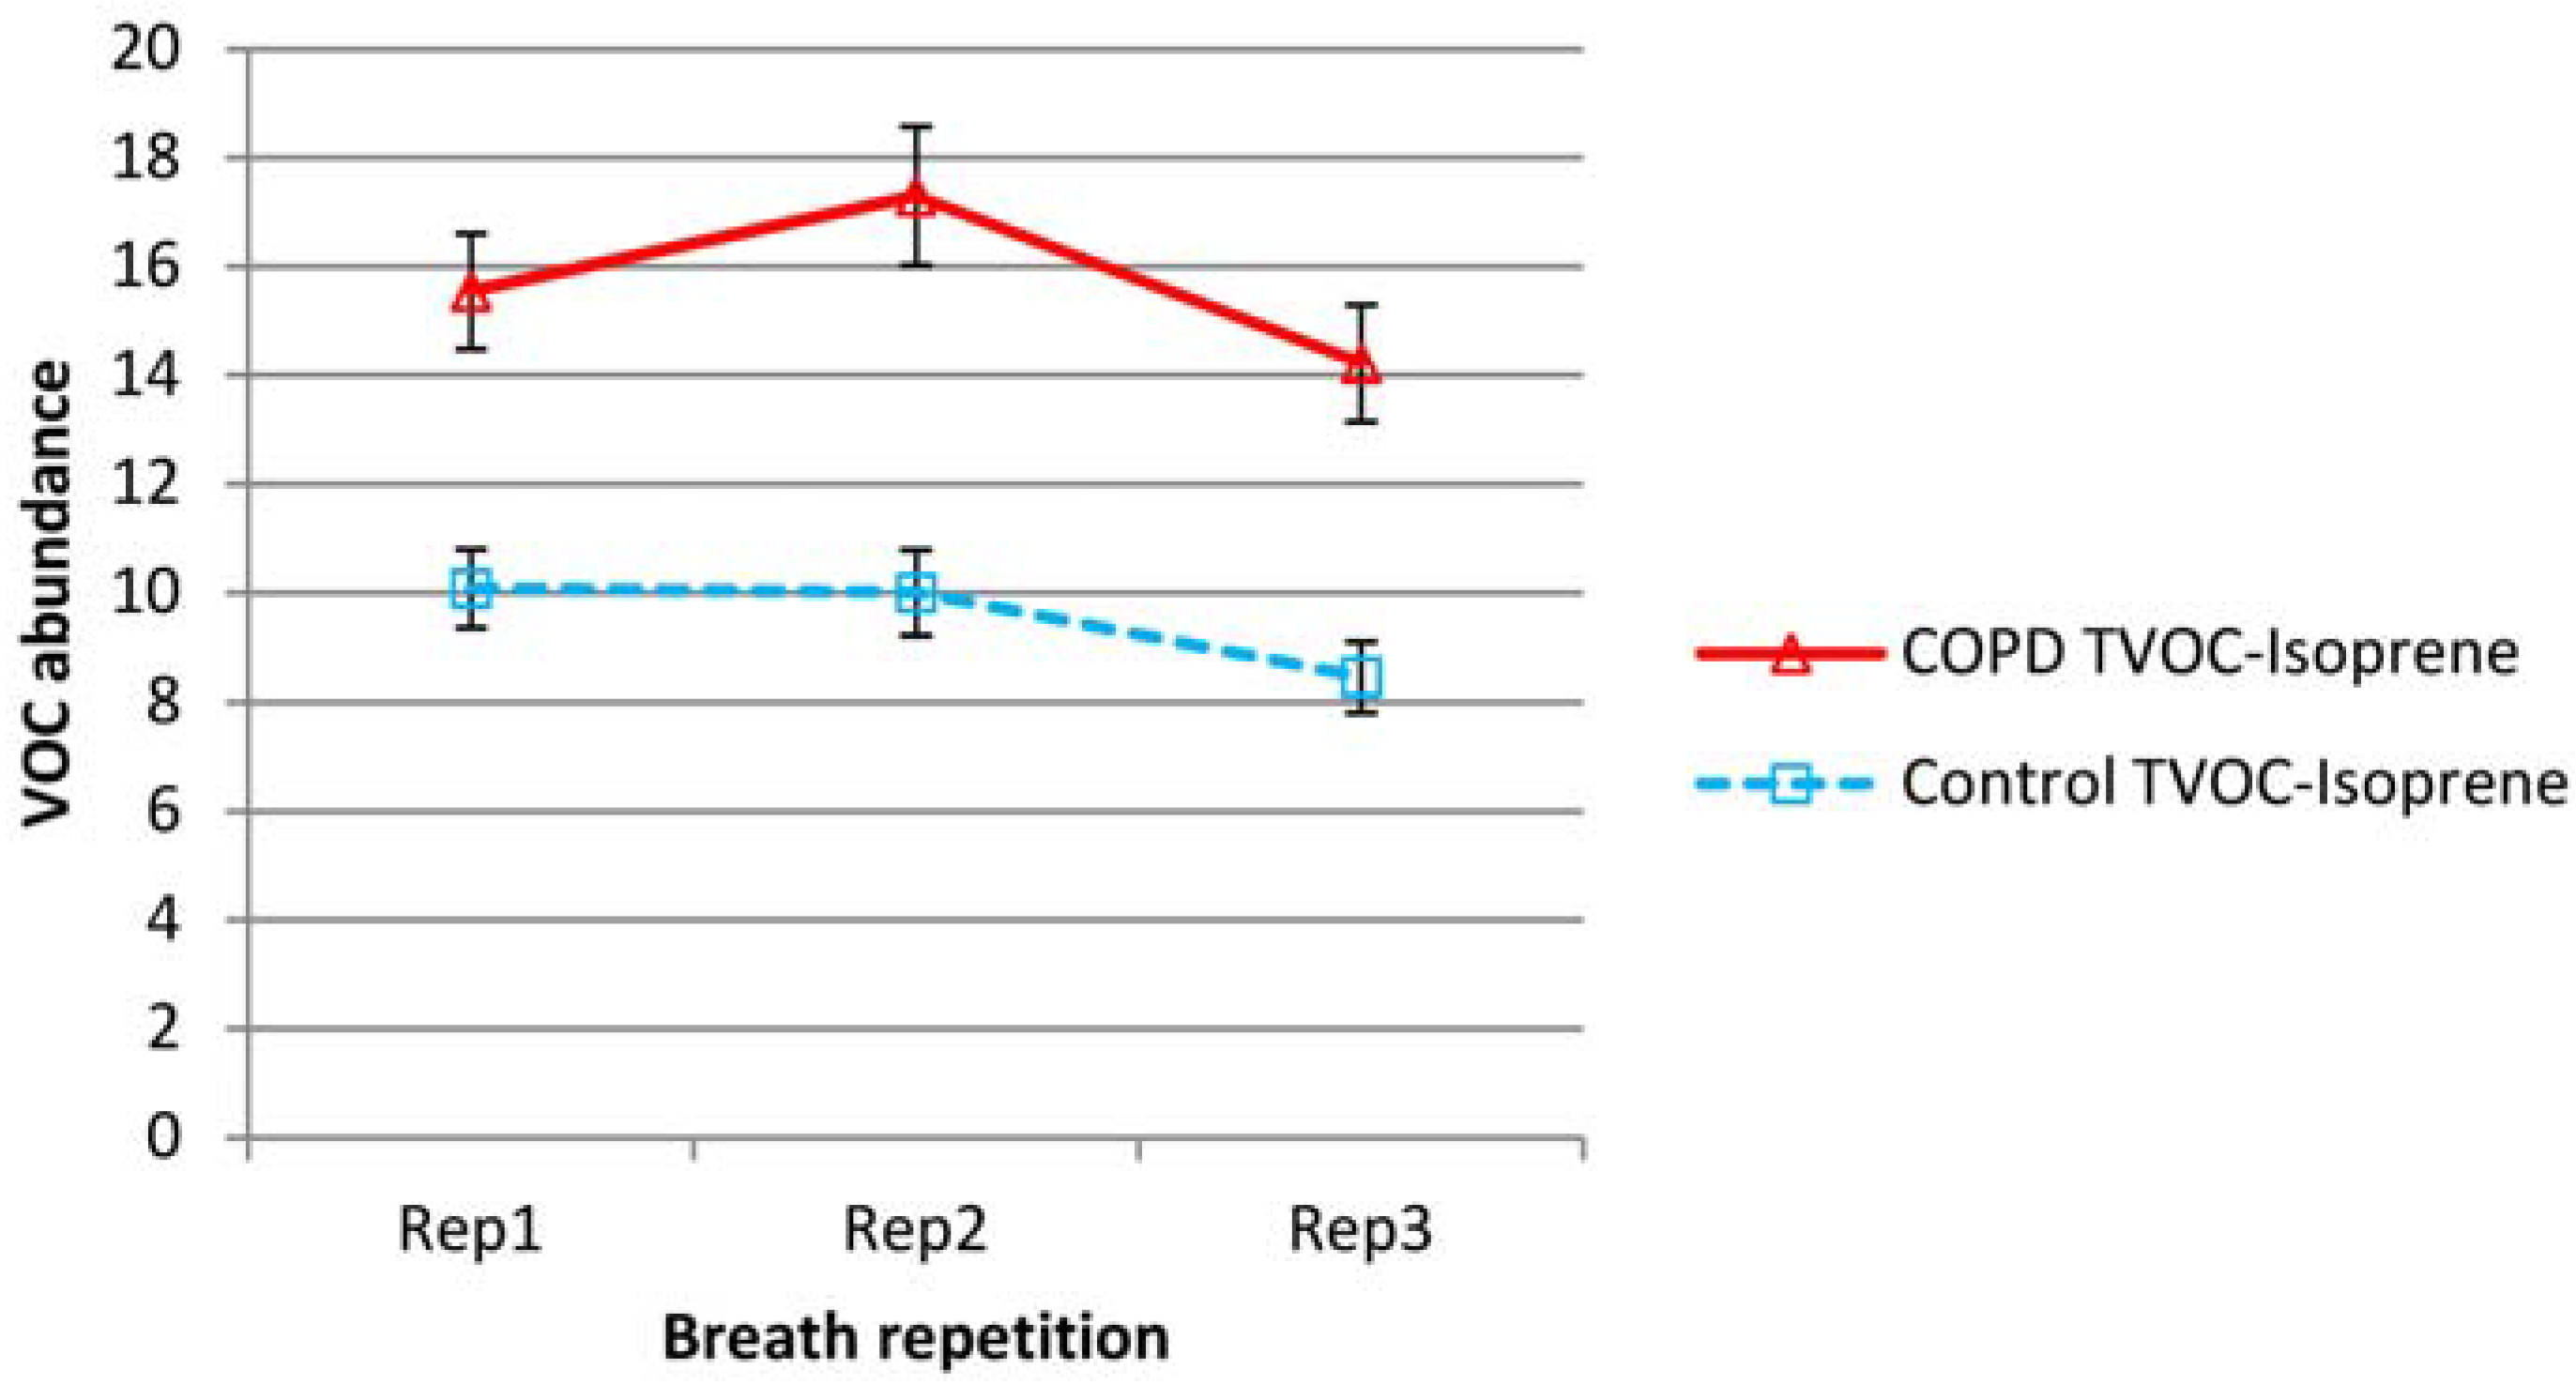
| Total-isoprene | 1.143 | 0.936 | 1.196 | 0.705 | |
| Benzene | 1.071 | 1.061 | 0.982 | 1.002 | |
| Toluene | 1.067 | 1.027 | 0.979 | 0.992 | |
| Benzaldehyde | 1.151 | 1.036 | 1.036 | 0.978 | |
| Hexanal | 0.973 | 0.843 | 0.967 | 0.860 | |
| Nonadecane | 0.995 | 0.980 | 1.013 | 0.989 | |
| Geometric mean | Isoprene | 0.901 | 0.752 | 0.781 | 0.641 |
| Total-isoprene | 1.093 | 0.933 | 1.043 | 0.836 | |
| Benzene | 1.124 | 1.058 | 0.979 | 1.006 | |
| Toluene | 1.080 | 1.023 | 0.961 | 0.978 | |
| Benzaldehyde | 1.153 | 0.983 | 0.950 | 0.969 | |
| Hexanal | 1.036 | 0.929 | 0.962 | 0.827 | |
| Nonadecane | 1.002 | 0.975 | 0.956 | 0.897 | |
| CV% | Isoprene | 23 | 26 | ||
| Total-isoprene | 40 | 40 | |||
| Benzene | 21 | 23 | |||
| Toluene | 18 | 18 | |||
| Benzaldehyde | 26 | 24 | |||
| Hexanal | 21 | 21 | |||
| Nonadecane | 28 | 27 | |||
3.2. Classification of Subjects into COPD and Healthy States Using Machine Learning Methods

| Classifier | 1 only | 2 only | 3 only | 1 and 2 | 1 and 3 | 2 and 3 | 1 + 2 + 3 | ||||
|---|---|---|---|---|---|---|---|---|---|---|---|
| Overall classification accuracy % (standard deviation) | |||||||||||
| J48 | 66.91(12.30) | 65.28(12.45) | 67.75(9.98) | 73.66(7.52) | 72.30(7.88) | 70.46(6.17) | 74.13(9.84) | ||||
| JRIP | 70.69(9.85) | 69.99(9.76) | 66.64(9.88) | 72.11(6.99) | 70.85(7.29) | 69.93(6.44) | 73.28(9.93) | ||||
| PART | 67.18(10.47) | 65.58(10.49) | 65.24(11.55) | 73.28(6.90) | 72.38(6.78) | 72.01(6.66) | 72.74(9.80) | ||||
| Mean | 68.26 | 66.95 | 66.54 | 73.02 | 71.84 | 70.80 | 73.38 | ||||
| Area under the ROC curve | |||||||||||
| J48 | 0.67(0.14) | 0.65(0.14) | 0.66(0.13) | 0.72(0.10) | 0.72(0.10) | 0.69(0.09) | 0.65(0.15) | ||||
| JRIP | 0.66(0.12) | 0.65(0.11) | 0.63(0.11) | 0.69(0.09) | 0.68(0.09) | 0.65(0.08) | 0.70(0.12) | ||||
| PART | 0.67(0.14) | 0.61(0.12) | 0.63(0.14) | 0.73(0.09) | 0.70(0.10) | 0.71(0.08) | 0.65(0.16) | ||||
| Mean | 0.67 | 0.64 | 0.64 | 0.71 | 0.70 | 0.68 | 0.67 | ||||
| Proportion of correct predictions for COPD subjects (standard deviation) | |||||||||||
| J48 | 0.71(0.15) | 0.69(0.16) | 0.75(0.14) | 0.80(0.08) | 0.79(0.09) | 0.78(0.08) | 0.69(0.19) | ||||
| JRIP | 0.81(0.12) | 0.81(0.12) | 0.76(0.16) | 0.81(0.09) | 0.79(0.09) | 0.81(0.10) | 0.75(0.15) | ||||
| PART | 0.73(0.14) | 0.73(0.14) | 0.73(0.14) | 0.79(0.08) | 0.80(0.09) | 0.80(0.09) | 0.66(0.19) | ||||
| Mean | 0.75 | 0.74 | 0.75 | 0.80 | 0.79 | 0.80 | 0.70 | ||||
| Proportion of correct predictions for Control subjects (standard deviation) | |||||||||||
| J48 | 0.58(0.22) | 0.58(0.21) | 0.54(0.20) | 0.62(0.15) | 0.59(0.15) | 0.55(0.12) | 0.59(0.22) | ||||
| JRIP | 0.51(0.22) | 0.48(0.19) | 0.50(0.25) | 0.56(0.19) | 0.55(0.17) | 0.50(0.18) | 0.64(0.21) | ||||
| PART | 0.57(0.19) | 0.52(0.21) | 0.51(0.21) | 0.63(0.15) | 0.58(0.14) | 0.57(0.14) | 0.62(0.23) | ||||
| Mean | 0.55 | 0.52 | 0.52 | 0.60 | 0.57 | 0.54 | 0.62 | ||||
3.3. Discussion
3.3.1. Variation in Isoprene
3.3.2. Variation in Total and Other VOCs
3.3.3. Relative Ability of Breath Repetitions to Discriminate COPD and Healthy States
3.3.4. Implications
3.3.5. Improvements to Current Techniques
4. Conclusions
Supplementary Files
Acknowledgments
Author Contributions
Conflicts of Interest
References
- Phillips, M.; Gleeson, K.; Hughes, J.M.B.; Greenberg, J.; Cataneo, R.N.; Baker, L.; McVay, W.P. Volatile organic compounds in breath as markers of lung cancer: A cross-sectional study. Lancet 1999, 353, 1930–1933. [Google Scholar] [CrossRef]
- Poli, D.; Carbognani, P.; Corradi, M.; Goldoni, M.; Acampa, O.; Balbi, B.; Bianchi, L.; Mutti, A. Exhaled volatile organic compounds in patients with non-small cell lung cancer: Cross sectional and nested short-term follow-up study. Respir. Res. 2005, 6, 71. [Google Scholar] [CrossRef] [Green Version]
- Bajtarevic, A.; Ager, C.; Pienz, M.; Klieber, M.; Schwarz, K.; Ligor, M.; Ligor, T.; Filipiak, W.; Denz, H.; Fiegl, M.; et al. Noninvasive detection of lung cancer by analysis of exhaled breath. BMC Cancer 2009, 9, 348. [Google Scholar] [CrossRef]
- Westhoff, M.; Litterst, P.; Freitag, L.; Urfer, W.; Bader, S.; Baumbach, J.-I. Ion mobility spectrometry for the detection of volatile organic compounds in exhaled breath of patients with lung cancer: Results of a pilot study. Thorax 2009, 64, 744–748. [Google Scholar] [CrossRef]
- Barker, M.; Hengst, M.; Schmid, J.; Buers, H.-J.; Mittermaier, B.; Klemp, D.; Koppmann, R. Volatile organic compounds in the exhaled breath of young patients with cystic fibrosis. Eur. Respir. J. 2006, 27, 929–936. [Google Scholar]
- Phillips, M.; Cataneo, R.N.; Condos, R.; Ring Erickson, G.A.; Greenberg, J.; la Bombardi, V.; Munawar, M.I.; Tietje, O. Volatile biomarkers of pulmonary tuberculosis in the breath. Tuberculosis 2007, 87, 44–52. [Google Scholar] [CrossRef]
- Ibrahim, B.; Basanta, M.; Cadden, P.; Singh, D.; Douce, D.; Woodcock, A.; Fowler, S.J. Non-invasive phenotyping using exhaled volatile organic compounds in asthma. Thorax 2011, 66, 804–809. [Google Scholar] [CrossRef]
- Van Berkel, J.J.B.N.; Dallinga, J.W.; Möller, G.M.; Godschalk, R.W.L.; Moonen, E.J.; Wouters, E.F.M.; van Schooten, F.J. A profile of volatile organic compounds in breath discriminates COPD patients from controls. Respir. Med. 2010, 104, 557–563. [Google Scholar] [CrossRef]
- Fens, N.; Zwinderman, A.H.; van der Schee, M.P.; van der Schee, M.P.; de Nijs, S.M.; Dijkers, E.; Roldaan, A.C.; Cheung, D.; Bel, E.H.; Sterk, P.J. Exhaled breath profiling enables discrimination of chronic obstructive pulmonary disease and asthma. Am. J. Respir. Crit. Care Med. 2009, 180, 1076–1082. [Google Scholar] [CrossRef]
- Barrett, K.E.; Barman, S.M.; Boitano, S.; Brooks, H.L. Ganong’s Review of Medical Physiology, 24th ed.; McGraw Hill Professional: New York, NY, USA, 2012. [Google Scholar]
- Saure, E.W.; Eagan, T.M.L.; Jensen, R.L.; Voll-Aanerud, M.; Aukrust, P.; Bakke, P.S.; Hardie, J.A. Explained variance for blood gases in a population with COPD. Clin. Respir. J. 2012, 6, 72–80. [Google Scholar] [CrossRef]
- Nong, A.; Krishnan, K. Estimation of interindividual pharmacokinetic variability factor for inhaled volatile organic chemicals using a probability-bounds approach. Regul. Toxicol. Pharmacol. 2007, 48, 93–101. [Google Scholar] [CrossRef]
- Basanta, M.; Koimtzis, T.; Singh, D.; Wilson, I.; Thomas, C.L.P. An adaptive breath sampler for use with human subjects with an impaired respiratory function. Analyst 2007, 132, 153–163. [Google Scholar] [CrossRef]
- Wasserman, K.; Cox, T.A.; Sietsema, K.E. Ventilatory regulation of arterial H+ (pH) during exercise. Respir. Physiol. Neurobiol. 2014, 190, 142–148. [Google Scholar] [CrossRef]
- Phillips, M.; Herrera, J.; Krishnan, S.; Zain, M.; Greenberg, J.; Cataneo, R.N. Variation in volatile organic compounds in the breath of normal humans. J. Chromatogr. B 1999, 729, 75–88. [Google Scholar] [CrossRef]
- Phillips, C.O.; Syed, Y.; Mac Parthaláin, N.; Zwiggelaar, R.; Claypole, T.C.; Lewis, K.E. Machine learning methods on exhaled volatile organic compounds for distinguishing COPD patients from healthy controls. J. Breath Res. 2012, 6, 036003. [Google Scholar] [CrossRef]
- Global Initiative for Chronic Obstructive Lung Disease (GOLD). Global Strategy for the Diagnosis, Management and Prevention of COPD. Available online: http://www.goldcopd.org/ (accessed on 25 February 2014).
- De Gennaro, G.; Dragonieri, S.; Longobardi, F.; Musti, M.; Stallone, G.; Trizio, L.; Tutino, M. Chemical characterization of exhaled breath to differentiate between patients with malignant plueral mesothelioma from subjects with similar professional asbestos exposure. Anal. Bioanal. Chem. 2010, 398, 3043–3050. [Google Scholar] [CrossRef]
- Van Den Velde, S.; Quirynen, M.; van Hee, P.; van Steenberghe, D. Differences between Alveolar Air and Mouth Air. Anal. Chem. 2007, 79, 3425–3429. [Google Scholar] [CrossRef]
- Filipiak, W.; Ruzsanyi, V.; Mochalski, P.; Filipiak, A.; Bajtarevic, A.; Ager, C.; Denz, H.; Hilbe, W.; Jamnig, H.; Hackl, M.; Dzien, A.; Amann, A. Dependence of exhaled breath composition on exogenous factors, smoking habits and exposure to air pollutants. J. Breath Res. 2012, 6, 036008:1–036008:21. [Google Scholar]
- Van Berkel, J.J.B.N.; Dallinga, J.W.; Möller, G.M.; Godschalk, R.W.L.; Moonen, E.; Wouters, E.F.M.; van Schooten, F.J. Development of accurate classification method based on the analysis of volatile organic compounds from human exhaled air. J. Chromatogr. B Analyt. Technol. Biomed. Life Sci. 2008, 861, 101–107. [Google Scholar] [CrossRef]
- Xu, Z. Dependent OWA operators. In Proceedings of the Third international conference on Modeling Decisions for Artificial Intelligence (MDAI 2006), Tarragona, Spain, 3–5 April 2006; Torra, V., Narukawa, Y., Valls, A., Domingo-Ferrer, J., Eds.; Springer-Verlag: Berlin, Germany, 2006; pp. 172–178. [Google Scholar]
- Machine Learning Group at University of Waikato. Weka 3 Data Mining Software in Java. Available online: http://www.cs.waikato.ac.nz/ml/weka/ (accessed on 25 February 2014).
- Quinlan, J.R. C4.5: Programs for Machine Learning; The Morgan Kaufmann Series in Machine Learning; Morgan Kaufmann Publishers: San Mateo, CA, USA, 1993. [Google Scholar]
- Cohen, W.W. Fast Effective Rule Induction. In Proceedings of the 12th International Conference on Machine Learning, Tahoe City, California, CA, USA, 9–12 July 1995; pp. 115–123.
- Witten, I.H.; Frank, E. Generating Accurate Rule Sets Without Global Optimization. In Proceedings of the 15th International Conference on Machine Learning, Madison, WI, USA, 24–27 July 1998; Morgan Kaufmann Publishers: San Mateo, CA, USA; pp. 144–155.
- Webb, G.I.; Conilione, P. Estimating Bias and Variance from Data; Technical Report, School of Computer Science and Software Engineering, Monash University: Victoria, Australia, 2003. [Google Scholar]
- Deneris, E.S.; Stein, R.A.; Mead, J.F. In vitro biosynthesis of isoprene from mevalonate utilizing a rat liver cytosolic fraction. Biochem. Biophys. Res. Commun. 1984, 123, 691–696. [Google Scholar] [CrossRef]
- Karl, T.; Prazeller, P.; Mayr, D.; Jordan, A.; Rieder, J.; Fall, R.; Lindinger, W. Human breath isoprene and its relation to blood cholesterol levels: New measurements and modeling. J. Appl. Physiol. 2001, 91, 762–770. [Google Scholar]
- King, J.; Kupferthaler, A.; Unterkofler, K.; Koc, H.; Teschl, S.; Teschl, G.; Miekisch, W.; Schubert, J.; Hinterhuber, H.; Amann, A. Isoprene and acetone concentration profiles during exercise on an ergometer. J. Breath Res. 2009, 3, 027006. [Google Scholar] [CrossRef]
- King, J.; Mochalski, P.; Kupferthaler, A.; Unterkofler, K.; Koc, H.; Filipiak, W.; Teschl, S.; Hinterhuber, H.; Amann, A. Dynamic profiles of volatile organic compounds in exhaled breath as determined by a coupled PTR-MS/GC-MS study. Physiol. Meas. 2010, 31, 1169–1184. [Google Scholar] [CrossRef]
- Cailleux, A.; Allain, P. Isoprene and sleep. Life Sci. 1989, 44, 1877–1880. [Google Scholar] [CrossRef]
- Amann, A.; Poupart, G.; Telser, S.; Ledochowski, M.; Schmid, A.; Mechtcheriakov, S. Applications of breath gas analysis in medicine. Int. J. Mass Spectrom. 2004, 239, 227–233. [Google Scholar] [CrossRef]
- King, J.; Kupferthaler, A.; Frauscher, B.; Hackner, H.; Unterkofler, K.; Teschl, G.; Hinterhuber, H.; Amann, A.; Högl, B. Measurement of endogenous acetone and isoprene in exhaled breath during sleep. Physiol. Meas. 2012, 33, 413–428. [Google Scholar] [CrossRef]
- Jareno-Esteban, J.J.; Munoz-Lucas, M.A.; Carrillo-Aranda, B.; Maldonado-Sanz, J.A.; de Granda-Orive, I.; Aguilar-Ros, A.; Civera-Tejuca, C.; Gutierrez-Ortega, C.; Callol-Sanchez, L.M. Volatile Organic Compounds in Exhaled Breath in a Healthy Population: Effect of Tobacco Smoking. Arch. Bronconeumol. 2013, 49, 457–461. [Google Scholar]
- Fens, N.; de Nijs, S.B.; Peters, S.; Dekker, T.; Knobel, H.H.; Vink, T.J.; Willard, N.P.; Zwinderman, A.H.; Krouwels, F.; et al. Exhaled air molecular profiling in relation to inflammatory subtype and activity in COPD. Eur. Respir. J. 2011, 38, 1301–1309. [Google Scholar] [CrossRef]
- Miekisch, M.; Hengstenberg, A.; Kischkel, S.; Beckmann, U.; Mieth, M.; Schubert, J.K. Construction and evaluation of a versatile CO2 controlled breath collection device. IEEE Sens. J. 2010, 10, 211–215. [Google Scholar] [CrossRef]
© 2014 by the authors; licensee MDPI, Basel, Switzerland. This article is an open access article distributed under the terms and conditions of the Creative Commons Attribution license (http://creativecommons.org/licenses/by/3.0/).
Share and Cite
Phillips, C.; Mac Parthaláin, N.; Syed, Y.; Deganello, D.; Claypole, T.; Lewis, K. Short-Term Intra-Subject Variation in Exhaled Volatile Organic Compounds (VOCs) in COPD Patients and Healthy Controls and Its Effect on Disease Classification. Metabolites 2014, 4, 300-318. https://doi.org/10.3390/metabo4020300
Phillips C, Mac Parthaláin N, Syed Y, Deganello D, Claypole T, Lewis K. Short-Term Intra-Subject Variation in Exhaled Volatile Organic Compounds (VOCs) in COPD Patients and Healthy Controls and Its Effect on Disease Classification. Metabolites. 2014; 4(2):300-318. https://doi.org/10.3390/metabo4020300
Chicago/Turabian StylePhillips, Christopher, Neil Mac Parthaláin, Yasir Syed, Davide Deganello, Timothy Claypole, and Keir Lewis. 2014. "Short-Term Intra-Subject Variation in Exhaled Volatile Organic Compounds (VOCs) in COPD Patients and Healthy Controls and Its Effect on Disease Classification" Metabolites 4, no. 2: 300-318. https://doi.org/10.3390/metabo4020300