
Effects of Obesity on Pro-Oxidative Conditions and DNA Damage in Liver of DMBA-Induced Mammary Carcinogenesis Models

Abstract
:1. Introduction
2. Results
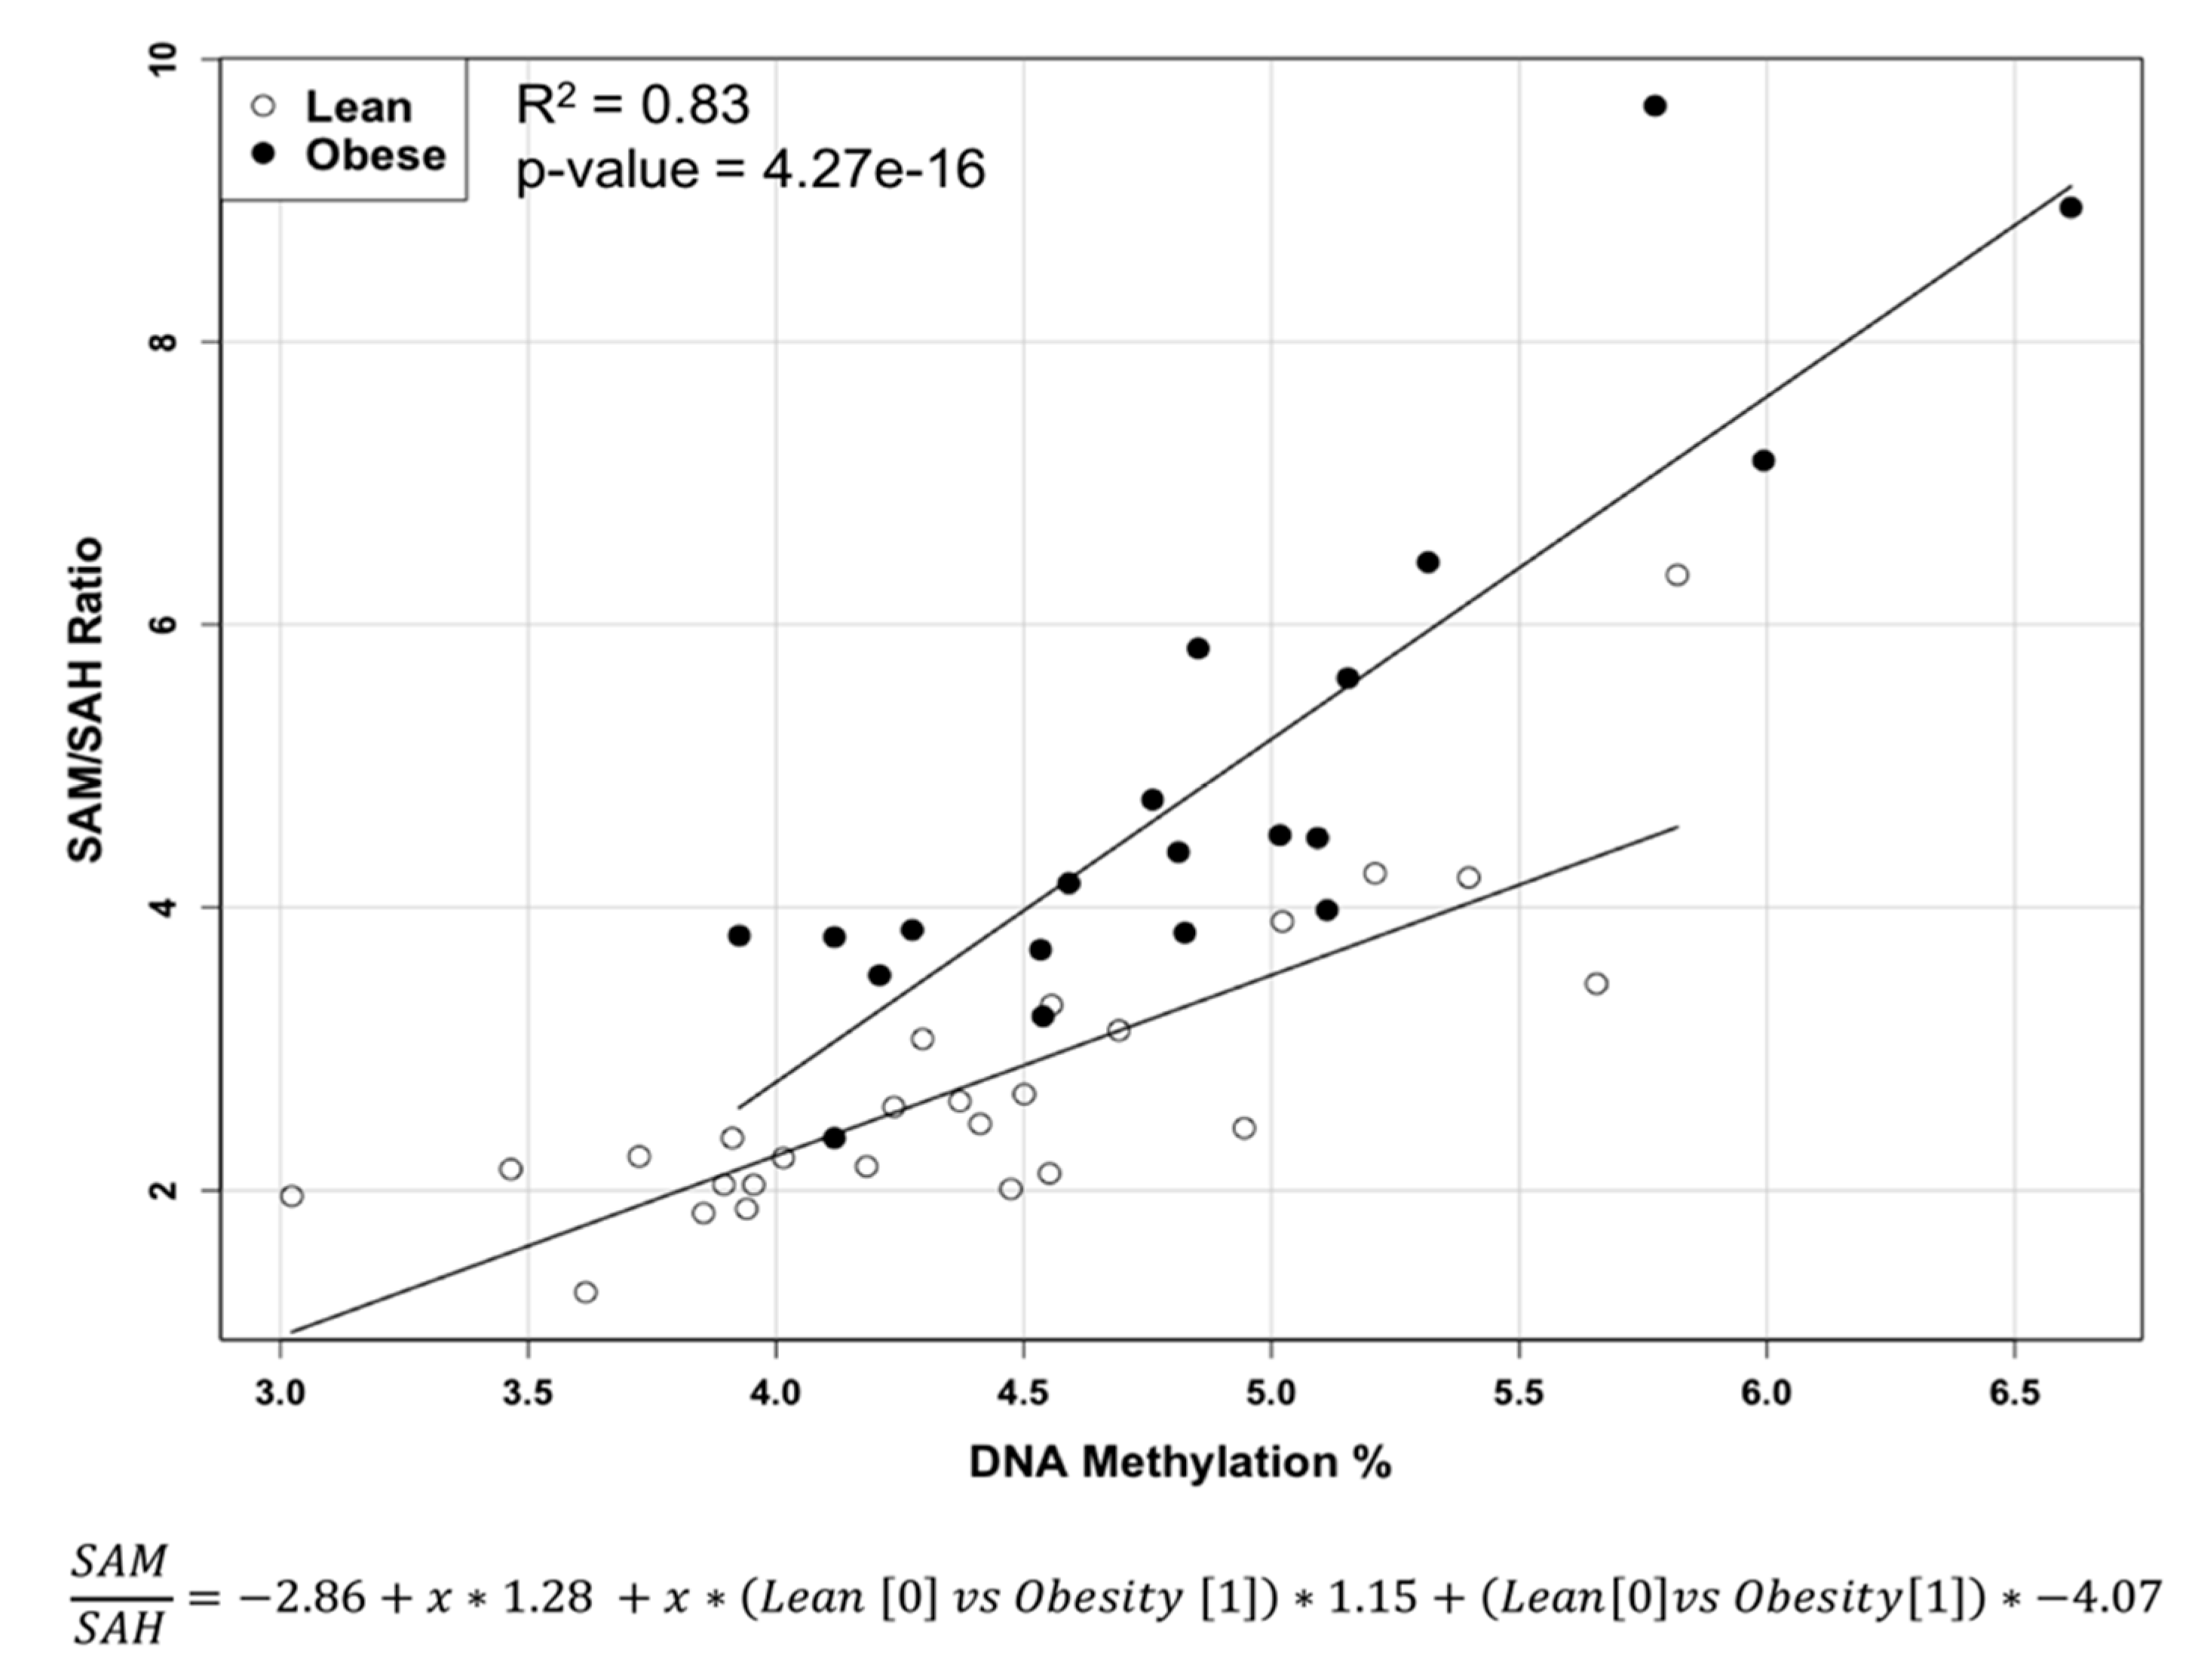
2.1. Methylation Circle Metabolites and Global DNA Methylation Level
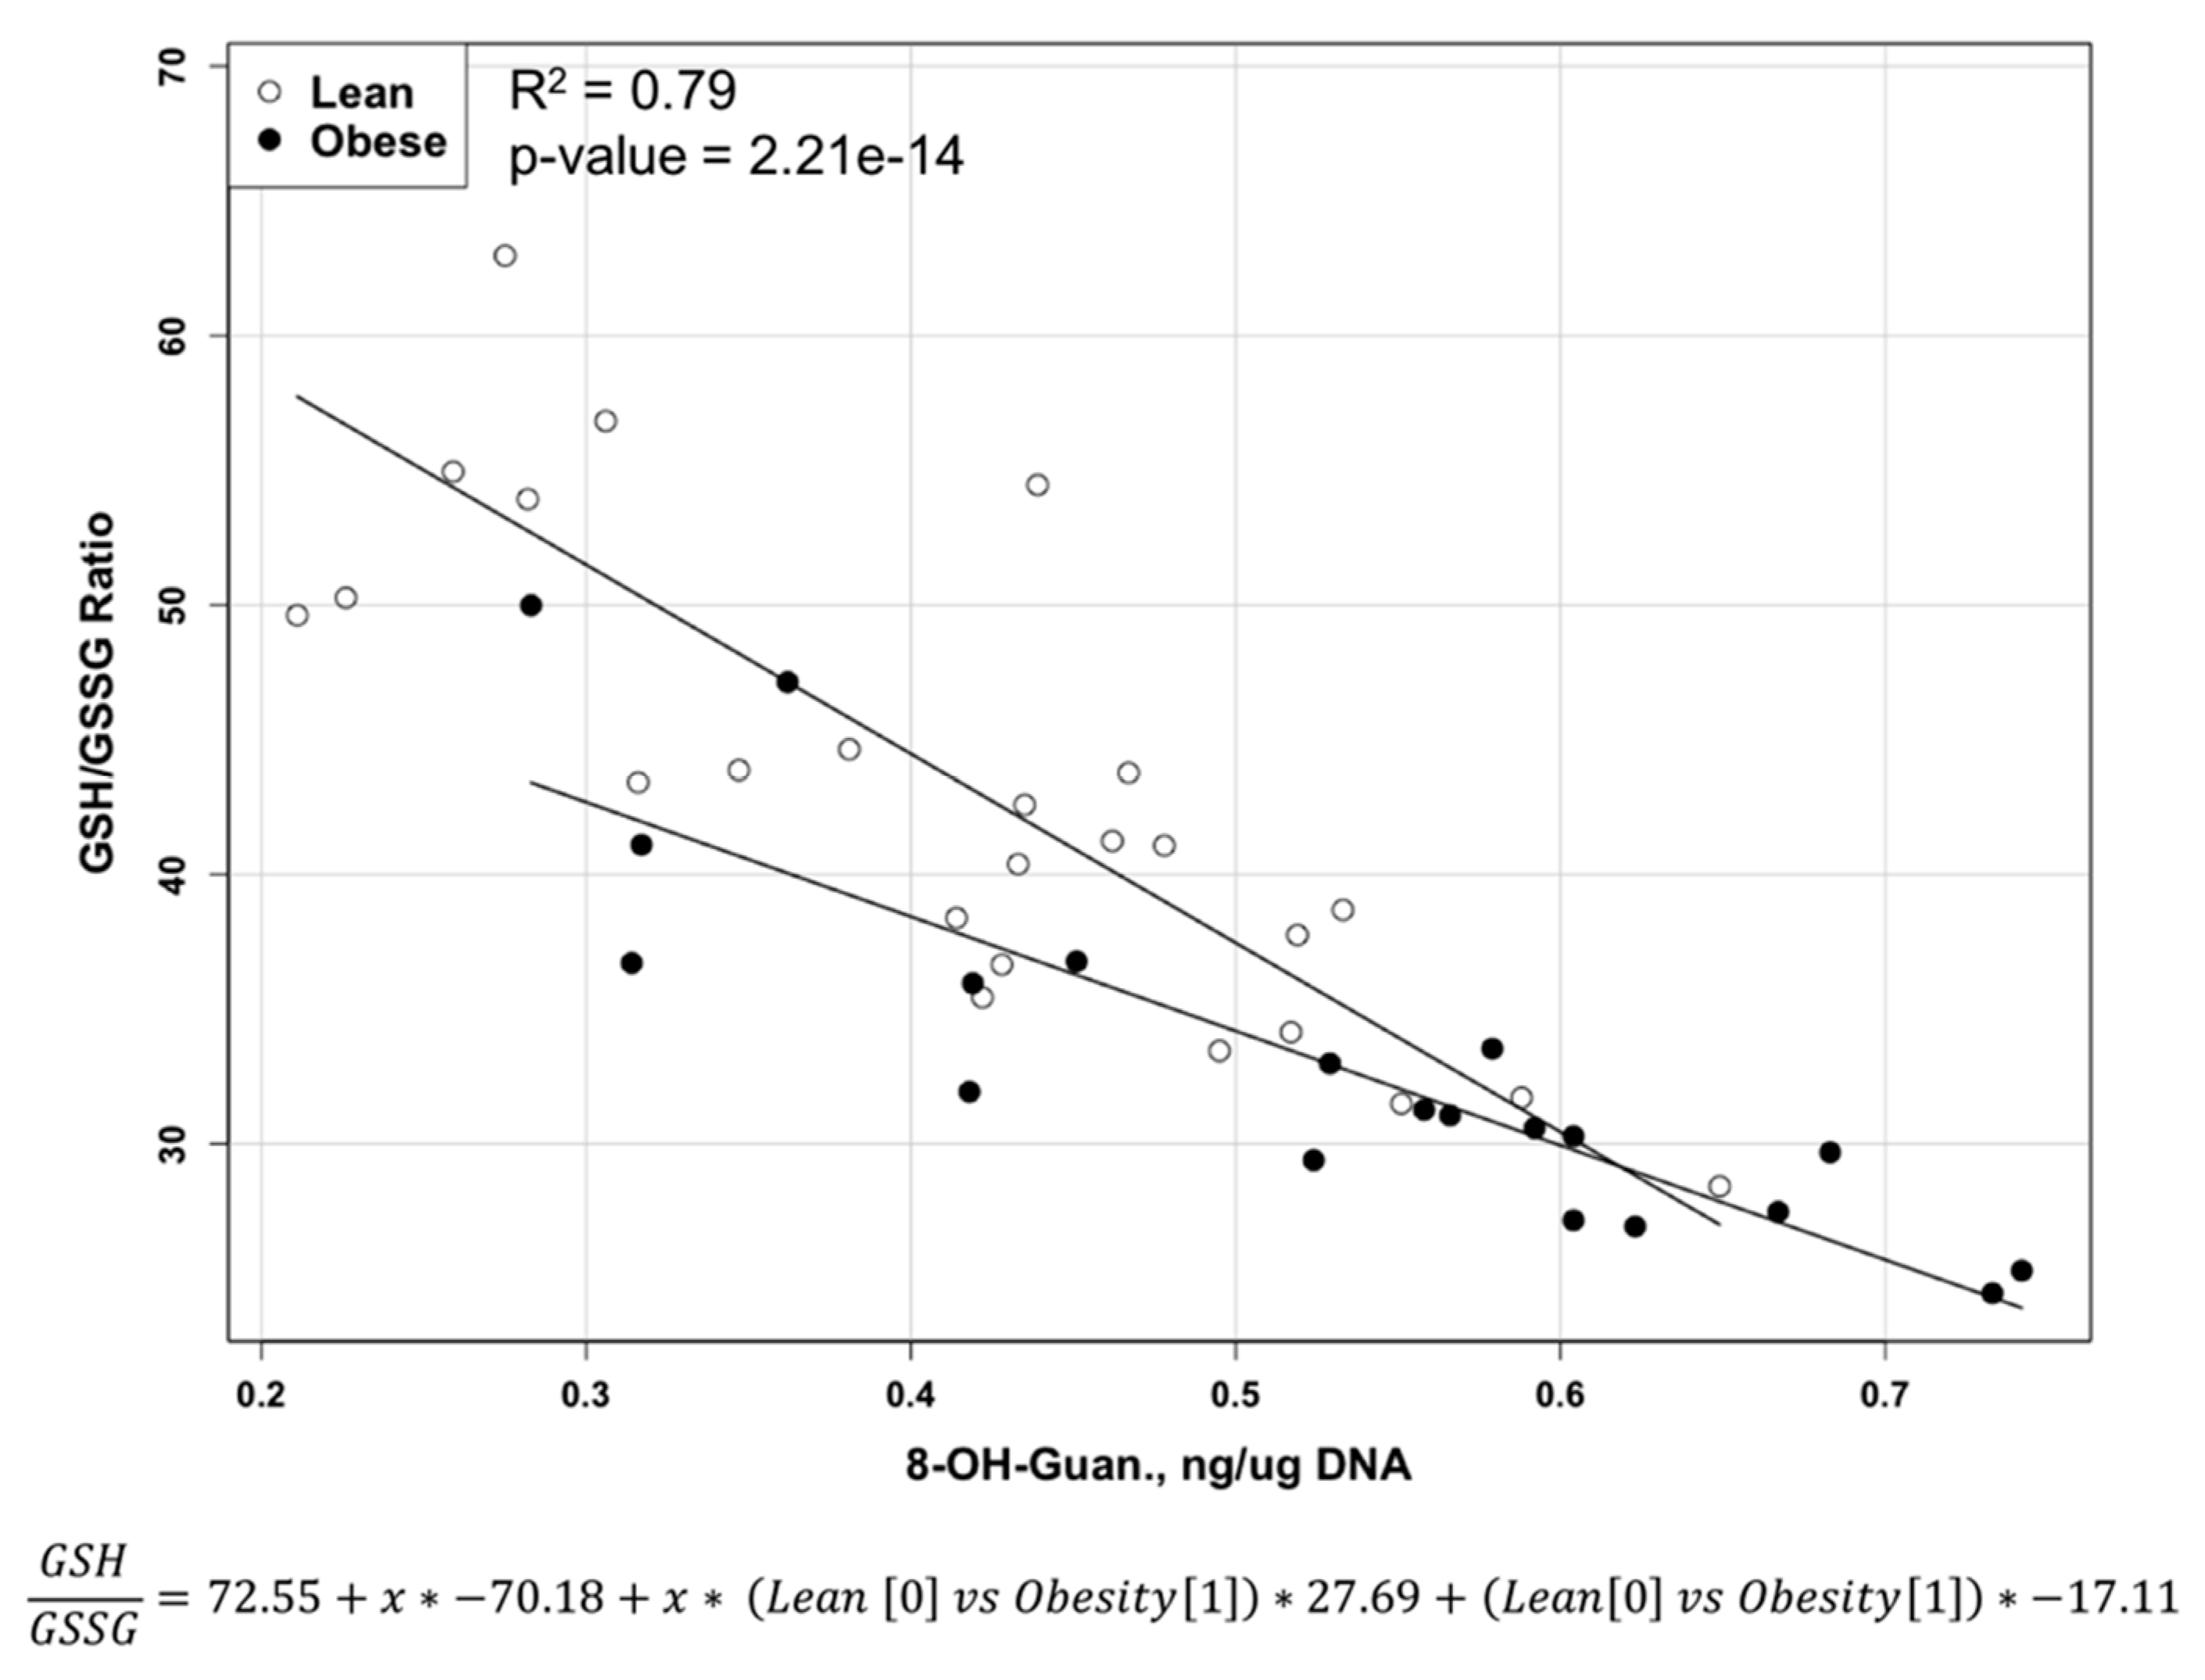
2.2. Reduced and Oxidized Glutathione, their Ratio, and Oxidative DNA Damage Level
2.3. S-Nitrosoglutathione and 3-Nitrotyrosine Level
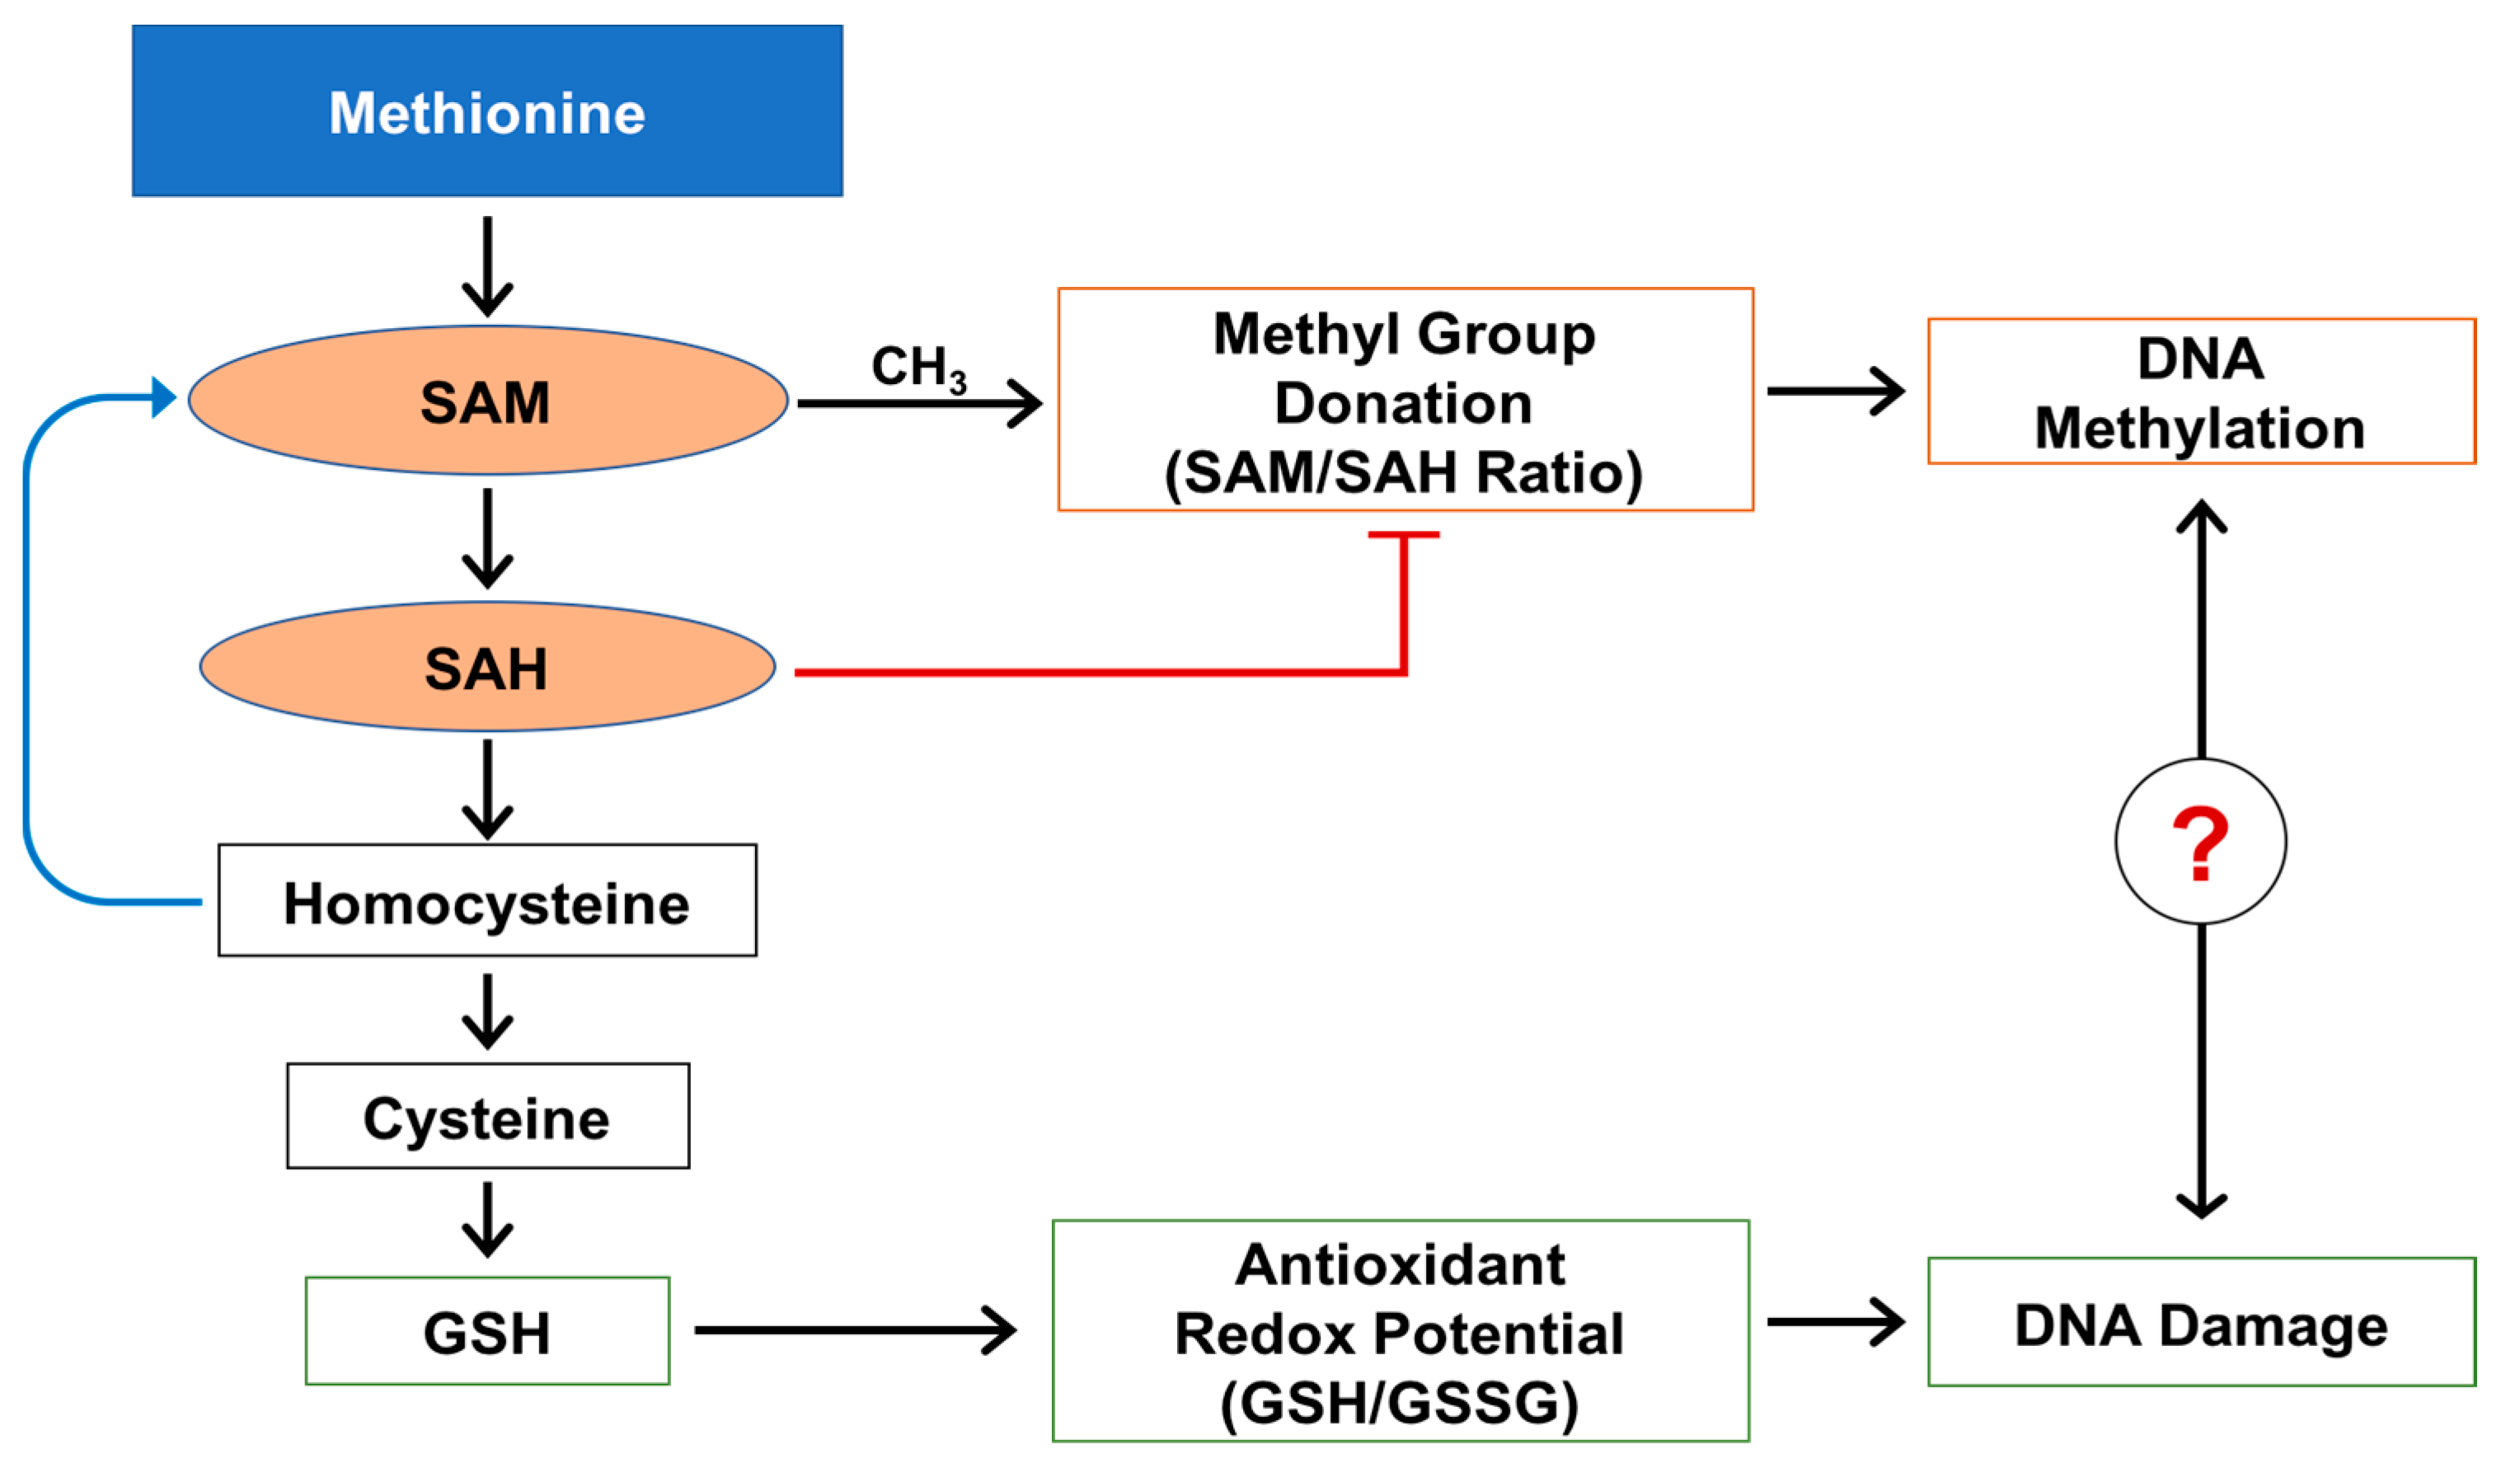
3. Discussion
4. Materials and Methods
- Experimental Design: The animal protocols were approved by the Institutional Animal Care and Use Committee and the Institutional Animal Care and Use Committee of the University of Arkansas for Medical Sciences. A total of 46 five-week-old female Zucker rats (20 obese fa/fa and 26 lean) were obtained from Harlan Industries (Indianapolis, IN, USA). Harlan Industries performed genotyping to identify fa/fa and lean/lean rats at the age of 24 days. Rats were housed 2 per cage with ad libitum access to water and semi-purified diet (AIN-93G diet, Harlan Teklad, Madison, WI, USA). At 50 days of age, all rats, as part of an experiment on the effects of obesity on mammary tumor development [43], received the carcinogen 7,12-dimethylbenz(α)anthracene (DMBA, Sigma Chemical Co., St. Louis, MO, USA) via gavage (65 mg DMBA/kg body weight in sesame oil). Rats were euthanized at approximately 155 days later. Livers were removed and weighed. The livers were snap-frozen in liquid nitrogen and stored at −80 °C until processing for analysis of the metabolic profile related to methionine cycle and oxidative and nitrosative stress.
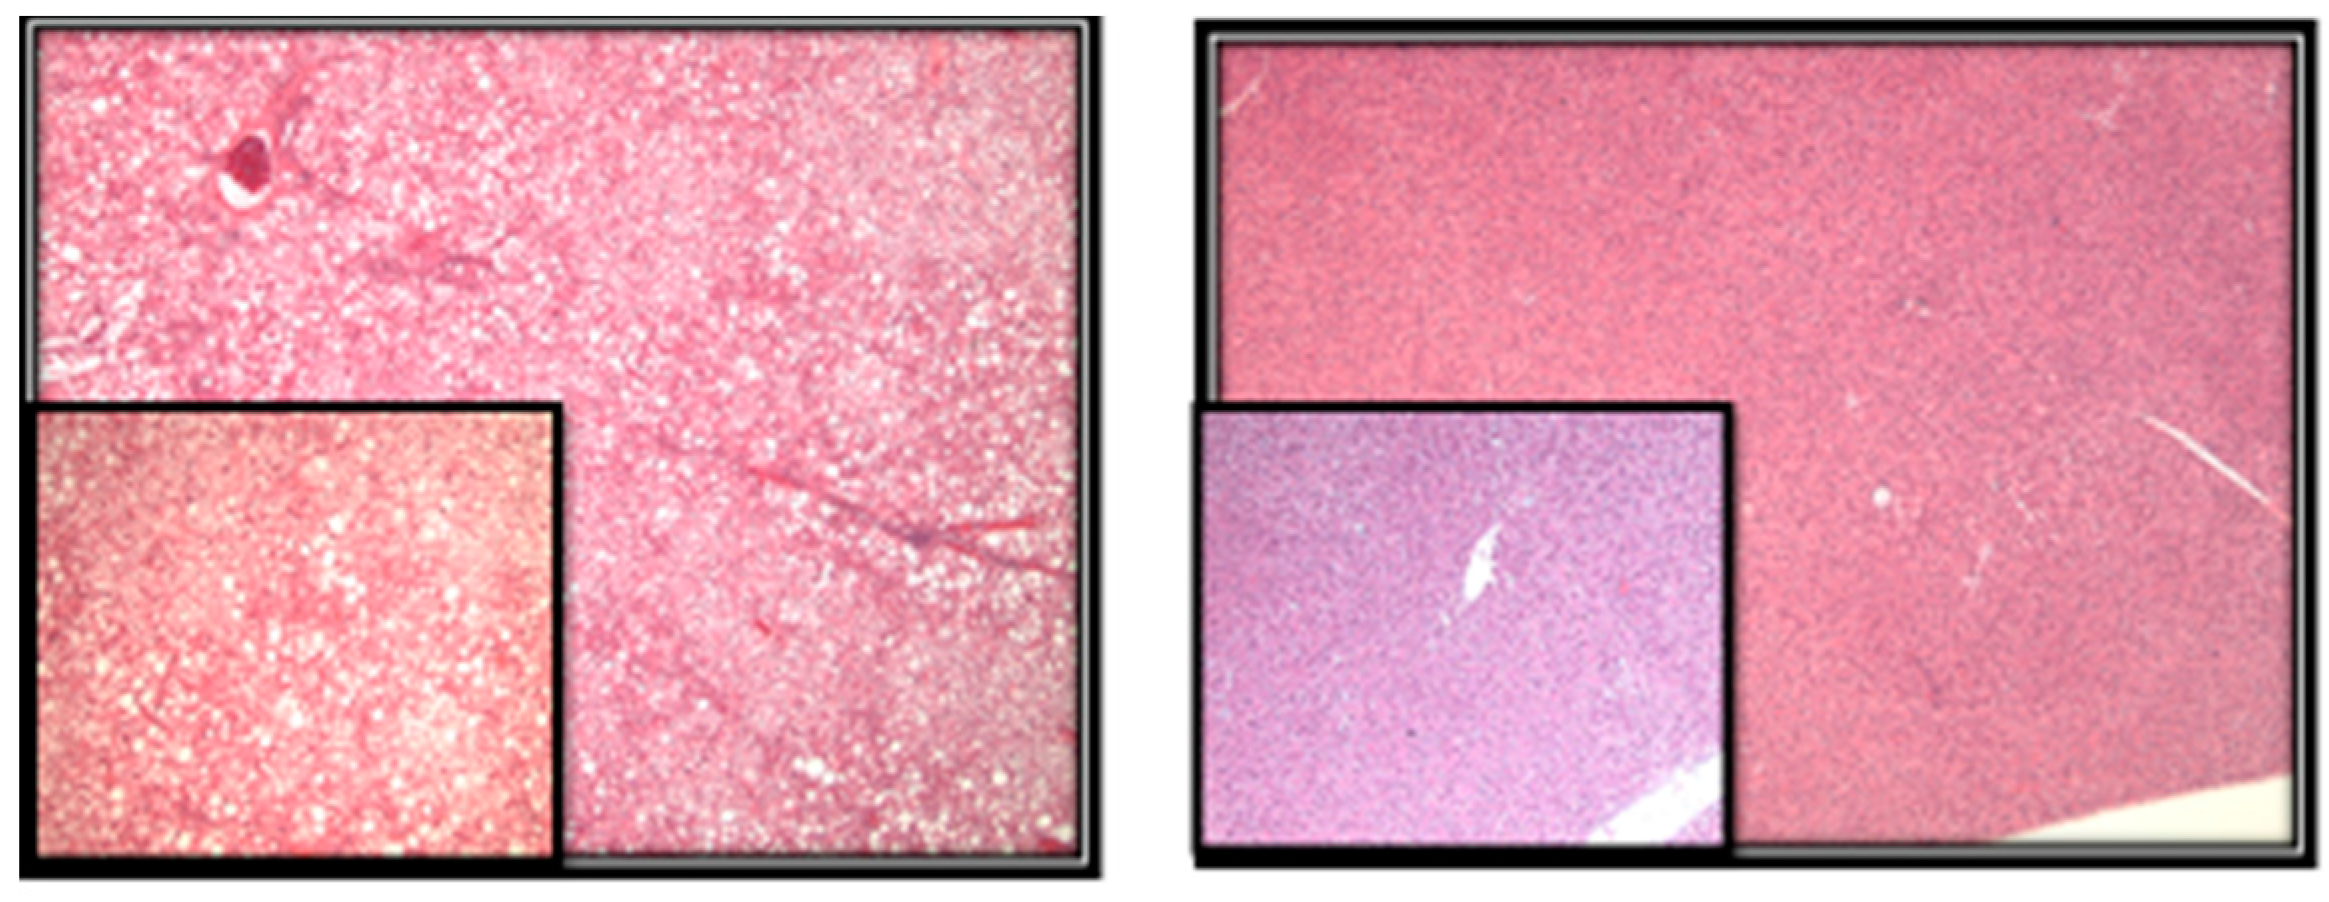
- Methods: Liver sections were evaluated for the presence of microvesicular and macrovesicular steatosis. The percentage of liver cells showing fat accumulation was estimated (Figure 2). A score of 1 to 4 was given to each section, reflecting the relative degree of steatosis in hepatocytes: 1 (<25%), 2 (25–50%), 3 (51–75%), and 4 (>75%) [27].
- To detect and quantify metabolites of our interest in the livers of Zucker rats, we used high-performance liquid chromatography with electrochemical (HPLC-ECD) and ultraviolet (HPLC-UV) detection and liquid chromatography-mass spectrometry (LC-MS) techniques. All methodological details about HPLC-ECD have been described previously [44,45]. Briefly, approximately 20 mg of frozen liver tissue were homogenized in ice-cold phosphate-buffered saline buffer. To precipitate proteins, 10% metaphosphoric acid was added to the homogenate and incubated for 30 min on ice. The samples were then centrifuged at 18,000 g at 4 °C for 15 min, and 20 µL or 10 µL of the resulting supernatants were injected into the HPLC or LC-MS systems accordingly for metabolite quantification. The pellet was used for protein analysis using BCA protein assay.
5. Statistical Analysis
6. Conclusions
Acknowledgments
Author Contributions
Conflicts of Interest
List of Abbreviations
| BCA | bicinchoninic acid |
| C | Celsius |
| CH3 | methyl group |
| DMBA | 7,12-dimethylbenz(α)anthracene |
| DNA | deoxyribonucleic acid |
| Fa | fatty |
| GSH | glutathione |
| GSNO | S-nitrosoglutathione |
| GSSG | glutathione disulfide |
| HPLC | high-performance liquid chromatography |
| HPLC-ECD | high-performance liquid chromatography with electrochemical detection |
| HPLC-UV | high-performance liquid chromatography with ultraviolet detection |
| LC-MS | liquid chromatography-mass spectrometry |
| Mg | milligram |
| n | number |
| ng | nanogram |
| nmol | nanomole |
| p | p-value |
| pmol | picomole |
| SAH | S-adenosylhomocysteine |
| SAM | S-adenosylmethionine |
| SD | standard deviation |
| Mg | microgram |
| µL | microliter |
References
- Ogden, C.L.; Carroll, M.D.; Kit, B.K.; Flegal, K.M. Prevalence of childhood and adult obesity in the United States, 2011–2012. JAMA 2014, 311, 806–814. [Google Scholar] [CrossRef] [PubMed]
- World Health Organization. Obesity and Overweight. Available online: http://www.who.int/mediacentre/factsheets/fs311/en (accessed on 1 March 2017).
- Ng, M.; Fleming, T.; Robinson, M.; Thomson, B.; Graetz, N.; Margono, C.; Mullany, E.C.; Biryukov, S.; Abbafati, C.; Abera, S.F.; et al. Global, regional, and national prevalence of overweight and obesity in children and adults during 1980–2013: A systematic analysis for the Global Burden of Disease Study 2013. Lancet 2014, 384. [Google Scholar] [CrossRef]
- Mokdad, A.H.; Ford, E.S.; Bowman, B.A.; Dietz, W.H.; Vinicor, F.; Bales, V.S.; Marks, J.S. Prevalence of obesity, diabetes, and obesity-related health risk factors, 2001. JAMA 2003, 289, 76–79. [Google Scholar] [CrossRef] [PubMed]
- Aleksandrova, K.; Stelmach-Mardas, M.; Schlesinger, S. Obesity and liver cancer. Recent Results Cancer Res. 2016, 208, 177–198. [Google Scholar] [PubMed]
- Huang, H.; Yan, Z.; Chen, Y.; Liu, F. A social contagious model of the obesity epidemic. Sci. Rep. 2016, 6. [Google Scholar] [CrossRef] [PubMed]
- Deng, T.; Lyon, C.J.; Bergin, S.; Caligiuri, M.A.; Hsueh, W.A. Obesity, inflammation, and cancer. Annu. Rev. Pathol. 2016, 11, 421–449. [Google Scholar] [CrossRef] [PubMed]
- Townsend, S.A.; Newsome, P.N. Non-alcoholic fatty liver disease in 2016. Br. Med. Bull. 2016, 119, 143–156. [Google Scholar] [CrossRef] [PubMed]
- Lee, J.; Kim, Y.; Friso, S.; Choi, S.W. Epigenetics in non-alcoholic fatty liver disease. Mol. Asp. Med. 2017, 54, 78–88. [Google Scholar] [CrossRef] [PubMed]
- Nam, S.Y. Obesity-related digestive diseases and their pathophysiology. Gut Liver 2017, 11, 323–334. [Google Scholar] [CrossRef] [PubMed]
- Halsted, C.H. Obesity: Effects on the liver and gastrointestinal system. Curr. Opin. Clin. Nutr. Metab. Care 1999, 2, 425–429. [Google Scholar] [CrossRef] [PubMed]
- Freitas, I.; Boncompagni, E.; Tarantola, E.; Gruppi, C.; Bertone, V.; Ferrigno, A.; Milanesi, G.; Vaccarone, R.; Tira, M.E.; Vairetti, M. In Situ evaluation of oxidative stress in rat fatty liver induced by a methionine- and choline-deficient diet. Oxid. Med. Cell Longev. 2016, 2016. [Google Scholar] [CrossRef] [PubMed]
- Pacana, T.; Cazanave, S.; Verdianelli, A.; Patel, V.; Min, H.K.; Mirshahi, F.; Quinlivan, E.; Sanyal, A.J. Dysregulated hepatic methionine metabolism drives homocysteine elevation in diet-induced non-alcoholic fatty liver disease. PLoS ONE 2015, 10, e0136822. [Google Scholar] [CrossRef] [PubMed]
- Mato, J.M.; Martinez-Chantar, M.L.; Lu, S.C. Methionine metabolism and liver disease. Annu. Rev. Nutr. 2008, 28, 273–293. [Google Scholar] [CrossRef] [PubMed]
- Finkelstein, J.D. Methionine metabolism in liver diseases. Am. J. Clin. Nutr. 2003, 77, 1094–1095. [Google Scholar] [PubMed]
- Melnyk, S.; Hakkak, R. Effects of obesity on serum concentration of methylation and oxidative/nitrosative stress metabolites following DMBA Treatment of female zucker rats. J. Obes. Weight Loss Ther. 2012, 2. [Google Scholar] [CrossRef]
- Pogribny, I.P.; Kutanzi, K.; Melnyk, S.; de Conti, A.; Tryndyak, V.; Montgomery, B.; Pogribna, M.; Muskhelishvili, L.; Latendresse, J.R.; James, S.J.; et al. Strain-dependent dysregulation of one-carbon metabolism in male mice is associated with choline- and folate-deficient diet-induced liver injury. FASEB J. 2013, 6, 2233–2243. [Google Scholar] [CrossRef] [PubMed]
- Kredich, N.M.; Martin, D.W. Role of S-adenosylhomocysteine in adenosine-mediated toxicity in cultured mouse T lymphoma cells. Cell 1977, 12, 931–938. [Google Scholar] [CrossRef]
- James, S.J.; Cutler, P.; Melnyk, S.; Jernigan, S.; Janak, L.; Gaylor, D.W.; Neubrander, J.A. Metabolic biomarkers of increased oxidative stress and impaired methylation capacity in children with autism. Am. J. Clin. Nutr. 2004, 80, 1611–1617. [Google Scholar] [PubMed]
- Soltys, K.; Dikdan, G.; Koneru, B. Oxidative stress in fatty livers of obese Zucker rats: Rapid amelioration and improved tolerance to warm ischemia with tocopherol. Hepatology 2001, 34, 13–18. [Google Scholar] [CrossRef] [PubMed]
- Geier, A.; Dietrich, G.G.; Grote, T.; Beuers, U.; Prüfer, T. Characterization of organic anion transporter regulation, glutathione metabolism and bile formation in the obese Zucker rats. J. Hepatol. 2005, 42 (Suppl. S1), 93–99. [Google Scholar] [CrossRef] [PubMed]
- Løhr, M.; Folkmann, J.K.; Sheykhzade, M.; Jensen, L.J.; Kermanizadeh, A.; Loft, S.; Møller, P. Hepatic oxidative stress, genotoxicity and vascular dysfunction in lean or obese Zucker rats. PLoS ONE 2015, 10, e0118773. [Google Scholar] [CrossRef] [PubMed]
- Berlett, B.S.; Stadtman, E.R. Protein oxidation in aging, disease, and oxidative stress. J. Biol. Chem. 1997, 272, 20313–20316. [Google Scholar] [CrossRef] [PubMed]
- Franco, R.; Schoneveld, O.; Georgakilas, A.G.; Panayiotidis, M.I. Oxidative stress, DNA methylation and carcinogenesis. Cancer Lett. 2008, 266, 6–11. [Google Scholar] [CrossRef] [PubMed]
- Daqing, G.; Chiming, W.; Lei, C.; Jiawen, H.; Shiqi, Y.; Diehl, A.D. Oxidative DNA damage and DNA repair enzyme expression are inversely related in murine models of fatty liver disease. Am. J. Physiol. 2004, 287, G1070–G1077. [Google Scholar]
- Shuichi, S.; Takuya, K.; Takao, Y.; Hiroki, S.; Kazuki, N.; Kenichi, W. In situ detection of lipid peroxidation and oxidative DNA damage in non-alcoholic fatty liver diseases. J. Hepatol. 2002, 37, 56–62. [Google Scholar]
- Hakkak, R.; Al-Dwairi, A.; Fuchs, G.J.; Korourian, S.; Simmen, F.A. Dietary soy protein induces hepatic lipogenic enzyme gene expression while suppressing hepatosteatosis in obese female Zucker rats bearing DMBA-initiated mammary tumors. Genes Nutr. 2012, 4, 549–558. [Google Scholar] [CrossRef] [PubMed]
- Serkova, N.J.; Jackman, M.; Brown, J.L.; Liu, T.; Hirose, R.; Roberts, J.P.; Maher, J.J.; Niemann, C.U. Metabolic profiling of livers and blood from obese Zucker rats. J. Hepatol. 2006, 44, 956–962. [Google Scholar] [CrossRef] [PubMed]
- Kwak, H.C.; Kim, Y.M.; Oh, S.J.; Kim, S.K. Sulfur amino acid metabolism in Zucker diabetic fatty rats. Biochem. Pharmacol. 2015, 96, 256–266. [Google Scholar] [CrossRef] [PubMed]
- Mato, J.M.; Corrales, F.J.; Lu, S.C.; Avila, M.A. S-Adenosylmethionine: A control switch that regulates liver function. FASEB J. 2000, 16, 15–26. [Google Scholar] [CrossRef] [PubMed]
- Williams, K.T.; Schalinske, K.L. Tissue-specific alterations of methyl group metabolism with DNA hypermethylation in the Zucker (type 2) diabetic fatty rat. Diabetes Metab. Res. Rev. 2012, 28, 123–131. [Google Scholar] [CrossRef] [PubMed]
- Kammel, A.; Saussenthaler, S.; Jähnert, M.; Jonas, W.; Stirm, L.; Hoeflich, A.; Staiger, H.; Fritsche, A.; Häring, H.U.; Joost, H.G.; et al. Early hypermethylation of hepatic Igfbp2 results in its reduced expression preceding fatty liver in mice. Hum. Mol. Genet. 2016, 15, 2588–2599. [Google Scholar]
- Jiang, M.; Zhang, Y.; Liu, M.; Lan, M.S.; Fei, J.; Fan, W.; Gao, X.; Lu, D. Hypermethylation of hepatic glucokinase and L-type pyruvate kinase promoters in high-fat diet—induced obese rats. Endocrinology 2011, 152, 1284–1289. [Google Scholar] [CrossRef] [PubMed]
- Geach, T. Obesity: Methylation a consequence not a cause. Nat. Rev. Endocrinol. 2017, 13, 127. [Google Scholar] [CrossRef] [PubMed]
- Tucker, M.E. Fatty Liver Disease Surging As Liver Cancer Cause. Available online: www.medscape.com/viewarticle/843733 (accessed on 5 June 2017).
- Carmiel-Haggai, M.; Cederbaum, A.I.; Nieto, N. A high-fat diet leads to the progression of non-alcoholic fatty liver disease in obese rats. FASEB J. 2005, 19, 136–138. [Google Scholar] [CrossRef] [PubMed]
- Hopps, E.; Noto, D.; Caimi, G.; Averna, M.R. A novel component of the metabolic syndrome: The oxidative stress. Nutr. Metab. Cardiovasc. Dis. 2010, 20, 72–77. [Google Scholar] [CrossRef] [PubMed]
- Loguercio, C.; Federico, A. Oxidative stress in viral and alcoholic hepatitis. Free Radic. Biol. Med. 2003, 34. [Google Scholar] [CrossRef]
- Grattagliano, I.; Caraceni, P.; Galamita, G.; Ferri, D.; Gargano, I.; Palasciano, G.; Portincasa, D. Severe liver steatosis correlates with nitrosative and oxidative stress in rats. Eur. J. Clin. Investig. 2008, 38, 523–530. [Google Scholar]
- Brunt, E.M.; Kleiner, D.E.; Wilson, L.A.; Unalp, A.; Behling, C.E.; Lavine, J.E.; Neuschwander-Tetri, B.A. Portal chronic inflammation in non-alcoholic fatty liver disease (NAFLD): A histologic marker of advanced NAFLD-Clinicopathologic correlations from the non-alcoholic steatohepatitis clinical research network. Hepatology 2009, 49, 809–820. [Google Scholar] [CrossRef] [PubMed]
- Brunt, E.M.; Tiniakos, D.G. Histopathology of non-alcoholic fatty liver disease. World J. Gastroenterol. 2010, 16, 5286–5296. [Google Scholar] [CrossRef] [PubMed]
- Paquissi, F.C. Immune Imbalances in Non-Alcoholic Fatty Liver Disease: From General Biomarkers and Neutrophils to Interleukin-17 Axis Activation and New Therapeutic Targets. Front. Immunol. 2016, 7. [Google Scholar] [CrossRef] [PubMed]
- Hakkak, R.; Shaaf, S.; Jo, C.H.; Macleod, S.; Korourian, S. Effects of high-isoflavone soy diet vs. casein protein diet and obesity on DMBA-induced mammary tumor development. Oncol. Lett. 2011, 2, 29–36. [Google Scholar] [CrossRef] [PubMed]
- Melnyk, S.; Pogribna, M.; Pogribny, I.P.; Yi, P.; James, S.J. A new HPLC method for the simultaneous determination of oxidized and reduced plasma aminothiols using coulometric electrochemical detection. J. Nutr. Biochem. 1999, 10, 490–497. [Google Scholar] [CrossRef]
- Melnyk, S.; Pogribna, M.; Pogribny, I.P.; James, S.J. Measurement of plasma and intracellular S-adenosylmethionine and S-adenosylhomocysteine utilizing coulometric electrochemical detection: Alterations with plasma homocysteine and pyridoxal 5’-phosphate concentrations. Clin. Chem. 2000, 46, 265–272. [Google Scholar] [PubMed]
- James, S.J.; Shpyleva, S.; Melnyk, S.; Pavliv, O.; Pogribny, I.P. Complex epigenetic regulation of Engrailed-2 (EN-2) homeobox gene in the autism cerebellum. Transl. Psychiatry 2013, 3. [Google Scholar] [CrossRef] [PubMed]
- R Statistical Computing. R: A Language and Environment for Statistical Computing. Available online: http://www.gbif.org/resource/81287 (accessed on 5 June 2017).


| Metabolites | Obese (n = 20) | Lean (n = 26) | p |
|---|---|---|---|
| Methionine (nmol/mg protein) | 0.798 ± 0.187 | 0.596 ± 0.129 | <0.0004 |
| SAM (nmol/mg protein) | 0.868 ± 0.325 | 0.703 ± 0.247 | 0.055 |
| SAH (nmol/mg protein) | 0.184 ± 0.039 | 0.267 ± 0.069 | <0.0005 |
| SAM/SAH | 4.91 ± 1.882 | 2.72 ± 1.051 | <0.0005 |
| 5-methylcytosine (%) | 4.882 ± 0.675 | 4.37 ± 0.673 | <0.02 |
| Metabolites | Obese (n = 20) | Lean (n = 26) | p |
|---|---|---|---|
| GSH (nmol/mg protein) | 28.2 ± 6.28 | 31.8 ± 6.96 | <0.08 |
| GSSG (nmol/mg protein) | 0.864 ± 0.157 | 0.738 ± 0.125 | <0.002 |
| GSH/GSSG | 32.9 ± 6.77 | 43.8 ± 10.13 | <0.0001 |
| 8-OH-Guanosine (ng/µg DNA) | 0.528 ± 0.139 | 0.409 ± 0.121 | <0.004 |
| Metabolites | Obese (n = 20) | Lean (n = 26) | p |
|---|---|---|---|
| GSNO (pmol/mg protein) | 37.2 ± 7.46 | 30.4 ± 12.51 | <0.04 |
| nitrotyrosine (nmol/mg protein) | 0.261 ± 0.035 | 0.239 ± 0.036 | <0.04 |
© 2017 by the authors. Licensee MDPI, Basel, Switzerland. This article is an open access article distributed under the terms and conditions of the Creative Commons Attribution (CC BY) license (http://creativecommons.org/licenses/by/4.0/).
Share and Cite
Melnyk, S.; Korourian, S.; Levy, J.W.; Pavliv, O.; Evans, T.; Hakkak, R. Effects of Obesity on Pro-Oxidative Conditions and DNA Damage in Liver of DMBA-Induced Mammary Carcinogenesis Models. Metabolites 2017, 7, 26. https://doi.org/10.3390/metabo7020026
Melnyk S, Korourian S, Levy JW, Pavliv O, Evans T, Hakkak R. Effects of Obesity on Pro-Oxidative Conditions and DNA Damage in Liver of DMBA-Induced Mammary Carcinogenesis Models. Metabolites. 2017; 7(2):26. https://doi.org/10.3390/metabo7020026
Chicago/Turabian StyleMelnyk, Stepan, Soheila Korourian, Joseph W. Levy, Oleksandra Pavliv, Teresa Evans, and Reza Hakkak. 2017. "Effects of Obesity on Pro-Oxidative Conditions and DNA Damage in Liver of DMBA-Induced Mammary Carcinogenesis Models" Metabolites 7, no. 2: 26. https://doi.org/10.3390/metabo7020026