Article

Comparative Rice Bran Metabolomics across Diverse Cultivars and Functional Rice Gene–Bran Metabolite Relationships

1
Department of Environmental and Radiological Health Sciences, College of Veterinary Medicine and Biomedical Sciences, Colorado State University, Fort Collins, CO 80523, USA
2
Department of Bioagricultural Sciences and Pest Management, Colorado State University, Fort Collins, CO 80523, USA
3
USDA-Agricultural Research Service, Dale Bumpers National Rice Research Center, Stuttgart, AR 72160, USA
4
Center of Infectious Diseases, Department of Microbiology and Parasitology, Faculty of Medical Sciences, National Autonomous University of Nicaragua, León (UNAN-León), León 21000, Nicaragua
5
Laboratoire de Biologie Moléculaire Appliquée, Campus de Badalabougou, Université des Sciences, des Techniques et des Technologies de Bamako, BP 1805 Bamako, Mali
*
Author to whom correspondence should be addressed.
Metabolites 2018, 8(4), 63; https://doi.org/10.3390/metabo8040063
Submission received: 14 September 2018 / Revised: 3 October 2018 / Accepted: 6 October 2018 / Published: 9 October 2018
(This article belongs to the Special Issue Plant, Food and Nutritional Metabolomics for Health Enhancement)

Abstract

:
Rice (Oryza sativa L.) processing yields ~60 million metric tons of bran annually. Rice genes producing bran metabolites of nutritional and human health importance were assessed across 17 diverse cultivars from seven countries using non-targeted metabolomics, and resulted in 378–430 metabolites. Gambiaka cultivar had the highest number and Njavara had the lowest number of metabolites. The 71 rice bran compounds of significant variation by cultivar included 21 amino acids, seven carbohydrates, two metabolites from cofactors and vitamins, 33 lipids, six nucleotides, and two secondary metabolites. Tryptophan, α-ketoglutarate, γ-tocopherol/β-tocopherol, and γ-tocotrienol are examples of bran metabolites with extensive cultivar variation and genetic information. Thirty-four rice bran components that varied between cultivars linked to 535 putative biosynthetic genes using to the OryzaCyc 4.0, Plant Metabolic Network database. Rice genes responsible for bran composition with animal and human health importance is available for rice breeding programs to utilize in crop improvement.

1. Introduction

Rice, a major global cereal crop, originates from Oryza sativa L. (Asian rice) or Oryza glaberrima Steud (African rice) [1]. Oryza sativa is the primary source of calories for half of the world’s population [2], and it provides phytochemicals, vitamins, minerals, carbohydrates, and fats when consumed as whole grain rice [3]. Rice grows in over 100 countries [4]. As a result of its long history of cultivation and selection under diverse environments, O. sativa comprises over 400,000 varieties and it has acquired a broad range of adaptability and tolerance to different water and soil regimens, from flooded lowlands to arid hillside slopes [5,6]. The 2017 global paddy rice production reported by the Food and Agriculture Organization (FAO) of the United Nations was 756.7 metric million tons, with over 502 million metric tons milled and more than 60 million metric tons of rice bran produced [7]. Polished white rice is the major product, with rice milling yields of 65–70% and the by-products comprising of 20% rice husk and 8–12% rice bran [8].
Rice bran has a broad spectrum of health benefits [9,10,11,12], partially due to a diverse array of bioactive metabolites [13,14]. Rice bran bioactive components include, but are not limited to γ-oryzanol [15], tocopherols, tocotrienols [16], carotenoids [17], γ-aminobutyric acid [18], octacosanol [19], squalene [20], unsaturated fatty acids [21], phytosterols, and phenolic compounds [22]. Dietary consumption of rice bran was shown to be feasible and tolerable to increase key nutrients and fiber intakes in children and adults [11,23,24,25], and to provide health-promoting properties in the prevention and control of major chronic diseases, such as diabetes [26], chronic inflammation [27], and cardiovascular disease [25,28], as well as cancers of the colon, liver, prostate, and breast [11,24,29,30]. Until recently, rice bran has been largely under-valued and under-utilized for nutritional and medicinal applications [31], and this promising food has not received attention from rice breeders when compared to other traits of agronomic importance (e.g., yield, disease resistance) [32]. Given that the bran component of whole grain rice is the fraction with highest nutritive value [33,34], and that extensive genetic variation exists in Oryza sativa germplasm, a continued exploration with regards to the nutritional and health properties of rice bran is merited.
Metabolomics has shown the utility to study rice plant biology and compounds that are linked to tolerance to different stressors, including abiotic stress [35], mineral toxicity [36], nutrient limitation [37,38], drought stress [39], and pesticide stress [40], suggesting extensive metabolome adaptability in rice. Metabolomics has also characterized natural and genetic variations in rice via the phenotyping of brown rice seeds [41], cooked brown rice [42], mature seeds [43], embryo (a fraction of rice bran) and endosperm (white rice) [44], and leaves [39]. These findings support metabolomic approaches to improve plant function, enhance grain nutritional quality, and increase grain yield [6,45,46]. Metabolite profiling of rice bran from three USA rice cultivars showed an appreciable variation of bioactive rice bran components, and provided the rationale for larger, global scale investigations [13,47]. Variation in bran composition could substantially contribute to greater interest in whole grain rice for wider consumer acceptance.
There is a gap in knowledge between rice bran bioactive metabolites and their genetic variation among globally diverse rice cultivars. Given that metabolomics is a powerful tool that allows for a broad range of rice bran metabolite detection, the objective of this study was to investigate variation in the rice bran metabolome of 17 cultivars, and to identify gene–metabolite relationships that are relevant to the nutritional and medicinal qualities of rice bran. Rice bran metabolites were hypothesized to exhibit biochemical variation across cultivars and reveal key rice gene–metabolite relationships of utility for rice bran traits with nutrition and health importance in future breeding programs.

2. Results

2.1. Classification of Rice Bran Metabolite Profiles and Metabolic Pathways by Non-Targeted Metabolomics

The rice bran metabolome ranged in the total numbers of identified metabolites, with 378 metabolites identified in Njavara (India) rice bran, to 430 metabolites identified in Gambiaka (Mali) rice bran. Table 1 shows the rice bran metabolite numbers based on chemical classes and shows the cultivar(s) that had the highest and lowest total number of metabolites. RBT 300 had 122 amino acids, and Khao Gaew and Njavara cultivars had 99 amino acids. Gambiaka, Shwetasoke, and LTH had 53 carbohydrates, while Calrose had the smallest total number, with 48 carbohydrates. On average, 39% of the rice bran metabolome were lipids across the 17 cultivars, and this represented the largest composition by chemical class. Basmati 217 and Shwetasoke had the largest numbers of lipids (166 total), whereas Jasmine 85 had the lowest number of lipids (146 total). For the nucleotides, Basmati 370 and Sawa Mahsuli had 38 metabolites, and Khao Gaew and Njavara had 29. Overall, the “red color” bran genotypes, i.e. Njavara and LTH, had a broader range of secondary metabolites (22 metabolites), while Dorado, having brown bran, had 16 metabolites. Cultivars ranged from zero to 11 metabolites in rice bran peptides. It is noteworthy that the number of cofactors and vitamins did not vary greatly across rice bran cultivars (23–27 metabolites) (Table 1 and Supplementary Table S1). Each of the chemical classes were subdivided into 53 metabolic pathways (Supplementary Table S1).

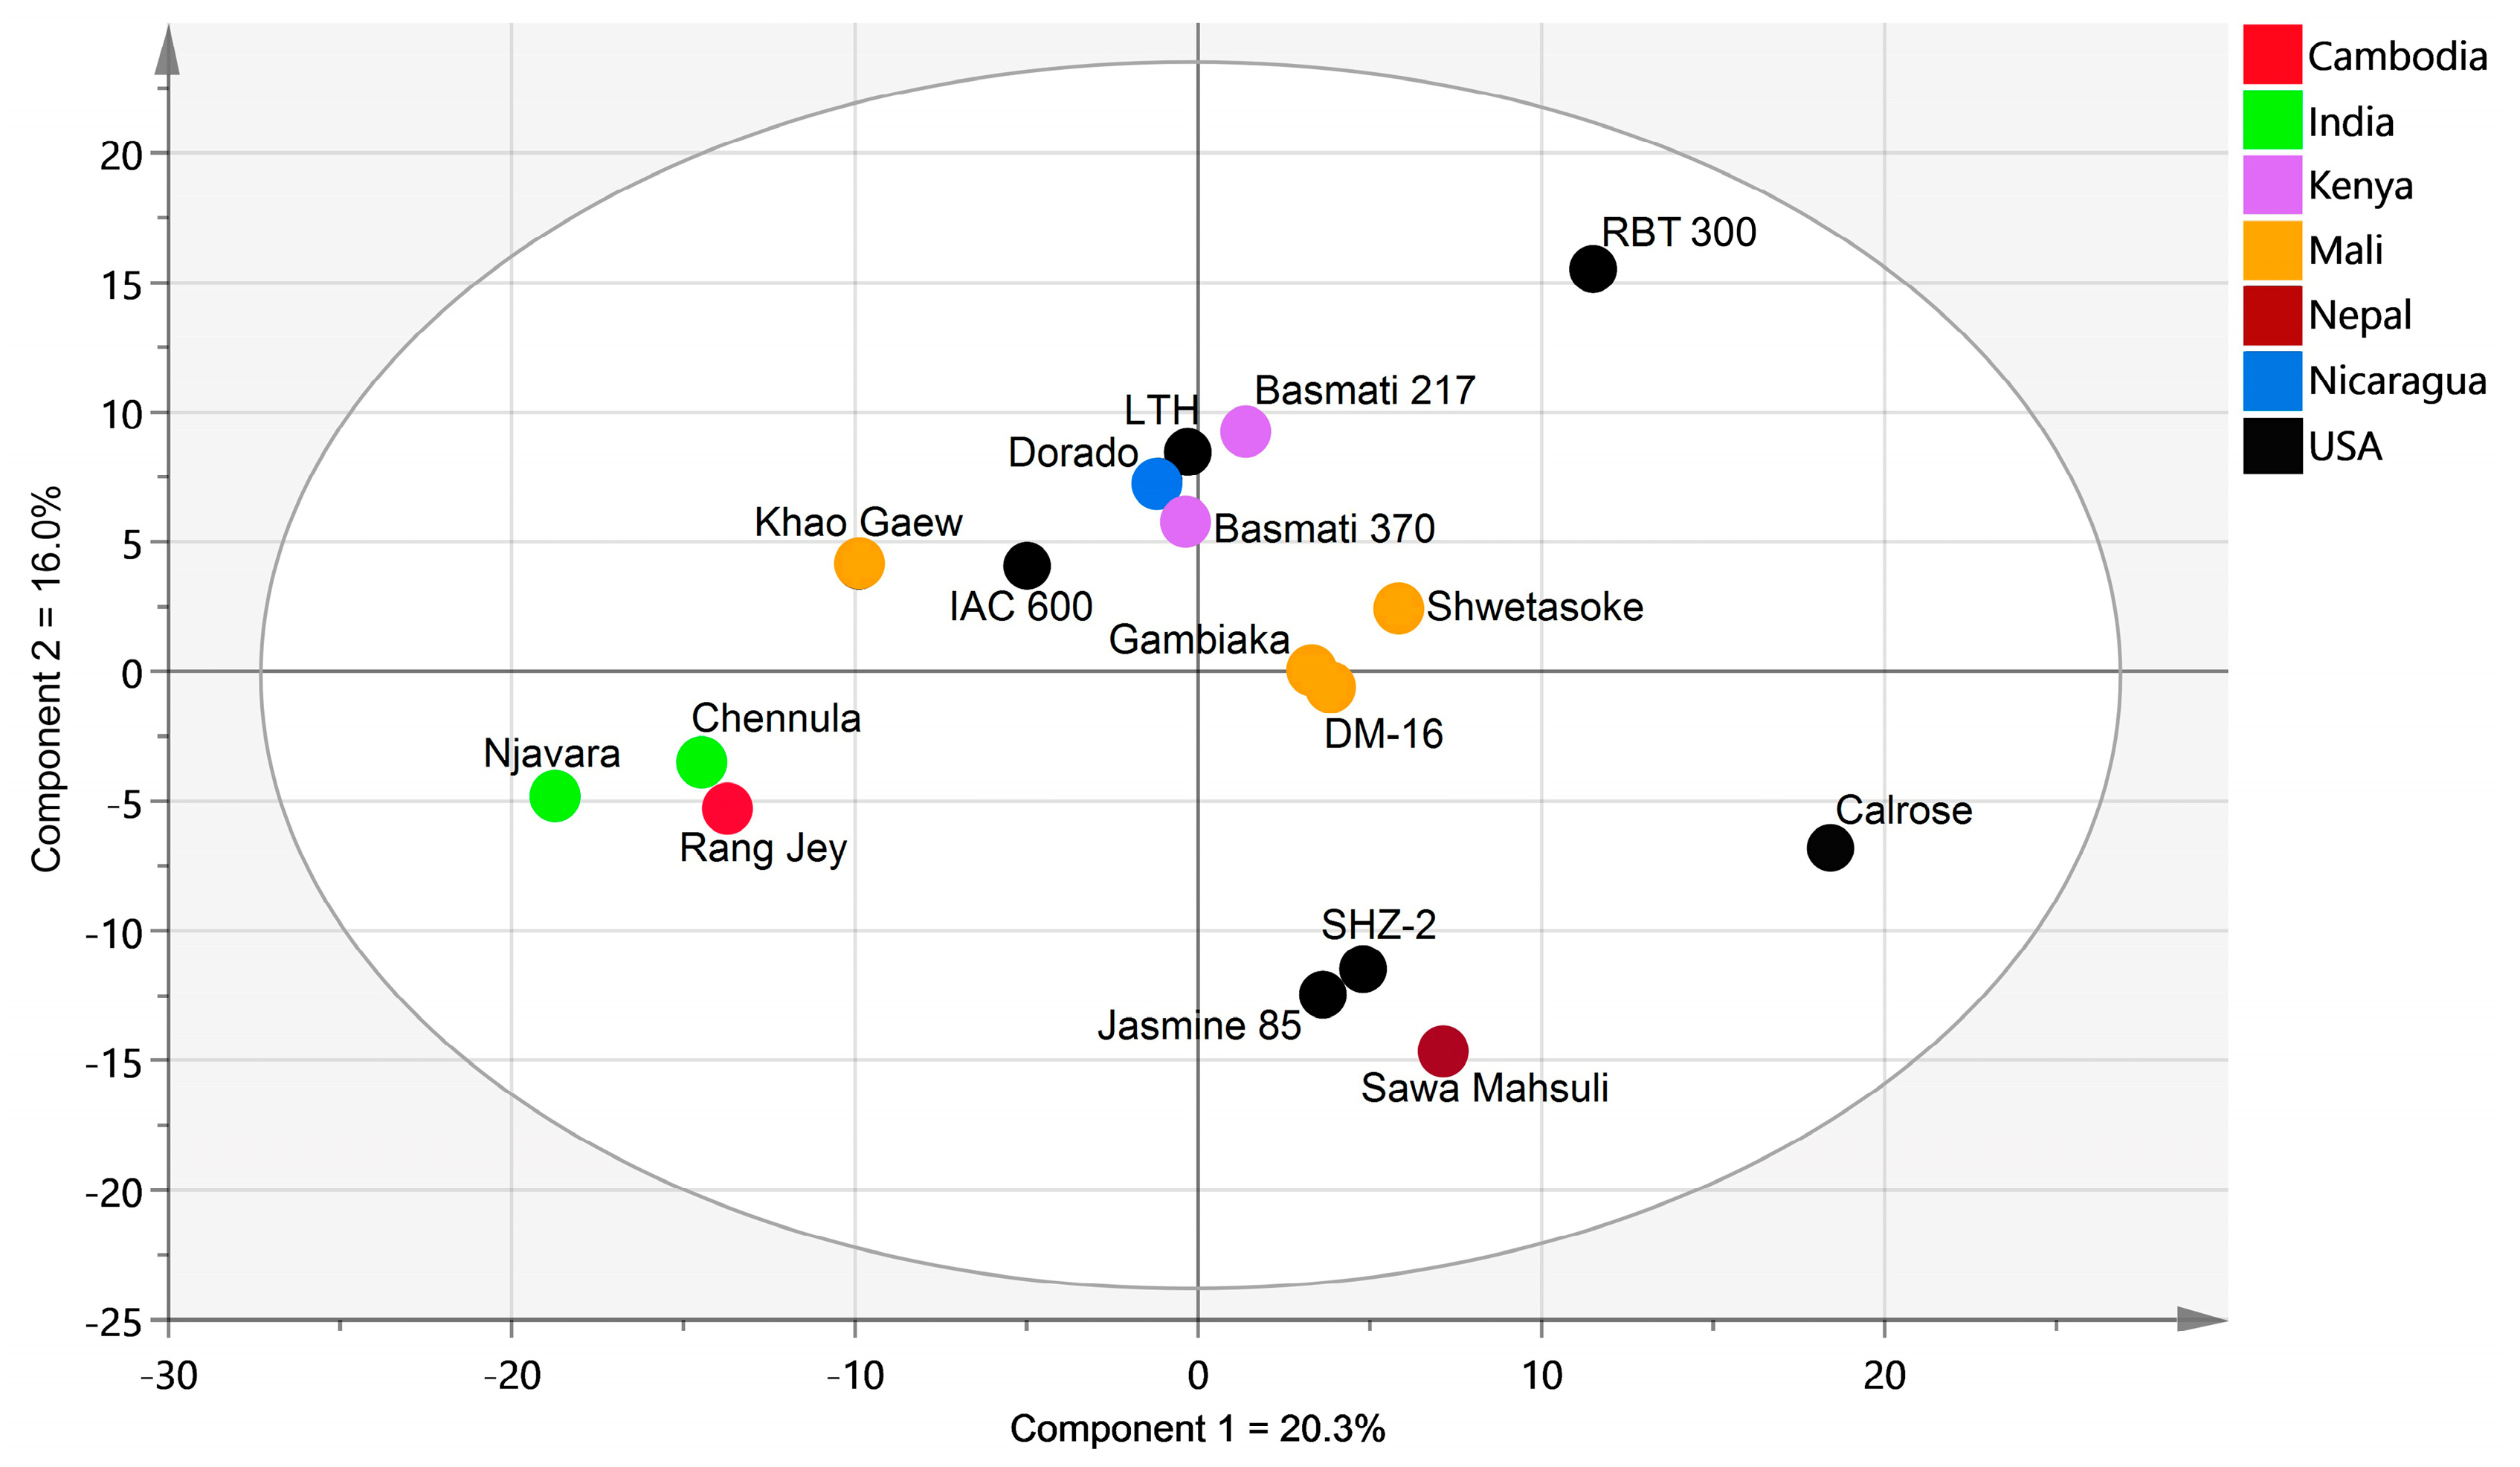
2.2. Global Rice Bran Metabolome Variation for 17 Cultivars

Across all cultivars, the principal component 1 (PC1) accounted for 20.3% of the total variation in the dataset, and PC2 for 16% of the metabolite variation (Figure 1). These results indicate that there is a “core” rice bran metabolome, and that the difference in the range of individual rice bran metabolites (ca. 60–90) can be seen across the different chemical classes of the metabolome.

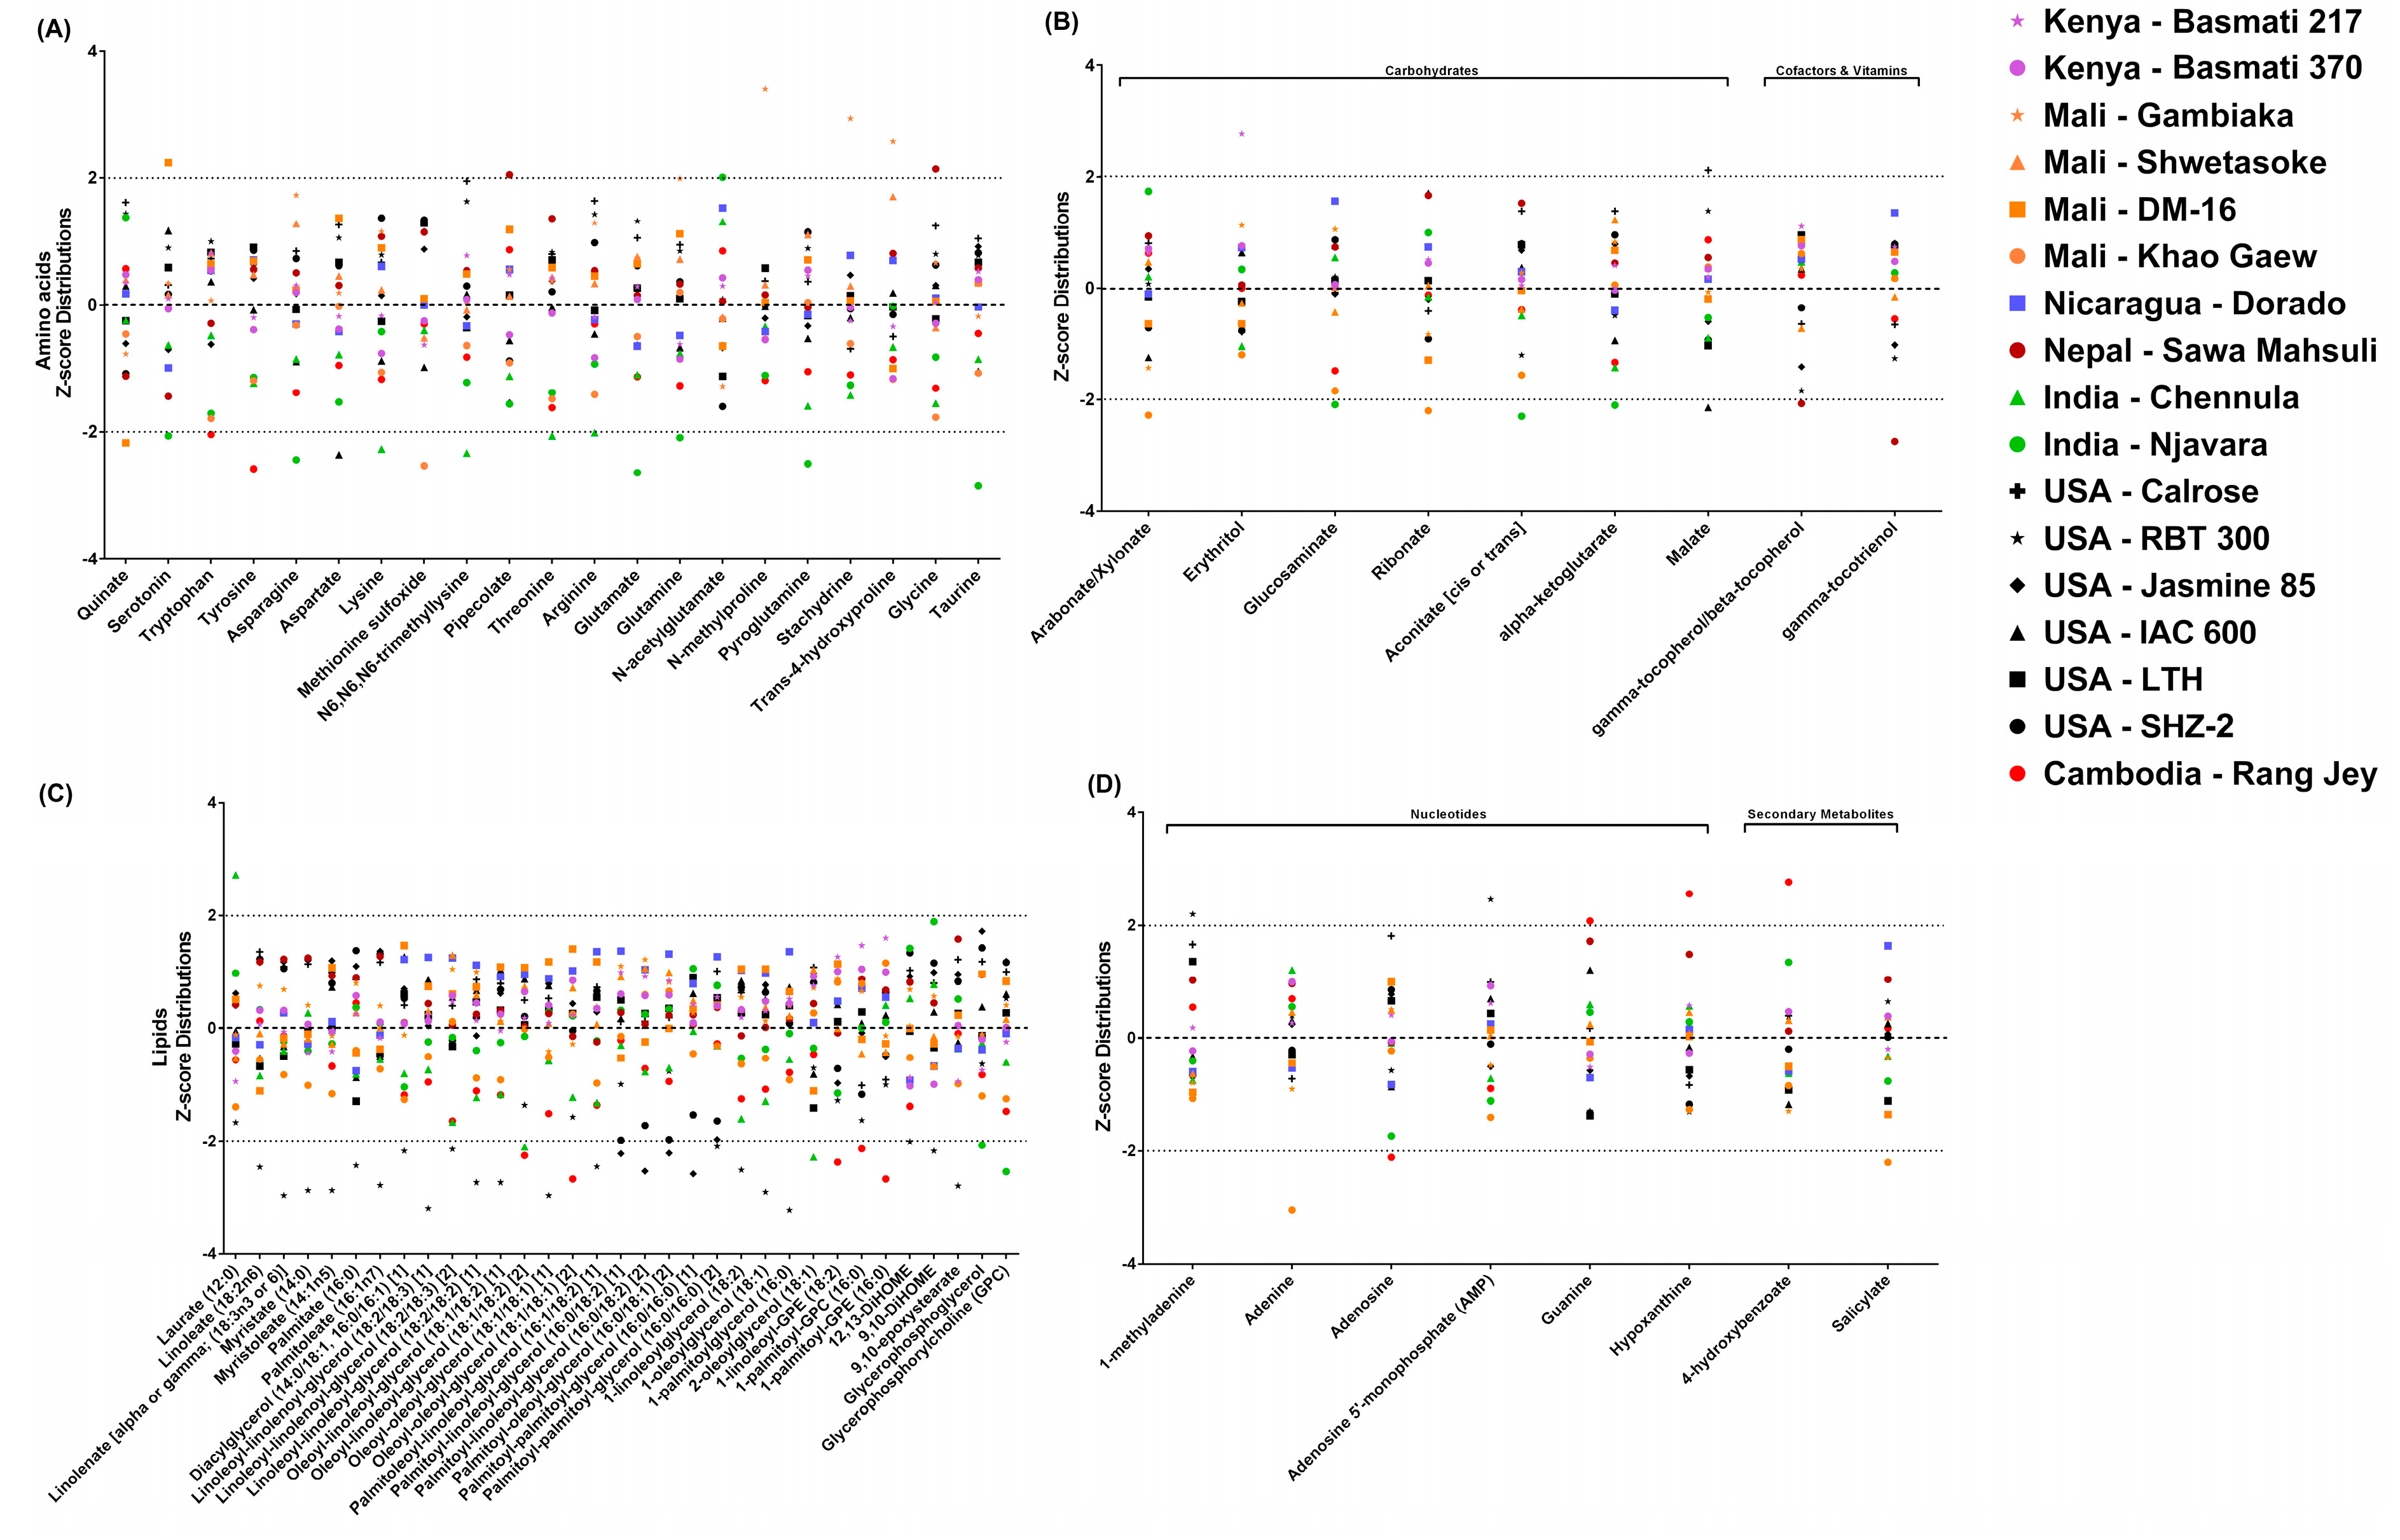
2.3. Comparison of Rice Bran Metabolites across 17 Cultivars

Z-score was used to represent the median-scaled relative abundance of each rice bran metabolite across all cultivars, and a threshold Z-score of |2| was applied to identify metabolites that differed appreciably between cultivars. This comparative Z-score analysis led to the identification of 71 rice bran metabolites that were significantly different across cultivars. The cultivar discriminating metabolites are shown in Figure 2 (panel A–D), and complete metabolite characterizations are included in Supplementary Table S2. Thus, the 20% variation identified using comparative rice bran metabolomics (PC1) included 21 amino acids, seven carbohydrates, and two cofactors & vitamins, 33 lipids, six nucleotides, and two secondary metabolites.

2.3.1. Cultivar Variation in Rice Bran Amino Acids

There were a total of 21 amino acids that differed among cultivars, and among these, many metabolites had previously-reported roles in human and animal health. Figure 2A shows that DM-16 rice bran had lower and higher expressions of quinate and serotonin, respectively. Rang Jey showed the lower Z-score for tryptophan and tyrosine. Chennula rice bran had lower relative abundances of four amino acids, namely lysine, N6,N6,N6-trimethyllysine, threonine, and arginine. Gambiaka rice bran showed higher relative abundances of N-methylproline, stachydrine, and trans-4-hydroxyproline when compared to other brans, while Njavara was lower in the abundances of serotonin, asparagine, glutamate, glutamine, pyroglutamine, and taurine. Njavara was higher in relative abundances of N-acetylglutamate. Higher abundances of pipecolate and glycine were observed in Sawa Mahsuli among the cultivars. Khao Gaew and IAC 600 were the only cultivars with a lower relative abundance of methionine sulfoxide and aspartate, respectively. Basmati 217 and Basmati 370, Shwetasoke, Dorado, Calrose, RBT 300, Jasmine 85, LTH, and SHZ-2 were the cultivars with no significant Z-score changes across the class of amino acids.

2.3.2. Cultivar Variation in Rice Bran Carbohydrates

Seven rice bran carbohydrates showed significant differences across cultivars (Figure 2B). Cultivars with lower abundances is some metabolites included arabonate/xylonate in Khao Gaew, glucosaminate, aconitate, and α-ketoglutarate in Njavara, and malate in IAC 600. Calrose was higher for the abundance of malate, while Basmati 217 had the highest abundance of erythritol. The remaining cultivars (i.e., Basmati 370, Gambiaka, Shwetasoke, and DM-16, Dorado, Sawa Mahsuli, Chennula, RBT 300, Jasmine 85, LTH, SHZ-2, and Rang Jey) showed no significant Z-score changes across the carbohydrate chemical class.

2.3.3. Cultivar Variation in Rice Bran Cofactors and Vitamins

There was limited variation for cofactors and vitamins in bran amongst the cultivars, except for the vitamin E components γ-tocopherol/β-tocopherol and γ-tocotrienol, with the lowest relative abundances observed in Sawa Mahsuli rice bran (Figure 2B).

2.3.4. Cultivar Variation in Rice Bran Lipids

Lipids represented the largest percentage of the bran metabolome (39%) encompassing 146-166 metabolites across varieties (Table 1). Figure 2C shows the 32 lipid metabolites with significant Z-score below -2 and one lipid was significantly higher in abundance (Z-score above 2) when compared across cultivars. Chennula was the only cultivar that had an increased Z-score for laurate. RBT 300 (20 lipids), Rang Jey (five lipids), Jasmine 85 (four lipids), Njavara (two lipids), and Chennula (two lipids) were the cultivars with lower metabolite relative abundances. The significant metabolites in RBT 300 included linoleate, linolenate, myristate, myristoleate, palmitate, palmitoleate, diacylglycerol (14:0/18:1, 16:0/16:1), two isomers of linoleoyl-linolenoyl-glycerol (18:2/18:3), linoleoyl-linoleoyl-glycerol (18:2/18:2), oleoyl-linoleoyl-glycerol (18:1/18:2), oleoyl-oleoyl-glycerol (18:1/18:1), palmitoleoyl-linoleoyl-glycerol (16:1/18:2), palmitoyl-palmitoyl-glycerol (16:0/16:0), 1-linoleoylglycerol (18:2), 1-oleoylglycerol (18:1), 1-palmitoylglycerol (16:0), 12,13-dihydroxyoctadec-9-enoic acid (12,13-DiHOME), 9,10-DiHOME, and 9,10-epoxystearate. Rang Jey was lower in bran oleoyl-linoleoyl-glycerol (18:1/18:2), oleoyl-oleoyl-glycerol (18:1/18:1), 1-linoleoyl- glycerophosphoethanolamine (GPE) (18:2), 1-palmitoyl- glycerophosphocholine (GPC) (16:0), and 1-palmitoyl-GPE (16:0). Jasmine 85 showed a lower relative abundance of two isomers of palmitoyl-linoleoyl-glycerol (16:0/18:2), palmitoyl-oleoyl-glycerol (16:0/18:1), and palmitoyl-palmitoyl-glycerol (16:0/16:0). Lower relative abundance lipids in Njavara included glycerophosphoglycerol and GPC. Chennula showed low abundances in oleoyl-linoleoyl-glycerol (18:1/18:2) and 2-oleoylglycerol (18:1).

2.3.5. Cultivar Variation in Rice Bran Nucleotides

Six nucleotides varied among the cultivars. Figure 2D shows that Rang Jey rice bran had higher abundance of guanine and hypoxanthine, and the lower abundance of adenosine when compared to the other rice cultivars. RBT 300 had higher relative abundance in 1-methyladenine and adenosine 5′-monophosphate (AMP). Khao Gaew showed a lower level of adenine amongst the cultivars.

2.3.6. Cultivar Variation in Rice Bran Secondary Metabolites

Secondary metabolites that were expressed differently among the cultivars included two metabolites: 4-hydroxybenzoate and salicylate. Figure 2D shows that Rang Jey had the highest abundance of 4-hydroxybenzoate, and Khao Gaew had the lowest relative abundance for salicylate when compared to all other cultivars. There were no differences in the relative abundances of rice bran peptides, yet there was cultivar variation in the presence or absence of the rice bran peptides (0–11 metabolites), whereby Basmati 217 was the only rice bran that had no peptides identified. Chennula, Njavara, and RBT 300 had one identified peptide (prolylglycine in Chennula and Njavara, and valylglutamine in RBT 300). There were seven cultivars with 11 peptides identified (Gambiaka, Shwetasoke, DM-16, Sawa Mahsuli, Calrose, Jasmine 85, and SHZ-2).

2.4. Integrating Rice Biosynthetic Genes with Rice Bran Metabolites

Using OryzaCyc database, 34 out of the 71 cultivar-discriminating metabolites had corresponding gene(s) identified in the database. Rice genes listed in Table 2 were identified for 16 amino acids that differed across cultivars, and that were in the PMN databases for biosynthesis. Quinate and serotonin had five genes and two genes, respectively, which could regulate levels in the bran. Glycine is another amino acid with eight genes that were directly involved in its biosynthesis, yet there were 151 other possible rice genes in the database that were indirectly involved in glycine biosynthetic pathways. Lipids were the majority of the methanol-extracted rice bran metabolome, and of the 33 differentially-abundant rice bran lipids, only eight had biosynthetic genes characterized (Table 2). Glycero-phosphocholine (GPC) was found to have seven biosynthetic genes, whereby linolenate, an omega-3 polyunsaturated fatty acid (PUFA) was linked to only one gene, but it was indirectly associated with 332 genes that are common in biosynthesis of a standard fatty acid. Table 3 lists three carbohydrates and two cofactors and vitamins metabolites with registered biosynthetic genes. There were two genes responsible for malate biosynthesis, with an additional 150 genes that are common to the biosynthesis of non-specified carbohydrates. Tocochromanols, also known as Vitamin E components (tocopherols and tocotrienols, collectively), have genes in rice that are clearly defined [48], and γ-tocopherol/β-tocopherol had four genes, while γ-tocotrienol had a single known gene. There were four nucleotides and one secondary metabolite with rice genes reported for biosynthesis (Table 4). Salicylate had three identified biosynthetic genes, and another 152 possible genes may be involved in carboxylate biosynthesis.

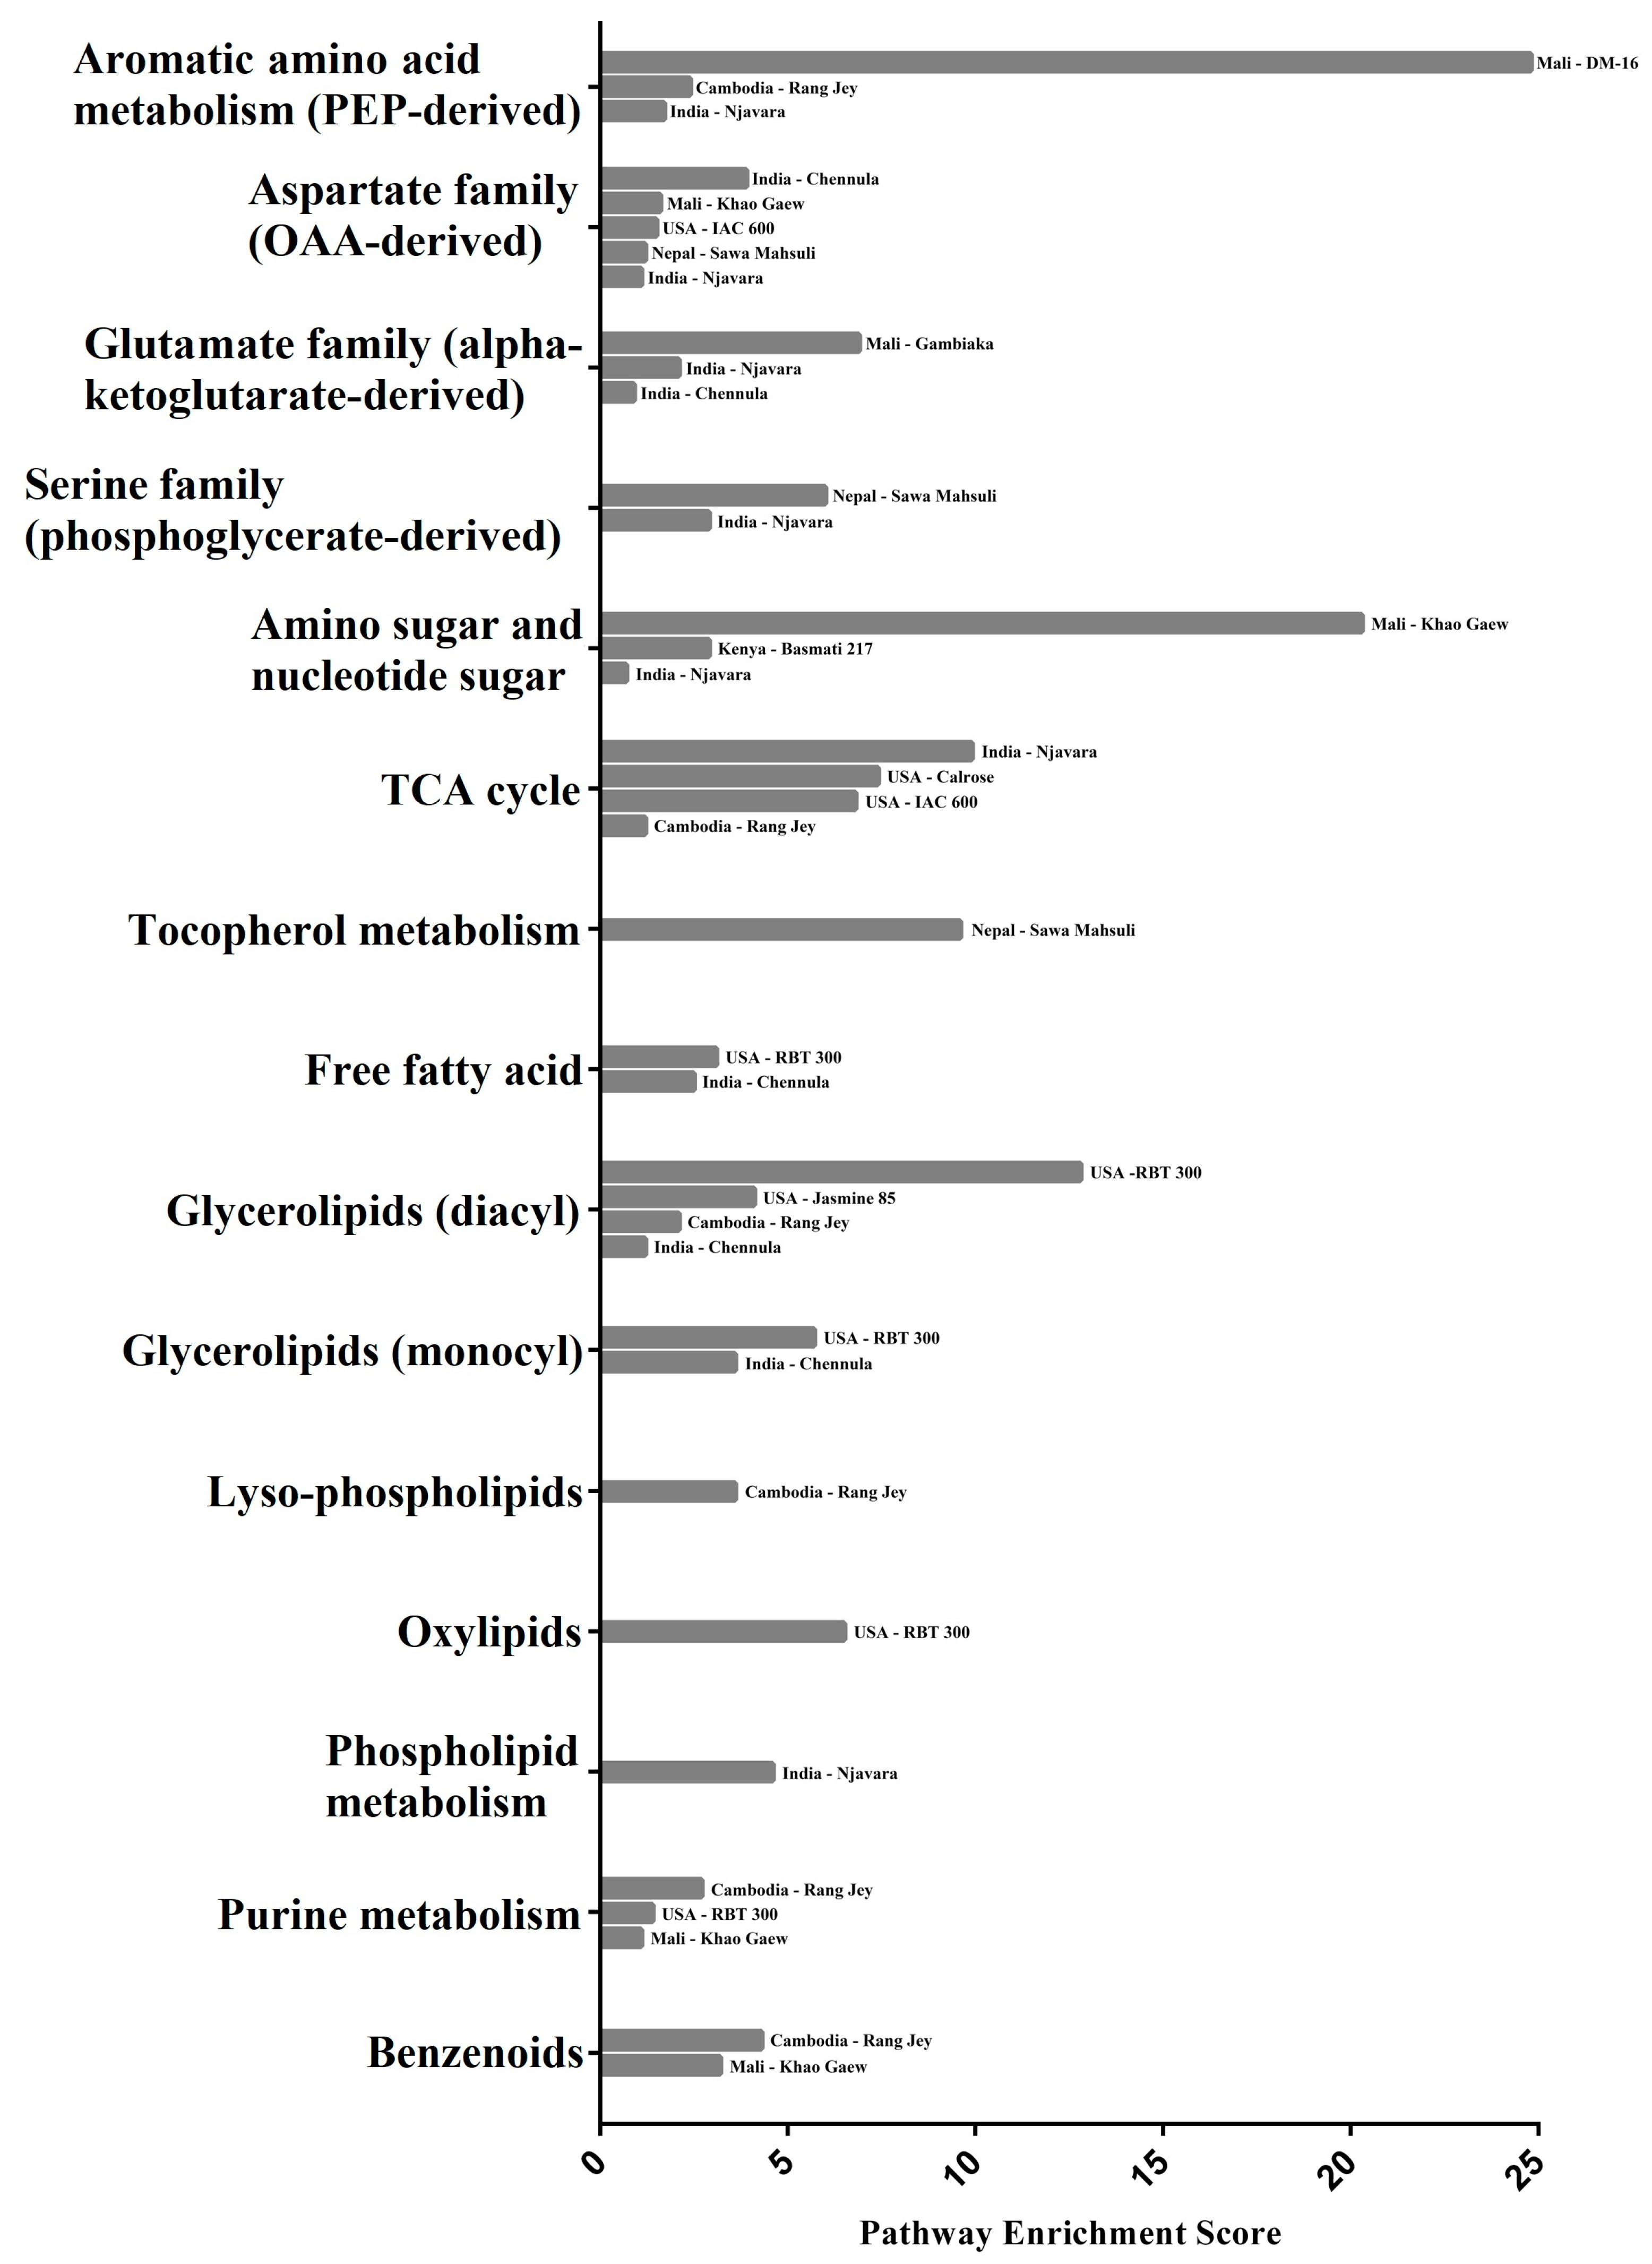
2.5. Integration of Rice Bran Metabolites, Metabolic Pathways, and Rice Genes

Figure 3 shows the Pathways Enrichment Score (PES) for 15 metabolic pathways in cultivars that contained one or more metabolites with significant Z-scores among the 71 discriminating rice bran metabolites. A complete list of all PES is shown in Supplementary Table S3.

2.5.1. Amino Acid Metabolic Pathway Enrichment Scores and Gene Associations

Amino acids contained four metabolic pathways with PES distinctions, including aromatic amino acids (PEP-derived), aspartate family (OAA-derived), glutamate family (α-ketoglutarate-derived), and serine family (phosphoglycerate-derived), which involve the 21 amino acids that differed among the cultivars, including four aromatic amino acids (PEP-derived), seven aspartate family (OAA-derived), nine glutamate family (α-ketoglutarate-derived), and two serine family (phosphoglycerate-derived), as shown in Supplementary Table S2. DM-16 rice bran had low and high abundances of quinate and serotonin, respectively, which had the highest PES for the aromatic amino acid (PEP-derived) pathway (PES = 24.8). Chennula rice bran had the highest PES for the aspartate family (OAA-derived) pathway (PES = 3.9), and the low relative abundances of three amino acids, namely lysine, N6,N6,N6-trimethyllysine, and threonine explained this difference. Gambiaka rice bran had the highest PES for the glutamate family (α-ketoglutarate-derived) pathway (PES = 6.9) and a high relative abundance of N-methylproline, stachydrine, and trans-4-hydroxyproline explained this difference. Sawa Mahsuli rice bran had the highest PES for the serine family (phosphoglycerate-derived) pathway (PES = 6.0) when compared to the other cultivars. Differentially higher abundances of glycine in this cultivar were the contributors to this difference (Figure 3).

2.5.2. Carbohydrate Metabolic Pathway Enrichment Scores and Gene Associations

The carbohydrate chemical class contained two metabolic pathways with significant PES, and included amino sugars and nucleotide sugars, and the TCA cycle. Seven discriminating metabolites explained these changes, including four amino sugars and nucleotide sugars, and three TCA cycle metabolites. Rice genes involved in the biosynthesis of metabolites under the TCA cycle metabolic pathways are shown in Table 3. There were no genes identified for metabolites under the amino sugar and nucleotide sugar metabolic pathways. Khao Gaew rice bran had the highest PES for the amino sugar and nucleotide sugar pathway (PES = 20.3), and this was due to the low relative abundance of arabonate/xylonate and ribonate. Njavara rice bran had the highest PES for the TCA cycle across all cultivars (PES = 9.9) due to glucosamine, aconitate, and α-ketoglutarate having the lowest abundances among the cultivars (Figure 3).

2.5.3. Cofactors and Vitamins Metabolic Pathway Enrichment Scores and Gene Associations

Cofactors & vitamins were associated with the tocopherol metabolic pathway, whereby the Sawa Mahsuli rice bran had the highest score (PES = 9.6) due to a lower relative abundance of γ-tocopherol/β-tocopherol and γ-tocotrienol, as compared to other cultivars (Figure 3). Rice genes involved in the biosynthesis of metabolites under the tocopherol metabolic pathway are shown in Table 3.

2.5.4. Lipids Metabolic Pathway Enrichment Scores and Gene Associations

The 33 lipid metabolites that explained these changes in PESs included seven free fatty acids, 14 glycerolipids (diacyl), four glycerolipids (monoacyl), three lyso-phospholipids, three oxylipins, and two phospholipids. Rice genes involved in the biosynthesis of metabolites under free fatty acids, oxylipins, and phospholipid pathways are shown in Table 2. There were no genes that were identified for metabolites under the monoacyl and diacyl glycerolipids, and lyso-phospholipid metabolic pathway. RBT 300 had the lowest relative abundance for the majority of lipids (20 lipids), which explain the highest PES for the free fatty acid pathway (PES = 3.1), glycerolipids (diacyl) pathway (PES = 12.8), glycerolipids (monoacyl) pathway (PES = 5.7), and oxylipins pathway (PES = 6.5). Rang Jey rice bran had the highest PES for the lyso-phospholipids pathway (PES = 3.6), and low abundances of 1-linoleoyl-glycerophosphoethanolamine (GPE) (18:2), 1-palmitoyl-GPC (16:0), and 1-palmitoyl-GPE (16:0) explain this significance. Njavara rice bran was another cultivar with highest PES for phospholipid metabolism (PES = 4.6), and a low abundance of glycerophosphoglycerol and GPC explain this significance (Figure 3).

2.5.5. Nucleotide Metabolic Pathway Enrichment Scores and Gene Associations

Within the nucleotides, a PES of 2.7 was identified for purine metabolism, with Rang Jey rice bran having the highest score. This PES was the result of a lower relative abundance of adenosine in this cultivar, compared to others (Figure 3). Rice genes involved in the biosynthesis of metabolites under the purine metabolic pathway are shown in Table 4.

2.5.6. Secondary Metabolite Pathway Enrichment Scores and Gene Associations

Secondary metabolites that were expressed differently among the cultivars included two benzenoid pathway metabolites, namely, 4-hydroxybenzoate and salicylate. Rang Jey had the highest relative abundance for 4-hydroxybenzoate, and Khao Gaew had the lowest relative abundance for salicylate; thus the highest pathway enrichment score for Rang Jey (PES = 4.3), followed by Khao Gaew (PES = 3.2) (Figure 3). Rice genes involved in the biosynthesis of salicylate are shown in Table 4. No genes were identified for 4-hydroxybenzoate in the database.

3. Discussion

This comparative global rice bran metabolomics investigation led to the high throughput and sensitive identification of over 450 diverse rice bran metabolites/phytochemicals. Rice bran metabolites stem from multiple chemical classes, and metabolic pathways involved in rice seed development. The rice bran metabolomics analysis of 17 global cultivars revealed substantial variation in both the presence and abundance of metabolites from distinct chemical classes (~36% of entire metabolite profile), as well as from a ‘core’ rice bran metabolite profile (~74% of metabolites). Rice bran has been shown to be feasible for dietary use [11,23,49], and it is a valuable nutritional addition to polished rice, especially in the geographic regions where rice is one of the primary food sources. Moreover, rice is a staple crop in many low–middle-income countries where malnutrition remains a major problem [50,51]. Evaluating the nutritional and health benefits of rice bran is enhanced by using a global metabolomics approach. The 71 discriminating rice bran metabolites that varied among these 17 cultivars that were collected from diverse field environments should be considered in breeding, due to the presence of nutritionally- and medicinally-valuable bran metabolites.
A few examples of amino acids with health benefits that were identified herein are quinate and serotonin from the aromatic amino acid metabolic pathway (PEP-derived) that has been shown to be anti-inflammatory [52] and antiemetic [53], respectively. This metabolome analysis showed that the abundance of quinate and serotonin were significantly lower and higher, respectively, in DM-16 (produced in Mali, West Africa) when compared to other rice brans. An increased relative abundance of glycine and pipecolate was also observed in Sawa Mahsuli (produced in Nepal). Glycine was shown to have anti-diarrheal [54], anti-inflammatory [55], antioxidant [56], cancer chemoprevention [57], and anti-obesity properties [58]. Pipecolate was shown to have cancer chemoprevention properties, as this phytochemical serves as a precursor to gut microbial secondary metabolites production, such as such as rapamycin, swainsonine, virginiamycin, and marcfortine that exhibit anti-inflammatory, antitumor, and antibiotic properties [59].
Carbohydrates, vitamins, and lipids of interest to improve animal and human health, differed in abundance across cultivars. Malate, a carbohydrate from the TCA cycle, was detected, and it had a higher relative abundance in Calrose (USA grown) when compared to other cultivars. In the human body, malate is important to energy metabolism during both aerobic and anaerobic conditions [60,61], and it was shown that a deficiency of malate may be a major cause of physical exhaustion [61]. Malate has also been reported to have natural antimicrobial activity against Salmonella typhimurium and other microbial pathogens [62]. Given that rice bran, and in particular the Calrose cultivar, is a good source of malate, it could be used to replenish the endogenous malate in the body, and warrants further attention for nutritional and breeding programs.
The Sawa Mahsuli cultivar from Nepal showed lower relative abundance of γ-tocopherol and γ-tocotrienol when compared to other cultivars, and it should be considered as a genetic resource for crop improvement, because total vitamin E contents found in rice bran are associated with health benefits [63]. γ-tocopherol, the primary form of vitamin E in food in the USA [64], and γ-tocotrienol, a safe and well-tolerated form of vitamin E [65], have demonstrated a broad range of disease fighting activities, including but not limited to anti-inflammatory [66] and anti-hypertension actions [67].
In the context of lipid metabolites, two bran sources that demonstrate the value of nutritional breeding considerations are RBT 300 (USA derived) and Jasmine 85 cultivar (USA grown). RBT 300, a blend of rice bran from California where Calrose cultivars predominate, was shown to be lower in the relative abundance of lipids, including linolenate (alpha or gamma), an essential fatty acid (omega-3 or omega-6, respectively), which is not synthesized by mammals [68]. Jasmine 85 was also shown to be low in relative abundance of four diacylglycerolipids, namely, two isomers of palmitoyl-linoleoyl-glycerol (16:0/18:2), palmitoyl-oleoyl-glycerol (16:0/18:1), and palmitoyl-palmitoyl-glycerol (16:0/16:0). These diacylglycerols are important to the diet because they deliver two distinctly important fatty acids. For example, palmitoyl-linoleoyl-glycerol (16:0/18:2) consists of palmitic acid and linoleic acid. Palmitic acid exerts multiple fundamental biological functions [69]. On the other hand, linoleic acid has been shown to be anticarcinogenic [70], and it reduces the risk of atherosclerosis in rabbits [71]. α-linoleic acid (ALA) acts as the precursor of eicosapentaenoic acid (EPA) and docosahexaenoic acid (DHA) [72]. Thus, ALA from rice bran may have as many beneficial effects as EPA and DHA to promote human health. Studies on humans and rodents have shown that the synthesis of anti-inflammatory prostaglandin E1 was selectively elevated through γ-linoleic acid supplementation [73]. Future studies should consider using rice bran lipids from bran or whole grain rice, as they may demonstrate beneficial effects when compared to consuming these lipids as isolated supplements.
Other metabolites from this study that varied by cultivar, and that should be considered for importance to human health, were 4-hydroxybenzoate and salicylate. The 4-hydroxybenzoate had a higher relative abundance in Rang Jay (grown in Cambodia), and this compound has established antimicrobial properties [62,74], as well as antioxidant [75] actions. Salicylate, a phytochemical with a broad function in plant growth and development [76], is also an active component of aspirin, and it has well-documented anti-diabetic, anti-inflammatory, and cardio-protective properties [77,78]. It has the potential to be improved through selective breeding programs in Khao Gaew (from Mali), as salicylate had the lowest degree of abundance in this cultivar.
The rice bran phytochemical diversity that was observed among 17 cultivars produced in geographically diverse field environments included bran molecules that were present at very low levels, and which have been typically overlooked in targeted studies. For example, taurine was only recently shown to exist in rice bran [13], and this study verifies its lower abundance across cultivars and regions. Taurine is a known antioxidant and an anti-inflammatory agent, as well as a powerful scavenger of hypochlorous acid [79,80]. These effects of taurine may be also related to the prevention of obesity by increasing the energy metabolism in white adipose tissue [81]. In other studies, taurine was found to have antiepileptic actions [82], and to be neuroprotective against glutamate excitotoxicity [83].
Understanding the genes involved in biosynthesis of bran specific metabolites that are distinct from the rest of the grain is essential to improve nutritional and medicinal value of the bran and the whole grain (brown) rice. Increasing our understanding of the rice genes involved in the biosynthetic pathways of bran composition, such as lipid biosynthetic pathways are noteworthy, as these genes were largely missing from the integrated database (Table 3). Enhancing the rice bran amino acid and lipid contents, as well as many other phytochemicals, such as recently shown for tricin [84], may be beneficial to co-develop with high-yielding rice cultivars. Genome-wide association study (GWAS) using cultivar diversity panels [85,86] and quantitative trait locus (QTL) mapping in structured bi-parental populations [6,87,88], when coupled with rice bran metabolomics, offer a novel means of gene discovery and crop improvement. This emerging field of phytochemical genomics, integrating genomic, proteomic, and metabolomic approaches, has been used in crop improvement for barley [89], corn [90,91], potato [92], and tomato [93,94]. We put forth that the study and identification of rice genes underlying the nutritional and medicinal traits in rice bran deserve investigation to realize the tremendous potential impact of rice bran in global nutritional security.
Rice bran variation in the composition of bioactive molecules has functional relevance to rice breeders that seek to improve bran for human and animal health. The results of this study support the feasibility that numerous phytochemicals that have reported medicinal mechanisms of action can be improved in rice bran through breeding [13,14,95]. Rice bran, regardless of varietal differences, has a valuable ‘core’ metabolome, as well as a variable set of metabolites that differ among cultivars, which can be developed as an affordable food ingredient for a diverse global population that remains challenged to meet basic nutritional security needs. The identification of 71 metabolites and the ~1500 rice genes associated with the 15 metabolic pathways are significant results obtained herein that distinguish Oryza sativa cultivars and that support the use of bran small molecules as bio-markers. The current understanding of the genetic basis for the type and quantity of metabolites, and the metabolic pathways that exist in rice bran is sufficient to start breeding rice cultivars that contain optimal profiles for some rice bran metabolites that will benefit animal and human health.

4. Materials and Methods

4.1. Rice Cultivars and the Heat Stabilization of Bran

Rice bran was isolated from 17 rice cultivars that originated from 11 countries and that were grown in seven countries including Cambodia, India, Kenya, Mali, Nepal, Nicaragua, and the United States, all having emerging interests in producing functional foods [9,10,23]. The phenotypes of all cultivars are described in Table 5. All the samples were stored as rough rice (paddy rice) until milling, to prevent any nutrient and chemical changes. Furthermore, the rice grain was milled using a Yamamoto test whitening machine Rice pal VP-31 T grinder and milling system. The milling process was performed at room temperature with 12% bran removal from the brown rice. Immediately after the milling, raw rice bran was heat-stabilized (110 °C for 6 min) to prevent rancidity, and then stored at −20 °C until further processing for metabolomics.

4.2. Rice Bran Metabolite Extraction and Sample Preparation

Metabolon Inc. (Durham, NC, USA) performed the global, non-targeted metabolomics. Prior to extraction, 10 recovery standards (i.e., quality controls) were added into the samples. Rice bran samples were extracted as previously described [13]. Briefly, following cryo-ground processing, all rice bran samples containing 100 mg (±2 mg) as a powder were cryo-weighted into 1.5 mL microcentrifuge tubes, and 80% methanol was added. Samples then underwent vigorous shaking for 2 min (Glen Mills GenoGrinder 2000), followed by centrifugation to precipitate the protein and to separate the small molecules from the macromolecules. The attained supernatant extract (i.e., rice bran extract) was divided into four fractions for different modes of analysis by ultrahigh performance liquid chromatography-tandem mass spectroscopy (UPLC-MS/MS), including reverse-phase chromatography with positive/negative ion mode electrospray ionization for non-polar compounds, and hydrophilic-interaction chromatography (HILIC) UPLC-MS/MS with positive/negative ion mode electrospray ionization for the analysis of polar compounds. Prior to injection, samples were placed on TurboVap® (Zymark, Hopkinton, MA, USA) evaporator to make sure that there is no organic solvent remaining.

4.3. UPLC-MS/MS Analysis

The non-targeted metabolomics analysis was based on previously described methods [13]. Briefly, a Waters ACQUITY UPLC coupled with a Thermo Scientific Q-Exactive high resolution/accurate mass spectrometer interfaced with a heated electrospray ionization (HESI-II) source and Orbitrap mass analyzer was utilized. The dried rice bran extract was reconstituted in UPLC-compatible solvents (acidic or basic solvents) for each mode of analysis. For the acidic solution, the rice bran extract was analyzed once for hydrophilic compounds, and once for hydrophobic compounds. For hydrophilic compounds, the extract was eluted from a C18 column (Waters UPLC BEH C18-2.1 × 100 mm, 1.7 µm) using water and methanol, containing 0.05% perfluoropentanoic acid and 0.1% formic acid in a gradient manner. For the hydrophobic compounds, the extract was gradient-eluted from the same C18 column and solvent mentioned, with added acetonitrile.
Similar to the acidic mode, in the basic solution, rice bran extract was once analyzed for hydrophilic compounds and once for hydrophobic compounds using a similar C18. For more hydrophobic and positive ion compound extraction, water, methanol, and 6.5 mM ammonium bicarbonate at pH 8.0 was used to elute the rice bran extracts from the C18 column. For more hydrophilic and more negative ion compounds, the extract was analyzed and eluted through an interaction liquid chromatography (HILIC) column (Waters UPLC BEH Amide 2.1 × 150 mm, 1.7 µm) using a gradient consisting of water and acetonitrile and 10 mM ammonium formate, at pH 10.8. Using dynamic exclusion, the mass spectrometry analysis was interchanged between MS and data-dependent MS2 scans with a scan range of 70–1000 m/z.

4.4. Metabolite Data Extraction and Compound Identification

Biochemical identifications from UPLC-MS was completed using the Metabolon in-house developed peak detection and integration software based on three criteria: retention index, accurate mass match to the National Institute of Standards and Technology library within ±0.005 atomic mass units, and tandem mass spectrometry (MS/MS) scores between the generated data from the experiment and standards. This software uses standard industry approaches for MS peak detection, including using minimum height, signal-to-noise, width, and area [13]. Compounds were identified by cross-comparison to library entries of purified standards that contains the retention time/index (RI), mass to charge ratio (m/z), and chromatographic data (including MS/MS spectral data). The MS/MS scores are based on a comparison of the ions present in the experimental spectrum to the ions present in the library spectrum. There are more than 3300 commercially purified standard compounds registered in Metabolon Laboratory Information Management System for distribution to LC-MS platform for determination of their analytical characteristics. Each rice bran metabolite was then cross-checked for an associated number in the Kyoto Encyclopedia of Genes and Genomes (KEGG), Human Metabolome Database (HMDB), and PubChem databases.

4.5. Metabolic Pathway Analysis

Across all 17 rice bran varieties, the metabolome analysis comprised 53 metabolic pathways, and each metabolite was assigned to one pathway. Using the following equation, pathway enrichment score (PES) was calculated, where “k” correspond to the number of metabolites with Z-score of ±2 or larger in a metabolic pathway, “m”, corresponding to the total number of metabolites identified in that pathway, “n”, correspond to the total number of significant metabolites in the dataset, and “N” corresponds to the total number of identified metabolites in the entire dataset:
k / m n / N
Metabolic pathways that had a PES of less then or greater than 1 indicated that the pathway contained one or more differentially expressed metabolites, compared to all other pathways.

4.6. Rice Biosynthetic Gene Identification for Selected Rice Bran Metabolites

The Oryza sativa (japonica group-based) OryzaCyc 4.0, Plant Metabolic Network (PMN) database was used to identify rice biosynthetic genes that produce selected bran metabolites that were involved in human and animal health promotion. Bran metabolites selected for rice gene analysis had Z-score of ±2 or larger when comparing the 17 cultivars in the metabolomics dataset. The rice gene and bran metabolite linkages can be verified at (http://plantcyc.org/databases/oryzacyc/4.0). It is notable that a limitation arises from the fact that the rice genome database is limited to japonica sub-population, and it may differ for the indica sub-population [96].

4.7. Statistical Analysis

Median-scaled relative abundance and Z-score for each of the metabolites and across all cultivars were calculated as previously described [13]. Z-score calculation was based on median-scaled relative abundances and reported as standard deviations from the mean, and it was calculated using the following formula:
Z   =   x μ σ
where relative abundance of the metabolite is expressed as “x”, the mean of relative abundance for the metabolite across 17 rice brans is expressed as “μ”, and the relative abundance standard deviation of same metabolite across 17 cultivars is expressed as “σ”. A notable Z-score for a metabolite shows that the relative abundance of that metabolite in a specific cultivar is lower or higher than the standard deviations from the mean of other cultivars. For each variety, metabolites with a Z-score that is greater than 2 or that is less than −2 (Z-score > |2.0|) were considered to be distinguishers of that variety. Furthermore, a principal component analysis (PCA) was completed using SIMCA (Sartorius Stedim Biotech) to assess the overall variability in the global metabolite profile of bran from 17 rice cultivars using median-scaled relative abundance values. However, the country in which the rice cultivar originated from or was grown in was not a variable in the PCA as the means to focus differences in rice varieties that are available to consumers in various countries.

Supplementary Materials

The following are available online at https://www.mdpi.com/2218-1989/8/4/63/s1, Supplementary Table S1: List of all the identified metabolites in bran of 17 rice cultivars with their relative abundances, Supplementary Table S2: Z-scores and relative abundances of 71 significant metabolites, Supplementary Table S3: Metabolic pathway enrichment scores (PES) for discriminating metabolites between rice bran varieties.

Author Contributions

E.P.R. and I.Z. designed and conducted the research; I.Z. conducted the metabolome analysis and wrote the manuscript. E.L. and I.Z. investigated the gene-metabolite relationship. J.E.L., A.M., S.V., and O.K. among others, acknowledged below assisted in the rice bran collection from the field and classification from diverse countries. All authors read and approved the final manuscript.

Funding

This work was supported by a Grand Explorations in Global Health grant (OPP1015267) from the Bill and Melinda Gates Foundation, the National Institute of Food and Agriculture (NIFA) (004228-00002), and an international doctoral training fellowship in Agroecosystem Health from Colorado State University.

Acknowledgments

We thank George Thomas, John N. Kinyuru, Job Mapesa, and Tavia Mirassou-Wolf, for their contribution to collect rice bran from India, Kenya, and Cambodia, and to all the students and our international collaborators for their assistance in the collection of rice bran for the global varieties from multiple countries. We would like to thank Nora Jean Nealon and Katherine Li for internal editorial reviews. The authors declare that they have no competing interests.

Conflicts of Interest

The authors declare no conflict of interest.

References

  1. Sarla, N.; Swamy, B.P.M. Oryza glaberrima: A source for the improvement of Oryza sativa. Curr. Sci. 2005, 89, 955–963. [Google Scholar]
  2. Khush, G.S. What it will take to Feed 5.0 Billion Rice consumers in 2030. Plant Mol. Biol. 2005, 59, 1–6. [Google Scholar] [CrossRef] [PubMed]
  3. Gani, A.; Wani, S.; Masoodi, F.; Hameed, G. Whole-grain cereal bioactive compounds and their health benefits: A review. J. Food Process. Technol. 2012, 3, 146–156. [Google Scholar] [CrossRef]
  4. Cosslett, T.L.; Cosslett, P.D. Sustainable Development of Rice and Water Resources in Mainland Southeast Asia and Mekong River Basin; Springer: Singapore, 2018. [Google Scholar]
  5. Sánchez, B.; Rasmussen, A.; Porter, J.R. Temperatures and the growth and development of maize and rice: A review. Glob. Chang. Biol. 2014, 20, 408–417. [Google Scholar] [CrossRef] [PubMed]
  6. Kusano, M.; Yang, Z.; Okazaki, Y.; Nakabayashi, R.; Fukushima, A.; Saito, K. Using metabolomic approaches to explore chemical diversity in rice. Mol. Plant 2015, 8, 58–67. [Google Scholar] [CrossRef] [PubMed] [Green Version]
  7. Food and Agricultur Organization of the United Nation. FAO Rice Market Monitor (RMM). Available online: http://www.fao.org/economic/est/publications/rice-publications/rice-market-monitor-rmm/en/ (accessed on 27 April 2018).
  8. Van Hoed, V.; Depaemelaere, G.; Ayala, J.V.; Santiwattana, P.; Verhe, R.; De Greyt, W. Influence of chemical refining on the major and minor components of rice brain oil. J. Am. Oil Chem.Soc. 2006, 83, 315–321. [Google Scholar] [CrossRef]
  9. Henderson, A.J.; Ollila, C.A.; Kumar, A.; Borresen, E.C.; Raina, K.; Agarwal, R.; Ryan, E.P. Chemopreventive properties of dietary rice bran: Current status and future prospects. Adv. Nutr. 2012, 3, 643–653. [Google Scholar] [CrossRef] [PubMed]
  10. Borresen, E.C.; Ryan, E.P. Rice bran: A food ingredient with global public health opportunities. Wheat Rice Dis. Prev. Health 2014, 2014, 301–310. [Google Scholar]
  11. Borresen, E.C.; Brown, D.G.; Harbison, G.; Taylor, L.; Fairbanks, A.; O’Malia, J.; Bazan, M.; Rao, S.; Bailey, S.M.; Wdowik, M.; et al. A Randomized Controlled Trial to Increase Navy Bean or Rice Bran Consumption in Colorectal Cancer Survivors. Nutr. Cancer 2016, 68, 1269–1280. [Google Scholar] [CrossRef] [PubMed] [Green Version]
  12. Alauddina, A.; Islam, J.; Shirakawaa, H.; Koseki, T.; Ardiansyah, A.; Komai, M. Rice Bran as a Functional Food: An Overview of the Conversion of Rice Bran into a Superfood/Functional Food; InTechOpen: London, UK, 2017. [Google Scholar]
  13. Zarei, I.; Brown, D.G.; Nealon, N.J.; Ryan, E.P. Rice Bran Metabolome Contains Amino Acids, Vitamins & Cofactors, and Phytochemicals with Medicinal and Nutritional Properties. Rice 2017, 10, 24. [Google Scholar] [CrossRef] [PubMed]
  14. Brown, D.G.; Borresen, E.C.; Brown, R.J.; Ryan, E.P. Heat-stabilised rice bran consumption by colorectal cancer survivors modulates stool metabolite profiles and metabolic networks: A randomised controlled trial. Br. J. Nutr. 2017, 117, 1244–1256. [Google Scholar] [CrossRef] [PubMed]
  15. Xu, Z.; Godber, J.S. Purification and Identification of Components of γ-Oryzanol in Rice Bran Oil. J. Agric. Food Chem. 1999, 47, 2724–2728. [Google Scholar] [CrossRef] [PubMed]
  16. Xu, Z.; Hua, N.; Godber, J.S. Antioxidant Activity of Tocopherols, Tocotrienols, and γ-Oryzanol Components from Rice Bran against Cholesterol Oxidation Accelerated by 2,2′-Azobis(2-methylpropionamidine) Dihydrochloride. J. Agric. Food Chem. 2001, 49, 2077–2081. [Google Scholar] [CrossRef] [PubMed]
  17. Stoggl, W.; Huck, C.; Wongyai, S.; Scherz, H.; Bonn, G. Simultaneous determination of carotenoids, tocopherols, and gamma-oryzanol in crude rice bran oil by liquid chromatography coupled to diode array and mass spectrometric detection employing silica C30 stationary phases. J. Sep. Sci. 2005, 28, 1712–1718. [Google Scholar] [CrossRef] [PubMed]
  18. Parrado, J.; Miramontes, E.; Jover, M.; Gutierrez, J.F.; Collantes de Terán, L.; Bautista, J. Preparation of a rice bran enzymatic extract with potential use as functional food. Food Chem. 2006, 98, 742–748. [Google Scholar] [CrossRef]
  19. Chen, F.; Wang, Z.; Zhao, G.; Liao, X.; Cai, T.; Guo, L.; Hu, X. Purification process of octacosanol extracts from rice bran wax by molecular distillation. J. Food Eng. 2007, 79, 63–68. [Google Scholar] [CrossRef]
  20. Sugihara, N.; Kanda, A.; Nakano, T.; Nakamura, T.; Igusa, H.; Hara, S. Novel Fractionation Method for Squalene and Phytosterols Contained in the Deodorization Distillate of Rice Bran Oil. J. Oleo Sci. 2010, 59, 65–70. [Google Scholar] [CrossRef] [PubMed] [Green Version]
  21. De Deckere, E.A.; Korver, O. Minor constituents of rice bran oil as functional foods. Nutr. Rev. 1996, 54, S120–S126. [Google Scholar] [CrossRef] [PubMed]
  22. Liu, L.; Wen, W.; Zhang, R.; Wei, Z.; Deng, Y.; Xiao, J.; Zhang, M. Complex enzyme hydrolysis releases antioxidative phenolics from rice bran. Food Chem. 2017, 214, 1–8. [Google Scholar] [CrossRef] [PubMed]
  23. Kinyuru, J.N.; Borresen, E.C.; Ryan, E.P. Nutritional and Safety Evaluation of Heat-Stabilized Rice Bran for Sup-plementary Feeding of Malnourished Children in Kenya. Int. J. Food Sci. Nutr. Diet 2015, 4, 226–232. [Google Scholar] [CrossRef]
  24. Sheflin, A.M.; Borresen, E.C.; Kirkwood, J.S.; Boot, C.M.; Whitney, A.K.; Lu, S.; Brown, R.J.; Broeckling, C.D.; Ryan, E.P.; Weir, T.L. Dietary supplementation with rice bran or navy bean alters gut bacterial metabolism in colorectal cancer survivors. Mol. Nutr. Food Res. 2017, 61. [Google Scholar] [CrossRef] [PubMed]
  25. Borresen, E.C.; Jenkins-Puccetti, N.; Schmitz, K.; Brown, D.G.; Pollack, A.; Fairbanks, A.; Wdowik, M.; Rao, S.; Nelson, T.L.; Luckasen, G.; et al. A Pilot Randomized Controlled Clinical Trial to Assess Tolerance and Efficacy of Navy Bean and Rice Bran Supplementation for Lowering Cholesterol in Children. Glob. Pediatr. Health 2017, 4. [Google Scholar] [CrossRef] [PubMed]
  26. Lai, M.-H.; Chen, Y.-T.; Chen, Y.-Y.; Chang, J.-H.; Cheng, H.-H. Effects of rice bran oil on the blood lipids profiles and insulin resistance in type 2 diabetes patients. J. Clin. Biochem. Nutr. 2012, 51, 15–18. [Google Scholar] [CrossRef] [PubMed]
  27. Choi, S.P.; Kim, S.P.; Kang, M.Y.; Nam, S.H.; Friedman, M. Protective Effects of Black Rice Bran against Chemically-Induced Inflammation of Mouse Skin. J. Agric. Food Chem. 2010, 58, 10007–10015. [Google Scholar] [CrossRef] [PubMed]
  28. Qureshi, A.A.; Bradlow, B.A.; Salser, W.A.; Brace, L.D. Novel tocotrienols of rice bran modulate cardiovascular disease risk parameters of hypercholesterolemic humans. J. Nutr. Biochem. 1997, 8, 290–298. [Google Scholar] [CrossRef]
  29. Verschoyle, R.D.; Greaves, P.; Cai, H.; Edwards, R.E.; Steward, W.P.; Gescher, A.J. Evaluation of the cancer chemopreventive efficacy of rice bran in genetic mouse models of breast, prostate and intestinal carcinogenesis. Br. J. Cancer 2007, 96, 248–254. [Google Scholar] [CrossRef] [PubMed] [Green Version]
  30. Badr El-Din, N.K.; Ali, D.A.; Othman, R.; Ghoneum, M. Abstract 5259: Prevention of hepatocarcinogenesis in rats by arabinoxylan rice bran, MGN-3/Biobran. Cancer Res. 2016, 76, 5259. [Google Scholar] [CrossRef]
  31. Yang, Z.; Nakabayashi, R.; Mori, T.; Takamatsu, S.; Kitanaka, S.; Saito, K. Metabolome Analysis of Oryza sativa (Rice) Using Liquid Chromatography-Mass Spectrometry for Characterizing Organ Specificity of Flavonoids with Anti-inflammatory and Anti-oxidant Activity. Chem. Pharm. Bull. 2016, 64, 952–956. [Google Scholar] [CrossRef] [PubMed]
  32. Mahender, A.; Anandan, A.; Pradhan, S.K.; Pandit, E. Rice grain nutritional traits and their enhancement using relevant genes and QTLs through advanced approaches. Springer Plus 2016, 5, 2086. [Google Scholar] [CrossRef] [PubMed]
  33. Park, H.Y.; Lee, K.W.; Choi, H.D. Rice bran constituents: Immunomodulatory and therapeutic activities. Food Funct. 2017, 8, 935–943. [Google Scholar] [CrossRef] [PubMed]
  34. Ryan, E.P. Bioactive food components and health properties of rice bran. J. Am. Vet. Med. Assoc. 2011, 238, 593–600. [Google Scholar] [CrossRef] [PubMed]
  35. Maruyama, K.; Urano, K.; Yoshiwara, K.; Morishita, Y.; Sakurai, N.; Suzuki, H.; Kojima, M.; Sakakibara, H.; Shibata, D.; Saito, K.; et al. Integrated Analysis of the Effects of Cold and Dehydration on Rice Metabolites, Phytohormones, and Gene Transcripts. Plant Physiol. 2014, 164, 1759. [Google Scholar] [CrossRef] [PubMed]
  36. Navarro-Reig, M.; Jaumot, J.; Pina, B.; Moyano, E.; Galceran, M.T.; Tauler, R. Metabolomic analysis of the effects of cadmium and copper treatment in Oryza sativa L. using untargeted liquid chromatography coupled to high resolution mass spectrometry and all-ion fragmentation. Metallomics 2017, 9, 660–675. [Google Scholar] [CrossRef] [PubMed]
  37. Masumoto, C.; Miyazawa, S.-I.; Ohkawa, H.; Fukuda, T.; Taniguchi, Y.; Murayama, S.; Kusano, M.; Saito, K.; Fukayama, H.; Miyao, M. Phosphoenolpyruvate carboxylase intrinsically located in the chloroplast of rice plays a crucial role in ammonium assimilation. Proc. Natl. Acad. Sci. USA 2010, 107, 5226–5231. [Google Scholar] [CrossRef] [PubMed] [Green Version]
  38. Okazaki, Y.; Otsuki, H.; Narisawa, T.; Kobayashi, M.; Sawai, S.; Kamide, Y.; Kusano, M.; Aoki, T.; Hirai, M.Y.; Saito, K. A new class of plant lipid is essential for protection against phosphorus depletion. Nat. Commun. 2013, 4, 1510. [Google Scholar] [CrossRef] [PubMed] [Green Version]
  39. Chen, W.; Gong, L.; Guo, Z.; Wang, W.; Zhang, H.; Liu, X.; Yu, S.; Xiong, L.; Luo, J. A Novel Integrated Method for Large-Scale Detection, Identification, and Quantification of Widely Targeted Metabolites: Application in the Study of Rice Metabolomics. Mol. Plant 2013, 6, 1769–1780. [Google Scholar] [CrossRef] [PubMed]
  40. Mahdavi, V.; Farimani, M.M.; Fathi, F.; Ghassempour, A. A targeted metabolomics approach toward understanding metabolic variations in rice under pesticide stress. Anal. Biochem. 2015, 478, 65–72. [Google Scholar] [CrossRef] [PubMed]
  41. Kusano, M.; Fukushima, A.; Kobayashi, M.; Hayashi, N.; Jonsson, P.; Moritz, T.; Ebana, K.; Saito, K. Application of a metabolomic method combining one-dimensional and two-dimensional gas chromatography-time-of-flight/mass spectrometry to metabolic phenotyping of natural variants in rice. J. Chromatogr. B 2007, 855, 71–79. [Google Scholar] [CrossRef] [PubMed]
  42. Heuberger, A.L.; Lewis, M.R.; Chen, M.-H.; Brick, M.A.; Leach, J.E.; Ryan, E.P. Metabolomic and functional genomic analyses reveal varietal differences in bioactive compounds of cooked rice. PLoS ONE 2010, 5, e12915. [Google Scholar] [CrossRef] [PubMed]
  43. Hu, C.; Shi, J.; Quan, S.; Cui, B.; Kleessen, S.; Nikoloski, Z.; Tohge, T.; Alexander, D.; Guo, L.; Lin, H.; et al. Metabolic variation between japonica and indica rice cultivars as revealed by non-targeted metabolomics. Sci. Rep. 2014, 4, 5067. [Google Scholar] [CrossRef] [PubMed]
  44. Galland, M.; He, D.; Lounifi, I.; Arc, E.; Clement, G.; Balzergue, S.; Huguet, S.; Cueff, G.; Godin, B.; Collet, B.; et al. An Integrated “Multi-Omics” Comparison of Embryo and Endosperm Tissue-Specific Features and Their Impact on Rice Seed Quality. Front. Plant Sci. 2017, 8, 1984. [Google Scholar] [CrossRef] [PubMed]
  45. Concepcion, J.C.T.; Ouk, S.; Riedel, A.; Calingacion, M.; Zhao, D.; Ouk, M.; Garson, M.J.; Fitzgerald, M.A. Quality evaluation, fatty acid analysis and untargeted profiling of volatiles in Cambodian rice. Food Chem. 2018, 240, 1014–1021. [Google Scholar] [CrossRef] [PubMed]
  46. Daygon, V.D.; Calingacion, M.; Forster, L.C.; Voss, J.J.; Schwartz, B.D.; Ovenden, B.; Alonso, D.E.; McCouch, S.R.; Garson, M.J.; Fitzgerald, M.A. Metabolomics and genomics combine to unravel the pathway for the presence of fragrance in rice. Sci. Rep. 2017, 7, 8767. [Google Scholar] [CrossRef] [PubMed]
  47. Ryan, E.P.; Heuberger, A.L.; Weir, T.L.; Barnett, B.; Broeckling, C.D.; Prenni, J.E. Rice bran fermented with saccharomyces boulardii generates novel metabolite profiles with bioactivity. J. Agric. Food Chem. 2011, 59, 1862–1870. [Google Scholar] [CrossRef] [PubMed]
  48. Chaudhary, N.; Khurana, P. Vitamin E biosynthesis genes in rice: Molecular characterization, expression profiling and comparative phylogenetic analysis. Plant Sci. 2009, 177, 479–491. [Google Scholar] [CrossRef]
  49. Katherine, J.; Li, E.C.B.; NaNet, J.-P.; Gary, L.; Elizabeth, P.R. Navy Bean and Rice Bran Intake Alters the Plasma Metabolome of Children at Risk for Cardiovascular Disease. Front. Nutr. 2017, 4, 71. [Google Scholar] [CrossRef]
  50. Trehan, I.; Manary, M.J. Management of severe acute malnutrition in low-income and middle-income countries. Arch. Dis. Child. 2015, 100, 283–287. [Google Scholar] [CrossRef] [PubMed]
  51. Rutishauser-Perera, A. Tackling the Double Burden of Malnutrition in Low and Middle-Income Countries: Response of the International Community. Available online: https://www.ennonline.net/fex/53/tacklingthedoubleburden (accessed on 12 November 2016).
  52. Yates, C.R.; Miller, D.D.; Zeng, K.; Thompson, K.E. Anti-Inflammatory Quinic Acid Derivatives for Oral Administration. U.S. Application US20090234015A1, 14 February 2012. [Google Scholar]
  53. De-Miguel, F.F.; Trueta, C. Synaptic and extrasynaptic secretion of serotonin. Cell. Mol. Neurobiol. 2005, 25, 297–312. [Google Scholar] [CrossRef] [PubMed]
  54. Naylor, J.M.; Leibel, T.; Middleton, D.M. Effect of glutamine or glycine containing oral electrolyte solutions on mucosal morphology, clinical and biochemical findings, in calves with viral induced diarrhea. Can. J. Vet. Res. 1997, 61, 43–48. [Google Scholar] [PubMed]
  55. Lu, T.-C.; Ko, Y.-Z.; Huang, H.-W.; Hung, Y.-C.; Lin, Y.-C.; Peng, W.-H. Analgesic and anti-inflammatory activities of aqueous extract from Glycine tomentella root in mice. J. Ethnopharmacol. 2007, 113, 142–148. [Google Scholar] [CrossRef] [PubMed]
  56. Ligumsky, M.; Sestieri, M.; Okon, E.; Ginsburg, I. Antioxidants Inhibit Ethanol-Induced Gastric Injury in the Rat: Role of Manganese, Glycine, and Carotene. Scand. J. Gastroenterol. 1995, 30, 854–860. [Google Scholar] [CrossRef] [PubMed]
  57. Jain, M.; Nilsson, R.; Sharma, S.; Madhusudhan, N.; Kitami, T.; Souza, A.L.; Kafri, R.; Kirschner, M.W.; Clish, C.B.; Mootha, V.K. Metabolite profiling identifies a key role for glycine in rapid cancer cell proliferation. Science 2012, 336, 1040–1044. [Google Scholar] [CrossRef] [PubMed]
  58. Tastesen, H.S.; Keenan, A.H.; Madsen, L.; Kristiansen, K.; Liaset, B. Scallop protein with endogenous high taurine and glycine content prevents high-fat, high-sucrose-induced obesity and improves plasma lipid profile in male C57BL/6J mice. Amino Acids 2014, 46, 1659–1671. [Google Scholar] [CrossRef] [PubMed] [Green Version]
  59. He, M. Pipecolic acid in microbes: Biosynthetic routes and enzymes. J. Ind. Microbiol. Biotechnol. 2006, 33, 401–407. [Google Scholar] [CrossRef] [PubMed]
  60. Bendahan, D.; Mattei, J.; Ghattas, B.; Confort-Gouny, S.; Le Guern, M.E.; Cozzone, P. Citrulline/malate promotes aerobic energy production in human exercising muscle. Br. J. Sports Med. 2002, 36, 282–289. [Google Scholar] [CrossRef] [PubMed] [Green Version]
  61. Wu, J.; Wu, Q.; Huang, J.; Chen, R. Effects of L-malate on physical stamina and activities of enzymes related to the malate-aspartate shuttle in liver of mice. Physiol. Res. 2007, 56, 213. [Google Scholar] [PubMed]
  62. Nealon, N.J.; Worcester, C.R.; Ryan, E.P. Lactobacillus paracasei metabolism of rice bran reveals metabolome associated with Salmonella Typhimurium growth reduction. J. Appl. Microbiol. 2017, 122, 1639–1656. [Google Scholar] [CrossRef] [PubMed] [Green Version]
  63. Forster, G.M.; Raina, K.; Kumar, A.; Kumar, S.; Agarwal, R.; Chen, M.H.; Bauer, J.E.; McClung, A.M.; Ryan, E.P. Rice varietal differences in bioactive bran components for inhibition of colorectal cancer cell growth. Food Chem. 2013, 141, 1545–1552. [Google Scholar] [CrossRef] [PubMed] [Green Version]
  64. Dietrich, M.; Traber, M.G.; Jacques, P.F.; Cross, C.E.; Hu, Y.; Block, G. Does γ-Tocopherol Play a Role in the Primary Prevention of Heart Disease and Cancer? A Review. J. Am. Coll. Nutr. 2006, 25, 292–299. [Google Scholar] [CrossRef] [PubMed]
  65. Meganathan, P.; Fu, J.Y. Biological Properties of Tocotrienols: Evidence in Human Studies. Int. J. Mol. Sci. 2016, 17, 1682. [Google Scholar] [CrossRef] [PubMed]
  66. Jiang, Q.; Elson-Schwab, I.; Courtemanche, C.; Ames, B.N. γ-Tocopherol and its major metabolite, in contrast to α-tocopherol, inhibit cyclooxygenase activity in macrophages and epithelial cells. Proc. Nat. Acad. Sci. USA 2000, 97, 11494–11499. [Google Scholar] [CrossRef] [PubMed]
  67. Chatelain, E.; Boscoboinik, D.O.; Bartoli, G.-M.; Kagan, V.E.; Gey, F.K.; Packer, L.; Azzi, A. Inhibition of smooth muscle cell proliferation and protein kinase C activity by tocopherols and tocotrienols. Biochim. Biophys. Acta 1993, 1176, 83–89. [Google Scholar] [CrossRef]
  68. Simopoulos, A.P. Omega-3 fatty acids in health and disease and in growth and development. Am. J. Clin. Nutr. 1991, 54, 438–463. [Google Scholar] [CrossRef] [PubMed]
  69. Carta, G.; Murru, E.; Banni, S.; Manca, C. Palmitic Acid: Physiological Role, Metabolism and Nutritional Implications. Front. Physiol. 2017, 8, 902. [Google Scholar] [CrossRef] [PubMed]
  70. Shultz, T.; Chew, B.; Seaman, W.; Luedecke, L. Inhibitory effect of conjugated dienoic derivatives of linoleic acid and β-carotene on the in vitro growth of human cancer cells. Cancer Lett. 1992, 63, 125–133. [Google Scholar] [CrossRef]
  71. Lee, K.N.; Kritchevsky, D.; Parizaa, M.W. Conjugated linoleic acid and atherosclerosis in rabbits. Atherosclerosis 1994, 108, 19–25. [Google Scholar] [CrossRef]
  72. Barceló-Coblijn, G.; Murphy, E.J. Alpha-linolenic acid and its conversion to longer chain n − 3 fatty acids: Benefits for human health and a role in maintaining tissue n − 3 fatty acid levels. Prog. Lipid Res. 2009, 48, 355–374. [Google Scholar] [CrossRef] [PubMed]
  73. Fan, Y.Y.; Chapkin, R.S. Importance of dietary gamma-linolenic acid in human health and nutrition. J. Nutr. 1998, 128, 1411–1414. [Google Scholar] [CrossRef] [PubMed]
  74. Kosova, M.; Hrádková, I.; Mátlová, V.; Kadlec, D.; Šmidrkal, J.; Filip, V. Antimicrobial effect of 4-hydroxybenzoic acid ester with glycerol. J. Clin. Pharm. Ther. 2015, 40, 436–440. [Google Scholar] [CrossRef] [PubMed]
  75. Barreca, D.; Laganà, G.; Leuzzi, U.; Smeriglio, A.; Trombetta, D.; Bellocco, E. Evaluation of the nutraceutical, antioxidant and cytoprotective properties of ripe pistachio (Pistacia vera L., variety Bronte) hulls. Food Chem. 2016, 196, 493–502. [Google Scholar] [CrossRef] [PubMed]
  76. Rivas-San Vicente, M.; Plasencia, J. Salicylic acid beyond defence: Its role in plant growth and development. J. Exp. Bot. 2011, 62, 3321–3338. [Google Scholar] [CrossRef] [PubMed]
  77. Hawley, S.A.; Fullerton, M.D.; Ross, F.A.; Schertzer, J.D.; Chevtzoff, C.; Walker, K.J.; Peggie, M.W.; Zibrova, D.; Green, K.A.; Mustard, K.J. The ancient drug salicylate directly activates AMP-activated protein kinase. Science 2012, 336, 918–922. [Google Scholar] [CrossRef] [PubMed]
  78. Ittaman, S.V.; VanWormer, J.J.; Rezkalla, S.H. The Role of Aspirin in the Prevention of Cardiovascular Disease. Clin. Med. Res. 2014, 12, 147–154. [Google Scholar] [CrossRef] [PubMed] [Green Version]
  79. Christophersen, O.A. Radiation protection following nuclear power accidents: A survey of putative mechanisms involved in the radioprotective actions of taurine during and after radiation exposure. Microb. Ecol. Health Dis. 2012, 23. [Google Scholar] [CrossRef] [PubMed]
  80. Gürer, H.; Özgünes, H.; Saygin, E.; Ercal, N. Antioxidant effect of taurine against lead-induced oxidative stress. Arch. Environ. Contam. Toxicol. 2001, 41, 397–402. [Google Scholar] [CrossRef] [PubMed]
  81. Tsuboyama-Kasaoka, N.; Shozawa, C.; Sano, K.; Kamei, Y.; Kasaoka, S.; Hosokawa, Y.; Ezaki, O. Taurine (2-aminoethanesulfonic acid) deficiency creates a vicious circle promoting obesity. Endocrinology 2006, 147, 3276–3284. [Google Scholar] [CrossRef] [PubMed]
  82. El Idrissi, A.; Messing, J.; Scalia, J.; Trenkner, E. Prevention of Epileptic Seizures by Taurine; Springer: Basel, Switzerland, 2003; pp. 515–525. [Google Scholar]
  83. Huxtable, R. Physiological actions of taurine. Physiol. Rev. 1992, 72, 101–163. [Google Scholar] [CrossRef] [PubMed]
  84. Poulev, A.; Chen, M.-H.; Cherravuru, S.; Raskin, I.; Belanger, F.C. Variation in levels of the flavone tricin in bran from rice genotypes varying in pericarp color. J. Cereal Sci. 2018, 79, 226–232. [Google Scholar] [CrossRef]
  85. Chen, W.; Wang, W.; Peng, M.; Gong, L.; Gao, Y.; Wan, J.; Wang, S.; Shi, L.; Zhou, B.; Li, Z. Comparative and parallel genome-wide association studies for metabolic and agronomic traits in cereals. Nat. Commun. 2016, 7, 12767. [Google Scholar] [CrossRef] [PubMed] [Green Version]
  86. Chen, W.; Gao, Y.; Xie, W.; Gong, L.; Lu, K.; Wang, W.; Li, Y.; Liu, X.; Zhang, H.; Dong, H.; et al. Genome-wide association analyses provide genetic and biochemical insights into natural variation in rice metabolism. Nat. Genet. 2014, 46, 714–721. [Google Scholar] [CrossRef] [PubMed]
  87. Matsuda, F.; Okazaki, Y.; Oikawa, A.; Kusano, M.; Nakabayashi, R.; Kikuchi, J.; Yonemaru, J.; Ebana, K.; Yano, M.; Saito, K. Dissection of genotype-phenotype associations in rice grains using metabolome quantitative trait loci analysis. Plant J. Cell Mol. Biol. 2012, 70, 624–636. [Google Scholar] [CrossRef] [PubMed] [Green Version]
  88. Sellamuthu, R.; Liu, G.F.; Ranganathan, C.B.; Serraj, R. Genetic analysis and validation of quantitative trait loci associated with reproductive-growth traits and grain yield under drought stress in a doubled haploid line population of rice (Oryza sativa L.). Field Crops Res. 2011, 124, 46–58. [Google Scholar] [CrossRef]
  89. Huang, C.Y.; Roessner, U.; Eickmeier, I.; Genc, Y.; Callahan, D.L.; Shirley, N.; Langridge, P.; Bacic, A. Metabolite Profiling Reveals Distinct Changes in Carbon and Nitrogen Metabolism in Phosphate-Deficient Barley Plants (Hordeum vulgare L.). Plant Cell Physiol. 2008, 49, 691–703. [Google Scholar] [CrossRef] [PubMed]
  90. Harrigan, G.G.; Stork, L.G.; Riordan, S.G.; Reynolds, T.L.; Ridley, W.P.; Masucci, J.D.; MacIsaac, S.; Halls, S.C.; Orth, R.; Smith, R.G.; et al. Impact of Genetics and Environment on Nutritional and Metabolite Components of Maize Grain. J. Agric. Food Chem. 2007, 55, 6177–6185. [Google Scholar] [CrossRef] [PubMed]
  91. Harrigan, G.G.; Stork, L.G.; Riordan, S.G.; Ridley, W.P.; MacIsaac, S.; Halls, S.C.; Orth, R.; Rau, D.; Smith, R.G.; Wen, L.; et al. Metabolite Analyses of Grain from Maize Hybrids Grown in the United States under Drought and Watered Conditions during the 2002 Field Season. J. Agric. Food Chem. 2007, 55, 6169–6176. [Google Scholar] [CrossRef] [PubMed]
  92. Roessner, U.; Luedemann, A.; Brust, D.; Fiehn, O.; Linke, T.; Willmitzer, L.; Fernie, A.R. Metabolic Profiling Allows Comprehensive Phenotyping of Genetically or Environmentally Modified Plant Systems. Plant Cell 2001, 13, 11. [Google Scholar] [CrossRef] [PubMed]
  93. Schauer, N.; Semel, Y.; Roessner, U.; Gur, A.; Balbo, I.; Carrari, F.; Pleban, T.; Perez-Melis, A.; Bruedigam, C.; Kopka, J. Comprehensive metabolic profiling and phenotyping of interspecific introgression lines for tomato improvement. Nat. Biotechnol. 2006, 24, 447–454. [Google Scholar] [CrossRef] [PubMed]
  94. Schauer, N.; Semel, Y.; Balbo, I.; Steinfath, M.; Repsilber, D.; Selbig, J.; Pleban, T.; Zamir, D.; Fernie, A.R. Mode of inheritance of primary metabolic traits in tomato. Plant Cell 2008, 20, 509–523. [Google Scholar] [CrossRef] [PubMed]
  95. Goodyear, A.; Kumar, A.; Ehrhart, E.J.; Swanson, K.S.; Grusak, M.A.; Leach, J.E.; Dow, S.W.; McClung, A.; Ryan, E.P. Dietary rice bran supplementation prevents Salmonella colonization differentially across varieties and by priming intestinal immunity. J. Funct. Foods 2015, 18, 653–664. [Google Scholar] [CrossRef] [Green Version]
  96. Mahesh, H.B.; Shirke, M.D.; Singh, S.; Rajamani, A.; Hittalmani, S.; Wang, G.-L.; Gowda, M. Indica rice genome assembly, annotation and mining of blast disease resistance genes. BMC Genom. 2016, 17, 242. [Google Scholar] [CrossRef] [PubMed]
Figure 1. Principal component analysis (PCA) of rice bran metabolome for 17 rice cultivars. PCA was completed using median-scaled relative abundance of all bran in the 17 rice cultivars. The PC1 showed 20.3% variation, and PC2 showed 16% variation in the metabolite profiles. Colored dots indicate the country where the rice was produced.
Metabolites 08 00063 g001
Figure 2. Comparison of discriminating 71 rice bran metabolites across 17 cultivars and based on the Z-scores obtained from the relative abundance of each metabolite. The 21 amino acids (Panel A), seven carbohydrates and two cofactors and vitamins (Panel B), 33 lipids (Panel C), six nucleotides and two secondary metabolites (Panel D) have Z-scores expressed as standard deviations from the mean and were calculated using the following formula: Z = (x − µ)/σ, “x” is relative abundance of the metabolite, “µ” is mean of relative abundance for the metabolite across 17 rice brans, and “σ” is the relative abundance standard deviation of same metabolite across 17 cultivars. Metabolites above 2 or below −2 in the panel A–D are highlighted for the largest variation, and noted by cultivar and the country where the rice was grown. Colored symbols are associated with the location where the rice was grown.
Metabolites 08 00063 g002
Figure 3. A pathway enrichment score (PES) of 15 metabolic pathways vary among the cultivars tested. Metabolic pathways with enrichment scores of greater or less than 1 are shown. These are for cultivars that contained one or more metabolites with a statistically significant Z-score.
Metabolites 08 00063 g003
Table 1. Number of rice bran metabolites with confirmed annotation in each cultivar by cultivar and chemical class.
Rice CultivarKenya—Basmati 217Kenya—Basmati 370Mali—Gambiaka *Mali—ShwetasokeMali—DM-16Mali—Khao GaewNicaragua—DoradoNepal—Sawa MahsuliIndia—ChennulaIndia—Njavara *USA—CalroseUSA—RBT 300USA—Jasmine 85USA—IAC 600USA—LTHUSA—SHZ-2Cambodia —Rang Jey
Chemical Class
Amino acids1191171201171159911711710599119122110113119117108
Carbohydrates5152535352505150515048495053535051
Cofactors & vitamins2727272726242727272627232727272627
Lipids166165165166159164161155155151165161146163165150156
Nucleotides3738353534293738302935333736353636
Peptides0211111173111111111108112
Secondary metabolites1921191920191620192216171720221721
Total419422430428417392412418388378421406398422429407401
* notes the cultivars with the largest and smallest numbers of identified metabolites.
Table 2. Metabolite–rice gene relationships identified from OryzaCyc (Oryza sativa japonica group), Plant Metabolic Network (PMN) database.
Rice Bran MetabolitesPrecursorBiosynthesis PathwayNo. of Genes *Gene IDGene(s) Name
Amino Acids
Aromatic amino acids (phosphoenolpyruvate (PEP)-derived)
l-quinateTrans-5-O-caffeoyl-d-quinateCaffeoylglucarate biosynthesis5GN7F-30156LOC_Os02g39170.1
GN7F-16973LOC_Os02g39590.1
GN7F-15850LOC_Os06g47910.1
SerotoninTryptamineHydroxycinnamic acid Serotonin amides biosynthesis2GN7F-19639LOC_Os08g04560.1
GN7F-25663LOC_Os08g04540.1
Tryptophanl-serineTryptophan biosynthesis4+ (153)GN7F-27027LOC_Os03g58260.1
GN7F-24368LOC_Os03g58290.1
GN7F-25293LOC_Os06g42560.4
GN7F-19428LOC_Os08g04180.1
Tyrosinel-phenylalanine, l-arogenatePhenylalanine degradation V, tyrosine biosynthesis II & III3+ (153)GN7F-27976LOC_Os06g35050.1
GN7F-19057LOC_Os06g49505.1
GN7F-18001LOC_Os06g49520.1
Aspartate family (oxaloacetate (OAA)-derived)
Asparaginel-aspartate, 3-cyano-l-alanineAsparagine biosynthesis I & II, cyanide detoxification I5+ (153)GN7F-32447LOC_Os12g38630.1
GN7F-23509LOC_Os06g15420.1
GN7F-23610LOC_Os03g18130.1
GN7F-15965LOC_Os02g42350.1
GN7F-23159LOC_Os02g42330.1
Aspartatel-asparagine, 3-cyano-l-alanine, indole-3-acetyl-aspartate-N-β-d-glucoseAsparagine degradation I, cyanide detoxification I, Indole-3-acetate conjugate biosynthesis II3+ (153)GN7F-15965LOC_Os02g42350.1
GN7F-23159LOC_Os02g42330.1
GN7F-27949LOC_Os04g58600.2
LysineMeso-diaminopimelateLysine biosynthesis VI1+ (153)GN7F-25633LOC_Os02g24354.1
Methionine sulfoxideAn acyl-CoA, an aldehyde, a carboxylic esterNot in pathway9+ (150)GN7F-28729LOC_Os09g34190.1
GN7F-19329LOC_Os04g47120.1
GN7F-31811LOC_Os01g12910.1
GN7F-31843LOC_Os07g27870.1
GN7F-32115LOC_Os04g35590.1
GN7F-32205LOC_Os07g27960.1
GN7F-32376LOC_Os02g32200.1
GN7F-32723LOC_Os01g12920.1
GN7F-32765LOC_Os01g65950.1
ThreonineO-phospho-l-homoserine, l-threonine 3-O-phosphateThreonine biosynthesis from homoserine, l-threonine 3-O-phosphate3+ (153)GN7F-18835LOC_Os01g49890.1
GN7F-30196LOC_Os05g47640.1
GN7F-29436LOC_Os08g17784.1
Glutamate family (α-ketoglutarate-derived)
Argininel-arginino-succinateArginine biosynthesis I & II, Citrulline-nitric oxide cycle3+ (153)GN7F-20973LOC_Os03g19280.1
GN7F-32460LOC_Os03g60976.1
GN7F-32707LOC_Os03g60992.1
Glutamate 1More than 35 precursors (top two: l-glutamine, 2-oxoglutarate)More than 27 pathways (top two: 4-aminobenzoate biosynthesis, 4-aminobutyrate degradation)91+ (157)GN7F-17849LOC_Os06g48620.1
GN7F-25902LOC_Os04g52440.1
GN7F-28339LOC_Os08g10510.1
GN7F-27233LOC_Os02g02210.1
GN7F-19896LOC_Os04g52450.1
GlutamineMore than eight precursors (top three: l-glutamate, a dipeptide with proline at the C-terminal, a γ l-glutamyl-l-amino acid)More than six pathways (top four: Ammonia assimilation cycle I & II, glutamine biosynthesis I & II)5+ (153)GN7F-15709LOC_Os03g50490.1
GN7F-15901LOC_Os04g56400.1
GN7F-22516LOC_Os03g12290.1
GN7F-26393LOC_Os10g31820.1
GN7F-27460LOC_Os02g50240.1
N-acetylglutamatel-glutamateArginine biosynthesis II (acetyl cycle), ornithine biosynthesis6+ (150)GN7F-20894LOC_Os03g17120.1
GN7F-19328LOC_Os07g39690.1
GN7F-17187LOC_Os03g31690.1
GN7F-31311LOC_Os03g46200.1
GN7F-32148LOC_Os03g58010.1
GN7F-32821LOC_Os03g58030.1
PyroglutamineAn (γ-l-glutamyl)-l-amino acidγ-glutamylcyclotransferase2GN7F-31386LOC_Os03g63700.1
GN7F-32110LOC_Os11g04420.4
Serine family (phosphoglycerate-derived)
Glycinel-cysteinyl-glycineγ-glutamyl cycle, Phytochelatins biosynthesis8+ (151)GN7F-30607LOC_Os01g05810.1
GN7F-16957LOC_Os04g38450.1
GN7F-25454LOC_Os01g05820.1
GN7F-26619LOC_Os05g34290.1
GN7F-28075LOC_Os06g01260.1
GN7F-16002LOC_Os12g35890.1
GN7F-26733LOC_Os09g32290.2
GN7F-19516LOC_Os01g21380.1
Taurine 2In transport reactions4GN7F-31312LOC_Os09g29660.1
GN7F-31505LOC_Os05g31080.1
GN7F-32616LOC_Os03g20170.1
GN7F-32729LOC_Os09g29670.1
Lipids
Free fatty acid
α-linolenateA phosphatidylcholineNo common pathways1+ (334)GN7F-18386LOC_Os11g04940.1
LaurateLauroyl-CoA, a dodecanoyl-[acyl-carrier protein]Palmitate biosynthesis II (bacteria and plants), sporopollenin precursors biosynthesis1+ (285)GN7F-19329LOC_Os04g47120.1
LinoleateLinoleoyl-CoANo common pathways2+ (332)GN7F-33079LOC_Os02g44654.2
GN7F-16232LOC_Os04g47250.1
MyristateMyristoyl-CoANo common pathways0+ (325)--
PalmitatePalmitoyl-CoA, a palmitoyl-[acp], 1,2-dipalmitoyl-phosphatidylcholine, 1-palmitoyl-2-linoleoyl-phosphatidylcholineCutin biosynthesis, sporopollenin precursors biosynthesis, suberin monomers biosynthesis, palmitate biosynthesis II (bacteria and plants), phospholipid remodeling (phosphatidylcholine, yeast)6+ (333)GN7F-19329LOC_Os04g47120.1
GN7F-28729LOC_Os09g34190.1
GN7F-32532LOC_Os01g66240.1
GN7F-24830LOC_Os01g46250.1
GN7F-20654LOC_Os01g73740.1
GN7F-18158LOC_Os01g51360.1
PalmitoleateA palmitoleoyl-[acyl-carrier protein]No common pathways4+ (333)GN7F-31362LOC_Os04g46710.1
GN7F-31587LOC_Os04g46730.1
GN7F-31765LOC_Os02g44134.1
GN7F-32681LOC_Os02g44200.1
Oxylipins
9,10-epoxystearateOleate, a hydroperoxy-fatty-acyl-[lipid]Cutin biosynthesis, poly-hydroxy fatty acid biosynthesis10+ (332)GN7F-31064LOC_Os10g37070.1
GN7F-30659LOC_Os08g05620.1
GN7F-18468LOC_Os01g24810.1
GN7F-27809LOC_Os10g05020.1
GN7F-16745LOC_Os04g03890.1
GN7F-21459LOC_Os10g37100.1
GN7F-19209LOC_Os04g33370.1
GN7F-18601LOC_Os02g01890.1
GN7F-29035LOC_Os08g05610.1
GN7F-15971LOC_Os06g46680.1
Phospholipid Metabolism
Glycerophosphorylcholin (sn-glycero-3-phosphocholine)A 1-acyl-sn-glycero-3-phosphocholineNo common pathways7GN7F-33055LOC_Os01g07960.3
GN7F-29598LOC_Os04g57370.1
GN7F-18763LOC_Os04g09540.1
GN7F-31398LOC_Os01g42690.1
GN7F-32181LOC_Os04g57390.1
GN7F-32498LOC_Os05g51050.1
GN7F-32638LOC_Os08g42680.1
* Numbers in brackets indicate the number of common genes known to be responsible for the synthesis of a standard alpha amino acid and a standard fatty acid. 1 Only the top five genes (most commonly studied) were included in the table. 2 There are no identified genes for taurine biosynthesis in rice. However, genes that are responsible for its transport from environment into the rice plant are identified.
Table 3. Metabolite–rice gene relationships identified from OryzaCyc (Oryza sativa japonica group), Plant Metabolic Network (PMN) database.
Rice Bran MetabolitesPrecursorBiosynthesis PathwayNo. of Genes *Gene IDGene(s) Name
Carbohydrates
Citric acid cycle (TCA) cycle
α-ketoglutarate (2-oxoglutarate) 1l-glutamate, d-threo-isocitrateNine pathways (top four: Alanine degradation II, Glutamate degradation I, Arginine biosynthesis II, Ornithine biosynthesis)11+ (160)GN7F-23833LOC_Os03g58040.1
GN7F-16177LOC_Os02g43470.1
GN7F-28651LOC_Os04g45970.1
GN7F-23252LOC_Os05g03830.1
GN7F-26515LOC_Os07g27780.1
cis-aconitateCitrateGlutamine biosynthesis III glyoxylate cycle, TCA cycle II (plants and fungi)4+ (150)GN7F-24702
GN7F-28499LOC_Os10g03960.1
GN7F-23691LOC_Os06g19960.1
GN7F-25422LOC_Os03g04410.1
GN7F-25644LOC_Os08g09200.1
MalateAcetyl-CoA, Glyoxylate, FumarateGlycolate and glyoxylate degradation II, glyoxylate cycle, superpathway of glyoxylate cycle and fatty acid degradation, TCA cycle II (plants and fungi)2+ (150)GN7F-24000LOC_Os04g40990.1
GN7F-21211LOC_Os03g21950.1
Cofactors & vitamins
Tocopherol metabolism
β-tocopherolδ-tocopherol, S-adenosyl-l-methionineVitamin E biosynthesis (tocopherols)4GN7F-31982LOC_Os10g41970.1
GN7F-31239LOC_Os03g26200.1
GN7F-31334LOC_Os08g02600.1
GN7F-25500LOC_Os02g47310.1
γ-tocotrienol2,3-dimethyl-6-geranylgeranyl-1,4-benzoquinolVitamin E biosynthesis (tocopherols)1GN7F-24601LOC_Os02g17650.1
* Numbers in brackets indicate the number of common genes known to be responsible for the synthesis of a standard carbohydrate. 1 Only the top five genes were included in the table.
Table 4. Metabolite-rice gene relationship identified from OryzaCyc (Oryza sativa japonica group), Plant Metabolic Network (PMN) database.
Rice Bran MetabolitesPrecursorBiosynthesis PathwayNo. of Genes *Gene IDGene(s) Name
Nucleotides
Purine metabolism
Adenine 1S-methyl-5′-thioadenosine, adenosine, N6-dimethylallyladenine, trans-zeatin, cis-zeatin, N1-ethyladenine, N1-methyladenineS-methyl-5′-thioadenosine degradation I, adenine and adenosine salvage II, cytokinins degradation18GN7F-25353LOC_Os08g44370.1
GN7F-26929LOC_Os09g39440.1
GN7F-32781LOC_Os05g33644.1
GN7F-32797LOC_Os05g33630.1
GN7F-19530LOC_Os06g37500.1
AdenosineS-adenosyl-l-homocysteine, trans-zeatin riboside, isopentenyl adenosineS-adenosyl-l-methionine cycle II, l-methionine degradation I (to l-homocysteine), cytokinins degradation3+ (8)GN7F-20280LOC_Os02g12780.1
GN7F-19530LOC_Os06g37500.1
GN7F-20388LOC_Os01g09260.1
Adenosine 5′-monophosphate 1Adenosine triphosphate (ATP)More than 97 pathways (top four: Trans-zeatin biosynthesis, Adenosine nucleotides degradation I, 4-hydroxybenzoate biosynthesis I (eukaryotes), l-arginine biosynthesis I (via l-ornithine)299+ (24)GN7F-23647LOC_Os02g46970.1
GN7F-23504LOC_Os06g44620.1
GN7F-28551LOC_Os08g34790.1
GN7F-25622LOC_Os08g14760.1
GN7F-25996LOC_Os01g24030.1
HypoxanthineInosineAdenosine nucleotide degradation I5GN7F-25353LOC_Os08g44370.1
GN7F-21573LOC_Os03g31170.1
GN7F-26929LOC_Os09g39440.1
GN7F-32781LOC_Os05g33644.1
GN7F-32797LOC_Os05g33630.1
Secondary metabolites
Benzenoids
SalicylateMethylsalicylateUnknown3 + (152)GN7F-26541LOC_Os05g30760.1
GN7F-21475LOC_Os01g37650.1
GN7F-28107LOC_Os01g25360.1
* Numbers in brackets indicate the number of common genes known to be responsible for biosynthesis of a nucleotide or a carboxylate. 1 Only the top five genes were included in the table.
Table 5. Classification and phenotypes of the 17 rice cultivars used for bran metabolomics.
CultivarGrain TypeBran ColorCountry of OriginGrowing Location
Basmati 217LongBrownIndiaKenya
Basmati 370LongBrownIndiaKenya
CalroseMediumBrownUSACalifornia
ChennulaLongBrownIndiaIndia
DM-16ShortBrownSouth AmericaMali
DoradoLongBrownColombiaNicaragua
GambiakaLongBrownMaliMali
IAC 600MediumPurpleBrazilArkansas
Jasmine 85LongBrownPhilippinesArkansas
Khao GaewLongBrownThailandMali
Li-Jiang-Xin-Tuan-Hei-Gu (LTH)MediumRedChinaArkansas
NjavaraLongRedIndiaIndia
Rang JeyMediumBrownCambodiaCambodia
RBT 300 *MediumBrownUSACalifornia
Sawa MahsuliLongBrownNepalNepal
Shan-Huang-Zhan-2 (SHZ-2)LongBrownChinaArkansas
ShwetasokeLongBrownMaliMali
* This rice bran is a commercial ingredient from a mixture of varieties grown in California.

