
Betti Functionals as Probes for Cosmic Topology

Institute of Theoretical Physics, Ulm University, Albert-Einstein-Allee 11, D–89069 Ulm, Germany
*
Author to whom correspondence should be addressed.
Universe 2024, 10(5), 190; https://doi.org/10.3390/universe10050190
Submission received: 21 March 2024
/
Revised: 9 April 2024
/
Accepted: 10 April 2024
/
Published: 24 April 2024
(This article belongs to the Section Cosmology)
Abstract
:The question of the global topology of the Universe (cosmic topology) is still open. In the CDM concordance model, it is assumed that the space of the Universe possesses the trivial topology of , and thus that the Universe has an infinite volume. As an alternative, in this paper, we study one of the simplest non-trivial topologies given by a cubic 3-torus describing a universe with a finite volume. To probe cosmic topology, we analyze certain structure properties in the cosmic microwave background (CMB) using Betti functionals and the Euler characteristic evaluated on excursions sets, which possess a simple geometrical interpretation. Since the CMB temperature fluctuations are observed on the sphere surrounding the observer, there are only three Betti functionals , . Here, denotes the temperature threshold normalized by the standard deviation of . The analytic approximations of the Gaussian expectations for the Betti functionals and an exact formula for the Euler characteristic are given. It is shown that the amplitudes of and decrease with an increasing volume of the cubic 3-torus universe. Since the computation of the ’s from observational sky maps is hindered due to the presence of masks, we suggest a method that yields lower and upper bounds for them and apply it to four Planck 2018 sky maps. It is found that the ’s of the Planck maps lie between those of the torus universes with side-lengths and in units of the Hubble length and above the infinite CDM case. These results give a further hint that the Universe has a non-trivial topology.
1. Introduction
A wide range of cosmological data is well-described within the framework of the cold dark matter (CDM) model, which is now established as the standard model of cosmology. Due to the increasing level of precision in the available data, several discrepancies have arisen as the Hubble tension and the tension in the recent years [1,2,3,4,5]. In addition, there are several strange features in the cosmic microwave background (CMB) as summarized in [6], which also point to a modification of the standard model. A prominent example is the suppression of the quadrupole moment in the CMB angular power spectrum, which is also especially revealed by the 2-point angular correlation function showing almost no correlations above angles of . Models without relying on modified physics, which can address this feature, are provided by cosmic topology [7,8,9,10,11], see also references in [12]. A possible non-trivial topology for the Universe can suppress the large-scale anisotropy due to an infrared cut-off in the wave number spectrum.
A non-trivial topology can be detected by searching for topologically matched circles in CMB maps, the so-called circles-in-the-sky (CITS) test [13]; however, the searches were in vain up to now [14,15]. A possibility for this negative result might be that the CITS signature is not so clearly pronounced in the CMB sky maps, as predicted by the CDM model on which the likelihoods are based. A future resolution of the Hubble and tensions might, for example, lead to a larger integrated Sachs–Wolfe contribution, which would additionally blur the CITS signature so that the Universe might possess a non-trivial topology despite the negative result. Another possibility for a non-trivial topology is that the topology produces CITS, which are far from antipodal as in the case of the Hantzsche–Wendt topology [16], which impede the CITS search. An exhaustive analysis of the allowed non-trivial topological models is given in [17,18].
In this paper, we analyze certain structure properties in the CMB maps of a compact non-trivial topological space and compare them with the standard CDM model, which presuppose an infinite volume. This requires the simulation of CMB sky maps for these topological models, as outlined in [19,20,21]. There, it is discussed that the CMB simulations require the determination of the eigenvalue spectrum and the eigenmodes of the Laplace–Beltrami operator on the topological space. The obvious restriction would be to test only the topological spaces that are not excluded by the CITS test, but their CMB sky maps are more difficult to simulate than the simple cubic 3-torus model whose CITS signature could not be found. The reason is that the highest degeneracy in the eigenvalue spectrum belongs to the cubic 3-torus topology such that the transfer function has to be computed for a significantly smaller number of eigenvalues, which, in turn, speeds up the CMB simulations correspondingly. For that reason, we consider here the cubic 3-torus space [12], which should provide an idea of general properties.
In this work, we apply the Betti functionals to the CMB temperature fluctuation field , which is defined on the sphere that surrounds the observer. ( denotes the direction in which the temperature fluctuation is observed). For the analysis of the CMB, the temperature fluctuation field is normalized
where and are the mean and the standard deviation of the field . Therefore, the normalized field has zero mean and unit variance. The topological descriptors are then computed as a functional of the excursion set
where denotes the threshold.
For our special case , there are only three Betti functionals (BF) . These are the number of components of the excursion set by the 0-th BF ,
the number of independent 1-dimensional punctures on , denoted by the 1-st BF ,
and finally, the 2-nd BF , which counts the number of the internal voids of . In our special case, this is one if the excursion set is identical to being the case for and zero otherwise, i.e.,
The Betti numbers originate from the analysis of topological spaces, where they are used to distinguish the topological spaces based on the connectivity of n-dimensional simplicial complexes. The nth Betti number is defined by the rank of the nth homology group [22,23,24,25]. An analysis based on relative homology with respect to cosmic topology will be given in the companion paper [26].
Concerning the word “topological” in Equation (4), there is a remark in order. At first, consider a pixelized version of the sphere and identify it with the excursion set for the case . Then increase the threshold such that a single pixel is removed from the sphere, which destroys the internal void, which, in turn, is counted by , but this does not create a 1-dimensional hole. The 1-dimensional hole is created on the sphere after removal of another pixel not sharing a boundary with the first removed pixel. In this case, we now have a ring that has an actual hole, which is called a topological hole. Thus, the number of topological holes is the number of common sense holes minus one.
Let us note that the application of the Betti functionals is not restricted to a study of cosmic topology, as illustrated in this paper. In fact, the Betti functionals can also be used to analyze the structure properties of the CMB predicted in models with a different scenario for dark energy or in the context of more generally modified gravity theories.
In this paper, we use for the CDM concordance model the cosmological parameters, as given by the Planck collaboration in [27] in their Table 4 in the column ‘TT+lowP+lensing’. The main parameters are , , and . Furthermore, all sky maps are computed with the Healpix resolution and, if not explicitly stated otherwise, a Gaussian smearing of is used. For the cubic 3-torus model, 1000 CMB sky maps are computed for each of the side-lengths , , , , and , where L is given in units of the Hubble length . This allows the computation of ensemble averages for the ’s in order to compare them with the infinite CDM standard model and the Planck CMB maps.
2. Analytic Approximation of Betti Functionals and an Exact Gaussian Expectation for the Euler Characteristic and the Genus
After many years of work on the Betti functionals (BF) , there still exist no exact predictions for the ensemble expectations assuming that the CMB anisotropy is a homogeneous, isotropic Gaussian random field on the -sphere. Therefore, there arises the question whether one can find reliable analytic approximations for the as a function of . In the following, we propose such approximations, which agree well with the average values obtained from simulations for a cubic 3-torus with side-length .
A crucial rôle is played by the asymptotic behaviour of the BFs in the limits . From the definition of the BFs, it is obvious that it holds
The situation is, however, different in the limit where the excursion set covers the whole unit sphere . In this case, one obtains from the Betti numbers of the asymptotic behaviour for
This is in agreement with the general relation for the Euler characteristic (EC) ,
yielding for the full sphere the correct value .
From (6) and (7), one infers that the apparent symmetry (see Figure 1), , with respect to the parity transformation (, respectively), does not hold true but rather is violated. The degree of the breaking of parity can be described by a function ,
which according to the Equations (6) and (7) has to satisfy the asymptotic relations
The relation (8) for the EC is then
Under very general assumptions, one can expand the expression in the brackets of (11) into a convergent infinite series in terms of the odd Hermite functions , where denote the odd “probabilist’s” Hermite polynomials (see Appendix C in [28] for a mathematical exposition of the general Hermite expansions). As a first approximation, let us consider the first term in this expansion, which leads with to the approximation
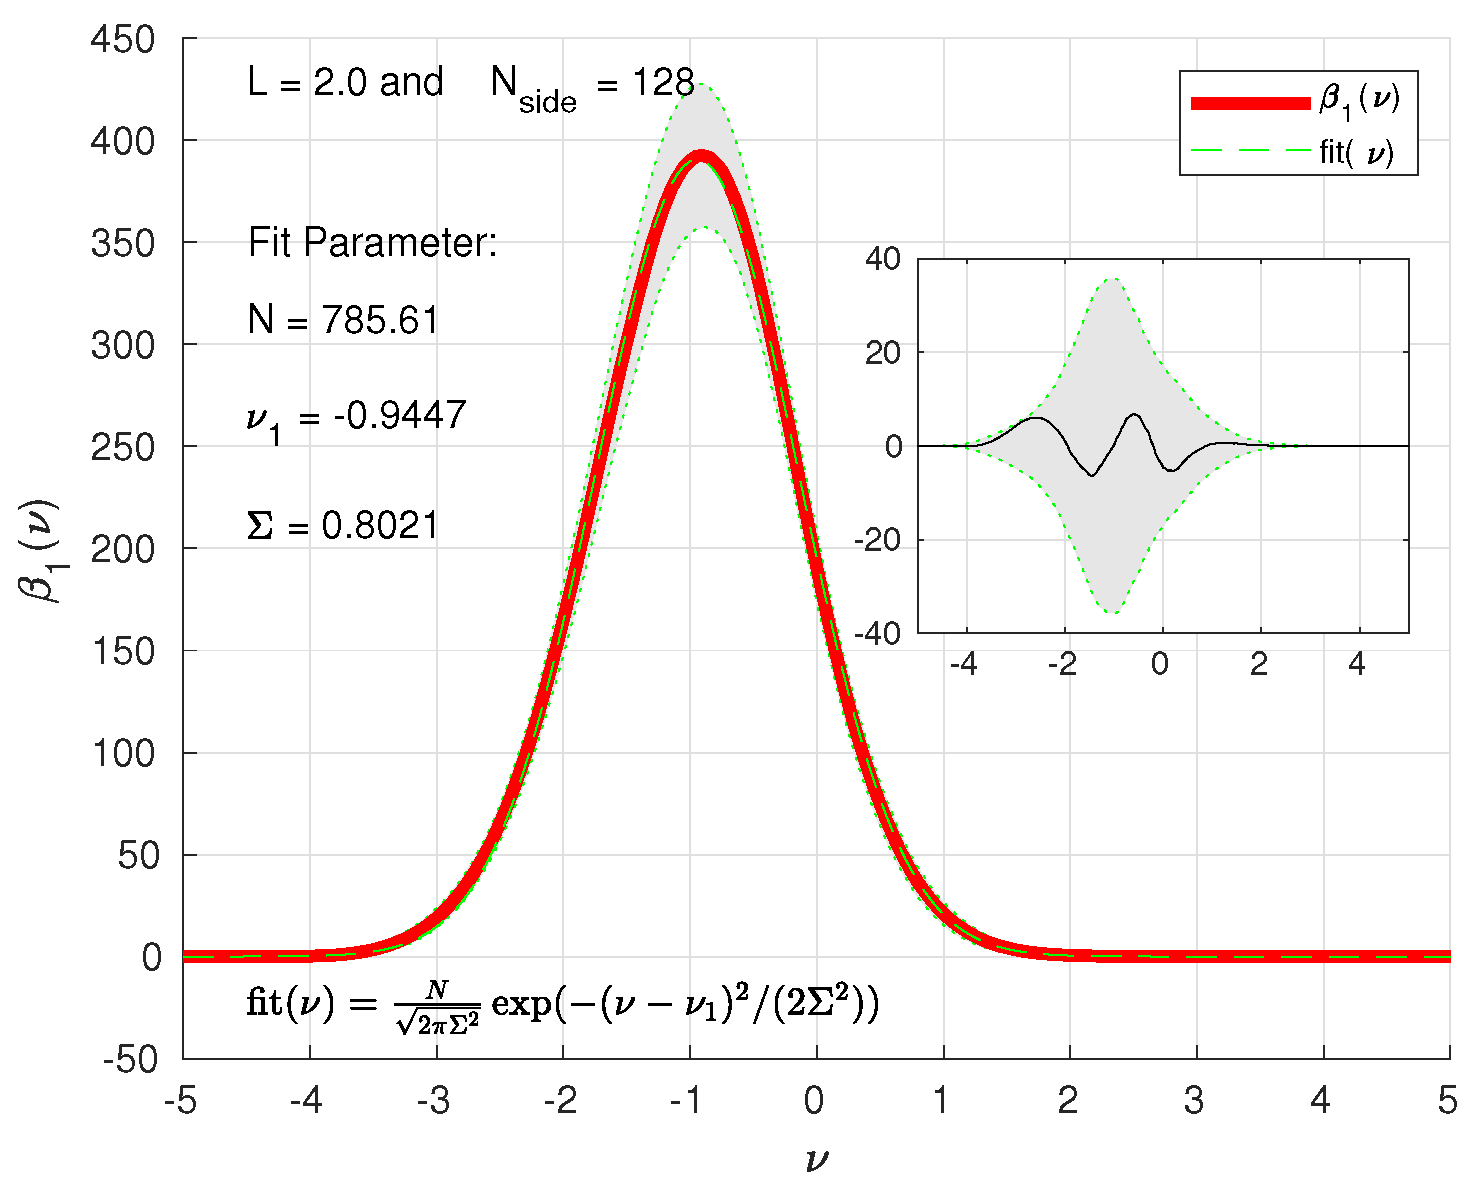
with a positive coefficient given below. In Figure 2 we show that (12) gives an excellent fit to the data. Equation (12) describes a maximum at and a minimum at with amplitude in nice agreement with the peaks of the data very close to (see Figure 2). Inserting relation (12) into (11), one obtains the following approximation to the EC:
In order to determine and we use the standard definition of the EC using the Gauss-Bonnet theorem on the excursion set
where denotes the Gaussian curvature of , the surface element on , the line element along , and the geodesic curvature of . The integrals in (14) are proportional to the Minkowski functionals (MFs) and [28], respectively, which gives
The MFs have the nice property that their exact Gaussian predictions are explicitly known (see [28] and references therein),
Here, the parameter has been studied in [29], where it has been shown that does hierarchically detect the change in size of the cubic 3-torus if the volume of the Universe is smaller than ≃2.5 . ( is the standard deviation of the gradient of the CMB field , i.e., is the normalized standard deviation of the CMB gradient field).
Figure 1.
The Betti functionals and are shown together with their error bands obtained from 1000 CMB simulations based on the torus topology. In addition, the mean value of is plotted as a dotted curve. The resolution parameters are set to , and . These parameters are used in all figures if not otherwise noted.

Figure 2.
The fit (12) is shown as a dashed curve together with the mean value of obtained from 1000 CMB simulations based on the torus topology. The quality of the fit is so good that the mean value curve is plotted with a larger line width in order to reveal the dashed curve belonging to the one-parameter fit. The inset shows the difference between the data and the fit.

Inserting (16) into (15), the exact Gaussian expectation for the EC reads
which compared with the approximation (13) gives
and
In Figure 3, we show the mean value of obtained from 1000 CMB simulations based on the torus topology and compare it with the approximation
Note that the fit parameters have a simple interpretation since
and
Inserting (20) into (19) leads to the analytic approximation
also shown in Figure 3, and thus to an explicit expression for the parity violation, see Equation (9).
Figure 3.
The mean value of obtained from 1000 CMB simulations based on the torus topology is shown together with the fit (20). Also shown is obtained from (21).

To the best of our knowledge, Figure 3 presents, for the first time, a computation of the BF and of the function quantifying the breaking of parity symmetry, defined in Equation (9). In previous papers, was considered to be zero and was not discussed at all. From the definition (5), it follows that is small since it is bounded by
Also the parity violation is small since it follows from (19) and (22)
resp.
In contrast, the Figure 1, Figure 2, Figure 4 and Figure 5 clearly show that the , , and the EC have very large maxima (minima), which finds a nice explanation by the large value of the parameter . Indeed, we obtain from (12) and (18) for the difference
at the maximum at (minimum at )
In [29], it was shown that the mean value of can be well-approximated for tori of the size of by the linearly decreasing function
From this, we obtain, for example, for the torus with , the large value , which leads to , which explains the large amplitudes displayed in Figure 2. (A similar prediction follows for the BF , see Equations (28) and (32) and Figure 1). Thus, the BFs and can be used to detect the size of the Universe if it is modeled as a cubic 3-torus. See also Figures 8, 11 and 12.
Figure 4.
The mean value of is shown together with a shifted Gaussian. The inset displays the difference between the Gaussian fit and in addition to the band confirming that the Gaussian fit describes the data better than .
Figure 4.
The mean value of is shown together with a shifted Gaussian. The inset displays the difference between the Gaussian fit and in addition to the band confirming that the Gaussian fit describes the data better than .

The Figure 4 demonstrates that a simple shifted Gaussian
fits the mean value of better than the width of the distribution. The normalization N, the width of the Gaussian, and the position of its maximum lead to the relations
Furthermore, one derives from (28)
and from (12) and (18)
Comparing the relations (30) and (31) yields the relation
which explains (see also (29) and Figure 4) the large amplitude of due to the large value of .
Finally, Figure 5 shows the EC for 1000 simulations using the exact Gaussian expectation value (17) of the general relation (8). Equation (17) predicts two large extrema (for the -values obtained from (27)) at
with magnitude and , respectively; for the torus with , one has . It is interesting to note that even in the case where the primordial initial conditions are exactly Gaussian, there is a small “parity breaking” (not visible in Figure 5) of the antisymmetry (negative parity) of since it holds
Figure 5.
The EC , Equation (8) is shown.
Figure 5.
The EC , Equation (8) is shown.

3. Betti Functionals for the Cubic 3-Torus Topology
In this section, the properties of and are discussed for the torus simulations with different torus side-lengths L. Since the focus is put on the simulations, one does not have to bother about masked sky regions, which will be discussed in the next section.
The Figure 6 shows the influence of the Gaussian smearing of the sky maps on and . With increasing smearing, the excursions set has fewer structure elements, and thus, the amplitude of and decreases with increasing smoothing. This behaviour is nicely revealed in Figure 6 for the case . Since the 3-torus simulations of the sky maps are computed up to , which roughly corresponds to a resolution of , a Gaussian smoothing of at least is on the safe side. As already stated, the analysis in this paper is based on a Gaussian smoothing of .
We now compare, for this fixed Gaussian smoothing, the dependence of the number of components and holes in dependence on the side-length L of the 3-torus in Figure 7. One observes a nice decreasing behaviour of and , with an increasing 3-torus size. The Figure 7 also displays the corresponding result for the infinite CDM model, which is computed using CAMB for the same set of cosmological parameters as used for the 3-torus models. This extrapolates the 3-torus size towards infinity. So this monotone dependence on the size of the 3-torus might give a hint to the size of our Universe by studying and in observed sky maps.
Figure 6.
The ensemble averages of and are shown for the torus side-length with dependence on the Gaussian smoothing of the sky maps. The smoothing of , , and are displayed.
Figure 6.
The ensemble averages of and are shown for the torus side-length with dependence on the Gaussian smoothing of the sky maps. The smoothing of , , and are displayed.

Figure 7.
The ensemble averages of and are shown depending on the torus side-length for up to . In addition, the ensemble averages of and for the infinite CDM model are shown, which extrapolates the torus side-length towards infinity. A decreasing number of structure elements with increasing side-length L are revealed. A Gaussian smoothing of is used in all cases.

For a consistent comparison of the ensemble averages of the finite torus model with the infinite CDM model provided by the Planck collaboration, it is important that the calculations are performed for both models with the same cosmological parameters. Only then it is guaranteed that the L-dependence demonstrated in Figure 7 is an unambiguous result, which is not caused by using different cosmological parameters.
An interesting connection of this monotonic dependence on the size of the topological cell exists with respect to the normalized standard deviation of the CMB gradient field, i.e., of already introduced in Section 2. Solving the relation (26) with respect to yields
The interesting point is that this relation shows that a monotonic dependence of on the torus size leads to an analogous behaviour of . While is computed by counting the number of holes of the excursion set, is computed by differentiating the CMB temperature field. In [29], the behaviour of the mean value of is analyzed and a monotonic behaviour of is found, which can be approximated for tori of the size of by the already given linearly decreasing function (27). In Figure 8, the linear behaviour (27) determined in [29] is compared with that derived from by using (38). A nice agreement between both methods for the computation of is observed. The Figure 8 also shows the result by using and , which will be defined in the next section.

4. Betti Functionals in the Presence of Masks
The analysis of the Betti functionals in CMB observations is impeded by foregrounds that do not allow a measurement of the genuine CMB. Furthermore, in the case of ground-based observations one has to deal with an incomplete sky coverage. In order to estimate the Betti functionals in the case of a mask, we propose the following procedure. At first, for the computation of , one counts the number of components in the unmasked sky. Then, there arises the possibility that some or all of those components that are partially covered by a common connected masked region, might be linked within this region, as illustrated in Figure 9. There, three components are shown that might be connected within the masked domain and would be counted as one component in an ideally measured sky without a mask. Of course, a further possibility is that only two of them are connected. Therefore, a lower bound is obtained by counting all components that are touched by a common masked region as a single component. Conversely, an upper bound is obtained by treating all components as separated. Note that no attempt is made to estimate the number of components within the masked domains, since only components outside the masked regions are considered. In order to estimate the number of components in the full sky, and are divided by
The same procedure applies analogously for .
Figure 9.
The ambiguity of counting the number of structure elements in the presence of a mask is illustrated. The mask is pictured as the dashed region, while the structure elements are shown as blue regions. If only the parts outside the masked region are known, one cannot decide whether they are connected within the mask or not. The two extreme cases are that they are all connected (right) or none of them (left).

In the case of simulations, one can test this procedure. Figure 10 compares for the case the upper and lower bounds with the true full sky result. The resolution parameters are again set to and .
In this work, we use the Planck 2018 “Component Separation Common mask in Intensity” [30], which can be obtained at http://pla.esac.esa.int/pla/#maps, accessed on 20 March 2024 (file name: COM_Mask_ CMB-common-Mask-Int_2048_R3.00.fits). Since our analysis is based on the Healpix resolution , we downgrade the above mask from to . The downgraded mask no longer has only the pixel values of 0 and 1, but also intermediate values, and we use a mask threshold of 0.9 in the following analysis. This leads to .
One observes from Figure 10 that the counted number of components lies nicely between and , as it should be. The same is seen for , which refers to the holes.
Figure 10.
The extrapolations and obtained from the masked CMB maps are shown in comparison with derived from the unmasked CMB maps for the ensemble.
Figure 10.
The extrapolations and obtained from the masked CMB maps are shown in comparison with derived from the unmasked CMB maps for the ensemble.

Furthermore, for sufficiently low values of , saturates at a non vanishing positive value. This is due to the structure of the mask. In the case without a mask, all CMB values are larger than for that sufficiently low , so that the full sphere is obtained as the excursion set . Applying the mask and assuming that the components are not connected within the masked region counts them as separate items if they lie within a “hole” of the mask. Then, each hole of the mask yields a separate component. In contrast, assumes that all components are linked within the masked domains and thus one counts only a single component.
5. A Comparison of the Cubic 3-Torus Topology with the Planck CMB Maps
The Planck collaboration provides four CMB sky maps for a cosmological analysis. Here, we use the Planck 2018 maps [31] called SMICA, Commander, NILC, and SEVEM, which can be obtained at http://pla.esac.esa.int/pla/#maps, accessed on 20 March 2024. The Healpix routine “map2alm_ iterative” is used to compute the spherical expansion coefficients for the four Planck maps by taking the mask Component Separation Common mask in Intensity into account. Thereafter, the monopole and dipole are set to zero, and a Gaussian smoothing of is applied. These spherical expansion coefficients are used to generate four Healpix maps with the resolution of , which can then be compared with the corresponding 3-torus CMB maps. The Figure 11 and Figure 12 display the curves derived from these four Planck curves as solid and in the common red colour, since they are nearly indistinguishable.
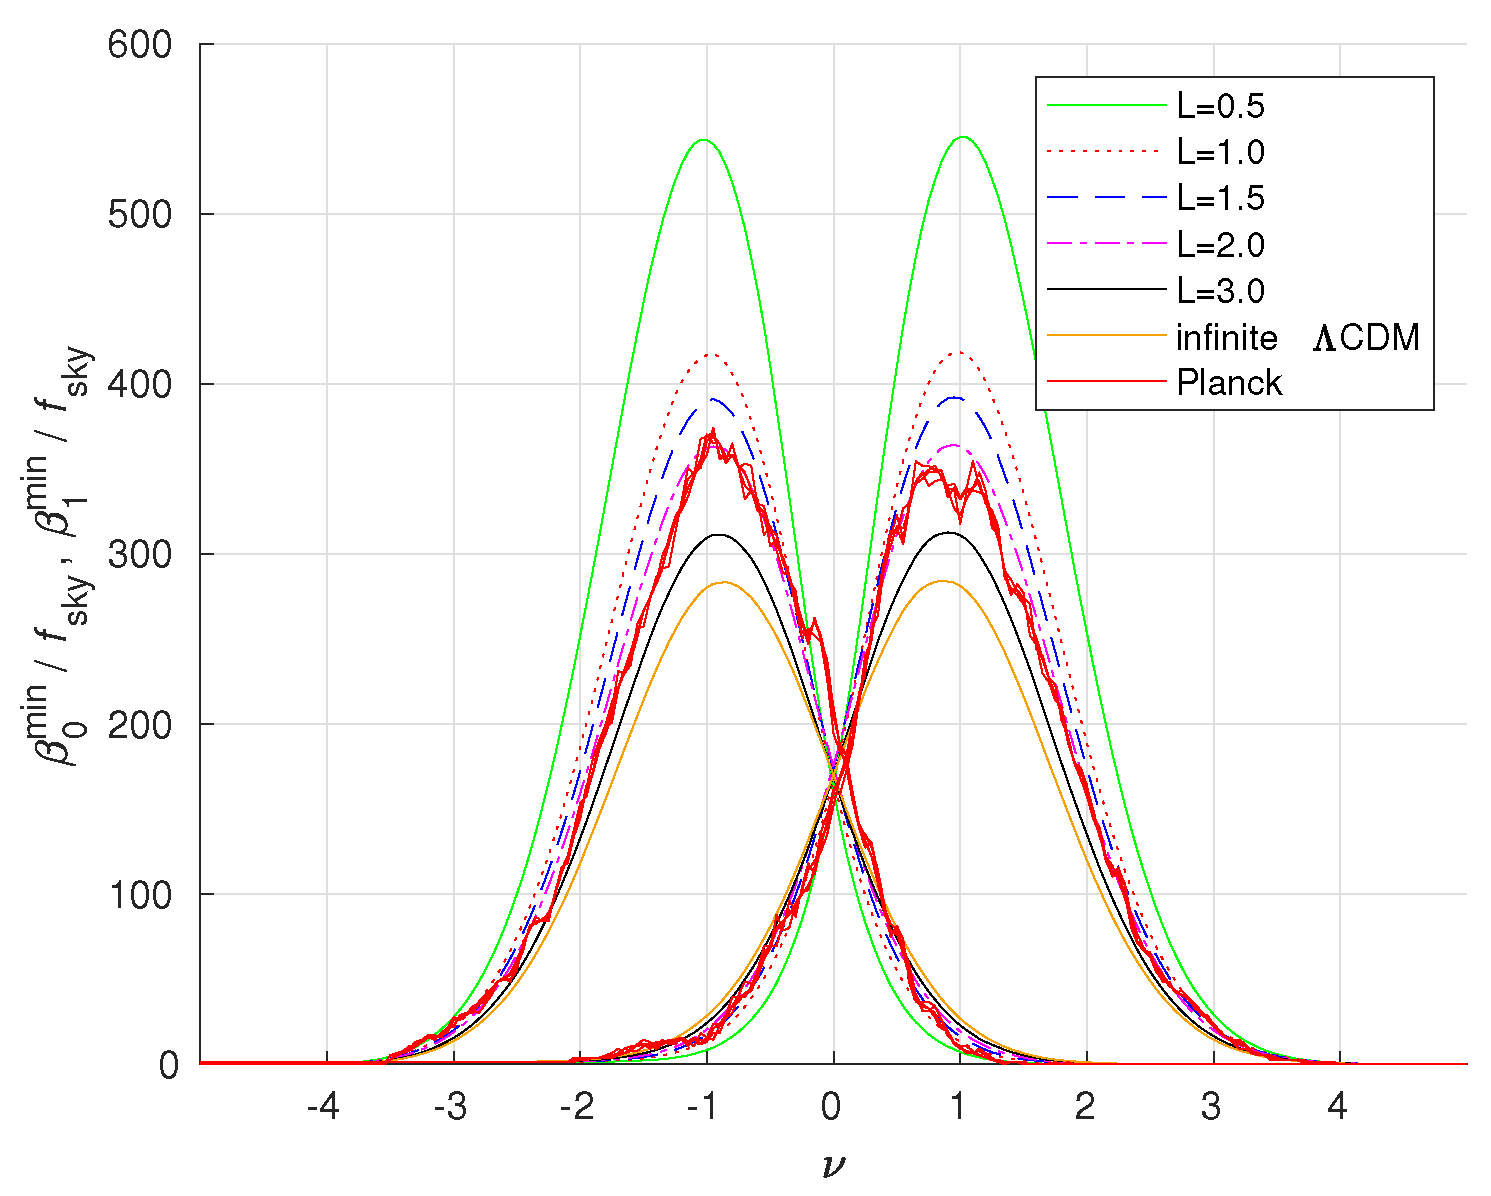
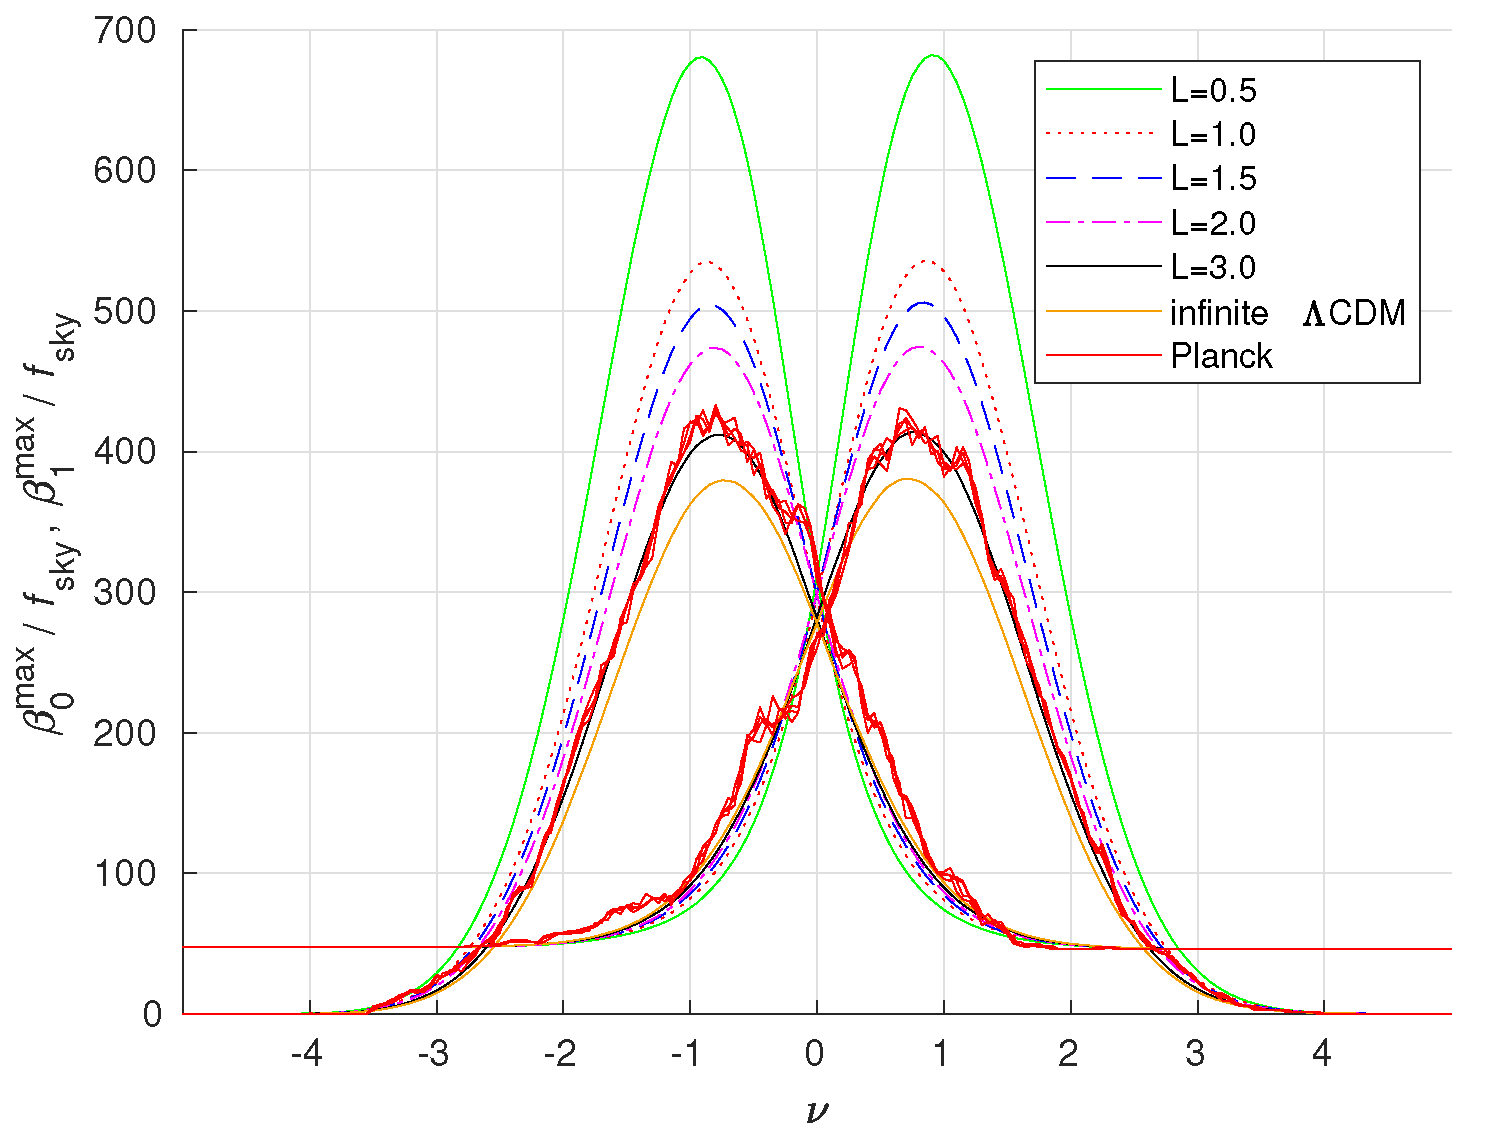
In Figure 11, and are plotted for the 3-torus simulations, the infinite CDM model and the four Planck maps are all subjected to the same mask. The curves present the lower estimate of the true ’s. It is seen that the curves derived from the Planck maps possess a significantly larger amplitude than that of the infinite CDM model. Indeed, they lie between the cubic 3-torus simulations of the side-lengths and , whereas provides the better match. A similar behaviour is seen in Figure 12, where and are plotted. In this case, the Planck derived curves are closer to the case. Thus, in both cases, there seems to be an indication of a finite size of our Universe corresponding to a size between and .
Figure 11.
and are displayed for the 3-torus simulations, the infinite CDM model and the four Planck maps, which are all subjected to the same mask.
Figure 11.
and are displayed for the 3-torus simulations, the infinite CDM model and the four Planck maps, which are all subjected to the same mask.

Figure 12.
The same as in Figure 11, but for and .
Figure 12.
The same as in Figure 11, but for and .

6. Discussion and Summary
In the quest for the global topology of the Universe, there have been several methods suggested to unveil the spatial structure on its very largest scales. In this paper, we focus on the Betti functionals applied to the excursion sets , Equation (2), of the CMB, which possess, in this case, a simple geometrical interpretation. With the CMB observed on a sphere , the excursion set decomposes this sphere with respect to the normalized temperature threshold into components and holes. There are three Betti functionals in this case. The first one, , counts the number of connected components, the second one, , the number of topological holes, and finally, , the number of two-dimensional cavities. The latter takes the value of one if the excursion set is the complete sphere; that is, if the threshold is smaller than the lowest normalized temperature on the CMB sphere, otherwise is zero. Since the Betti functionals focus only on the number of structure elements, they are even simpler than the Minkowski functionals. This is because the Minkowski functionals require the computation of the area, the circumference, and a curvature measure of the boundary of the components [28]. As discussed in Section 2, the Minkowski functionals allow a derivation of a relation connecting the average of the normalized standard deviation of the CMB gradient field called with , see Equations (26) and (38), if the CMB is assumed to be a homogeneous, isotropic Gaussian random field. Thus, the properties of and the Betti numbers are not independent.
The common lore is that a spatially finite universe is betrayed by the large scale behaviour of the CMB, for example, the suppression of the quadrupole moment or the low power in the 2-point angular correlation function above sufficiently large angles on the sky, typically above . Often overlooked, a suppression at significantly smaller angles of the angular correlation function is additionally seen such that the amplitude of for the 3-torus models is below that of the infinite CDM model, see [12]. It should be emphasized that this small angle suppression is also visible in obtained from the observed sky.
The definition of as a differential measure reveals its obvious local nature, so that a topological signature on small scales exists also for this quantity, since a dependence of on the volume of the cubic 3-torus was demonstrated in [29], see also Figure 8. In Section 3, it is shown that and display a hierarchical dependence of their amplitudes with respect to the side-length L of the cubic 3-torus, see Figure 7, such that the amplitudes increase with decreasing volume . This behaviour is in nice agreement with the normalized standard deviation of the CMB gradient field. It reveals the local structure in the excursion set via at , see (38). However, since and are, of course, not restricted to the thresholds , they provide a more comprehensive tool than .
The computation of from observational sky maps is hindered due to the presence of masks. The number of connected components and holes is then ambiguous since it is not discernible whether they are connected within the not measured parts, i. e. within the mask. In Section 4, a method is suggested, which gives, for their number, a lower and an upper bound within the observed sky. Finally, Section 5 applies this method to four sky maps released by the Planck collaboration in 2018, called SMICA, Commander, NILC, and SEVEM. The comparison with the cubic 3-torus simulations shows that the curves derived from the four Planck maps lie between the 3-torus models with side-length and , see Figure 11 and Figure 12. So this measure gives a further hint that our Universe has a non-trivial topology.
Author Contributions
Both authors declare that they have contributed substantially to the joint reported work. All authors have read and agreed to the published version of the manuscript.
Funding
This research received no external funding.
Data Availability Statement
The data will not be made public.
Acknowledgments
We would like to thank Thomas Buchert, Martin France, and Pratyush Pranav for discussions. The software packages HEALPix (http://healpix.jpl.nasa.gov, accessed on 20 March 2024, [32]) and CAMB written by A. Lewis and A. Challinor (http://camb.info, accessed on 20 March 2024) as well as the Planck data from http://pla.esac.esa.int/pla/#maps, accessed on 20 March 2024, were used in this work.
Conflicts of Interest
The authors declare no conflicts of interest.
References
- Anchordoqui, L.A.; Di Valentino, E.; Pan, S.; Yang, W. Dissecting the H0 and S8 tensions with Planck + BAO + supernova type Ia in multi-parameter cosmologies. J. High Energy Astrophys. 2021, 32, 28–64. [Google Scholar] [CrossRef]
- Di Valentino, E.; Anchordoqui, L.A.; Akarsu, Ö.; Ali-Haimoud, Y.; Amendola, L.; Arendse, N.; Asgari, M.; Ballardini, M.; Basilakos, S.; Battistelli, E.; et al. Cosmology intertwined III: fσ8 and S8. Astropart. Phys. 2021, 131, 102604. [Google Scholar] [CrossRef]
- Abdalla, E.; Abellán, G.F.; Aboubrahim, A.; Agnello, A.; Akarsu, Ö.; Akrami, Y.; Alestas, G.; Aloni, D.; Amendola, L.; Anchordoqui, L.A.; et al. Cosmology intertwined: A review of the particle physics, astrophysics, and cosmology associated with the cosmological tensions and anomalies. J. High Energy Astrophys. 2022, 34, 49–211. [Google Scholar] [CrossRef]
- Vagnozzi, S. Seven Hints That Early-Time New Physics Alone Is Not Sufficient to Solve the Hubble Tension. Universe 2023, 9, 393. [Google Scholar] [CrossRef]
- Akarsu, Ö.; Colgáin, E.Ó.; Sen, A.A.; Sheikh-Jabbari, M.M. Λ CDM Tensions: Localising Missing Physics through Consistency Checks. arXiv 2024, arXiv:2402.04767. [Google Scholar]
- Schwarz, D.J.; Copi, C.J.; Huterer, D.; Starkman, G.D. CMB anomalies after Planck. Class. Quantum Grav. 2016, 33, 184001. [Google Scholar] [CrossRef]
- Ellis, G.F.R. Topology and cosmology. Gen. Rel. Grav. 1971, 2, 7–21. [Google Scholar] [CrossRef]
- Lachièze-Rey, M.; Luminet, J.P. Cosmic topology. Phys. Rep. 1995, 254, 135–214. [Google Scholar] [CrossRef]
- Levin, J. Topology and the cosmic microwave background. Phys. Rep. 2002, 365, 251–333. [Google Scholar] [CrossRef]
- Luminet, J.P. The Status of Cosmic Topology after Planck Data. Universe 2016, 2, 1. [Google Scholar] [CrossRef]
- Ryan, P.J. Cosmic topology, underdetermination, and spatial infinity. Eur. J. Philos. Sci. 2024, 14, 17. [Google Scholar] [CrossRef]
- Aurich, R.; Janzer, H.S.; Lustig, S.; Steiner, F. Do we live in a ‘small universe’? Class. Quantum Grav. 2008, 25, 125006. [Google Scholar] [CrossRef]
- Cornish, N.J.; Spergel, D.N.; Starkman, G.D. Circles in the sky: Finding topology with the microwave background radiation. Class. Quantum Grav. 1998, 15, 2657–2670. [Google Scholar] [CrossRef]
- Aurich, R.; Lustig, S. A search for cosmic topology in the final WMAP data. Mon. Not. R. Astron. Soc. 2013, 433, 2517–2528. [Google Scholar] [CrossRef]
- Ade, P.A.R. et al. [Planck Collaboration] Planck 2013 results. XXVI. Background geometry and topology of the Universe. Astron. Astrophy. 2014, 571, A26. [Google Scholar] [CrossRef]
- Aurich, R.; Lustig, S. The Hantzsche–Wendt manifold in cosmic topology. Class. Quantum Grav. 2014, 31, 165009. [Google Scholar] [CrossRef]
- Akrami, Y. et al. [COMPACT Collaboration] Promise of Future Searches for Cosmic Topology. arXiv 2022, arXiv:2210.11426. [Google Scholar]
- Petersen, P. et al. [COMPACT Collaboration] Cosmic topology. Part I. Limits on orientable Euclidean manifolds from circle searches. J. Cosmol. Astropart. Phys. 2023, 2023, 030. [Google Scholar] [CrossRef]
- Riazuelo, A.; Weeks, J.; Uzan, J.P.; Lehoucq, R.; Luminet, J.P. Cosmic microwave background anisotropies in multiconnected flat spaces. Phys. Rev. D 2004, 69, 103518. [Google Scholar] [CrossRef]
- Aurich, R.; Lustig, S. Cosmic microwave anisotropies in an inhomogeneous compact flat universe. Class. Quantum Grav. 2011, 28, 085017. [Google Scholar] [CrossRef]
- Eskilt, J.R. et al. [COMPACT Collaboration] Cosmic topology. Part IIa. Eigenmodes, correlation matrices, and detectability of orientable Euclidean manifolds. J. Cosmol. Astropart. Phys. 2024, 03, 036. [Google Scholar] [CrossRef]
- Adler, R.J. The Geometry of Random Fields; Classics in Applied Mathematic; Society for Industrial and Applied Mathematics (SIAM): Philadelphia, PA, USA, 2010. [Google Scholar]
- Edelsbrunner, H.; Harer, J.L. Computational Topology: An Introduction; American Mathematical Society: Providence, RI, USA, 2022. [Google Scholar]
- Munkres, J.R. Elements of Algebraic Topology; CRC Press: Boca Raton, FL, USA, 2018. [Google Scholar]
- Pranav, P. Anomalies in the topology of the temperature fluctuations in the cosmic microwave background: An analysis of the NPIPE and FFP10 data releases. Astron. Astrophy. 2022, 659, A115. [Google Scholar] [CrossRef]
- Pranav, P.; Aurich, R.; Buchert, T.; France, M.J.; Steiner, F. Homology of the Cosmic Microwave Background: Are finite universe models preferred over the infinite standard model? arXiv 2024. in preparation. [Google Scholar]
- Ade, P.A.R. et al. [Planck Collaboration] Planck 2015 results—XIII. Cosmological parameters. Astron. Astrophy. 2016, 594, A13. [Google Scholar] [CrossRef]
- Buchert, T.; France, M.J.; Steiner, F. Model-independent analyses of non-Gaussianity in Planck CMB maps using Minkowski functionals. Class. Quantum Grav. 2017, 34, 094002. [Google Scholar] [CrossRef]
- Aurich, R.; Buchert, T.; France, M.J.; Steiner, F. The variance of the CMB temperature gradient: A new signature of a multiply connected Universe. Class. Quantum Grav. 2021, 38, 225005. [Google Scholar] [CrossRef]
- Akrami, Y. et al. [Planck Collaboration] Planck 2018 results—IV. Diffuse component separation. Astron. Astrophy. 2020, 641, A4. [Google Scholar] [CrossRef]
- Aghanim, N. et al. [Planck Collaboration] Planck 2018 results—I. Overview and the cosmological legacy of Planck. Astron. Astrophy. 2020, 641, A1. [Google Scholar] [CrossRef]
- Górski, K.M.; Hivon, E.; Banday, A.J.; Wandelt, B.D.; Hansen, F.K.; Reinecke, M.; Bartelmann, M. HEALPix: A Framework for High-Resolution Discretization and Fast Analysis of Data Distributed on the Sphere. Astrophys. J. 2005, 622, 759–771. [Google Scholar] [CrossRef]
Disclaimer/Publisher’s Note: The statements, opinions and data contained in all publications are solely those of the individual author(s) and contributor(s) and not of MDPI and/or the editor(s). MDPI and/or the editor(s) disclaim responsibility for any injury to people or property resulting from any ideas, methods, instructions or products referred to in the content. |
© 2024 by the authors. Licensee MDPI, Basel, Switzerland. This article is an open access article distributed under the terms and conditions of the Creative Commons Attribution (CC BY) license (https://creativecommons.org/licenses/by/4.0/).
Share and Cite
MDPI and ACS Style
Aurich, R.; Steiner, F. Betti Functionals as Probes for Cosmic Topology. Universe 2024, 10, 190. https://doi.org/10.3390/universe10050190
AMA Style
Aurich R, Steiner F. Betti Functionals as Probes for Cosmic Topology. Universe. 2024; 10(5):190. https://doi.org/10.3390/universe10050190
Chicago/Turabian StyleAurich, Ralf, and Frank Steiner. 2024. "Betti Functionals as Probes for Cosmic Topology" Universe 10, no. 5: 190. https://doi.org/10.3390/universe10050190
Note that from the first issue of 2016, this journal uses article numbers instead of page numbers. See further details here.