Abstract
Muon absorption radiography is an imaging technique based on the measurement of the absorption of cosmic ray muons. This technique has recently been used successfully to investigate the presence of unknown cavities in the Bourbon Gallery in Naples and in the Chephren Pyramid at Cairo. The MIMA detector (Muon Imaging for Mining and Archaeology) is a prototype muon tracker for muon radiography for application in the fields of archaelogy and mining. It is made of three pairs of X-Y planes each consisting of 21 scintillator bars with a silicon photomultiplier readout. The detector is compact, robust, easily transportable, and has a low power consumption: all of which makes the detector ideal for measurements in confined and isolated environments. With this detector, a measurement from inside the Temperino mine in the San Silvestro archaeo-mining park in Tuscany was performed. The park includes about 25 km of mining tunnels arranged on several levels that have been exploited from the Etruscan time. The measured muon absorption was compared to the simulated one, obtained from the information provided by 3D laser scanner measurements and cartographic maps of the mountain above the mine, in order to obtain information about the average density of the rock. This allowed one to confirm the presence of a partially accessible exploitation opening and provided some hints regarding the presence of a high-density body within the rock.
1. Introduction
When primary cosmic rays enter the atmosphere, they produce showers of secondary particles, including mesons such as pions and kaons, which can decay into muons. For energies greater than , muons are the most abundant charged particles in cosmic rays at sea level: their integrated flux in the vertical direction is about [1].
Muons are low-interacting particles (the most energetic muons in cosmic rays can pass through hundreds of meters of rock), and this allows for their use in radiographic measurements. Muon radiography is similar to X-ray radiography: it is a non-invasive imaging technique that can be used to measure the mean density of matter along a line of sight. The muon flux measured in different directions is compared to that obtained by simulating the particles’ propagation through the structure under study, reconstructing the two-dimensional density profile of the traversed matter.
This muon radiography technique was exploited for the first time in 1955 to determine the rock overburden on a mountain tunnel [2]. In 1970, the Nobelist Louis Alvarez and his collaborators performed a radiographic measurement of the Chephren Pyramid in Egypt and they were able to exclude the existence of a hidden burial chamber [3]. Following these pioneering measurements, more recently muon absorption radiography was taken again into consideration, at first by Japanese groups [4] and later by Italian, French, Canadian, American, and other groups ([5,6,7,8,9,10,11,12,13], to name a few) for application in the fields of volcanology, archaeology, and mining. The MURAVES project (MUon RAdiography of VESuvius) [14], born of the collaboration between INGV (National Institute of Geophysics and Volcanology) and INFN (National Institute of Nuclear Physics), aims to study the interior of Mount Vesuvius near Naples using muon radiography. The MIMA project builds on the expertise gained from the MURAVES experiment [15]. Last year, a radiographic measurement of underground cavities of the Bourbon Gallery at Mt. Echia (Naples) was made both with MU-RAY [16], a prototype for the MURAVES experiment, and MIMA trackers from three different locations. This confirmed the presence of an unknown cavity previously detected by MU-RAY [9]. Recently, a large void in the Cheops Pyramid in Cairo has been discovered by the ScanPyramids collaboration using the muography technique [13].
2. The MIMA Project
The aim of the MIMA project is to use muon imaging for archaeological, mining, and civil engineering applications, looking for hidden cavities or higher-density regions.
2.1. The Detector
The MIMA detector was designed and built to fulfill a number of requirements. Among these are as follows:
- low power consumption (roughly ), allowing it to be powered by means of a small set of photovoltaic panels;
- lightness and compactness for ease of transportation, as the entire apparatus weighs less than and the tracker is contained within a cubic aluminum frame of per side;
- a spatial resolution of the order of a few millimeters ().
The MIMA tracker is composed of three X-Y tracking modules stacked inside a cubic aluminum frame mounted on an altazimuthal platform, which allows one to modify the telescope pointing direction. A picture of the detector with the three modules clearly visible is shown in Figure 1.
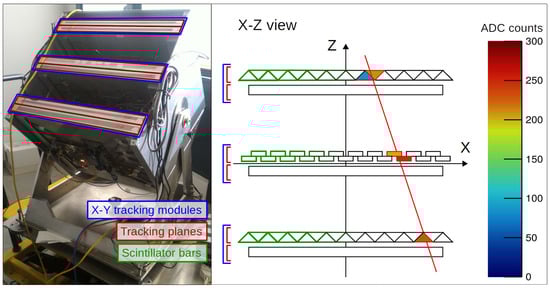
Figure 1.
On the left: a picture of the MIMA detector showing its structure. One can see the three X-Y tracking modules, the rotating platform, and part of the electronics. On the right: an example of a reconstructed track in the X-Z view. The type of bars and their arrangement is shown for this view, and the color map on the right indicates the intensity of the signal detected on the single bars.
Each module consists of two identical and independent tracking planes, which in turn are each made up of 21 plastic scintillator bars assembled in such a way as to produce a 40 × 40 active detection surface. For each module, one plane measures the X position and the other the Y position of the muon traversing it. The distance between the centers of the top module and the bottom one was set to in order to obtain a good tradeoff between the angular resolution () and the geometrical factor for the six-plane coincidence configuration ().
The outer four planes consist of triangular section bars that allow for the use of a weighted average algorithm to determine the muon crossing coordinate obtaining a spatial resolution smaller than the readout step. The two central planes are instead made up of rectangular section bars in order to test this different setup.
Every bar is read out using two silicon photomultiplier (SiPM) photosensors whose signals are added together by a sum card. The readout system is made of six independent boards, called slave boards, one for each plane, based on the EASIROC chip, a 32-channel analogue front-end ASIC to read out SiPM photosensors. The six slave boards are controlled by a single master board that manages the configuration of the slave boards, the trigger logic, and the data file transfer. The control of the acquisition system and the data storage is entrusted to a Raspberry Pi with a 64 GB SDHC memory card. The network connection of the Raspberry Pi, although not essential, is useful to monitor the status of the instrument.
2.2. Track Reconstruction
Muon tracks are reconstructed independently event-by-event in the X-Z and Y-Z views. Clusters are formed on the basis of one or more neighbouring bars registering a signal sufficiently higher than the noise level. In each view, a successful alignment (residuals within ) of clusters belonging to the three planes of the same view defines a candidate projected track. The three-dimensional track is obtained by combining the tracks in the two projections. Only events containing a single muon track were selected, rejecting ambiguous events where more than one track could be reconstructed. For these “golden” tracks, we define an angular acceptance of approximately ° with respect to the MIMA axis. To increase the acceptance, those tracks passing only through the central module and at least one of the two outer modules (crossing a total of four tracking planes) were also included. In this case, it was not possible to check the quality of the track, but the angular acceptance was extended up to approximately °, increasing the statistical sample size by almost 80% for this case.
3. Measurement Site and Goal
The Park of San Silvestro in Campiglia Marittima is an archaeological site, where traces of Etruscan, Medieval, and modern mining activity are still visible and partially open to visitors. Mining activity dates back to Etrusco-Roman times and ended in 1982. Early (Etruscan to Medieval) miners dug narrow and tortuous shafts following the steeply inclined bodies of skarn (a metasomatic rock made by hedenbergite and ilvaite) rich in Cu–Fe–Pb–Zn–Ag sulfides [17,18]. The typical densities of the rocks present in the mine are reported in Table 1.

Table 1.
Typical densities of the rocks present in the mine.
Locally the concentration of sulfides was exceptional and the excavation resulted in large exploitation openings (up to several hundreds of cubic metres) that were partially backfilled by the subsequent mining activity. The Temperino mine is now composed of a series of tunnels on multiple levels, with the shallower ones cutting through ancient mining shafts.
The aim of our measurement is to test the MIMA detector for use in the fields of archaeology and mining. Using muon absorption radiography, it is possible to detect the presence of cavities and tunnels dug into the rock including the ancient ones, which are now inaccessible. We focused especially on the detection of a large accessible cavity called Gran Cava (see Figure 2). The Gran Cava is an old, large exploitation opening, directly connected to the surface, that was enlarged during the Renaissance era by modern industrial activity.
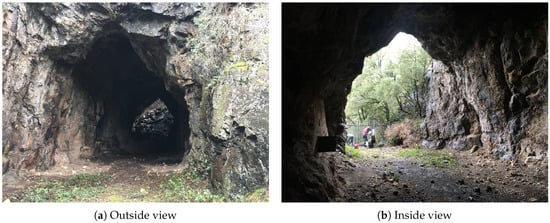
Figure 2.
Pictures of the Gran Cava. (a) From the outside view, one can see the light from the exit at the end of the cavity where there is a vertical opening. (b) In the picture from the inside of the quarry, the authors can be spotted working on the laser scanner survey of the cave.
From the radiography measurement it is also possible to estimate the average density of the rock in various directions along the line of sight of the detector. To do this, we conducted surveys of both the inside of the mine and the overlying hill through measurements with a 3D laser scanner, obtaining a map of both the Temperino mine and the Gran Cava (see Figure 3).
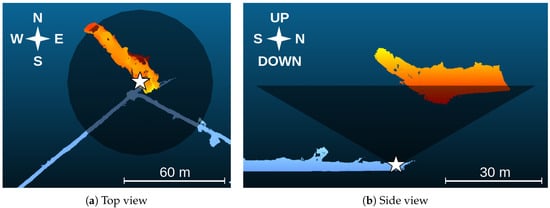
Figure 3.
Maps of both the Temperino mine (blue) and the Gran Cava (red). The detector position is marked with the white star, and the acceptance cone (° from the vertical direction) is represented by the dark area up to a height of about . For the sake of clarity, the outline of the hill is not shown.
This enabled us both to determine the position of the MIMA tracker with a spatial resolution of a few centimeters and to obtain the position of the Gran Cava from the detector’s point of view. For the survey of the hill, we employed a digital terrain model in order to obtain a total coverage of the area observed by our detector. For this initial analysis, we used an interpolation of a model with a spatial resolution of 10 m [19].
For the measurement, the tracker was placed in a cave along the tunnel of the Temperino mine just below the Gran Cava and oriented vertically. To protect the detector against moisture, it was placed inside a wooden box and equipped with an incandescent lamp and two small fans. Approximately events were accepted by the trigger during 53 days. A free sky calibration sample of about events was acquired on the roof of the building of the Florence section of INFN in 17 days of data collection. From here on, we will refer to these two measures, respectively, as the target (tar) and the free sky configuration (free).
4. Absorption Radiography of the Temperino Mine
The muon measured transmission as a function of the observing direction () is defined as
where is the angle between the line of sight and the vertical direction, called the zenith angle, is the pointing angle from the north direction, known as the azimuth angle, is the muon flux reaching the detector inside the mine (in the target configuration) and is the measured flux in the free sky configuration.
The measured flux in each configuration can be computed as
where is the number of detected tracks with direction , t is the acquisition time, and is the effective area of the detector for that direction. This last term can be computed as the product of the acceptance surface of the detector for a certain direction , which depends only on the detector geometry, times the trigger efficiency , which is obtained from the product of each plane trigger efficiency, times the data acquisition efficiency , which is a function of the trigger rate. To exclude the contribution of the data acquisition efficiency , we considered the detector live time as the acquisition time t.
The angular distributions of the number of reconstructed tracks are reported in Figure 4 for the two different configurations. For these and all the following maps, we used a polar reference frame where the distance from the center of the map represents the zenith angle (the center corresponds to the vertical direction) and the azimuth angle is the angle from the north direction that is pointing upwards in the maps. In this way, it is easier to compare maps of this kind with the cartographic ones.
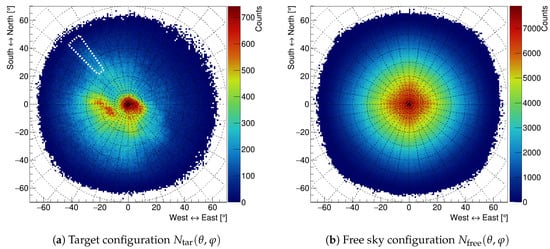
Figure 4.
Track angular distribution for the two different configurations. All the maps are drawn using the polar reference frame: in the center there is the vertical direction, the circles correspond to directions with the same zenith angle and the lines indicate directions with the same azimuth angle (both are represented with a ° step). The white dotted region in the target configuration will be considered below for a quantitative analysis (see also Figure 6b).
The measured transmission formula can be simplified considering that the acceptance surface is independent from the measurement configuration and that the trigger efficiency variations can be neglected for this application. In fact, the trigger inefficiencies of each plane are of the order of or smaller while the variations observed for the final measure are of the order of (see Figure 6a for the relative transmission R). We can now reasonably suppose that remains the same in the two configurations, yielding
The measured transmission in the polar reference frame is shown in Figure 5a. To reduce statistical fluctuations and enhance the correlation between adjacent bins a smoothing filter was used: Each bin content is the arithmetic mean of the nine adjacent bins.
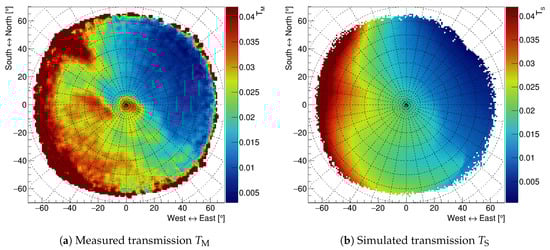
Figure 5.
Measured and simulated muon transmission in the polar reference frame. For the measured transmission, a smoothing algorithm was used to reduce the statistical fluctuations and enhance the correlation between adjacent bins. For the simulated transmission, we used .
Hence, the measured transmission can be compared to the expected value. From the digital terrain model of the area, we can create a map of the rock depth along the line of sight of the detector for each direction , assuming the absence of any cavity. From a single muon radiographic measurement, information can be inferred regarding the amount of matter traversed by the particle along a certain direction. This can be defined as the opacity X:
where is the density of the traversed matter, the integral is computed along the line of sight (l.o.s.) defined by the direction , and is the average density in that direction. The opacity X is closely related to the simulated transmission that can be defined as in Equation (1), but here we must use the simulated fluxes for the two configurations. The simulated fluxes can be computed as
where is the differential muon flux as a function of both the muon energy E and the muon incoming direction ; is the minimum energy that muons must have in order to cross the opacity X and reach the detector in the target configuration; is the minimum energy required to detect muons in the free sky configuration, estimated at about , because of the opacity of the detector itself. The minimum muon energy was obtained from the opacity X using the tabulated values present in the literature [20]. For the differential muon flux , we used the one measured by the ADAMO experiment [21]. The ADAMO measurements were performed in Florence at various angles from the vertical to almost the horizontal direction (°), and they turned out to be consistent with other measurements in the literature in the high energy range, while they slightly differ in the low energy range because of solar modulation [22].
The simulated transmission in the polar reference frame is reported in Figure 5b, assuming for the average density a constant value of (this is just an arbitrary initialization value that falls within the density range reported in Table 1).
The presence of a cavity is thus identified by an excess in the measured transmission relative to the simulated one. The relative transmission, defined as , will be roughly equal to unity in case the correct average rock density is chosen, whereas it will be greater than unity when the average density for a certain line of sight is lower than the one used for the simulation (which could be related to the presence of a cavity) and conversely.
A map of the relative transmission in the polar reference frame obtained for a constant average density of is shown in Figure 6a. As can be observed from the map, the signal region in the northwest direction matches the position of the first part of the Gran Cava, marked with black points, where the cave is highest. The large signal in the center of the map corresponds to the Gran Cava end where there is a vertical opening that was not described in the digital terrain model. Consequently, this region, not having been taken into account as an opening in the simulation, is revealed to be a void. From the Gran Cava position (see Figure 3a), one might expect a continuity between these two signal regions, which however is missing. This can be due to the presence of a high-density rock mass corresponding to a high concentration of sulfides. In this way, the high-density rock volume would compensate the effect of the overlying cavity and mask its presence, removing the continuity between the two void regions. This hypothesis is supported by the presence of a low relative transmission area (in blue) along the east–west direction crossing the Gran Cava region. We also obtained other signal regions that might correspond to unknown cavities (inspections by speleologists are planned for the future). However, conclusive statements cannot be made for these smaller anomalies because of the coarseness of the digital terrain model of the overlying hill: for this first analysis, we used an interpolation of a model with a spatial resolution of 10 m. The red region near the acceptance boundary is not particularly relevant because of the small statistical sample and the uncertainty on the digital terrain model.
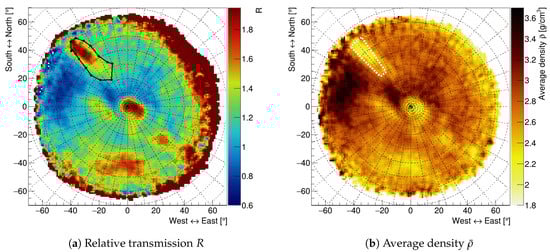
Figure 6.
Relative transmission and average density maps in the polar reference frame with smoothing filter. The first part of the Gran Cava is marked with black points. Similarity to the dark area of Figure 3a can be observed thanks to the choice of the polar reference frame. The angular region indicated by the white dotted line in the density map was used to validate the presence of the cavity.
By changing the density value for each direction in order to normalize the relative transmission to unity, we can obtain the average density distribution as a function of the direction , as shown in Figure 6b. The obtained density values are compatible with those of the rocks actually present in the mine.
In order to validate the obtained result, we evaluated the probability that the signal region in the northwest direction could be due to a statistical fluctuation in the hypothesis of the absence of any cavity. We selected the angular region with and reported in Figure 4a and Figure 6b, and we compared the number of measured tracks in that area with those expected from the simulation (). For the simulated transmission , a constant density of was used, which is the lowest density value for the rock in the mine (see Table 1), choosing the worst-case scenario to validate the presence of the cavity. Nevertheless, the following results were obtained:
indicating that the number of measured tracks is times larger than the one expected. Hence, we can reject the hypothesis of a uniform rock layer for that angular region, and we can conclusively confirm the presence of the Gran Cava from muography measurements.
5. Conclusions
The MIMA detector was installed in a tunnel in the Temperino mine in Campiglia Marittima, and data was recorded over a 53-day run. The muography technique was used to identify the Gran Cava with a high confidence level, reconfirming the method’s potential and the functionality of the MIMA detector in the fields of mining and archaeology. A map of the average density distribution in the angular acceptance of the detector is presented. Indications of the existence of heretofore unknown cavities and of a high-density rock vein have been obtained. More precise simulation analyses are ongoing, both to increase the digital terrain model precision and to take into account the known accessible cavity. Further measurements will be performed from different locations in order to triangulate the observed cavities and obtain an estimate of their positions. To further develop the simulation, we will try to integrate a voxelization of the inspected volume, setting a variable density for every voxel. This would permit us to take into account the presence of known cavities and higher density regions and subtract their contribution.
Author Contributions
Conceptualization: L.B., V.C., A.D., and R.D.; methodology: L.B. and P.N.; software: G.B., L.B., M.B., V.C., N.M., and L.V.; formal analysis: G.B., L.B., S.G. (Sandro Gonzi), L.L.; investigation and installation: G.B., L.B., M.B., R.C., V.C., A.D., C.D.V., R.D., G.G., S.G. (Sandro Gonzi), L.L., B.M., M.N., and L.V.; resources: D.B., L.C., S.G. (Silvia Guideri), and G.S.; data curation: G.B., L.B., S.G. (Sandro Gonzi), L.L., and B.M.; writing—original draft preparation: G.B.; writing—review and editing: all authors; visualization: G.B., L.B., and L.L.; supervision and project administration: L.B., D.B., N.C., and R.D.
Funding
The development of the MIMA tracker was funded by INFN and by the Department of Physics and Astronomy of the University of Florence. The travel expenses were funded by the University of Florence and by INFN.
Acknowledgments
We thank T. Nerdi for language editing.
Conflicts of Interest
The authors declare no conflict of interest.
Abbreviations
The following abbreviations are used in this manuscript:
| MIMA | Muon Imaging for Mining and Archaeology |
| MURAVES | MUon RAdiography of VESuvius |
| INGV | National Institute of Geophysics and Volcanology |
| INFN | National Institute of Nuclear Physics |
| SiPM | Silicon PhotoMultiplier |
| ASIC | Application Specific Integrated Circuit |
| SDHC | Secure Digital High Capacity |
| tar | target configuration |
| free | free sky configuration |
| l.o.s. | line of sight |
References
- Patrignani, C.; Particle Data Group. Review of particle physics. Chin. Phys. C 2016, 40, 100001. [Google Scholar]
- George, E.P. Cosmic rays measure overburden of tunnel. Commonw. Eng. 1955, 455–457. [Google Scholar]
- Alvarez, L.W.; Anderson, J.A.; El Bedwei, F.; Burkhard, J.; Fakhry, A.; Girgis, A.; Goneid, A.; Hassan, F.; Iverson, D.; Lynch, G.; et al. Search for hidden chambers in the pyramids. Science 1970, 167, 832–839. [Google Scholar] [CrossRef] [PubMed]
- Tanaka, H.; Nagamine, K.; Kawamura, N.; Nakamura, S.; Ishida, K.; Shimomura, K. Development of a two-fold segmented detection system for near horizontally cosmic-ray muons to probe the internal structure of a volcano. Nucl. Instrum. Methods Phys. Res. A-Accel. Spectrom. Detect. Assoc. Equip. 2003, 507, 657–669. [Google Scholar] [CrossRef]
- Anastasio, A.; Ambrosino, F.; Basta, D.; Bonechi, L.; Brianzi, M.; Bross, A.; Callier, S.; Cassese, F.; Castellini, G.; Ciaranfi, R.; et al. The MU-RAY experiment. An application of SiPM technology to the understanding of volcanic phenomena. Nucl. Instrum. Methods Phys. Res. A-Accel. Spectrom. Detect. Assoc. Equip. 2013, 718, 134–137. [Google Scholar] [CrossRef]
- Carloganu, C.; Tomuvol Collaboration. Density Imaging of Volcanoes with Atmospheric Muons using GRPCs. In Proceedings of the XXIst International Europhysics Conference on High Energy Physics (EPS-HEP2011), Grenoble, France, 21–27 July 2011; p. 55.
- Jourde, K.; Gibert, D.; Marteau, J.; de Bremond D’Ars, J.; Komorowski, J.C. Muon dynamic radiography of density changes induced by hydrothermal activity at the La Soufrière of Guadeloupe volcano. Sci. Rep. 2016, 6, 33406. [Google Scholar] [CrossRef] [PubMed] [Green Version]
- Schouten, D.; Ledru, P. Muon Tomography Applied to a Dense Uranium Deposit at the McArthur River Mine. J. Geophys. Res. Solid Earth 2018, 123, 8637–8652. [Google Scholar] [CrossRef]
- Saracino, G.; Amato, L.; Ambrosino, F.; Antonucci, G.; Bonechi, L.; Cimmino, L.; Consiglio, L.; D’Alessandro, R.; De Luzio, E.; Minin, G.; et al. Imaging of underground cavities with cosmic-ray muons from observations at Mt. Echia (Naples). Sci. Rep. 2017, 7, 1181. [Google Scholar] [CrossRef] [PubMed]
- Guardincerri, E.; Rowe, C.; Schultz-Fellenz, E.; Roy, M.; George, N.; Morris, C.; Bacon, J.; Durham, M.; Morley, D.; Plaud-Ramos, K.; et al. 3D Cosmic Ray Muon Tomography from an Underground Tunnel. Pure Appl. Geophys. 2017, 174, 2133–2141. [Google Scholar] [CrossRef]
- Saracino, G.; Ambrosino, F.; Bonechi, L.; Bross, A.; Cimmino, L.; Ciaranfi, R.; D’Alessandro, R.; Giudicepietro, F.; Macedonio, G.; Martini, M.; et al. The MURAVES muon telescope: technology and expected performances. Ann. Geophys. 2017, 60, 0103. [Google Scholar] [CrossRef] [Green Version]
- Nishiyama, R.; Ariga, A.; Ariga, T.; Käser, S.; Lechmann, A.; Mair, D.; Scampoli, P.; Vladymyrov, M.; Ereditato, A.; Schlunegger, F. First measurement of ice-bedrock interface of alpine glaciers by cosmic muon radiography. Geophys. Res. Lett. 2017, 44, 6244–6251. [Google Scholar] [CrossRef] [Green Version]
- Morishima, K.; Kuno, M.; Nishio, A.; Kitagawa, N.; Manabe, Y.; Moto, M.; Takasaki, F.; Fujii, H.; Satoh, K.; Kodama, H.; et al. Discovery of a big void in Khufu’s Pyramid by observation of cosmic-ray muons. Nature 2017, 552, 386–390. [Google Scholar] [CrossRef] [PubMed] [Green Version]
- Bonechi, L.; Ambrosino, F.; Cimmino, L.; D’Alessandro, R.; Macedonio, G.; Melon, B.; Mori, N.; Noli, P.; Saracino, G.; Strolin, P.; et al. The MURAVES project and other parallel activities on muon absorption radiography. EPJ Web Conf. 2018, 182, 02015. [Google Scholar] [CrossRef]
- Baccani, G.; Bonechi, L.; Ciaranfi, R.; Cimmino, L.; Ciulli, V.; D’Alessandro, R.; Melon, B.; Noli, P.; Saracino, G.; Viliani, L. The MIMA project. Design, construction and performances of a compact hodoscope for muon radiography applications in the context of Archaeology and geophysical prospections. arXiv, 2018; arXiv:1806.11398. [Google Scholar]
- Ambrosino, F.; Anastasio, A.; Basta, D.; Bonechi, L.; Brianzi, M.; Bross, A.; Callier, S.; Caputo, A.; Ciaranfi, R.; Cimmino, L.; et al. The MU-RAY project: Detector technology and first data from Mt. Vesuvius. J. Instrum. 2014, 9, C02029. [Google Scholar] [CrossRef]
- Vezzoni, S.; Dini, A.; Rocchi, S. Reverse telescoping in a distal skarn system (Campiglia Marittima, Italy). Ore Geol. Rev. 2016, 77, 176–193. [Google Scholar] [CrossRef]
- Dini, A.; Guideri, S.; Orlandi, P. Miniere e Minerali del Campigliese—Il Mondo Sotterraneo Del Parco Di San Silvestro; Gruppo Mineralogico Lombardo: Milano, Italy, 2013; p. 98. [Google Scholar]
- Data Source: “Regione Toscana—Modello Digitale del Terreno Orografico”. Available online: http://www502.regione.toscana.it/geoscopio/cartoteca.html (accessed on 27 February 2018).
- Groom, D.E.; Mokhov, N.V.; Striganov, S.I. Muon stopping power and range tables 10 MeV–100 TeV. At. Data Nucl. Data Tables 2001, 78, 183–356. [Google Scholar] [CrossRef]
- Bonechi, L.; Bongi, M.; Fedele, D.; Grandi, M.; Ricciarini, S.; Vannuccini, E. Development of the ADAMO detector: Test with cosmic rays at different zenith angles. Int. Cosm. Ray Conf. 2005, 9, 283. [Google Scholar]
- Bonechi, L. Misure di raggi cosmici a terra con l’esperimento ADAMO. Ph.D. Thesis, University of Florence, Florence, Italy, 2004. [Google Scholar]
© 2019 by the authors. Licensee MDPI, Basel, Switzerland. This article is an open access article distributed under the terms and conditions of the Creative Commons Attribution (CC BY) license (http://creativecommons.org/licenses/by/4.0/).