1. Introduction
The neutrals are introduced into the tokamak plasma in many ways such as direct recycling from the material surface, gas puffs, supersonic molecular beam injection (SMBI), and pellet injection. These neutrals enter inside the plasma and interact with plasma particles, penetrate further, and influence the global plasma parameters of a discharge. Recycled neutral particles are not only essential for the active density control but they also influence the ion-temperature-gradient-driven turbulence [
1]. The neutral particles play an important role in achieving H-mode in tokamak by participating in the edge pedestal formation [
2] as the neutrals can enter the edge dynamics through the particles, momentum, and energy balance. The study of neutral particle penetration inside the plasmas is very much important for fusion community and the neutral particle dynamic is usually studied experimentally in combination with Monte Carlo technique-based neutral particle transport code, such as DEGAS2 [
3] and EIRENE [
4].
The penetration of neutral particles inside the plasma is studied in many tokamaks. The neural particle distribution is modeled to study the effect of neutral in L-H transition in DIII-D tokamak. It is found that the increase in neutral density in the scrape-off layer region increases the plasma density, which in turn increases the opacity to the neutrals and so reduces neutral particle penetration [
5]. The spatially resolved H
α emission is investigated with the help of simulation from the EIRENE code in the TJ-II stellarator having low density (n
e = (1–10) × 10
12) cm
−3 and high temperature (T
e = 40–400 eV) plasma edge and it is found that the H atoms penetrate significantly into the plasma center located at 13.5 cm from the separatrix [
6]. This is explained using the low screening capability of the low-density plasma along with plasma shape of the TJ-II stellerator. Recently, a kinetic model is developed for calculation of neutral atom penetration into plasmas [
7] and Balmer spectral line shapes are calculated for specific line of sight typical for International Thermonuclear Energy Reactor (ITER) diagnostics. The H
α spectral line shape is also studied in many tokamaks such as TFTR [
8], JT60 [
9], and HT-6M [
10] to find out the contribution in spectral emission from the various physical, atomic, and molecular processes and also to estimate the temperature of neutrals produced from above mentioned processes. It is commonly believed that neutral particles produced by Franck–Condon and charge-exchange processes actively participate towards the penetration of neutral particles into the plasma due to their relative higher energies [
11].
In this study, the neutral particle transport code DEGAS2, which is already applied to understand the neutral particle behavior for typical ADITYA discharges [
12,
13], is used to model experimental H
α emission to understand the role of charge-exchange process to the presence of neutral particles in the central region of the ADITYA tokamak. This is done by modeling the experimental H
α spectrum to find out the temperature of the warm components (coming from molecular hydrogen, molecular hydrogen ion dissociation, and Franck–Condon dissociation processes) and hot components (coming from the charge-exchange process) [
9] of the neutral to understand their penetration in the plasma as the penetration length of the product atom depends on its velocity. The contributions in the spectral emission from the various molecular processes are also obtained to understand their relative importance. In addition to that, the experimentally measured spatial profiles of brightness from two plasma discharges having low and high densities are modeled to understand how the presence of neutral hydrogen in the core region of the plasma alters with change in electron density.
The paper is organized as follows: In the next section, we briefly describe the ADITYA tokamak and its diagnostics. Next, the necessary input data for the DEGAS2 code is briefly described. In
Section 4 we present the detailed results with discussion. The results are concluded in
Section 5.
3. DEGAS2 Code and Its Input Parameters
The implementation of the DEGAS2 code and the details of the input parameters are described in [
12,
13], only a brief description is given here. DEGAS2 solves the following kinetic Boltzmann equation for neutral atoms and molecules.
where f represents the distribution function of neutral atoms and molecules and which is the function of position vector r, velocity vector v, and time t. The right-hand side of Equation (1) includes collision operator C, which contains the different atomic and molecular processes involving the interaction between neutral and charged particles. Presently, time-independent steady-state solution of the above equation is used.
Figure 1 shows the schematic diagram of ADITYA tokamak that contains reconstructed flux surfaces from IPREQ [
19] code for a typical plasma discharge which is used as an input to create the limiter geometry [
13]. The plasma parameters i.e., electron density (n
e) and electron temperature (T
e) are also used in the code as input. The radial profile of electron density is obtained from seven-channel microwave interferometer measurements [
15] spanning over the whole plasma poloidal cross-section which is fitted with Equation (2). It is noticed that the fitting error is less than 5%. Similarly, the radial profile of temperature is reconstructed after using Equation (3), where the measured values are used at the plasma center (T
e,0) (from soft x-ray) and at the plasma edge (T
e,a) (from Langmuir probe and spectroscopy) [
14,
16,
20].
where n
e,0 (T
e,0) and n
e,a (T
e,a) are the central density (temperature) and edge density (temperature), respectively. The value of α and β are 0.65 and 1.75, respectively. The core and edge values of density and temperature which are used in Equations (2) and (3) are provided while presenting the result from the modeling.
The atomic and molecular reactions, which are included in DEGAS2 code for the present simulation, are listed in
Table 1.
The electron impact excitation process of hydrogen atom (Equation (I)), which results in the excited hydrogen atom, is calculated using the COLLRAD [
21] code and the results are fed into the DEGAS2 code. This COLLRAD code is a collisional-radiative (CR) code for hydrogen which outputs the population coefficients N
m/N
1 (N
m is the density of neutral in upper excited state and N
1 is the ground state density of hydrogen atom) as a function of electron density and temperature. The rate coefficients for the reactions of Equations (II–XIII), Equation (XV), and Equation (XVII) mentioned in
Table 1 are obtained from Janev et al. [
22,
23]. The rate coefficients of Equation (XIV) and Equation (XVI) are obtained from [
8] and [
6], respectively. Recombination process which is considered in Equation (III) does not play a significant role in the present temperature range. Also, the three-body recombination process i.e.,
is only effective at low temperature and high densities (plasma temperature ~0.5 eV and plasma densities above 5 × 10
14 cm
−3) as discussed in [
24,
25] and presently not considered. It is worth to mention that, the effect of electron/ion density and effective charge of the plasma (Z
eff) has not been included in the charge-exchange reaction rate coefficient presented in Equation (IV). The effect of these parameters can be included by obtaining the charge-exchange rate coefficient through the details population balance calculation using CR model. As discussed in [
26], when the electron density becomes >10
13 cm
−3, the rate coefficient shows a density dependence as the radiative decay time and beam-plasma collisional time becomes comparable to each other. Hence, this effect will be less significant in the edge region of the ADITYA; however, calculations from the core region may be affected considering the plasma effect in charge-exchange cross section. Along with these, the reaction H
++H→H(n=3)+H
+ is not considered in present simulation since cross section of this reaction is much smaller in the present parameter range [
27]. Equation (V) represents the reaction process in which molecular hydrogen (H
2) dissociates into two ground state atoms (H) having mean energies of ~3 eV. This is the dominant H
2 dissociation channel for the edge plasmas with electron temperature range, (T
e ) 5–15 eV. While for the lower T
e (<5 eV), the reaction in Equation (XVII) (charge exchange of molecular hydrogen ion (H
2+) by proton impact) dominates [
8]. For higher T
e (>15 eV), molecular hydrogen ionization process by electron impact occurs, which follows the dissociation process shown in Equation (XI), where product H atom has an energy of ~4.3 eV [
9]. The molecular hydrogen ion dissociation reaction (Equation (XI)) rate (~10
−7 cm
3 s
−1) is maximum among all the other reaction rate coefficients for the temperature range used for present simulation i.e., 12 eV ≤ T
e ≤ 500 eV. However, the detailed discussion of these atomic and molecular processes is described elsewhere [
13].
Apart from the above processes, the plasma-material interaction processes, such as reflection, desorption, and the sputtering of hydrogen by hydrogen and carbon are also included [
12]. In the present case, the fully recycling process is described by considering the fact that the atoms which are not reflected are adsorbed instantaneously. This H atom then recombined with another H atom and desorbed as H
2 molecules. Hence, the recycling coefficient R is represented by three coefficients, such as, desorption coefficient (P
d), adsorption coefficient (P
a) and reflection yield (P
r). It can be represented as
Pd = 1 = R = 1 −
Pr −
Pa. The reflection process, which is basically reflection of hydrogen atom from carbon being the limiter material, has the maximum reflection yield of ~0.45 at T
e of ~7 eV. The sputtering of hydrogen by hydrogen and carbon is contributed insignificantly in the present range of plasma parameters. For the present numerical simulation, the particle source is considered to be located at the limiter position and the particles are only impelled through recycling from the limiter surface. Other sources of particles, such as gas puff and hydrogen molecular beam injection and also the pumping effect, are not considered in the present simulation.
4. Results and Discussions
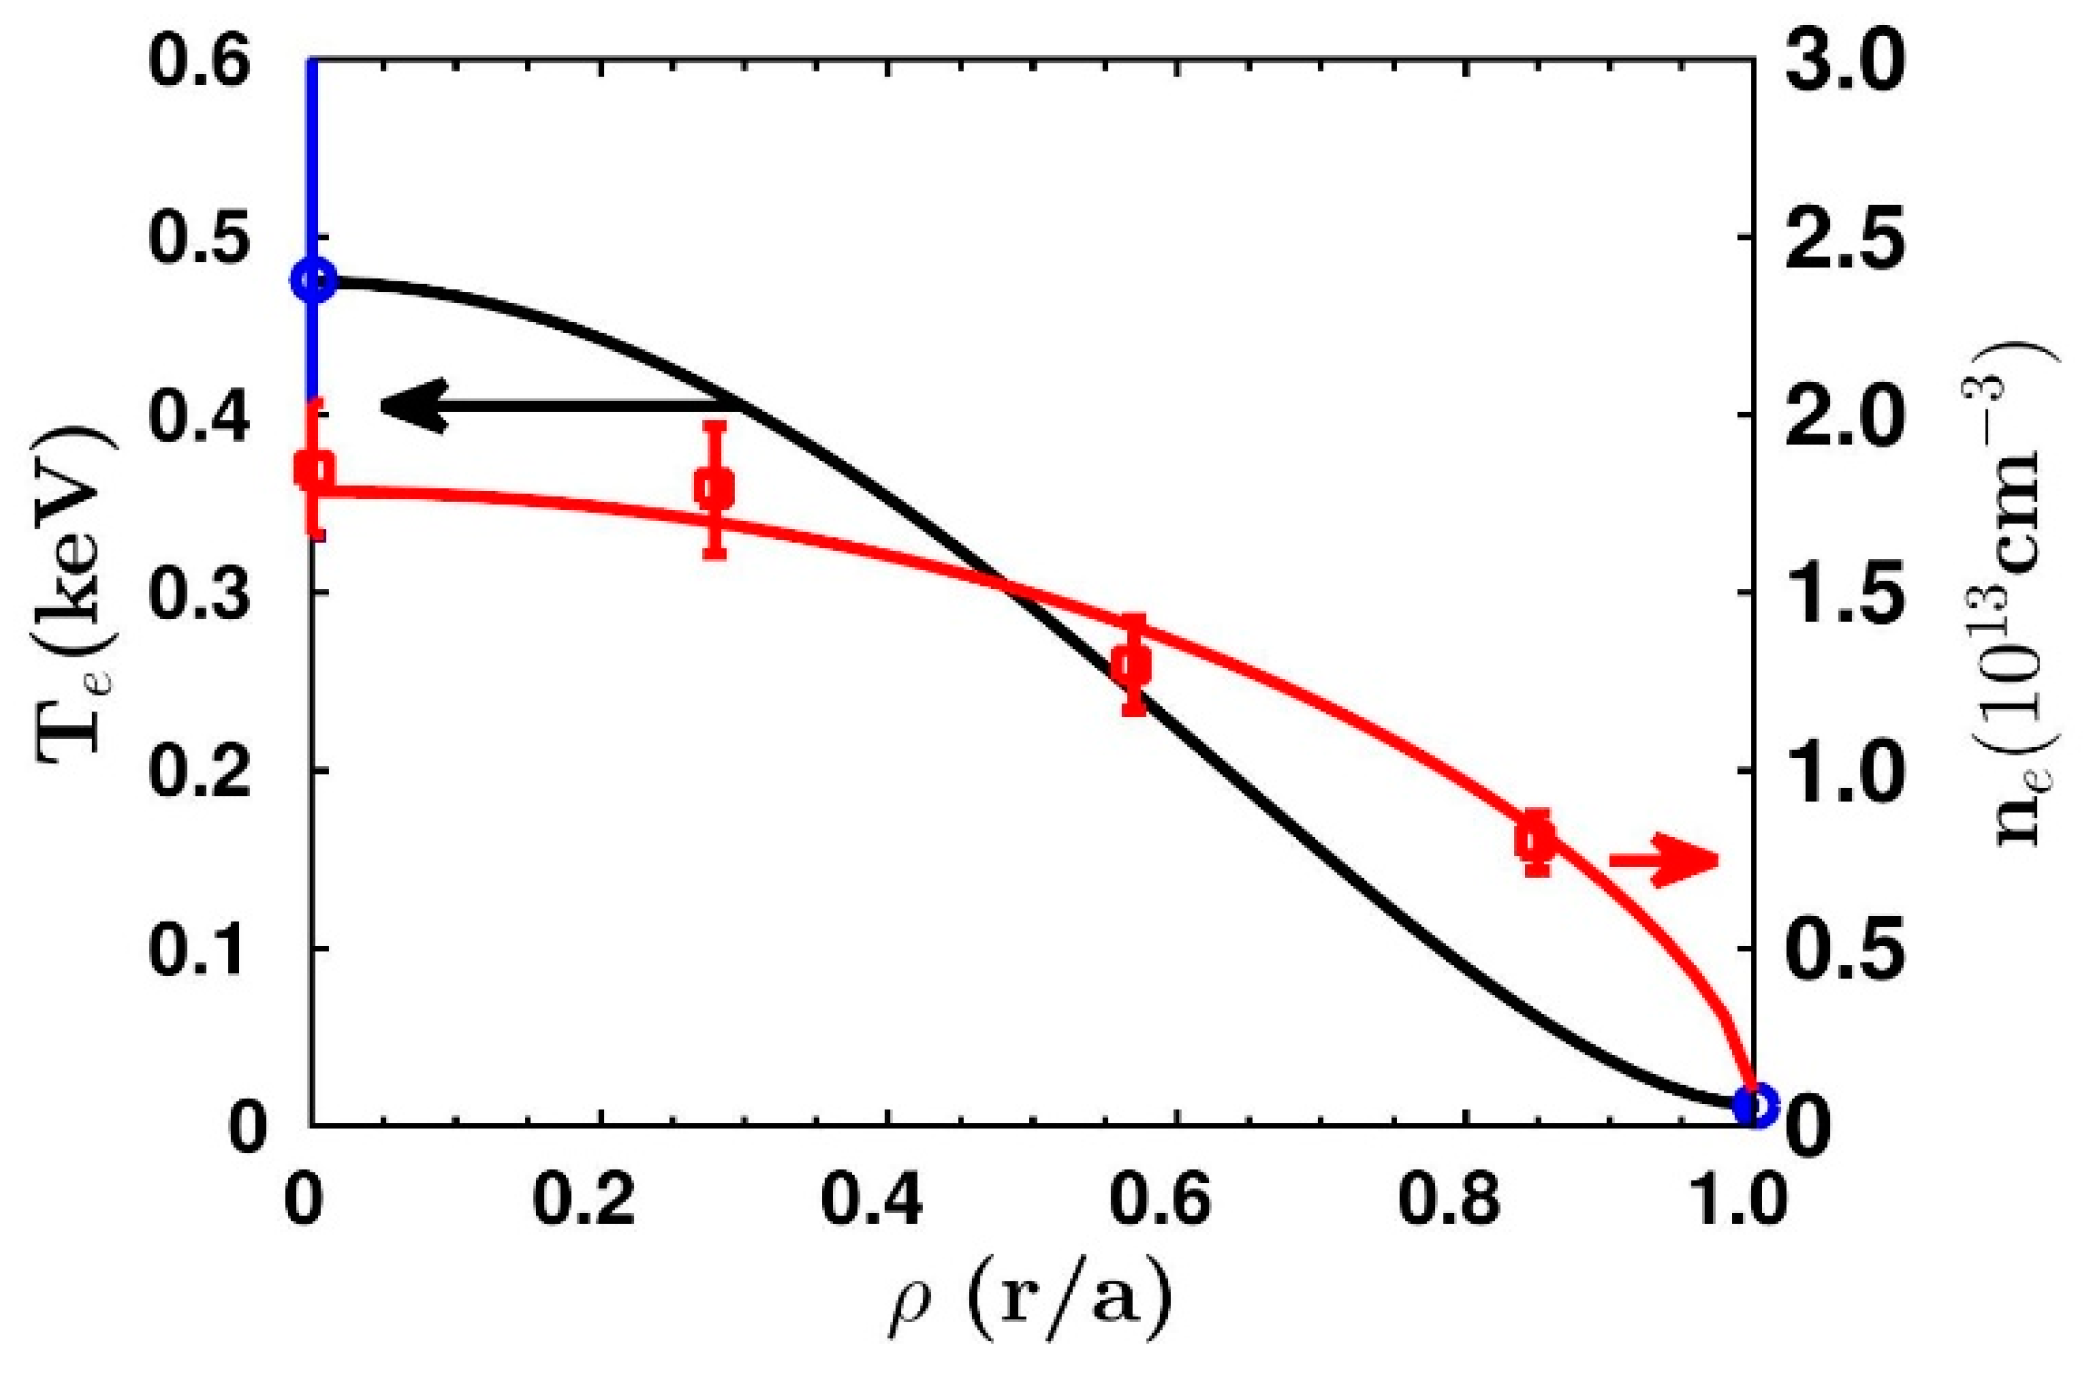
The experimental spectrum of a typical discharge (shot #29349) of ADITYA tokamak is modeled using DEGAS2 code to find out the contribution from molecular dissociation, charge- exchange, and reflection processes [
8,
12]. The line averaged electron density is (n
e) 1.2 × 10
13 cm
−3 and the core electron temperature is 475 eV for the analyzed discharge. The edge density is (n
e,a) = 1.0 × 10
12 cm
−3 and temperature is (T
e,a) =12 eV to get the profile of plasma parameters from Equations (2) and (3). The radial profile of n
e and the reconstructed radial profile of T
e used for the simulation are plotted in
Figure 2. The experimental data were collected using a chord passing through the center of the plasma. The experimental spectral is fitted with three Gaussian profiles by considering the molecular hydrogen and molecular hydrogen ion dissociation, charge-exchange, and reflection processes. The experimental spectrum is normalized by its peak count along with the peak of the simulated spectrum normalized to the experimental peak. Here, we have adjusted spectral line widths to fit the experimental spectrum. The temperature is estimated using Doppler broadening of the spectral lines using the following equation:
where k
B is the Boltzmann constant, λ
0 is the wavelength of the H
α spectral line, T
H is the temperature of the neutral hydrogen atom, m
H is the mass of hydrogen atom, and c is the velocity of light. The temperature of the atom generated through the reflection process is kept fixed and is taken to be 6.5 eV [
12]. The temperature corresponding dissociation and charge-exchange processes have been varied to get the best fit to the experimental data.
Figure 3 represents the simulated H
α spectrum along with the experimental measurement. As can be seen from the figure, the narrow spectrum (dotted line) inside the total simulated spectrum (solid line) is from the dissociated atom, while the broad spectrums are from the atom produced by charge-exchange and reflection processes. The hot atom temperature is coming out to be ~22 ± 2 eV from the simulated charge-exchange spectrum. It is also found that the neutrals produced from the dissociation process, known as warm atom, have a temperature of 2.7 ± 0.2 eV [
28]. It is to be noted that the effect of Zeeman splitting, which may have some effect considering ADITYA tokamak magnetic field, is not included here in the spectral line fitting. The value of toroidal magnetic field (B
T) is 1.05 T in this discharge and the splitting of the spectral line resulting from this magnetic field could not be resolved by the used spectroscopic diagnostics, which are having a spectral resolution of 0.031 nm at 70 μm entrance slit width. The relative contribution of different processes in H
α is found through the best-fit matched of the experimental data with simulated brightness, which is summed over individual areas under the curve of the Gaussian profiles. It is found that the dissociation process contributes almost ~56% and the charge-exchange process contributes ~30% to the total spectrum. The remainder (~14%) of the contribution comes from the plasma-material interaction process, i.e., reflection process. It is to be noted here that molecular dissociation has both direct and indirect contributions to the H
α emission. The direct contributions are those in which excited H-atoms are produced through a dissociation process, which subsequently emit H
α emission. In the indirect process, the ground state atoms produced through molecular dissociation are excited through electron impact (before ionizing through the electron impact and charge-exchange processes), which subsequently emit H
α emission. The combined contributions from both the direct and indirect molecular dissociation processes in H
α emission spectrum are shown with dotted line in
Figure 3. We note here that the Equations X, XIV, and XVI contribute to H
α only at the extreme edge region of the plasma [
13] and the H
α emission from atomic hydrogen through the subsequent electron impact excitation to n = 3 state is mostly dominant throughout the plasma. This emission rate is calculated using the following equation in DEGAS2 code:
where A
32 is the Einstein coefficient and the ratio of neutral at n = 3 state to ground state is taken from the COLLRAD [
21] code.
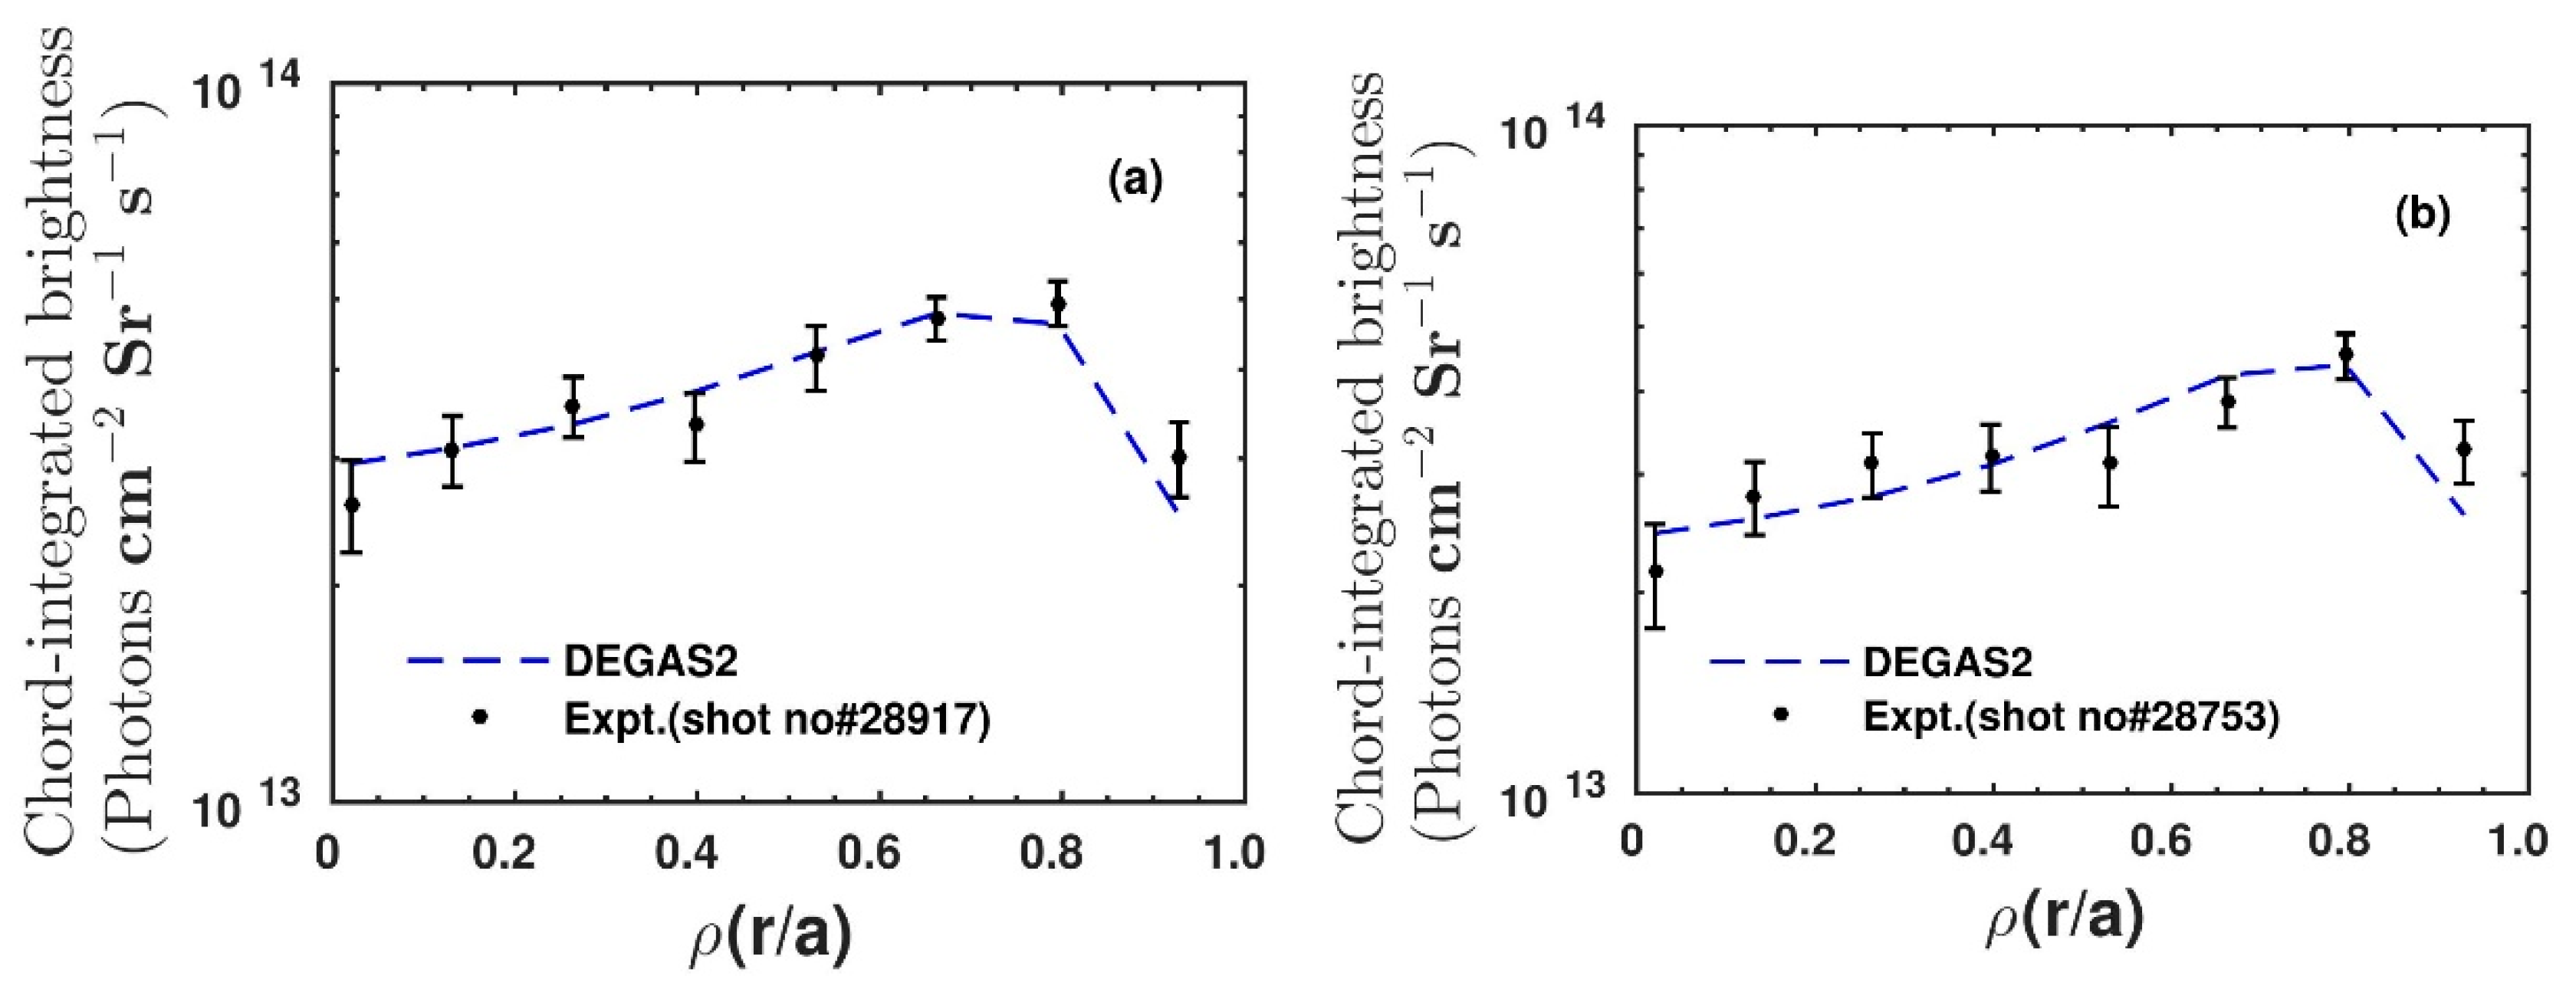
For further understanding of the behavior of atomic hydrogen inside the plasma, the radial profiles of experimental chord-integrated brightness for two discharges (#28917 and #28753) with different line-averaged electron densities are modeled with the DEGAS2 code. The core electron densities and temperatures for shot #28917 (#28753) are 1.9 × 10
13 (2.9 × 10
13) cm
−3 and 440 (380) eV, respectively. As the overall nature of the temperature and density profiles of ohmically heated ADITYA discharges remain the same, the electron density and temperature profiles which are used in the simulation for these two discharges are evaluated using the Equations (2) and (3) considering the profile parameters, α and β similar to those for the profiles presented in
Figure 3. It is to be noted that the signal to noise ratio for H
α, the uncertainty in the recorded chord-integrated brightness is less than 5%, inclusive of all the contributing factors [
18]. The average ~5% errors are considered for the present case. The simulated brightness is obtained through the integration of radial emissivity under consideration of actual observation lines of sight during experiment. The maximum value of chord-integrated brightness from the simulation is of ~4.4 × 10
13 photons cm
−2 Sr
−1 s
−1 is observed at ρ = 0.8, which reduces to ~2.4 × 10
13 photons cm
−2 Sr
−1 s
−1 at the plasma center for shot #28753 (
Figure 4b) having higher line-averaged electron density. The similar kind of brightness profile is also found for shot #28917 (
Figure 4a), where line-averaged electron density is 1.46 × 10
13 cm
−3 and core electron temperature is 440 eV.
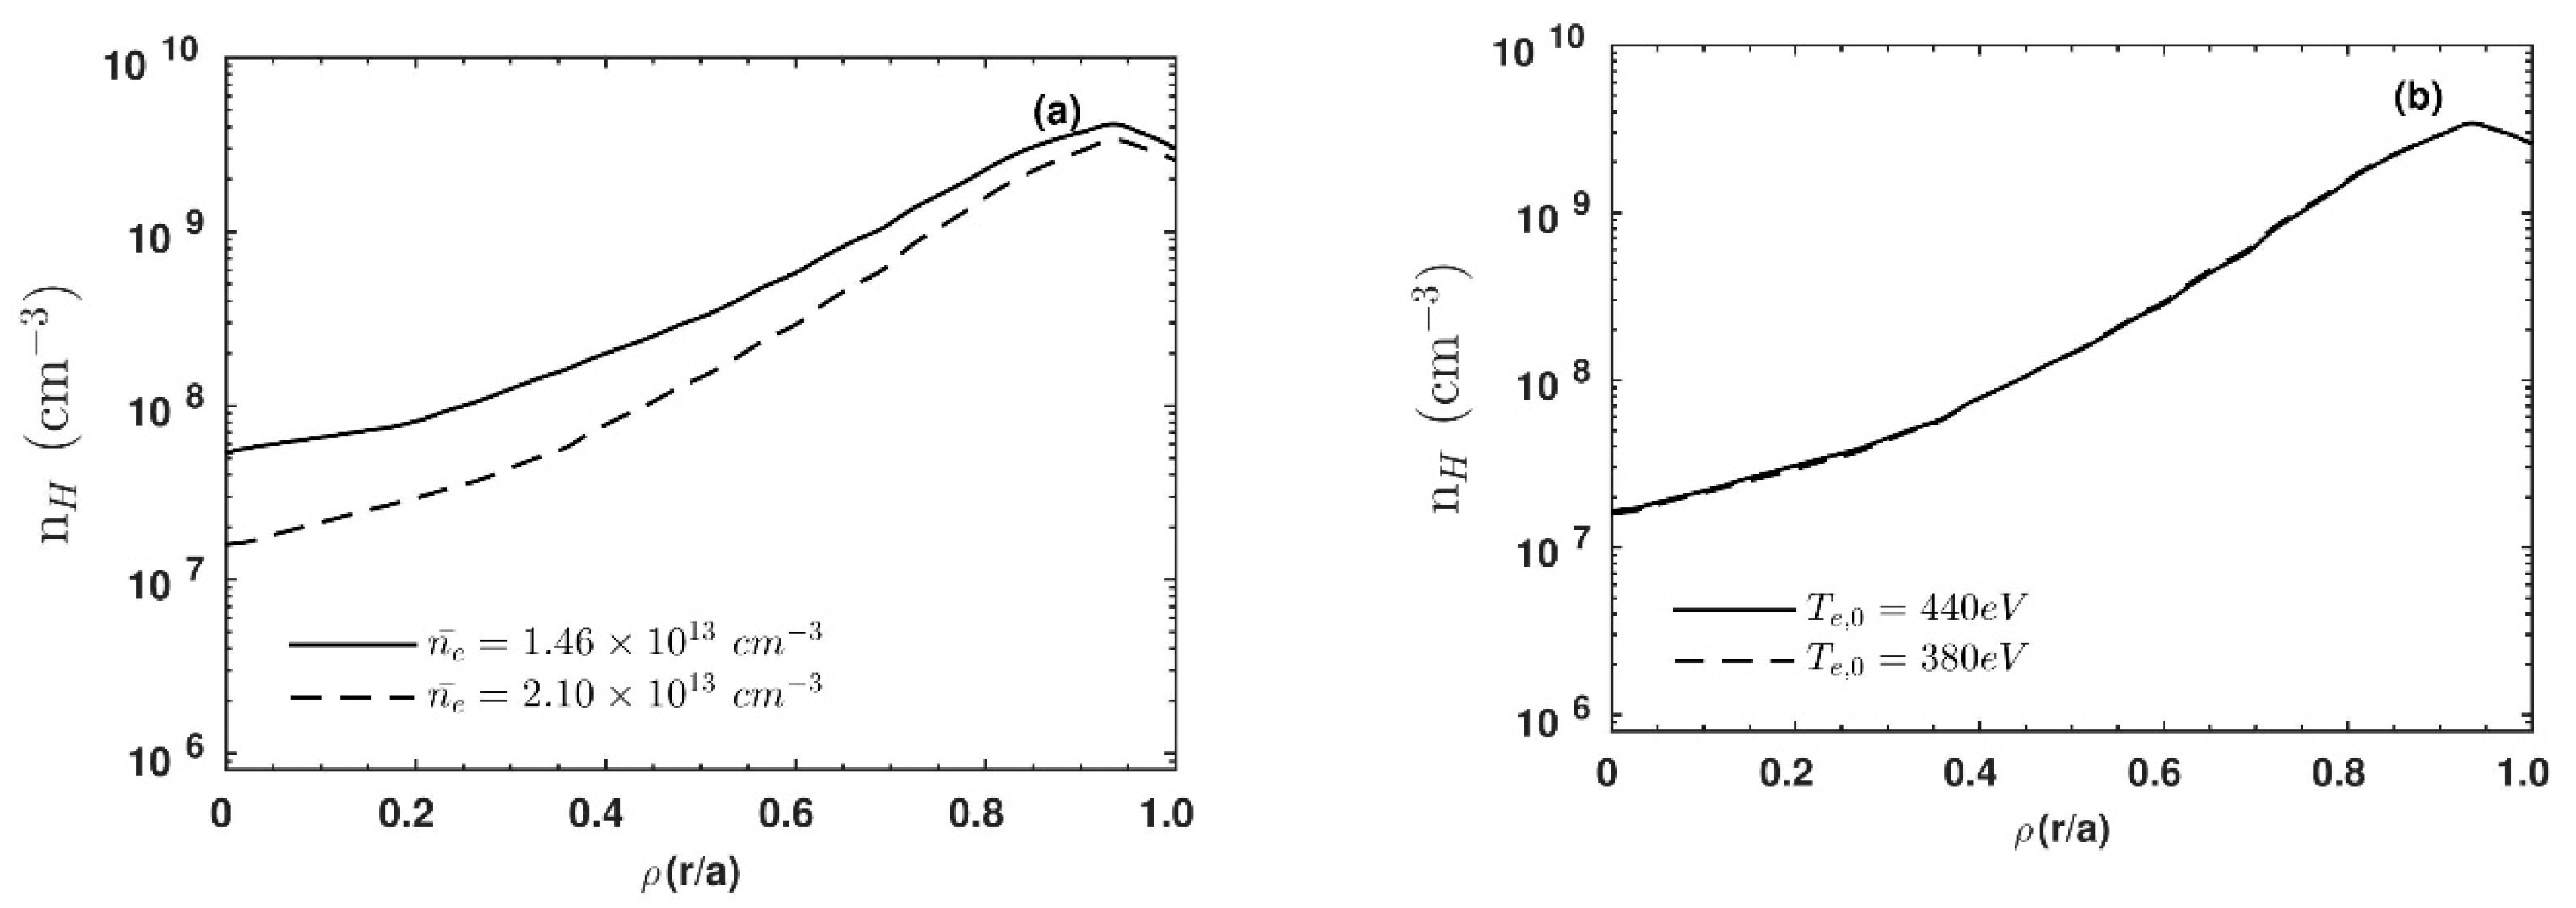
The obtained simulated neutral hydrogen density profiles of two discharges are plotted in
Figure 5a. It is found that neutral hydrogen is penetrated less inside the core plasma in case of relatively high-density discharge compared to the discharges having relatively low density. The neutral H density at ρ = 0.2 is ~2.9 × 10
7 cm
−3 and ~8.1 × 10
7 cm
−3 for high- and low-density discharges, respectively, although both the discharges have similar peak values of neutral density at the plasma edge. However, one can see that the two discharges have different core temperatures (T
e,0 = 380 and 440 eV for shot #28753 and #28917, respectively). Then, a study is done to find the variation of simulated neutral hydrogen density profile with the variation of core electron temperature for the same electron density. This is done for the discharge having line-averaged electron density of 2.10 × 10
13 cm
−3. The radial profiles of the simulated neutral hydrogen densities for different core temperatures are plotted in
Figure 5b. It is observed that the radial profile of neutral hydrogen density is not sensitive to the change in core electron temperature. It is due to the fact that almost all the reaction rate coefficients (except Equations (XV) and (XVI) in
Table 1) are constant beyond the electron temperature ~50 eV. Then it can be said that the penetration of neutral particle mainly depends on the electron density as the plasma having higher density shows lesser neutral penetration.
Finally, in
Figure 6a,b the radial profiles of neutral hydrogen densities for total (including contribution in neutral density from charge exchange) and without charge exchange along with the molecular H
2 and H
2+ densities are plotted, for shot #28917 and #28753, respectively. The neutral hydrogen density without charge exchange is obtained by switching off the charge-exchange process in the code. The reductions of neutral densities are ~110 and ~200 times from the plasma edge for the plasma discharges having low and high densities, respectively, as shown in
Figure 6a,b. Here, it is also seen that charge exchange does not contribute much to the neutral density at the plasma edge for both the discharges. However, if we compare the neutral density with and without charge exchange for both the discharges, then it is clear that the charge exchange contributes to the presence of the neutral in the central region. This is explained here by estimating the neutral penetration length in the plasma. The penetration of the neutral particle produced from the dissociation processes into the plasma can be evaluated through the estimation of penetration length using the equation,
, where v is the velocity of neutral particle, n
e is electron density, and S is electron impact ionization rate coefficient. The neutral hydrogen penetration lengths, λ, due to the dissociation processes are ~3.5 and ~2.3 cm for the low- and high-density plasma discharges. Similarly, the penetration length of the neutral particle produced from charge exchanges can be estimated using the equation
, where v is the velocity of neutral particle,
is the ion density, and Q
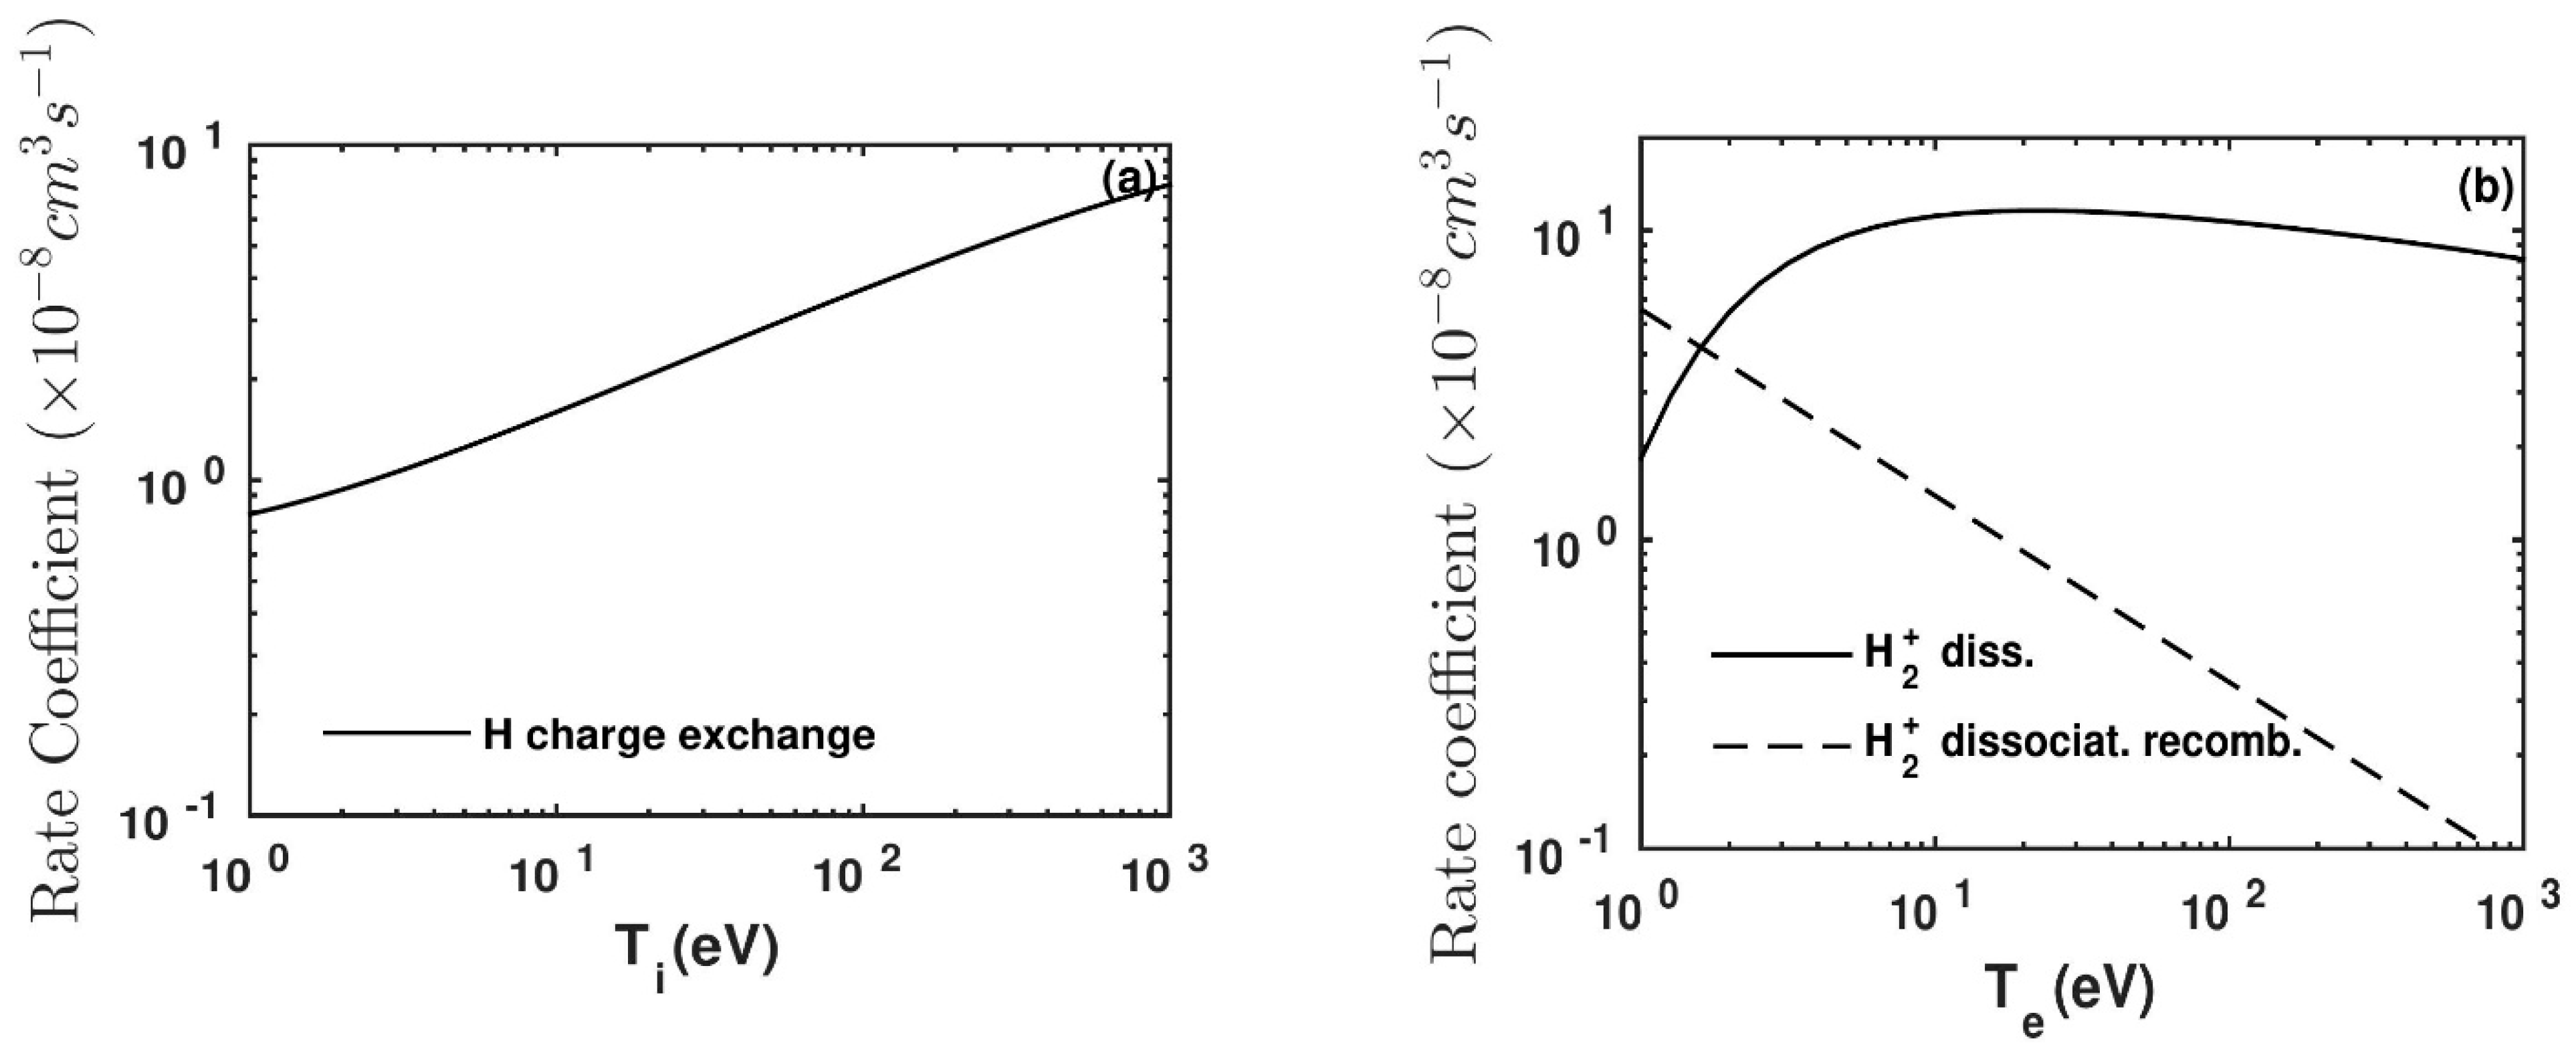
cx is the charge-exchange reaction rate coefficient. The penetration lengths of the neutral due to this process are ~8 and ~6 cm for low- and high-density discharges, respectively. From the higher penetration length due to the charge-exchange process, it can be inferred that the charge-exchange neutrals are penetrated more inside the plasma compared to the neutrals produced from the dissociation process. It is also observed that the ratio of the total neutral density to the neutral density without charge-exchange neutral (n
H) at normalized plasma minor radius, ρ = 0.2, is ~2.1 and 5.2 for the plasma having low and high n
e, respectively. However, this can be easily explained by taking into account the difference in neutral hydrogen density magnitude at that location, as the Q
cx values are almost similar in both the density cases as can be seen from
Figure 7a.
Although the molecular hydrogen ion dissociation reaction rate coefficient and the charge-exchange reaction rate coefficient have similar values as shown in
Figure 7a,b, the neutral hydrogen produced from the molecular hydrogen ion dissociation does not contribute much to the neutral penetration since molecular hydrogen and molecular hydrogen ion are present only at the edge region (from limiter to inside up to ~4 cm) in the ADITYA tokamak as illustrated in
Figure 6a,b.

 ,
, 


