1. Introduction
Cadastral mapping is a complex process in most countries. It comprises both technical and legal aspects in which the real estate and the rights and obligations belonging to it are recorded based on geodetic measurements and legal contracts. Keeping the cadastral databases up-to-date and following requirements and expectations of their users (such as charted surveyors, state administration bodies, individuals) demands the utilisation of new technologies in the whole workflow from data collection through their processing, storage, and publication/accessing on the internet. It applies to both the geometrical (a cadastral map) and juridical (ownership of real estate) parts of the cadastre. When testing new mapping methods, it is essential to guarantee both the required mapping accuracy and all procedural steps in determining the boundaries between parcels (and the ownership). Unmanned aerial vehicles (UAVs) as a platform for photogrammetric and LiDAR mapping have become an alternative for standard aerial-based approaches due to lower cost and higher operability (e.g., [
1,
2,
3]). There are publications describing the use of UAV photogrammetry for creating large-scale maps in various contexts (e.g., [
4,
5,
6,
7]). When looking at the cadastral surveying, the main questions are the accuracy, time demands, possibility of combination with other, mainly geodetic, methods and costs. Many studies focus on geometrical aspects connected to cadastral mapping using UAV photogrammetry, such as the flight configuration and a necessary number of ground control points (GCPs) to guarantee the required accuracy of derived orthoimages and 3D coordinates of detailed points (e.g., [
8,
9,
10,
11,
12,
13,
14]). The possibilities of automation of extraction of cadastral boundaries from images are frequently tackled (e.g., [
15,
16,
17]). In [
18], the possibilities of UAV photogrammetry for the update of the Polish Cadastre are explored. The authors address two important issues. First, the ownership boundaries registered in the cadastre do not always correspond to land cover/land use plots detected from the images. Second, the requirement of mapping the intersection of walls of the buildings with the ground is complicated with standard nadir-looking stereo images, especially in cases of larger roof overhangs. Both [
17] and [
13] mention the need of a frequent change of a pair of stereoscopic images due to the small area covered by the images. A possible way to circumvent this disadvantage is by creating a dense cloud of points from oblique aerial photographs, or by direct measurement with a LiDAR. Building outlines can be extracted from a 3D point cloud, and a variety of algorithms have been developed for that purpose [
19,
20]. Nevertheless, they might fail if the intersection of building walls with the ground is required (i.e., roof overhangs must be excluded). Utilising UAV LiDAR technology for cadastral surveying is not common yet. He and Li [
21] used UAV and vehicle LiDAR for mapping a rural cadastral area in the northern plains of China. In addition to a reported mean squared error of point determination of 0.05 m, they stressed increased efficiency of the applied mapping methods compared to a traditional survey by global navigation satellite system (GNSS) receivers and total stations (seven times in their case). Comprehensive analyses, including mapping quality and mapping cost assessment, are reported only in a few papers, e.g., [
22,
23].
The Cadastre of the Czech Republic has been maintained in a digital form as the Information System of the Real Estate Cadastre since 2001 and allows everyone to obtain remote access to the cadastre data. It consists of two parts—the File of Geodetic Information represented by the 2D cadastral map (CM) and the File of Descriptive Information comprising the data about cadastral units, parcels, buildings, flats and non-residential premises, about owners and other justified persons, legal relations and rights and other facts given by the law. The CM is provided either as a “digital cadastral map” (DCM) or a “cadastral map—digitised” (CMD). The DCM has been created by the new mapping connected to recent land consolidations or by a calculation of coordinates of detailed points from original measuring charts used for cadastral mapping at the scales 1:1000 or 1: 2000 after 1927, mainly in urban areas. The CMD is based on vectorisation of scanned analogue maps, mainly at the scale of 1: 2880 originating in the 19th century (the Stable Cadastre of the Austrian Empire). The CM, among others, includes borders of cadastral areas, borders of real estates (land parcels and building perimeters), numbers of land parcels and buildings, map signs referring to land use, geodetic control, and toponyms [
24]. Nowadays, the process of the renewal of the cadastral documentation by the new mapping is in progress, aiming at the DCM covering the whole territory of the country. The instructions for surveying the Cadastre of the Czech Republic and related documents run to several thousand pages [
25,
26]. The Cadastral Decree [
27] requires the mean coordinate error at a detailed point of the DCM m
xy = [(m
x2 + m
y2)/2]
1/2 = 0.14 m and the maximal horizontal error u
pMAX = 2·√2·m
xy = 0.40 m. The detailed points measured for a renewal or an update of the CM must be stabilised and uniquely defined points (i.e., according to [
28] identification error < m
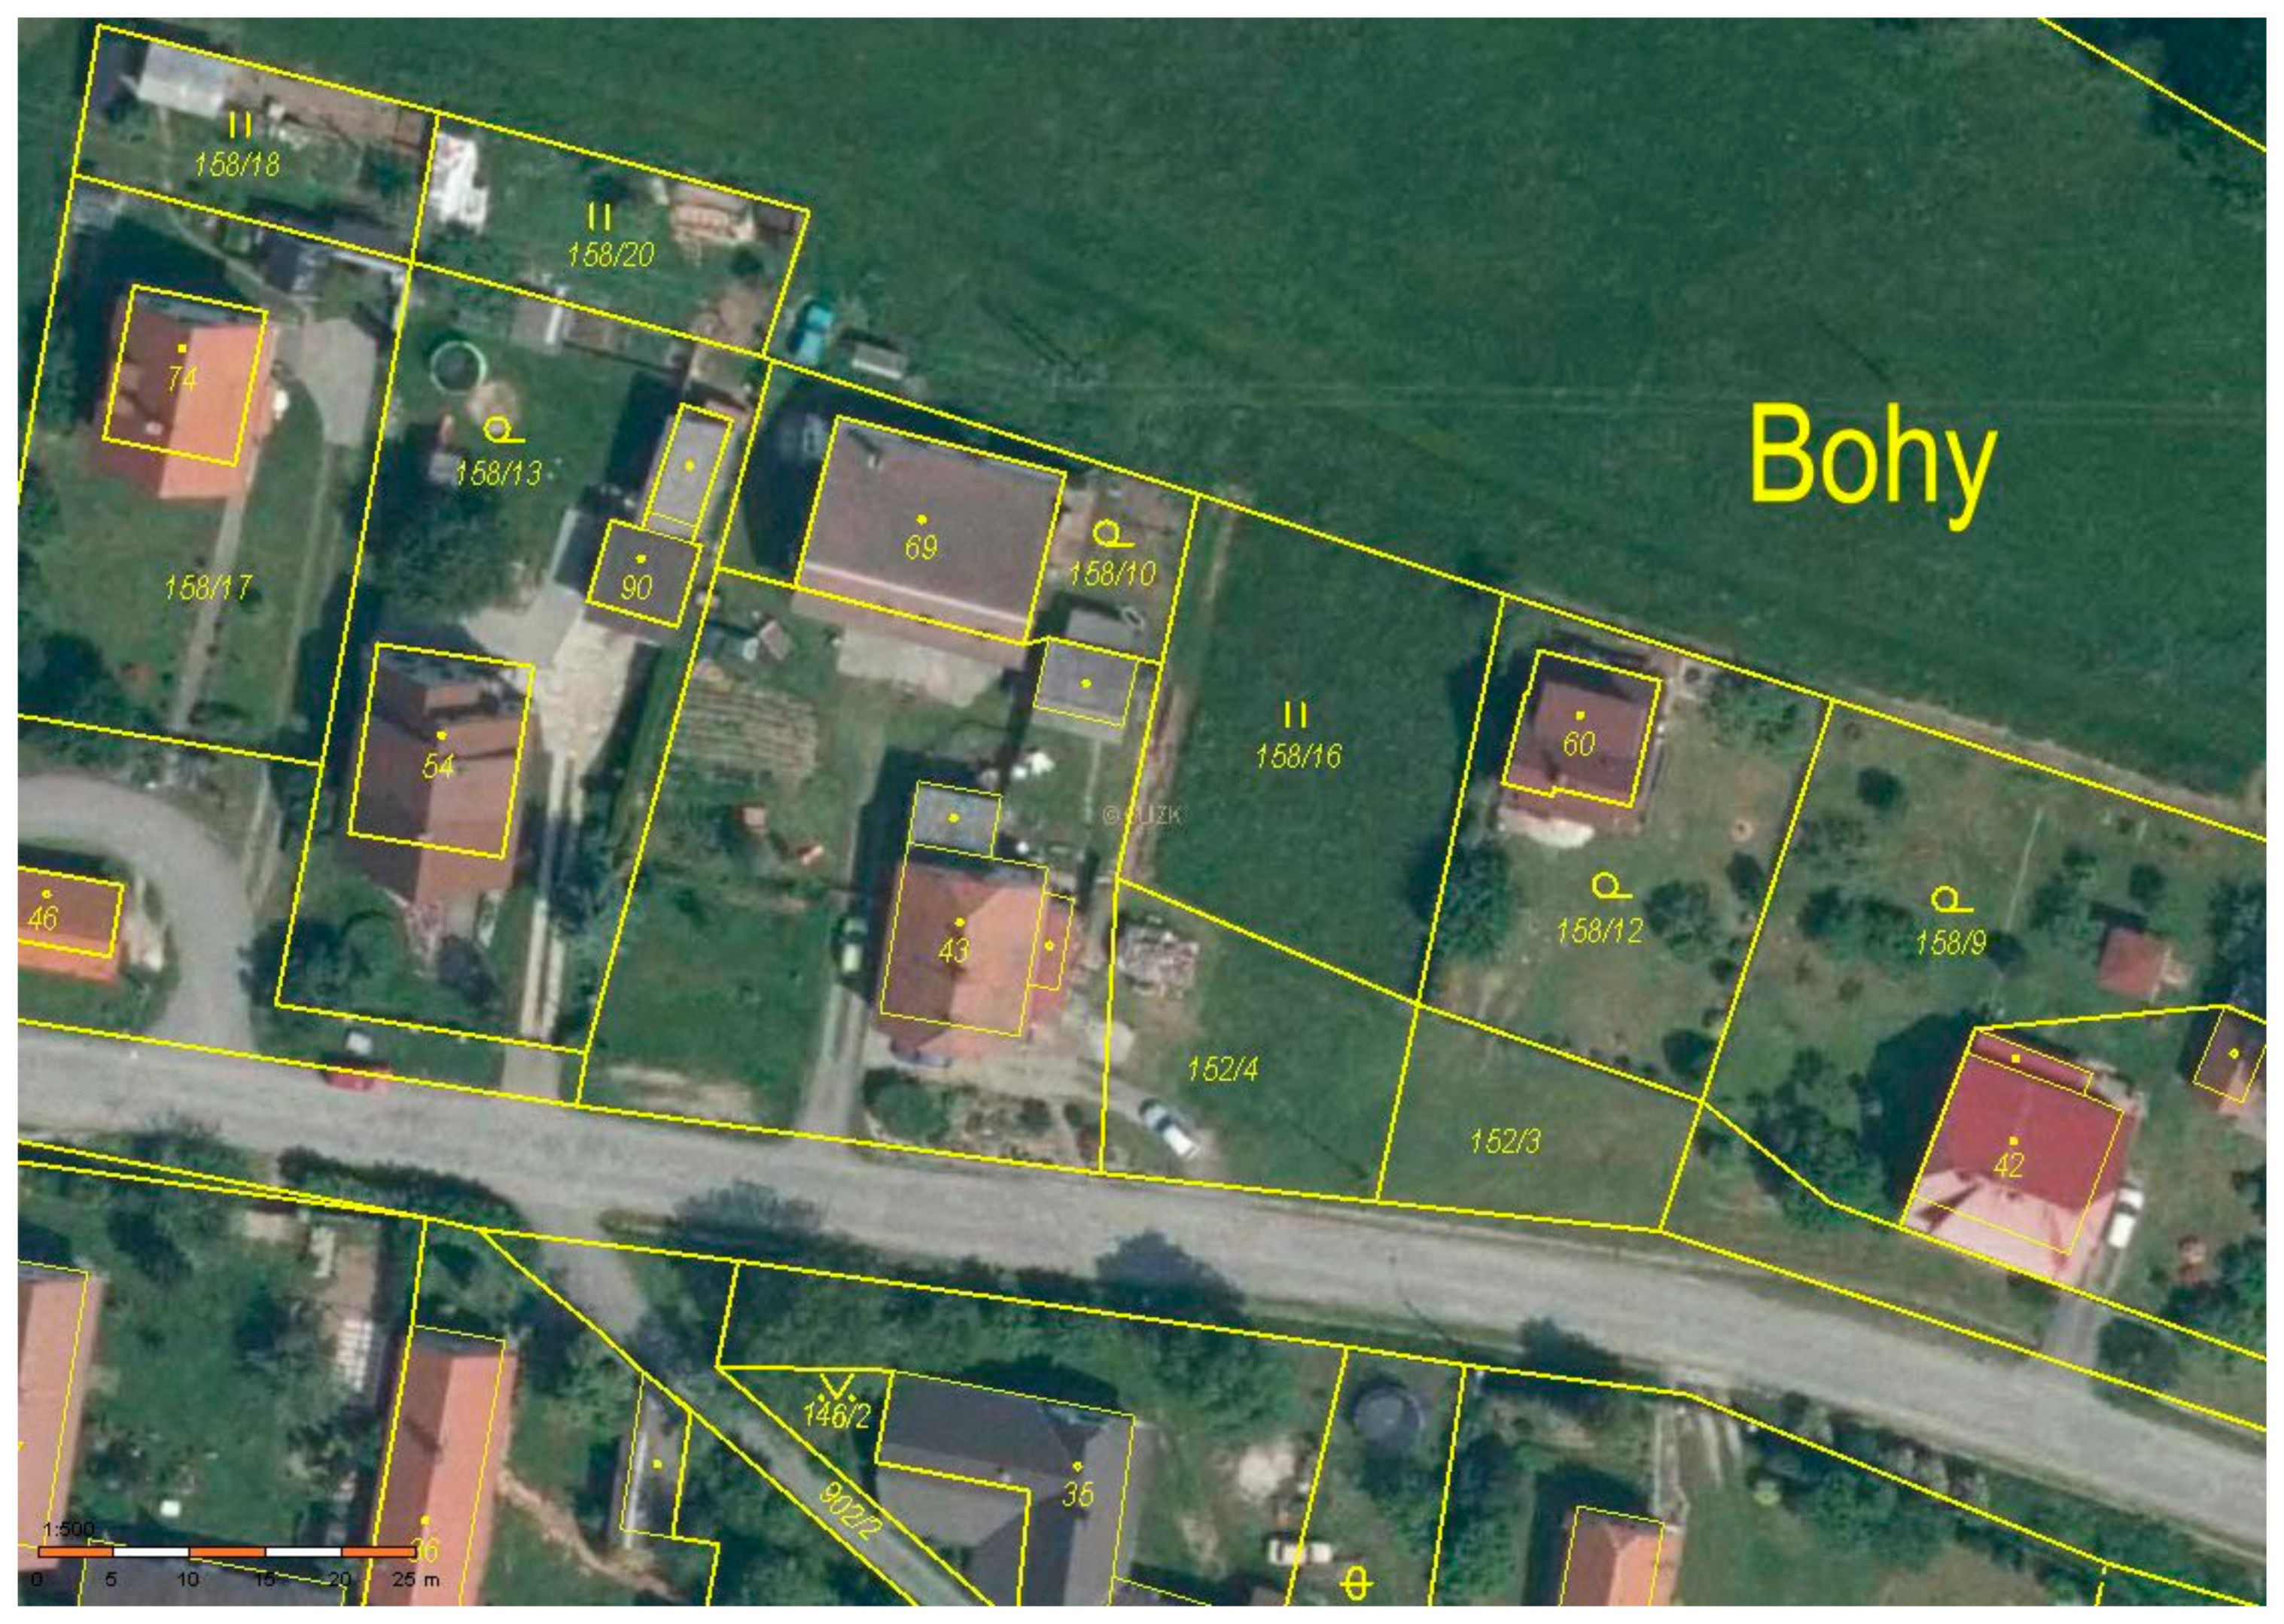
xy/4) as landmarks, points on fence foundations and building corners (corresponding to the intersection of a building with the ground). The same accuracy requirement holds for all types of points, namely building corners and points on fence foundations, that are mostly discussed in this study. An example of the DCM is depicted in
Figure 1.
Currently, cadastral surveying and mapping in the Czech Republic use traditional approaches based on the combination of tacheometry and GNSS methods. The first attempts towards utilisation of UAV photogrammetry started in 2014. The coverage of the cadastral area by forests is one of the key factors in deciding whether the method will be used or not. If the forests area exceeds 40% of the mapped cadastral unit, neither the use of UAVs nor aerial photogrammetry is economically justified because the costs connected to the measurement of the remaining area using traditional geodetic methods will be superior to the effect of using UAVs. During so-called comprehensive land consolidation, one of the mapping procedures acknowledged by the Czech Office for Mapping, Surveying and Cadastre (COMSC), the rural areas are first mapped by standard geodetic procedures. The mapping of the built-up areas of the concerned municipalities follows. Thus, the developed and tested procedures presented further focus mainly on built-up parts of the cadastral units.
In the Czech Republic, there has been a regulation of UAV operation under the Civil Aviation Authority (CAA) leadership since 2012, which has also affected the way in which performed tests of UAV mapping have been carried out. These pilot projects mapped only small municipalities, where it was necessary to have permission from the municipal management to perform the mapping from the UAV. Flight plans were adapted to avoid flying over roads as much as possible. Flying was confirmed and reported in advance and performed primarily by light unmanned aircrafts, whose flight characteristics are much less risky than using a multicopter type of UAV. From January 2021, new European harmonised rules in the Czech Republic have been adapted, which should simplify and better enable this type of operation, even in an urban area.
The aim of this paper is to provide a summary of the tested UAV-based mapping methods performed in the built-up parts of the cadastral units—(i) measurement of detailed points forming borders of land parcels in orthoimages, (ii) determination of building corners corresponding to intersections of the walls with the ground from image matching and LiDAR point clouds, (iii) measurement of building corners in multiple images (intersection photogrammetry), and to evaluate if the achieved accuracy fulfils requirements for the cadastral mapping defined by the Czech legislation (
Section 2 and
Section 3). An important aspect is the economic evaluation of introducing the UAV technology in comparison to the traditional cadastral surveying (
Section 4).
2. Methods and Test Areas
The first of the projects aiming at the utilisation of UAV photogrammetry in the mapping of the Cadastre of the Czech Republic was launched in 2014. It focused on the accuracy of determination of calibration field points as a prerequisite for further testing of UAV methods for cadastre mapping. Until 2019, tests at built-up parts of 12 cadastral units were carried out. In terms of height and terrain undulation, the tested localities covered different types of terrain from flat (e.g., Klášter nad Dědinou, 50.2° N, 16.0° E) through significantly height-undulated (e.g., Rakolusky, 49.9° N, 13.6° E) to mountain areas (e.g., Špičák—Železná Ruda, 49.2° N, 13.2° E). Moreover, the test areas differed in urban structures (e.g., circular, road, scattered, dense urban, or residential).
In this study, details of seven test localities in six cadastral units are presented.
Table 1 summarises the main parameters of the photogrammetric UAV flights including the cameras and the extent of the mapped area. None of the photogrammetric flights were supported with a real-time kinematic (RTK)-GNSS and IMU for direct image orientation due to the fact that not all future missions may be equipped with these technologies. The localities are described in chronological order with emphasis on new features and methods that were included in the mapping procedures. In the last locality, Dlouhá Ves, mapping using a UAV LiDAR was also carried out.
In the five remaining cadastral areas, the same photogrammetry-based workflows were applied to confirm results for different urban structures. At the same time, the operational and organisational procedures for the use of UAV mapping in the conditions in the Czech Cadastre were gradually specified, and they evolved into draft changes in cadastral mapping regulations submitted to COMSC [
29,
30].
Point clouds obtained by image matching or from LiDAR and orthoimages were used for detailed cadastral mapping. The corners of the buildings were derived from point clouds. Horizontal and vertical sections of buildings were used to determine the direction of the walls. Thus, detailed points could be mapped even in cases of shaded corners (e.g., due to overgrows with surrounding vegetation) by intersection. The points on the fence foundations and landmarks were determined by direct measuring in orthoimages. Their size and consequently the number of points forming such objects did not allow for their interpretation from point clouds. In order to assure the required horizontal accuracy, only points with a relative height to the terrain up to 0.2 m were mapped from orthoimages. In order to improve identification of the fence foundations (defining parcel ownerships) in orthoimages, their signalisation with white colour was tested in some cases.
The accuracy assessment of the outputs derived from UAV mapping—orthoimages and building outlines—was performed by comparison of selected checkpoints (CPs) measured in the field by RTK-GNSS or tacheometry (total station), of which typical accuracy was characterised by RMSEXY ≤ 0.025 m and RMSEZ ≤ 0.035 m. These measurements will be hereinafter referred to as geodetic measurements.
2.1. UAV Photogrammetry
2.1.1. Test Using a Calibration Field
Calibration fields for UAV image sensors differ from standard calibration fields designed for calibrating large-format aerial digital cameras (such as UltraCam, ADS) because the active area of the UAV sensors/cameras is only about 1/20 of the active area of large-format cameras. Thus, both the number of GCPs with respect to the number of photogrammetric baselines and their distribution in the standard calibration fields are insufficient even for higher GSDs (about 0.1 m), not to mention GSDs usually used for UAV sensing (0.02 m to 0.05 m).
In 2014, several calibration fields existed in the country; nevertheless, none of them could be used for the UAV tests mainly due to limited accessibility and/or inappropriate design (e.g., the signalisation of GCPs using white circles with 0.30 m in diameter that is acceptable for calibration of large format cameras makes manual pointing the signal centres complicated on images acquired with the small format UAV cameras). Therefore, in August 2014, the Research Institute of Geodesy, Topography and Cartography established a new calibration field with 100 signalised points on, at that time, an unused part of the D11 highway near Hradec Králové (50.2° N, 15.8° E). This calibration field was in service until 2017, when this part of the highway opened.
The points of the UAV calibration field near Hradec Králové were stabilised on the highway surface and signalised as circles with a diameter of 0.2 m and two white sectors (see
Figure 2). Due to the intersection of the edges between the black and white sectors, such a shape is suitable for identification, primarily pointing its centre on images of any acquired GSD.
The test flight aimed at evaluating the accuracy of the determined parameters of the interior and exterior orientation of the camera, the positional accuracy of the derived orthophoto and the height accuracy of the digital surface model (DSM). Images of the calibration field were acquired with a GSD of 0.01 m from an average height of 68 m above the terrain with a non-metric camera Canon 700D (CMOS 5184 × 3456 pixels, i.e., 22.3 mm × 14.9 mm at a pixel size of 4384 × 4384 µm) equipped with a Canon EF 24 mm f/2.8 IS USM lens. The camera was mounted on a UAV Hexacopter G6. As explained before, any RTK-GNSS and IMU for direct image georeferencing were not used.
The whole area was divided into three mutually overlapping blocks consisting of five flight lines each. A total of 1235 images were collected using a forward overlap of p = 80% and a side overlap of q = 60% [
31]. Thus, a total area of about 20 ha was covered. The approximate coordinates of the image projection centres in WGS84 were recorded during the flight for all images. The coordinates were transformed into the national coordinate system, JTSK (EPSG 5513), and subsequently used in the Agisoft PhotoScan software package. Thirty-three points (out of 100 points signalised in the field) were manually measured on the images and in different combinations used as GCPs. On average, each GCP was visible in 18 images. Four calculations with different numbers of GCPs were performed. The first variant comprised four GCPs distributed in pairs at the beginning and end of the imaged area. In the second variant, two more points in the middle of the imaged area were inserted. In the third variant, another four points were added, leading to a total number of 10 GCPs. The last variant of the calculation contained all 33 GCPs. The remaining 67 points were used as CPs for evaluation the accuracy of the four variants by analysing the positional accuracy of the orthophoto and the DSM—both generated in the Agisoft software. The coordinates of the CPs to be compared with the geodetic survey were on the orthophoto collected in Microstation V8i. The heights of these points were measured in the generated surface model in the RoadMap software.
Figure 3 depicts the four different variants of distribution of GCPs and CPs in the test area.
2.1.2. Cadastral Mapping
The first site, a built-up area of the village of Tymákov (49.7° N, 13.5° E), was mapped in 2015. The images were acquired from a UAV MAVinci SIRIUS Pro equipped with a LumixGX1-Pancake14 mm camera.
Figure 4 shows the flight plan designed for GSD of 0.02 m, a forward overlap of 80% and a side overlap of 80%.
The area required for mapping was 155 ha. Due to a limited UAV endurance, the site was divided into three image blocks that in total covered an area of 176 ha. In order to perform the orientation of images, the three blocks were merged into one. A total of 36 GCPs were stabilised and signalised. The ratio between the number of photogrammetric bases and the number of GCPs was approximately 1:100. Due to a lack of experience, a few mistakes were made at this first test site. In the eastern (yellow) block, there is noticeable non-compliance with the required principles of imaging, where the area close to the mapping boundary (red line parallel to the flight lines) is captured in some parts only on one image row instead of four lines. The reason for this fourfold overlap of the rows at the boundary is the requirement that the points of the digital surface model must also be generated on the eastern facades of houses at the edge of the image block. There are also minor insufficiencies in the number of images on the flight lines beyond the mapping boundary in the direction of flight, where at least six images must be exposed on each flight line after the image of which the centre lies just beyond the mapping boundary. Then a digital surface model on house facades can be generated, and, at the same time, the mapped area is separated from the edges with a lower quality of image matching. It is necessary to place the GCPs at these ends of the flight lines so that the area to be mapped is in the space where problems with image matching due to a lower number of images are not expected. The position of detailed points measured by UAV photogrammetry and by geodetic methods was compared.
In 2015, the test area in the village of Bohy (50.0° N, 13.6° E) in Western Bohemia was mapped with the identical technology and methodology as in the Tymákov locality. In the Bohy area, 801 images with a GSD of 0.025 m were acquired. The average point cloud density on the facades of the houses was 30 to 45 points per square metre. An interesting feature in this locality was the castle of Krašov (50.0° N, 13.6° E). To increase the number of points on the facades and to assure the possibility of mapping the intersection of the walls with the ground, an additional flight with a specifically designed flight plan was performed as shown in
Figure 5. The point density up to 50 points per square metre was then achieved for the facades of the castle.
In 2018, the Soběšice u Sušice locality (49.2° N, 13.7° E) was simultaneously mapped by UAV photogrammetry (the same equipment as in the case of Tymákov) with GSD of 0.02 m and standard geodetic measurements (GNSS-RTK and total station). The cadastral offices in Pardubice and Plzeň performed an extensive independent analysis of the accuracy of 1140 points acquired using both methods in the GeoStore V6 software. The evaluated points were mainly the corners of buildings and fence foundations.
In 2019, the use of UAVs for cadastral mapping by means of point measurements on multiple overlapping images (the method is called as “intersection photogrammetry” in the Trimble software) for determination of building corners was explored. The object coordinates are derived neither by stereoscopic measurements carried out by the operator nor by image matching. An operator measures image coordinates of detailed points on single overlapping images, and the object coordinates are calculated by adjustment using collinearity equations and known parameters of interior and exterior orientation. A small part of the village of Klášter nd Dědinou (50.2° N, 16.0° E) in Eastern Bohemia was chosen for the test. A total of 1203 images in 33 flight lines were acquired with a sense Fly eBee X equipped with a Sony ILCE-6000 camera. The GSD was 0.02 m. Camera calibration and exterior orientation were performed in the Trimble (the photogrammetric module SW Trimble Business Centre V3.90) and Pix4D software packages. The measurement of selected detailed points was performed using intersection photogrammetry in the Trimble software. Considering an overlap of 80% in both along and across flight directions, a point could be determined from up to 12 images. An example of a point calculation in the national coordinate system is shown in
Figure 6; it documents that the accuracy of the tested method meets the requirements given by the COMSC.
In spring 2019, both UAV photogrammetry and LiDAR acquisitions were performed in the test area Dlouhá Ves u Sušice (49.2° N, 13.5° E,
Figure 7). The photo flight mission was carried out on 6 March using an MV Sirius UAV with a Panasonic Lumix GX1 camera, f = 14 mm, CMOS 4952 × 3448, forward overlap 80%, side overlap 70%. A total of 4698 photos in one block (the whole cadastral area) were acquired with a GSD of 0.02 m, 33 GCPs. Six flights from 10:39 to 15:20 CET were needed to accomplish the image data collection.
A total of 50 points were signalised for this UAV mission. Of these points, 33 GCPs were signalised with 0.06 m diameter round targets. Seventeen points were CPs and were signalised with 0.06 × 0.06 m2 squares. All the points were placed at the terrain level. The points were stabilised permanently with a survey mark or temporarily with a pin hammered into ground. All the targets were painted with green signal reflective paint. The control and check points were measured using RTK-GNSS receiver with extended observations. Each point was measured twice with an interval between the measurements of at least one hour, resulting in RMSExyz = 0.015 m.
Images taken with Lumix GX1 were processed in Agisoft Photoscan Pro. A point cloud and orthoimages with GSD 0.02 m were subsequently generated. The corners of the buildings were interpreted from point clouds in GeoStore V6 software. The points of the ownership boundaries on fences with retaining walls were determined directly by measuring on the orthoimage. All these points were also measured by geodetic methods.
2.2. UAV Laser Scanning
The laser flight mission in the test area of Dlouhá Ves u Sušice (49.2° N, 13.5° E) was carried out on 5 June 2019 with a DJI Matrice 600 Pro hexacopter with LiDAR RIEGL miniVUX-1UAV equipped with GNSS/IMU Applanix15 [
32]. The speed of the hexacopter was 2.3 m/s; the number of points per square metre ranged from 120 to 300, depending on the strip overlap. The laser scanning mission was split into three parts, see
Figure 7.
Two types of signals were used for this laser scanning mission. The first type was a square located at ground level, which was made of aluminium foil to increase the reflectivity of the target (
Figure 8). At least 12 laser beams hit a target in each pass while scanning. Despite this, it was impossible to identify the targets in the point cloud accurately. For this reason, naturally signalised GCPs were additionally measured from two known points by forward intersection. The measurements were supplemented with length measurements using reflector-less total stations. The achieved RMSE
xyz on these points was approximately 0.026 m.
Raw GNSS and IMU measurements were processed in the PosPac software. The CZEPOS service (Czech GNSS permanent station system) was used for GNSS corrections. The coordinates of the points in the XYZ/ETRS89 geocentric coordinates were calculated in RiProcess. Point clouds were cut according to trajectories into individual strips. These were aligned in the RiProcess software using automatically derived planar surfaces. The displacement and rotation of the individual strips were unknown parameters in the alignment. The standard deviation of the distances between the planes after strip alignment was 0.04 m (for area 1), 0.02 m (for area 2) and 0.04 m (for area 3), with a maximum deviation not exceeding 0.10 m at 90% of the planes. The point clouds were transformed from the XYZ/ETRS89 coordinates to the national S-JTSK system and the Bpv elevation system in the ETJTZU software (developed by COMSC) [
33]. By combining roof modelling and visual inspection, the coordinates of the GCPs were extracted from the point clouds. The point clouds were shifted in each of the three coordinates by the median difference values in the Lastools software. Point clouds obtained by laser scanning were used to derive points defining building corners. Those were further compared with points determined by geodetic measurements, as in the case of UAV photogrammetry.
3. Results
3.1. UAV Photogrammetry
3.1.1. Tests Using Calibration Fields
GNSS-RTK coordinates of the signalised CPs were compared with the coordinates obtained from UAV photogrammetry—an orthoimage and a DSM derived in the Agifost Photoscan software, both with GSD of 0.01 m.
Table 2 shows the results of the four tested variants with different ratio of GCPs and CPs.
Using 10 GCPs, RMSEXY of 0.015 m (or 1.5 pixel) was achieved and the accuracy in height was 0.6‰ h. This result fully met the requirement of 0.14 m as the coordinate error of the CM and gave a clear answer about the possibility of using UAV photogrammetry in the Cadastre of the Czech Republic. In the case of cadastral objects such as house corners and fences, a decrease of accuracy due to point definition is expected.
Regarding the number of GCPs, the test proved that with a regular distribution of GCPs, one GCP would suffice for 90 to 120 images taken with non-metric cameras, which corresponds to variant no. 3 in
Table 2. Increasing the number of points does not bring a significant increase in the accuracy or completeness of mapping. These conclusions are in accordance with the results of other authors [
9,
10]. The number of images taken with UAV non-metric cameras is more than 1000 at most areas mapped for cadastral purposes. In the case of smaller areas and thus smaller the number of images, it is appropriate to increase the number of GCPs in proportion to the number of images; at least five GCPs should always remain in the locality.
3.1.2. Cadastre Mapping
A comparison between RTK-GNSS surveyed detailed points and their position in the orthoimages with 0.02 m GSD derived from the UAV campaign was carried out in the locality Tymákov. In contrast to the signalised points of the calibration field presented above, 353 points at the ground level corresponding to fences, drain gratings, manhole covers, etc., were measured.
Table 3 summarises the results of the comparison. RMSE
XY of 0.04 m corresponding to two pixels was achieved. Despite several initial errors in this mapping project, the resulting accuracy was within the expected limits.
Figure 9 shows the distribution of GCPs and
Table 4 summarises the residual errors on 13 GCPs after image orientation (from the Agisoft calculation log) in the locality of Bohy. In order to verify the accuracy of the detailed points of the cadastral mapping, a comparison between orthoimage and geodetic measurements were carried out in the same way as at the Tymákov locality, and the same accuracy was achieved. A point cloud superimposed on an orthophoto and derived outlines of the walls of a part of Krašov castle are visualised in
Figure 10. The process of constructing building ground plans for cadastral purposes from a point cloud with point density on the facades of 30 to 45 points per square metre is shown in the image sequence in
Figure 11. The GeoStore V6 software (an application in Microstation V8i) of the company Geovap Pardubice Ltd. was used for this purpose.
The accuracy of building polygon vertices vectorised manually from image matching-based point clouds (as shown in
Figure 11) was further evaluated in the Soběšice near the Sušice locality (see
Figure 12). A total of 63% of the 1140 points measured by geodetic methods was possible to identify in the point clouds. Eighty percent of these points then met the requirement of RMSE
XY ≤ 0.14 m. The coordinates of detailed points evaluated from point clouds did not pronounce any significant systematic error (systematic errors were −0.009 m and 0.005 m in coordinates Y and X, respectively). In addition, the 80 side measures (distances between two selected points) calculated from the point coordinates of both types of measurements were compared. The limit deviations given by the standards of the Cadastre of the Czech Republic were not exceeded by 96% of the side measures.
In the Klášter locality, the point measurement on multiple overlapping images was carried out on 190 points (house corners). Comparison to geodetic measurement revealed RMSE
XY = 0.08 m—see
Table 5. For all points, the differences in coordinates fulfilled the required accuracy for cadastral measurements.
At the Dlouhá Ves locality, quality assessment of a derived orthoimage using 17 checkpoints was carried out first—see
Table 6. RMSE
XY of 0.02 m corresponding to 1.0 pixels was achieved. This is a better accuracy than in the Tymákov locality. The possible reason is that only well-defined points were measured in the Dlouhá Ves locality and their amount was about just 5% of CPs evaluated in Tymákov. In the second step, geodetically measured points (building corners and fence foundations) were compared with points interpreted from the image point cloud and orthoimages. As
Table 7 shows, the distribution of differences at all points fulfilled the criteria of the normal distribution N (μ = 0, σ
2 = 0.14
2) and thus the method met the requirements for cadastral mapping. Slightly better accuracy was achieved for fence foundations than for building corners.
3.2. UAV Laser Scanning
LiDAR points clouds over three smaller test areas at the Dlouhá Ves locality were acquired with the RIEGL miniVUX-1UAV scanner (see
Figure 8). The building polygons were mapped manually using the same procedure and software as in the case of the point clouds derived from image matching. The accuracy of the derived building outlines was evaluated based on a comparison of 277 geodetically measured points.
Table 7 shows that residuals of nearly 99% of points were below 0.14 m (in comparison to photogrammetric methods where only 80% of building corners fell into that range). It is worth mentioning that a deviation of laser points from a façade plane was about 30% lower than in the case of a point cloud derived by image matching, resulting in more accurate detection of the building corners.
In the last step, the completeness of the points obtained from the UAV photogrammetry and laser scanning was evaluated with respect to geodetic measurements (see
Table 8). On average, only 52% and 31% of points could be determined by the UAV photogrammetry and laser scanning, respectively. This result is highly biased because operators with no previous experience with mapping from point clouds and orthoimages performed the measurements. It is expected that after gaining more experience, an operator could routinely recognise and map about 30% to 35% more points. The test confirmed that the completeness of mapping was lower in the irregular and more complex urban area 3 (the old part of the village). The results given in
Table 8 show that a combination of measurement methods will always be necessary and points that cannot be measured photogrammetrically or by laser scanning (e.g., corners of a building on a raised foundation overgrown with shrubs or trees) will have to be surveyed by geodetic methods.
4. Economic Aspects
A thorough comparison of costs connected to cadastral mapping by traditional surveying (combination of GNSS and tacheometry) and described UAV based methods was carried out.
First, the time of all activities connected to traditional cadastral surveying was registered and evaluated for 62 cadastral areas in the Czech Republic. These selected cadastral areas are typical representatives of all types of development from urban through rural to scattered settlements in the highlands and mountains. The following activities were included:
Preparatory activities
Revision of the minor geodetic control, measurements, and calculations of the minor geodetic control
Adjudication of boundaries
Surveying of detailed cadastral points
Processing of the files of geodetic information (the geometric part of the Czech cadastre)
Update of the files of geodetic information and files of descriptive information (the juridical part of the Czech cadastre)
The number of measured points in the cadastral map ranged from 75,453 points (in the cadastral area of the town of Tachov, 49.8° N, 12.6° E) to 125 points (in the cadastral area of Nové Dvorce, 49.8° N, 17.4° E). The average number of detailed points per cadastre was 4556 points. The time needed for the above-mentioned activities in the given cadastral area was averaged against one detailed measured point. The average time for all stages of the cadastral mapping for one detailed point then reached 1.4 h (which, with the average wage calculated from all professions that participate in the mapping process, currently comes to 8.30 Euro per mapped and registered cadastral point; however, these costs do not include the costs of measuring instruments and software needed to process the cadastral register).
Similarly, the costs of determining one point were calculated for the cadastral mapping using UAV photogrammetry in the 12 sites (including one site where both UAV photogrammetry and laser scanning were applied). In addition to activities mentioned in the previous paragraph, the following tasks were performed:
Signal preparation, preparation for signalising and measurement, signalising and measurement of GCPs, processing of RTK-GNSS measurements (including reports)
UAV flights
Image/point cloud processing
Derivation of building corners from point clouds
Measurement of detailed points on fence foundations in orthoimages
It was found out that it is possible to evaluate on average 30 and 37 points per one hour from the point clouds and orthoimages, respectively. It must be pointed out that the number of points reconstructed from UAV based data sets covers only between 72% and 78% of points typically measured in a cadastral area. The remaining points must therefore be added by means of classical surveying methods.
Nevertheless, even if these additional costs are included, the utilisation of the UAV-based methods bring savings of 18% (i.e., 1.15 h per measured point). This estimate assumes that both the UAV data acquisition and pre-processing (image orientation, derivation of orthophotos and point clouds) will be carried out by the cadastral offices (“in house”). In the performed test, both these steps were subcontracted.
5. Conclusions
All the tested UAV measurement methods (image matching, intersection photogrammetry and laser scanning) met the requirements for accuracy of point measurements in the Cadastre of the Czech Republic. The accuracy of the points determined from the point cloud obtained by laser scanning was about 18% higher than from the point cloud obtained by matching images with a GSD of 0.02 m (
Table 7); in contrast, the completeness of mapping was 20% worse. If the success rate of identification remained at the level shown in
Table 8, in combination with traditional methods, approximately 18% of the funds could be saved by introducing UAV methods.
Utilising UAV technologies in the renewal and update of the Cadastral Map of the Czech Republic would bring the following advantages:
Majority of surveying activities will be moved from the field to the office
Negotiations with the owners of the real estate will be supported with up-to-date maps and orthoimages with GSD of 0.02 m
Possibility of direct comparison of datasets with archive orthoimages and maps
Possibility of independent checking of measured points during prospective field surveys (with a possible impact on the frequency of side measurements as independent quality control)
Using of single images and oblique views
Repeatability of the whole processing chain as an independent check of previously produced outputs
Potential of UAV methods for other purposes as a revision of the cadastre, production of the digital technical map
There are also some drawbacks and needs for further developments such as:
Necessity of additional measurements by classic surveying (on average, 25% of points per cadastral area)
Changing of production workflow, purchasing new hardware and software, including equipment for UAV photogrammetry
Training of personnel (UAV pilots, operators for image and point cloud processing and detailed mapping from point clouds)
Expert decision-making about localities suitable for utilising the UAV based mapping methods; timely planning and data acquisition based on knowledge of local conditions (terrain, type of urban area, flight restrictions etc.)
UAV photogrammetry and laser scanning have not been deployed in the COMSC production workflows yet. Recently, the procedures for the use of UAV technology in cadastral mapping have been approved by COMSC for charted surveyors on the basis of the methodology that was created within the research project on the Incorporation and Use of Unmanned Aircraft Systems (UAS) for comprehensive land consolidation and landscape protection [
26]. The COMSC is now considering using the UAV-based methods in the practice of its cadastral offices. In this respect, gaining more profound knowledge by further testing, setting up new production procedures and the employment of experts in the field of photogrammetry, including the training of UAV pilots, are necessary steps to keep the cadastral mapping efficient and up-to-date.
Author Contributions
The concept of the published research, methodology and validation of experiments, checking of the results, writing and editing the main part of the original draft was executed by Václav Šafář; Václav Šafář also supervised the entire research and compilation of the article; Markéta Potůčková supervised LiDAR processing, carried out modelling of the roof planes and their intersections (MATLAB), and contributed to the text structuring, writing and editing; Jakub Karas executed all flight missions and processed images at all localities; Eva Štefanová executed quality control of the LiDAR point clouds in the Cloud Compare software and contributed to the text editing; Marián Jančovič performed pre-processing of the UAV-LiDAR data in the Riegl Ri-Process software; Jan Tlustý and Drahomíra Cígler Žofková performed ground control points measurements and control measurements by geodetic methods and participated in the analysis of measurement results. All authors have read and agreed to the published version of the manuscript.
Funding
This research received no external funding, but aerial photography and laser scanning were funded by the Czech Office for Surveying, Mapping and Cadastre as part of testing new mapping methods in the Czech Republic.
Institutional Review Board Statement
Not applicable.
Informed Consent Statement
Not applicable.
Data Availability Statement
The data are not publicly available. They are the property of the Czech Office for Surveying, Mapping and Cadastre.
Acknowledgments
The authors thank the headquarters of the Czech Office for Surveying, Mapping and Cadastre for collective support in the realization of the research work.
Conflicts of Interest
The authors declare no conflict of interest. The funders had no role in the design of the study; in the collection, analyses, or interpretation of data; in the writing of the manuscript, or in the decision to publish the results.
References
- Gerke, M. Developments in UAV-Photogrammetry. J. Digit. Landsc. Archit. 2018, 3, 262–272. [Google Scholar] [CrossRef]
- Cunningham, K.; Walker, G.; Stahlke, E.; Wilson, R. Cadastral audit and assessments using unmanned aerial systems. Int. Arch. Photogramm. Remote Sens. Spat. Inf. Sci. 2011, XXXVIII-1/C2, 213–216. [Google Scholar] [CrossRef] [Green Version]
- Remondino, F.; Barazzetti, L.; Nex, F.; Scaioni, M.; Sarazzi, D. UAV photogrammetry for mapping and 3D modelling-current status and future perspectives. Int. Arch. Photogramm. Remote Sens. Spat. Inf. Sci. 2011, XXXVIII-1/C22, 25–31. [Google Scholar] [CrossRef] [Green Version]
- Koeva, M.; Muneza, M.; Gevaert, C.; Gerke, M.; Nex, F. Using UAVs for map creation and updating. A case study in Rwanda. Surv. Rev. 2018, 50, 312–325. [Google Scholar] [CrossRef] [Green Version]
- Cramer, M.; Bovet, S.; MGültlinger, M.; Honkavaara, E.; McGill, A.; Rijsdijk, M.; Tabor, M.; Tournadre, V. On the use of RPAS in national mapping—the EuroSDR point of view. Int. Arch. Photogramm. Remote Sens. Spat. Inf. Sci. 2013, 93–99. [Google Scholar] [CrossRef] [Green Version]
- Colomina, I.; Molina, P. Unmanned aerial systems for photogrammetry and remote sensing: A review. J. Photogramm. Remote Sens. 2014, 92, 79–97. [Google Scholar] [CrossRef] [Green Version]
- Nex, F.; Remondino, F. UAV for 3D mapping applications: A review. Appl. Geomat. 2014, 6, 1–15. [Google Scholar] [CrossRef]
- Manyoky, M.; Theiler, P.; Steudler, D.; Eisenbeiss, H. Unmanned aerial vehicle in cadastral applications. Int. Arch. Photogramm. Remote Sens. Spat. Inf. Sci. 2011, 38, 57–62. [Google Scholar] [CrossRef] [Green Version]
- Puniach, E.; Bieda, A.; Ćwiąkała, P.; Kwartnik-Pruc, A.; Parzych, P. Use of Unmanned Aerial Vehicles (UAVs) for Updating Farmland Cadastral Data in Areas Subject to Landslides. Int. J. Geo-Inf. 2018, 7, 331. [Google Scholar] [CrossRef] [Green Version]
- Stöcker, C.; Nex, F.; Koeva, M.; Gerke, M. UAV based cadastral mapping: An assessment of the impact of flight parameters and ground truth measurements on the absolute accuracy of derived orthoimages. Int. Arch. Photogramm. Remote Sens. Spat. Inf. Sci. 2019, 42, 613–617. [Google Scholar] [CrossRef] [Green Version]
- Stöcker, C.; Nex, F.; Koeva, M.; Gerke, M. High-Quality UAV-Based Orthophotos for Cadastral Mapping: Guidance for Optimal Flight Configurations. Remote Sens. 2020, 12, 3625. [Google Scholar] [CrossRef]
- Martínez-Carricondo, P.; Agüera-Vega, F.; Carvajal-Ramírez, F.; Mesas-Carrascosa, F.-J.; García-Ferrer, A.; Pérez-Porras, F.-J. Assessment of UAV-photogrammetric mapping accuracy based on variation of ground control points. Int. J. Appl. Earth Obs. Geoinf. 2018, 72, 1–10. [Google Scholar] [CrossRef]
- Rhee, S.; Kim, T. Investigation of 1:1000 scale map generation by stereo plotting using uav images. Int. Arch. Photogramm. Remote Sens. Spat. Inf. Sci. 2017, 42, 319–324. [Google Scholar] [CrossRef] [Green Version]
- Rijsdijk, M.; van Hinsbergh, W.H.M.; Witteveen, W.; ten Buuren, G.H.M.; Schakelaar, G.A.; Poppinga, G.; van Persie, M.; Ladiges, R. Unmanned aerial systems in the process of juridical verification of cadastral border. Int. Arch. Photogramm. Remote Sens. Spat. Inf. Sci. 2013, XL-1/W2, 325–331. [Google Scholar] [CrossRef] [Green Version]
- Crommelinck, S.; Bennett, R.; Gerke, M.; Nex, F.; Yang, M.Y.; Vosselman, G. Review of Automatic Feature Extraction from High-Resolution Optical Sensor Data for UAV-Based Cadastral Mapping. Remote Sens. 2016, 8, 689. [Google Scholar] [CrossRef] [Green Version]
- Crommelinck, S.; Höfle, B.; Koeva, M.N.; Yang, M.Y.; Vosselman, G. Interactive cadastral boundary delineation from UAV data. Ann. Photogramm. Remote Sens. Spat. Inf. Sci. 2018, 4, 81–88. [Google Scholar] [CrossRef] [Green Version]
- Fetai, B.; Oštir, K.; Kosmatin Fras, M.; Lisec, A. Extraction of Visible Boundaries for Cadastral Mapping Based on UAV Imagery. Remote Sens. 2019, 11, 1510. [Google Scholar] [CrossRef] [Green Version]
- Kurczynski, Z.; Bakuła, K.; Karabin, M.; Kowalczyk, M.; Markiewicz, J.S.; Ostrowski, W.; Podlasiak, P.; Zawieska, D. The possibility of using images obtained from the UAS in cadastral works. Int. Arch. Photogramm. Remote Sens. Spat. Inf. Sci. 2016, 41, 909–915. [Google Scholar] [CrossRef] [Green Version]
- Pfeifer, N.; Rutzinger, M.; Rottensteiner, F.; Mücke, W.; Hollaus, M. Extraction of building footprints from airborne laser scanning: Comparison and validation techniques. Urban Remote Sens. Jt. Event 2007, 1–9. [Google Scholar] [CrossRef]
- Luo, X.; Bennett, R.M.; Koeva, M.; Lemmen, C. Investigating Semi-Automated Cadastral Boundaries Extraction from Airborne Laser Scanned Data. Land 2017, 6, 60. [Google Scholar] [CrossRef] [Green Version]
- He, G.B.; Li, L.L. Research and application of LIDAR technology in cadastral surveying and mapping. Int. Arch. Photogramm. Remote Sens. Spat. Inf. Sci. 2020, 43, 33–37. [Google Scholar] [CrossRef]
- Ramadhani, S.A.; Bennett, R.M.; Nex, F.C. Exploring UAV in Indonesian cadastral boundary data acquisition. Earth Sci. Inform. 2018, 11, 129–146. [Google Scholar] [CrossRef]
- Barnes, G.; Volkmann, W.; Sherkoand, R.; Kelm, K. Drones for peace: Part 1 of 2 design and testing of a UAV-based cadastral surveying and mapping methodology in Albania. In Proceedings of the World Bank Conference on Land and Poverty, Washington, DC, USA, 24–27 March 2014. [Google Scholar]
- Czech Office for Mapping, Surveying and Cadastre (COMSC) a. Available online: https://www.cuzk.cz/English/Cadastre-of-Real-Estate.aspx (accessed on 10 March 2021).
- Czech Office for Mapping, Surveying and Cadastre (COMSC) b. Available online: https://www.cuzk.cz/Predpisy/Resortni-predpisy-a-opatreni/Navody-CUZK.aspx (accessed on 20 December 2019).
- Czech Office for Mapping, Surveying and Cadastre (COMSC) c. Available online: https://www.cuzk.cz/Predpisy/Resortni-predpisy-a-opatreni/Navody-CUZK/Navod_150150022.aspx (accessed on 10 March 2021).
- Laws for People. Available online: https://www.zakonyprolidi.cz/cs/2013-357/zneni-20200101 (accessed on 5 April 2021).
- ČSN 01 3410—Mapy Velkých Měřítek—Základní a Účelové Mapy (Czech Standard—Large Scale Maps—Base and Thematic Maps) (Czech Only); Úřad pro Technickou Normalizaci, Metrologii a Státní Zkušebnictví: Prague, Czech Republic, 2014; 12p.
- Research Institute of Geodesy, Topography and Cartography. Available online: http://www.vugtk.cz/euradin/TB02CUZK002/ (accessed on 10 March 2021).
- Zaoralová, J.; Šafář, V.; Kocáb, M. Modern way of the Czech cadastral documentation renewal by new mapping methods. SGEM2016 Conf. Proc. 2016, 1, 759–766. [Google Scholar] [CrossRef]
- Pepe, M.; Fregonese, L.; Scaioni, M. Planning airborne photogrammetry and remote-sensing missions with modern platforms and sensors. Eur. J. Remote Sens. 2018, 51, 412–436. [Google Scholar] [CrossRef]
- Mian, O.; Lutes, J.; Lipa, G.; Hutton, J.J.; Gavelle, E.; Borghini, S. Direct Georeferencing on Small Unmanned Aerial Platforms for Improved Reliability and Accuracy of Mapping without the Need for Ground Control Points. Int. Arch. Photogramm. Remote Sens. Spat. Inf. Sci. 2018, XL-1/W4, 397–402. [Google Scholar] [CrossRef] [Green Version]
- Software ETJTZU. Czech Office for Mapping, Surveying and Cadastre (COMSC). Available online: https://geoportal.cuzk.cz/ (accessed on 5 April 2021).
Figure 1.
A section from the Digital Cadastral Map from the village of Bohy (50.0° N, 13.6° E). Source: COMSC, Available online:
https://www.cuzk.cz/en (accessed on 2 June 2021).
Figure 1.
A section from the Digital Cadastral Map from the village of Bohy (50.0° N, 13.6° E). Source: COMSC, Available online:
https://www.cuzk.cz/en (accessed on 2 June 2021).
Figure 2.
Example of signalised points in the camera calibration field on the highway near Hradec Králové (GSD 0.01 m). Circles with a diameter of 0.2 m and two white and black sectors were used for signalisation to assure the best possible identification of their centres on images.
Figure 2.
Example of signalised points in the camera calibration field on the highway near Hradec Králové (GSD 0.01 m). Circles with a diameter of 0.2 m and two white and black sectors were used for signalisation to assure the best possible identification of their centres on images.
Figure 3.
The four variants of GCPs distribution over the calibration field on the highway near Hradec Králové. The green ellipses mark GCP pairs; the CPs are in grey.
Figure 3.
The four variants of GCPs distribution over the calibration field on the highway near Hradec Králové. The green ellipses mark GCP pairs; the CPs are in grey.
Figure 4.
Flight plan for UAV mapping of the built-up area of the village of Tymákov. The entire area was divided into three blocks (marked with pink, white and yellow) to maximise UAV endurance. The red line indicates the border of the area to be mapped (155 ha).
Figure 4.
Flight plan for UAV mapping of the built-up area of the village of Tymákov. The entire area was divided into three blocks (marked with pink, white and yellow) to maximise UAV endurance. The red line indicates the border of the area to be mapped (155 ha).
Figure 5.
UAV image acquisition over Krašov Castle aiming at increasing the point density on the castle facades. The camera positions are marked with black dots and emphasised with red ellipses indicating the Z error in the parameters of exterior orientation (in the level of meters due to low accuracy of the mounted GNSS receiver). Output from the Agisoft Photoscan software.
Figure 6.
Report of a single point measurement using intersection photogrammetry.
Figure 6.
Report of a single point measurement using intersection photogrammetry.
Figure 7.
The Dlouhá Ves u Sušice test area. The central part of the figure shows the whole area of the Sirius MV flight and the three laser scanning test sites are marked with red ellipses. The laser scanning test sites in detail: O1—buildings in compact blocks, O2—a new development, and O3—a dense irregular development in the old part of the village.
Figure 8.
Two types of GCPs for laser scanning from UAV. (a) 0.22 × 0.22 m2 squared signals covered with aluminium foil at the terrain level; (b) a GCP on a roof ridge.
Figure 8.
Two types of GCPs for laser scanning from UAV. (a) 0.22 × 0.22 m2 squared signals covered with aluminium foil at the terrain level; (b) a GCP on a roof ridge.
Figure 9.
Distribution of GCPs in the Bohy locality.
Figure 9.
Distribution of GCPs in the Bohy locality.
Figure 10.
Point cloud (white points) of Krašov Castle from UAV image matching and derived outlines of the wall reminders (yellow lines). Coloured lines represent the cadastral map (green—original cadastral map before the revision of the cadastre, red—updated cadastral map, blue—a borderline of the measuring charts).
Figure 11.
Creating a building floor plan as the intersection of the walls with the ground in Geostore V6 software from a point cloud obtained by image matching. Test area Bohy.
Figure 11.
Creating a building floor plan as the intersection of the walls with the ground in Geostore V6 software from a point cloud obtained by image matching. Test area Bohy.
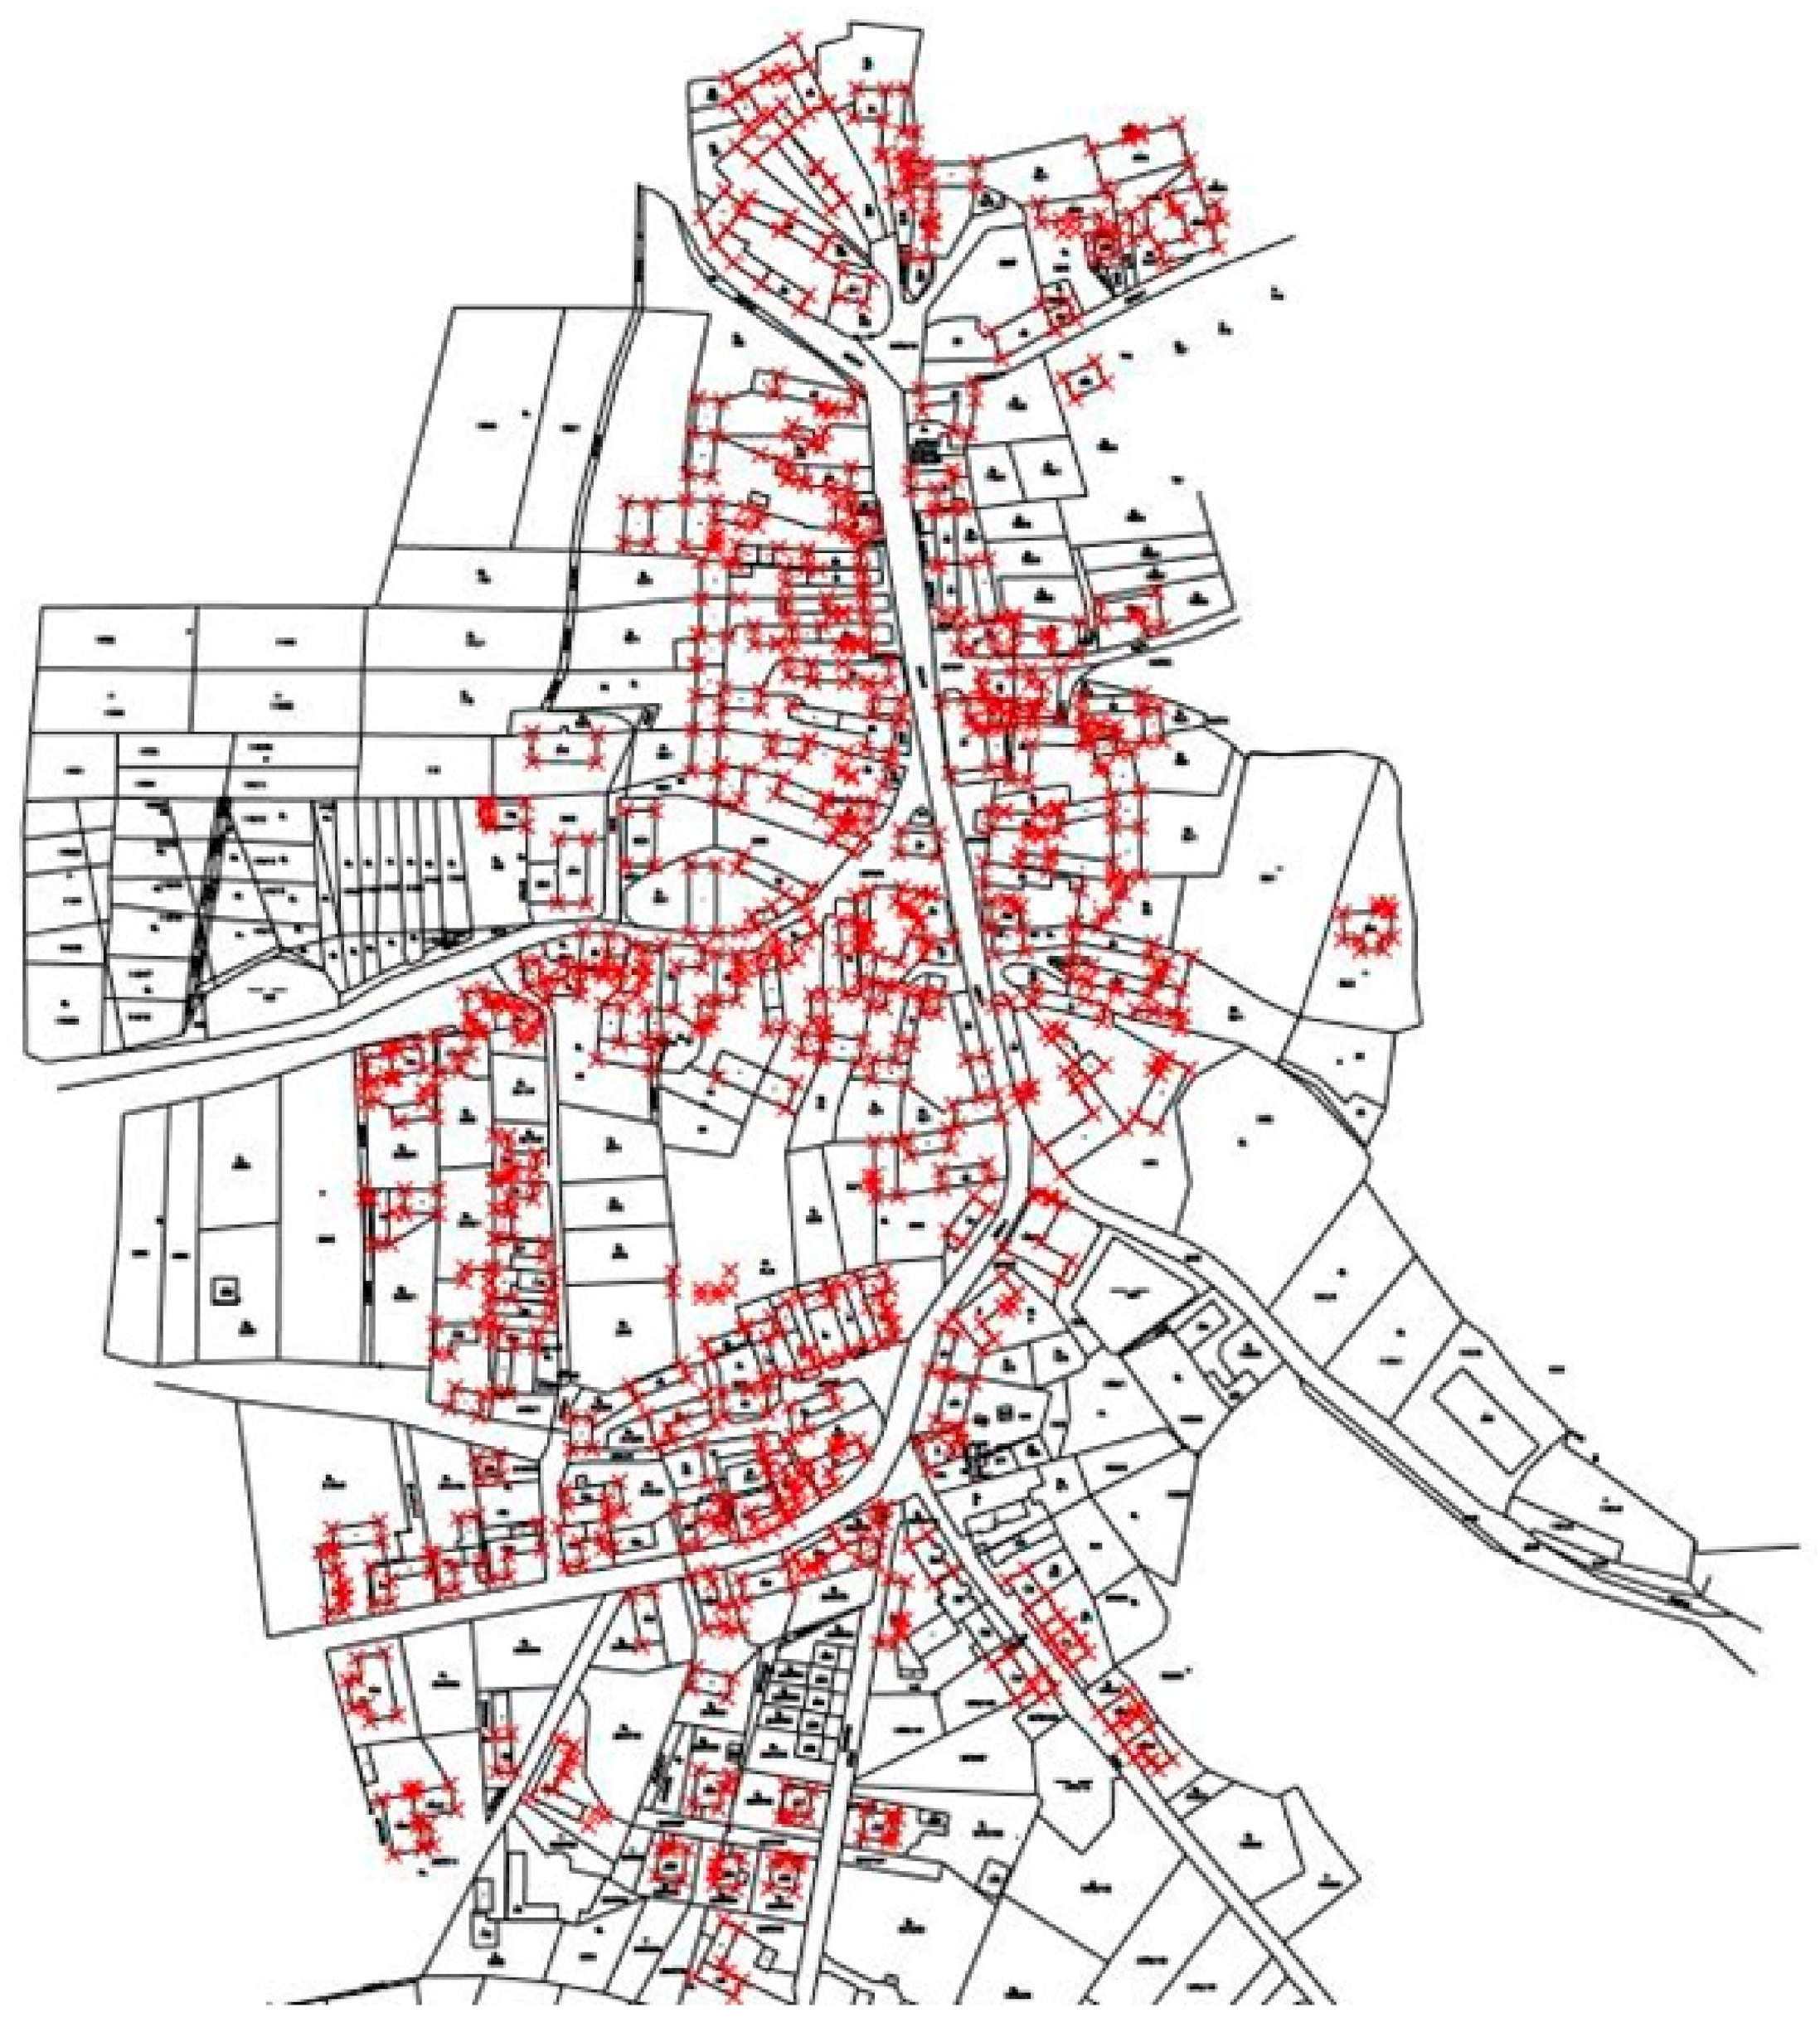
Figure 12.
Identical points (red crosses) measured in the point clouds derived by image matching and geodetic survey (GNSS-RTK and total station) in the Soběšice u Sušice test area.
Figure 12.
Identical points (red crosses) measured in the point clouds derived by image matching and geodetic survey (GNSS-RTK and total station) in the Soběšice u Sušice test area.
Table 1.
Parameters of the photogrammetric UAV flights over seven test localities in six cadastral units. f—camera focal length, h—average flying height above the terrain, GSD—ground sample distance of a derived orthoimage, p—forward overlap, q—side overlap.
Table 1.
Parameters of the photogrammetric UAV flights over seven test localities in six cadastral units. f—camera focal length, h—average flying height above the terrain, GSD—ground sample distance of a derived orthoimage, p—forward overlap, q—side overlap.
| Locality | Platform | Camera | Image Size [px] | f [mm] |
| Hradec Králové | Hexacopter G6 | Canon EOS 700D | 5184 × 3456 | 24 |
| Tymákov | MAVinci SIRIUS | LumixGX1-Pancake | 4592 × 3448 | 14 |
| Soběšice |
| Bohy |
| Bohy-Krašov | Hexacopter G6 | Canon EOS 700D | 5184 × 3456 | 28 |
| Klášter | Trimble UX5 | SONY ILCE-6000 | 6000 × 4000 | 15 |
| Dlouhá Ves | MAVinci SIRIUS | DMC-GX1 | 4592 × 3448 | 14 |
| Locality | h [m] | Sensor Size [μm] | GSD [m] | p/q [%] | Area [ha] | Number of Images |
| Hradec Králové | 68 | 4.4 | 0.010 | 80/60 | 20 | 1235 |
| Tymákov | 71 | 3.8 | 0.017 | 80/80 | 176 | 3184 |
| Soběšice | 88 | 0.021 | 80/60 | 51 | 1529 |
| Bohy | 100 | 0.025 | 80/80 | 11 | 801 |
| Bohy-Krašov | 99 | 4.4 | 0.015 | 80/80 * | 4 | 371 |
| Klášter | 73 | 3.9 | 0.021 | 80/80 | 10 | 1194 |
| Dlouhá Ves | 85 | 3.8 | 0.020 | 80/60 | 256 | 4698 |
Table 2.
RMSE, maximal and minimal residuals on check points (CPs) for different ratios between ground control points (GCPs) and CPs.
Table 2.
RMSE, maximal and minimal residuals on check points (CPs) for different ratios between ground control points (GCPs) and CPs.
Variant
Description | RMSE [m] | MAX [m] | MIN [m] |
|---|
| Y | X | Z | Y | X | Z | Y | X | Z |
|---|
Variant No. 1
4 GCPs, 96 CPs | 1.014 | 0.080 | 2.148 | 1.664 | 0.107 | 3.753 | −0.361 | −0.173 | −0.906 |
Variant No. 2
6 GCPs, 94 CPs | 0.041 | 0.041 | 0.038 | 0.113 | −0.020 | 0.120 | −0.020 | −0.107 | −0.113 |
Variant No. 3
10 GCPs, 90 CPs | 0.015 | 0.015 | 0.039 | 0.040 | 0.036 | 0.143 | −0.035 | −0.042 | −0.094 |
Variant No. 4
33 GCPs, 67 CPs | 0.012 | 0.011 | 0.035 | 0.032 | 0.025 | 0.115 | −0.014 | −0.026 | −0.093 |
Table 3.
Accuracy assessment of UAV orthoimages in the cadastral area of Tymákov based on 353 CPs measured with GNSS-RTK.
Table 3.
Accuracy assessment of UAV orthoimages in the cadastral area of Tymákov based on 353 CPs measured with GNSS-RTK.
| Differences on CPs between GNSS-RTK and UAV Orthoimages |
|---|
| | dY | dX |
|---|
| Mean [m] | 0.00 | 0.00 |
| RMSE [m] | 0.04 | 0.04 |
| Max. difference (absolute value) [m] | 0.09 | 0.09 |
Table 4.
Statistics of residual errors r (differences between measured and estimated coordinates) from image orientation on 13 GCPs calculated in the Agisoft Photoscan software in the Bohy locality. A total of 801 images with a GSD of 0.025 m were included in the calculation. There were 12 to 20 projections per GCP. StD—standard deviation, max. r—absolute value of the maximal error.
| | rX [m] | rY [m] | rZ [m] |
|---|
| Mean [m] | −0.001 | 0.001 | −0.002 |
| StD [m] | 0.010 | 0.012 | 0.026 |
| RMSE [m] | 0.009 | 0.011 | 0.025 |
| max. r [m] | 0.015 | 0.024 | 0.051 |
Table 5.
Comparison of the geodetic measurements and points derived by point measurement in overlapping images (intersection photogrammetry) in the locality Klášter.
Table 5.
Comparison of the geodetic measurements and points derived by point measurement in overlapping images (intersection photogrammetry) in the locality Klášter.
| Differences on CPs between GNSS-RTK and UAV Intersection Photogrammetry |
|---|
| | dY | dX |
|---|
| Mean [m] | 0.00 | 0.03 |
| RMSE [m] | 0.08 | 0.08 |
| Maximum difference (absolute value) [m] | 0.26 | 0.29 |
Table 6.
Quality assessment of the orthoimage (GSD 0.02 m) and geodetic measurements at the Dlouhá Ves locality based on comparison of 17 CPs.
Table 6.
Quality assessment of the orthoimage (GSD 0.02 m) and geodetic measurements at the Dlouhá Ves locality based on comparison of 17 CPs.
| Differences on CPs between GNSS-RTK and UAV Orthoimages |
|---|
| | dY | dX |
|---|
| Mean [m] | −0.01 | 0.00 |
| RMSE [m] | 0.02 | 0.02 |
| Maximum difference (absolute value) [m] | 0.05 | 0.04 |
Table 7.
Comparison of CP coordinates derived from UAV photogrammetry (photo) or laser scanning (LiDAR) and geodetic measurement (g. m.).
Table 7.
Comparison of CP coordinates derived from UAV photogrammetry (photo) or laser scanning (LiDAR) and geodetic measurement (g. m.).
| Statistic | Photo vs. g. m.
Building Corners | Photo vs. g. m.
Fence Points | LiDAR vs. g. m.
Building Corners |
|---|
| Number of points compared | 378 | 86 | 277 |
| Required RMSExy | 0.14 m | 0.14 m | 0.14 m |
| Maximal allowable error uxy = 2.0*RMSExy | 0.28 m | 0.28 m | 0.28 m |
| Confidence coefficient | 2.0 | 2.0 | 2.0 |
| Number of points in the interval <0, RMSExy) | 303 (80.2%) | 81 (94.2%) | 273 (98.6%) |
| Number of points in the interval (RMSExy, 2.0*RMSExy) | 75 (19.8%) | 5 (5.8%) | 4 (1.4%) |
| Number of points in the interval <2.0*RMSExy, infinity) | 0 (0.0%) | 0 (0.0%) | 0 (0.0%) |
Table 8.
Comparison of the number of points from geodetic measurement (g. m.) that could be measured with UAV photogrammetry (photo) and laser scanning (LiDAR) at the Dlouhá Ves locality. See
Figure 8 for a description of the test areas 1 to 3.
Table 8.
Comparison of the number of points from geodetic measurement (g. m.) that could be measured with UAV photogrammetry (photo) and laser scanning (LiDAR) at the Dlouhá Ves locality. See
Figure 8 for a description of the test areas 1 to 3.
| Test Area | Number of Measured Points |
|---|
| Photo Point Clouds and Orthophoto | % from g. m. | LiDAR | % from g. m. | g. m. |
|---|
| 1 | 176 | 55.3 | 119 | 37.4 | 318 |
| 2 | 132 | 55.0 | 89 | 37.1 | 240 |
| 3 | 156 | 46.0 | 69 | 20.4 | 339 |
| SUM | 464 | 51.7 | 277 | 30.9 | 897 |
| Publisher’s Note: MDPI stays neutral with regard to jurisdictional claims in published maps and institutional affiliations. |
© 2021 by the authors. Licensee MDPI, Basel, Switzerland. This article is an open access article distributed under the terms and conditions of the Creative Commons Attribution (CC BY) license (https://creativecommons.org/licenses/by/4.0/).


 ,
, 


