


Automated Generation of Room Usage Semantics from Point Cloud Data

College of Information Sciences and Technology, Penn State University, University Park, PA 16802, USA
*
Author to whom correspondence should be addressed.
ISPRS Int. J. Geo-Inf. 2023, 12(10), 427; https://doi.org/10.3390/ijgi12100427
Submission received: 1 August 2023
/
Revised: 7 October 2023
/
Accepted: 9 October 2023
/
Published: 17 October 2023
(This article belongs to the Special Issue Unlocking the Power of Geospatial Data: Semantic Information Extraction, Ontology Engineering, and Deep Learning for Knowledge Discovery)
Abstract
:Room usage semantics in models of large indoor environments such as public buildings and business complex are critical in many practical applications, such as health and safety regulations, compliance, and emergency response. Existing models such as IndoorGML have very limited semantic information at room level, and it remains difficult to capture semantic knowledge of rooms in an efficient way. In this paper, we formulate the task of generating rooms usage semantics as a special case of room classification problems. Although methods for room classification tasks have been developed in the field of social robotics studies and indoor maps, they do not deal with room usage and occupancy aspects of semantics, and they ignore the value of furniture objects in understanding room usage. We propose a method for generating room usage semantics based on the spatial configuration of room objects (e.g., furniture, walls, windows, doors). This method uses deep learning architecture to support a room usage classifier that can learn spatial configuration features directly from semantically labelled point cloud (SLPC) data that represent room scenes with furniture objects in place. We experimentally assessed the capacity of our method in classifying rooms in office buildings using the Stanford 3D (S3DIS) dataset. The results showed that our method was able to achieve an overall accuracy of 91% on top-level room categories (e.g., offices, conference rooms, lounges, storage) and above 97% accuracy in recognizing offices and conference rooms. We further show that our classifier can distinguish fine-grained categories of of offices and conference rooms such as shared offices, single-occupancy offices, large conference rooms, and small conference rooms, with comparable intelligence to human coders. In general, our method performs better on rooms with a richer variety of objects than on rooms with few or no furniture objects.
1. Introduction
Indoor spaces are artificial constructs designed to support human activities [1]. With rapid urbanization, large indoor environments such as high-rise business complexes, public buildings, airports, and train stations are increasingly important as infrastructure to serve urban populations. Keeping such spaces functional, efficient, and safe can be very challenging and can benefit from having geometrically accurate and semantically rich three-dimensional (3D) models [2]. However, the construction of 3D models for indoor environment is significantly more challenging than modeling outdoor environments. Indoor spaces are enclosed, cluttered, and human-occupied [3], making it dificult to capture indoor scenes with sensors [4].
Indoor spatial models typically describe the geometrical, topological, and semantic aspects of indoor space [3,5]. Automated generation of 3D geometry and location properties of indoor structures and objects has been well developed [3,6,7,8,9,10,11]; however, methods for extracting semantic information remain limited. This explains why existing indoor models such as IndoorGML [12] have extensive geometric descriptions of structural elements (walls, floors, ceilings, doors, and windows) but they have very little semantic information at the room level and beyond. The need to enrich 3D indoor models with semantic information at the room level has been repeatedly identified in the past [13,14]. In particular, understanding how rooms are used is critical in applications such as safety management and code compliance [14]. Room use is also relevant to the health and safety of the workplace, as indicated in the safety guidelines published by the Occupational Safety and Health Administration (OSHA) (https://safetyculture.com/topics/office-safety/, accessed on 15 July 2023). Unfortunately, semantic tagging of indoor spaces that describes their occupancy and usage is a much harder problem and remains a manual process to a great extent [14,15]. This is due to multiple reasons: (1) semantic properties reflect human conception and use of space, and cannot be directly extracted from building design documents such as Building Information Models (BIM); (2) usage-related semantic information is likely to change over time, as people constantly make changes on how they use their spaces.
Our work addresses the need for automated generation of room usage semantics for large public buildings. We formulate this task as a special case of the room classification or room categorization problems. Active research on room classification can be found in social robotics studies [16], where recognizing different rooms in a home environment is a crucial spatial competence to perform various tasks in households. Existing room classification methods use probabilistic models [17] or statistical machine learning methods [14,18] to infer room types from geometric and topological features extracted from vector maps [17,18], building information models (BIM) [14,19], images from 2D sensors [20], laser range sensors [20,21], and 2D maps from LiDar sensors [22]. They typically require highly engineered features and knowledge rules defined on the geometric and topological information of room categories. Although they can recognize general room categories defined during the design stage, they are not concerned with the usage and occupancy aspects of room semantics. They were designed to work for small-scale indoor structures, such as residential buildings, which have a small number of well-balanced room types.
The main contribution of this paper is the establishment of a room usage classification method that infers the type of room usage based on the spatial configuration of room scenes, i.e., how the furniture objects in a room are placed in relation to each other and to structural elements such as walls, doors, and windows. An example of a room scene with furniture objects is shown in Figure 1.
Our work is based on the insight that furniture objects in a room are placed and configured to play certain functional roles in supporting the intended use [13]. We argue that a room classifier should exploit this intimate relationship between the spatial configuration of furniture objects in a room and room usage semantics. The core of our method is a room usage classifier that automatically learns spatial configuration features from semantically-labelled point cloud (SLPC) representation of a room scene. SLPC data describes each 3D point with a semantic label of the object class and it allow for extraction of the spatial configuration features of room objects. Extracting such features is challenging because they are multi-scale and difficult to describe. Our classifier employs a multi-scale feature extraction module that can learn the spatial configuration features of furnished rooms automatically.
Because our method makes explicit use of furniture objects in understanding the configuration of room scenes, we expect that it can provide distinct capacity in room classification tasks. To examine such hypothesis, we present multiple experiments to explore the utility of our method in classifying rooms in office buildings. These experiments used the Stanford 3D Indoor Scene Dataset (S3DIS) (http://buildingparser.stanford.edu/, accessed on 20 January 2021), which contains point cloud representations and with semantic object labels for 272 rooms in six office building areas. Our trained classifier achieved 91.8% accuracy on the task of classifying rooms into six top-level categories for office buildings (conference room, lounge, storage, hallway, office, and bathroom). We further investigated the possibility of differentiating rooms in fine-grained subcategories of offices, conference rooms, and storage rooms. We found that, while large conference rooms are separable from small conference rooms, it is a much harder task to separate small conference rooms from shared offices. Our method was less effective in classifying rooms with few furniture objects (such as storage rooms and foyers). Overall, the results of our experiments show strong evidence that the spatial configuration characteristics of room furniture objects can be used to predict room usage types. Further development in this direction could lead to automated generation of room usage semantics for the construction of semantically rich 3D models.
2. Related Work
Room classification depends on our ability to understand scenes of a room. Early approaches to semantic scene understanding of indoor spaces focused on the basic components of a room (walls, floor, furniture) [3,10,23,24]. Such tasks are formulated as semantic segmentation problems in computer vision research [4,25]. Zhang et al. [24] and Ikehata et al. [8] used semantic parsing approaches on RGB-D imagery data to estimate room layout. Recent semantic segmentation algorithms can directly operate on point-cloud data from 3D sensors [26,27,28]. Algorithms such as PointNet [29] and PointNet++ [30] significantly outperform understanding algorithms on image-based scenes in detecting architectural elements such as walls, ceiling, and floors with good accuracy (over 85%); however, recognizing wall openings such as windows, doors, and furniture objects in rooms is less reliable.
The problem of understanding the semantics of indoor scenes at room level has been studied as a room classification or room categorization task in social robotics research [16,22] and as a room semantic labeling task in indoor location-based research [18,31,32]. Social robots are widely used in smart home services such as assisting seniors and doing housekeeping, and it is an essential skill for a robot to recognize the types of rooms it is navigating in a house [33]. Room classification is a type of scene understanding task in computer vision in which a room scene is categorized into specific classes according to certain geometric or semantic features of the scenes. To create a semantic map for robots, Swadzba and Wachsmuth [34] used Support Vector Machine (SVM) algorithms to classify rooms in typical IKEA home centers, including bathrooms, bedrooms, eating places, kitchens, living rooms, and offices. Their algorithms used a combination of 2D and 3D geometric features extracted from depth cameras. Although some of their room scenes contained furniture objects, these objects were ignored in the feature learning process. Pronobis and Jensfelt [19] used information about the shape, size, and general appearance of room scenes extracted from 2D image sequences and laser scans as semantic clues to infer room types using a probabilistic model. This method was used to categorize 47 rooms in an office building and achieved 84% accuracy at the best feature configuration. Mozos and colleagues [35] used Support Vector Machine (SVM) and Random Forest (RF) classifiers on RGB-D images to classify five places in university buildings: corridors, laboratories, offices, kitchens and study rooms. They found that SVM classification offered the best results. Peter Uri et al. [21] used laser data to train an SVM classifier that achieved an accuracy of 84% when classifying rooms in residential buildings into living rooms, corridors, bathrooms, and bedrooms.
Common to this group of studies on social robotics is that they all used traditional statistical learning methods, which require hand-crafted rules defined on room characteristics extracted from 2D or 3D images to infer room semantics. On the contrary, deep learning methods based on convolutional neural networks (CNN) have recently gained momentum [36]. Othman and Rad [20] used a deep learning architecture to classify 2D images of five types of room scene (bedrooms, dining rooms, kitchens, living rooms, and bathrooms), and were able to achieve 93.30% accuracy without handcrafting any features. Recently, [22] trained a room classifier based on convolutional neural networks (CNN) using indoor maps generated from LiDAR sensor data.
In the context of location-based services, room classification is done for the purpose of enriching indoor maps with room semantics in large indoor environments. Hu and colleagues [17] demonstrated the feasibility of using feature grammars defined in geometric features of indoor maps or floor plans and Bayesian inference to infer room usage of research buildings in university environments. They achieved 84% classification accuracy on 408 rooms. However, the grammar rules that they used were specific to particular buildings and have limited generalizability to other styles of buildings. Machine learning approaches such as random forest and relational graph convolutional network (R-GCN) were later introduced in [18] to automatically learn the relationship between the geometry/topology of rooms and room semantics. The features used in their machine learning classifier included the geometries of floors and structural elements, as well as the topological relations among rooms. However, their method assumes the existence of geometric map data, which is not practical for most public buildings.
The above room classification and tagging methods have serious limitations when applied to inferring room usage in large public buildings. Methods developed in social robotics studies work only for small-scale indoor structures such as residential buildings that have a small number of well-balanced room types [20,33]. They are not designed for indoor environments where the number of rooms in each room category could be highly imbalanced. More importantly, they rely on traditional 2D and 3D images and building design documents, such as BIM, to extract geometric and topological features of indoor space and structural elements, and they focus on classifying rooms into a few top-level categories without paying attention to the usage and occupancy aspects of room semantics. Although the presence and layout of room furniture objects offer strong clues about how rooms are used, room furniture objects have been ignored or treated as clutter in previous room classification studies.
Our room classification method differs from existing methods in that it can learn multiscale features of the spatial configuration of room objects and use them to predict the room usage type. Unlike other methods that have treated furniture objects in rooms as clutter or noise, our method values the presence and placement of furniture objects in the room as a unique source of information, allowing for greater understanding how the room is used. We employ a deep learning architecture to extract configuration features from a room and relate them to room usage. Although such information is not available from traditional indoor data such as engineering design documents, BIM, or indoor maps, point cloud data can represent a rich source of information.
3. Overview of Our Approach and Research Questions
We conceptualize rooms as complex structures comprised of structural elements such as walls, doors, and windows and of furniture objects such as chairs, tables, lamps, computers, and cabinets. While rooms are mutually disjoint from each other, they are horizontally or vertically connected in sophisticated ways through specific types of architectural components, such as doors and stairs [12]. The true understanding of a room scene involves understanding the structural elements, fixtures, and room objects, as well as understanding how they are spatially configured and semantically related.
In light of the above conceptualization of rooms as purpose-designed spaces, we define the task of room usage classification as inferring room usage types from the spatial configuration of semantic objects in a room scene. We assume that there is a predetermined set of room categories that reflect the human use of rooms. These room categories could be either a flat list or organized as a hierarchy of categories.
Our approach for solving the above classification problem works similarly to the process illustrated in Figure 2. First, we assume that a 3D scan of a building has generated a point cloud representation for all the rooms in a building. Each room (box ) corresponds to point cloud data that represent the scanned scene of that room (box ). Next, the point sets of a room are semantically segmented either manually or automatically (see box ) to derive a semantically labeled point cloud (SLPC) representation of room scenes (box ). This process can take place through human interpretation of 3D scenes (the upper part of box ) or by automated semantic segmentation algorithms [29,30,32,37,38,39] (the lower part of box ).
In an SLPC representation of a room, each point is represented as a four-dimensional vector (x, y, z, cls), where (x, y, z) are 3D coordinates and ‘cls’ is a semantic tag indicating the object class it belongs to. We further assume that there are a limited number of object classes {O1, O2, …On}. For indoor environments, these object classes typically include structural elements (e.g., walls, ceiling, and floors), structural surface elements (e.g., doors, windows, columns, picture frames), and furniture objects (e.g., tables, chairs, and sofas).
The core of our method is the Room Usage Classifier (box ). It uses a deep learning architecture to classify rooms based on the spatial configuration of room objects detected from the representation of the serially labeled point cloud (SLPC) (box ) of room scenes.
3.1. Room Usage Classifier: Its Architecture and Rationale
Our classifier uses a deep learning architecture, as shown in Figure 3. It is composed of a Room Feature Extraction module and a Classification module.
3.1.1. Rooms Feature Extraction Module
The rooms feature extraction module takes N points as input, applies feature extraction transformations and then aggregates features by max grouping. When designing the room feature extraction module, we must consider two constraints: (1) it has to be able to perceive local features that are important for room objects, such as furniture; and (2) it needs to be able to perceive object configuration features in the room scene. One way to capture multiscale patterns is to apply grouping layers with different scales coupled with local feature extraction networks, such as PointNets [29], to extract features of each scale. Features at different scales are concatenated to form a multi-scale feature. This idea has been formalized as Multiscale Grouping (MSG) in PointNet++ [30], and has been widely used in many other deep learning for 3D Point Clouds [26]. In our classifier architecture, we concatenate three MSGs (MSG1(0.4, 0.6, 0.8, 1.0), MSG2(1.2, 1.4, 1.6), and MSG3(1.8, 2.0, 2.2)) to bridge the large scale span from submeters (for perceiving local features) to multiple meters (for constructing room scene-level configuration features).
- MSG1 takes in 32768 points and outputs 2048 point features. It searches features on four radii (0.4 m, 0.6 m, 0.8 m, 1 m) and samples 16 points from each radius. Points sampled from each radius are processed by a multilayer peceptron (MLP(16, 16, 32)), and detected features are synthesized via max-pooling.
- MSG2 takes in 2048 points and outputs 512 point features. It searches features on three radii (1.2 m, 1.4 m, 1.6 m) and samples 16 points from each radius. Points sampled from each radius are processed by a multilayer perceptron MLP(32, 32, 64) and the detected features are synthesized via max-pooling.
- MSG3 takes in 512 points and outputs 2048 point features. It searches features on three radii (1.8 m, 2.0 m, 2.2 m) and samples 16 points from each radius. Points sampled from each radius are processed by a multilayer peceptron (MLP(64, 64, 128)) and the detected features are synthesized via max-pooling.
Each MSG layer performs three tasks: (1) sampling input points to select a set of points as the centroids of local regions using the iterative farthest point sampling (FPS) method [30]; (2) grouping local points to form local regions by finding neighboring points around the centroids; and (3) extracting local features using a mini-PointNet [29]. By concatenating three MSGs together, our Room Feature Extraction module can detect features with a wide range of search radius values, ensuring that important room configuration features are extracted no matter the scales (local, middle, or room) at which they are most prominent. We experimented with many different choices of MSG layers and their search radius before settling on the current configuration for the best outcome.
3.1.2. Classification Module
The classification module outputs classification scores for K classes. It consists of two sub-components:
- A Multi-Layer Perceptron for pooling the features detected in MSGs. It has three layers of fully connected MLP nodes (MP(256, 512, 1024)) and max-pooling is applied after each layer of the MLP by default.
- A classification net for producing room usage classification scores for k classes. It consists of three fully connected layers (FC(512, 256, 128, k)). A dropout rate of 0.5 is applied after each layer, except for the output layer.
3.1.3. Input Sampling
The classifier must take a scene from the entire room as input in order to extract configurational features. However, 3D scans of rooms are full of irregularities in terms of point density and point spacing. The variation in room size adds further challenges. To balance the need to detect local features while keeping the computational complexity manageable, we set the initial number of input points to 32,786 to ensure enough points for each local region while keeping the number of points small. This requires that all room scenes first be down-sampled into 32,786 points before being fed into the classifier. This number of input points worked well for the types of office building that we used in this study, though it may need to be adjusted for other types of buildings. We achieve this downsampling via the random input dropout method, where points are randomly selected to be dropped out with a set probability.
3.1.4. Rationale
The choice of deep learning architecture for our Room Usage Classifier was driven by the goal of learning important spatial configuration features in rooms from their SLPC representation. The classifier principle is based on the assumption that “The intended use of a room plays an enormous role in explaining why furniture objects are placed one way or another” [40]. This translates to the idea of using the spatial configuration of room furniture objects along with structural elements as the primary clues for inferring room usage.
The deep learning architecture of the Room Usage Classifier reflects our understanding of how humans perceive a room scene. The theory of scene perception [41] suggests that scene-level perception of a room occurs in two stages: (1) an initial stage in which a quick impression is formed based on perception of the spatial layout; and (2) a recognition stage that uses world knowledge to make sense of the scene through a detailed analysis of objects and their geometry/topology [42]. Our classifier seeks to replicate the above human perception process to a certain degree. The three MSGs detect features that are sensitive to differences in the spatial configuration of semantic objects in a room, then the MLP layer aggregates features from multiple scales and discovers their “links” to categories of room usage.
3.2. Research Questions
The design of our room classification method was based on the hypothesis that the spatial configuration of structural elements and furniture objects in a room scene offers powerful clues on their intended use. If this hypothesis is true, we would expect our Room Usage Classifier to generate reasonably good predictions of room usage. We experimentally evaluated the ability of our method to classify rooms in large office buildings. These experimental studies were driven by the following research questions:
- Q1
- Can spatial configuration features of room scenes predict common room categories in office buildings given the highly imbalanced room distribution among room categories? This question was addressed by Experiment 1 (Section 4.2).
- Q2
- Can the spatial configuration features of the room scenes predict more fine-grained room categories? This question was addressed in Experiment 2 (Section 4.3).
- Q3
- Can point cloud data without human-generated object labels be used to predict room types? Our room classifier assumes the existence of semantically labeled point sets for each room. The question of whether our proposed method can work with only geometrically defined 3D point clouds was addressed in Experiment 3 (Section 4.4).
4. Experiments: Materials and Methods
In this section, we present the results of three experiments used to explore the effectiveness of our method in inferring room usage type from semantically labeled point cloud representation of room scenes. Experiment 1 addressed the research question [Q1] by classifying rooms into one of the six top-level categories: conference room, lounge, storage, hallway, office, and bathroom (see schema 1 in Figure 4). The preliminary results of this experiment were previously reported in [40]; Section 4.2 presents an elaborate description and interpretation of Experiment 1 for a better understanding of the effect of data imbalance.
Experiment 2 addressed the research question [Q2] by testing the ability of our method to differentiate fine-grained categories of rooms. In this experiment, we further divide office, conference room, and storage categories into subcategories to form nine types of usage (see schema 2 in Figure 5). In particular, this experiment recognized that offices can be further distinguished into private offices and shared offices (see Figure 6). The results of this experiment aid in understanding to what extent our classifier can separate subcategories of conference rooms and offices in office buildings.
Experiment 3 added a semantic segmentation algorithm to automate the generation of semantically labeled point cloud representations of room scenes. This experiment was intended to provide a better understanding of the feasibility of classifying rooms using point cloud data without requiring point-level semantic labels.
4.1. Experimental Dataset
We chose to use a publicly available dataset, the Stanford Large-Scale 3D Indoor Spaces Dataset (S3DIS) [10], for both Experiment 1 (Section 4.2) and Experiment 2 (Section 4.3). The S3DIS contains 3D scans from Matterport scanners in six areas, including 272 rooms (see Figure 7). The rooms in the S3DIS dataset have been tagged by human annotators with top-level room categories (office areas, educational or exhibition spaces and conference rooms, personal offices, restrooms, open spaces, lobbies, stairs, and hallways). In addition, each 3D point in a room scene has been annotated by a human with a semantic label that indicates its object category (chair, table, sofa, bookcase, board, floor, wall, ceiling, window, door, beam, column, clutter).
Figure 8 shows an example of a room scene in the S3DIS data. The picture hides objects on the wall, ceiling, and floor to reveal the arrangement of the furniture inside. The configuration of the room objects features a layout with a large table surrounded by chairs. From world knowledge, it can be inferred with confidence that this room is likely to be a conference room. In an ideally organized conference room, we would expect chairs neatly placed around a table; however, a human can recognize it even when the spatial placement of furniture objects deviates from the ideal. It should be noted that certain room objects (colored gray) are labeled as “clutter”. Clutter can be anything other than one of the twelve named categories. We anticipated that the existence of the “clutter” object category might introduce uncertainty to the learning of room configuration features.
4.2. Experiment 1: Classifying Rooms Using Schema 1
This experiment assessed the ability of our method to classify rooms on six top-level categories described in Figure 4. When forming this schema, we inherited the room categories in S3DIS, making the following changes:
- We eliminated “auditorium”, “copy room”, “open space” and “pantry” due to their extreme small samples (less than five each).
- We combined “lobby” and “lounge” rooms to form a new category, “Lounge1”, as lobby and lounge rooms are very similar in their functions and layout.
- We employed a research assistant to go through all rooms and verify that the room category labels were consistent with the spatial layout of the rooms. In cases of obvious inconsistency, we manually set the label to the correct category. We found five conference rooms that were mislabeled as offices and fixed them before inclusion in the experiment.
After this cleaning process, we ended up with 224 rooms properly labeled according to schema 1 (Figure 4). The distribution of room types is shown in Figure 9. The room types are highly imbalanced and are dominated by offices.
4.2.1. Model Training
We first divided the 224 rooms into a training set (RL) and a test set (RT). The training set (RL) contained two-thirds of the rooms of each category in schema 1, and the test set (RT) contained the remaining one-third of the rooms in each category. Second, we trained a room usage classifier (RUC1) using the training set (RL) following the principles described in Section 3.1. In particular, each room in the training set was first downsampled to 32768 points using the random dropout method, then the classifier was trained by each room in order; the training process converged around 200+ epochs. Finally, we used the trained classifier to recognize the room usage categories of the rooms in the test set.
4.2.2. Results
We measured the performance of our classifier using two measures:
- Accuracy: measures the number of rooms classified correctly divided by the total number of rooms in the test set.
- Misclassification: measures the error rate, i.e. the number of rooms classified incorrectly, divided by the total number of rooms in the test set.
Our classifier achieved an overall accuracy of 91.8%. Only 8.2% of the testing rooms were classified incorrectly. Figure 10 shows the confusion matrix among the function categories of the room. These results suggest the following findings:
- Finding 1.
- Offices and conference rooms are clearly distinct from hallways, storage rooms, and bathrooms in terms of their spatial layouts. The confusion matrix shows that these two subsets are rarely confused by our classifier.
- Finding 2.
- Certain conference rooms share a similar spatial layout with certain offices. In all, 33% of the conference rooms were misclassified as offices, while only 3% of the offices were misclassified as conference room. This finding is consistent with the literature on the impact of imbalanced training samples on machine learning outcomes [43].
- Finding 3.
- Bathrooms and hallways are clearly separable by our classifier, while storage rooms can be confused with bathrooms, hallways or offices. In Figure 10, no confusion is reported between the bathrooms and hallways. The prediction of storage rooms is accurate 40%, with confusion occurring with hallways and bathrooms. After checking the original point cloud data, we noticed that bathrooms, hallways, and storage rooms are mostly empty of furniture objects other than “clutter”. Our classifier depends on the existence of furniture objects and spatial configurations to infer room usage; therefore, if these “clutter” objects were labeled more closely with respect to their true semantics (that is, “toilet”) we believe that our classifier would potentially perform better. This possibility will be explored in future research.
The above findings are informative in answering our first research question. Offices and conference rooms are rich in spatial configuration features derived from furniture objects, and are clearly separable from other types of rooms. Additionally, we observed the effect of room imbalance, as evidenced by the confusion of conference rooms with offices.
4.3. Experiment 2: Classifying Rooms Using Schema 2
This experiment assessed the ability of our method to classify rooms in finer granularity in terms of room usage. To decide what would be a feasible level of granularity to study, we employed two research assistants as human coders to analyze and annotate all 225 rooms in the S3DIS dataset to identify distinct subcategories in each of the top categories. Using their world-knowledge about how room layouts support human activities, the coders were able to identify 19 subcategories in the first round of coding. However, most of these subcategories were too small in terms of sample sizes to be included; thus, the authors worked with the two research assistants to narrow them down to a few well-formed subcategories, resulting in a final set of 193 rooms in the nine categories shown in Figure 11.
Figure 5 shows the schema of room categories used in Experiment 2. Conference rooms were split into two subcategories: large group conference rooms (CON1) and small group meeting rooms (CON2). Offices were split into four subcategories: shared multi-occupancy offices (OF1); reception office (OF21); private use offices (OF22); and other office (OF40). Storage rooms were split into two subcategories, ST1 and ST2, with ST1 consisting of storage rooms with no chairs or tables and ST2 of storage rooms with chairs and/or tables.
Finally, the human coders labeled all rooms according to the prototypical spatial configuration of the room objects, as exemplified in Figure 12. It appears that CON2 rooms typically have a table at the center, while the placement of chairs is more spread out compared to those in CON1. OF21 offices tend to have a main work area (a chair with a large table) and a reception area defined by a smaller table and/or chairs.
The results of the above human coding of room types reflect the level of human intelligence when making inferences from spatial configurations of room scenes. Figure 12 shows how the human coders interpreted room scenes and the prototypical examples of rooms in each subcategory, suggesting the following observations:
H1:
Human can separate “Large Conference Rooms” (CON1) from “Small Conference Rooms” (CON2).
H2:
Human can separate “Storage with NO Chair/Table” (ST1) from “Storage with Chair/Table” (ST2).
H3:
Human can separate “Shared Offices” (OF1), “Reception Offices” (OF21), and “Individual Offices” (OF22) from “Other Offices” (OF40).
4.3.1. Model Training
We first divided the 193 rooms into a training set (RL) and a test set (RT). The training set (RL) contains two-thirds of the rooms of each subcategory in Schema 2, while the test set (RT) contains the remaining one-third of the rooms. Next, we trained a second room usage classifier (RUC2) using the training set (RL) following the principles described in Section 3.1. Finally, we use the model to recognize the categories of room usage of the rooms in the test set (RT).
4.3.2. Results
We used the same performance measures, as previously, namely, Accuracy and Misclassification. In Experiment 2, our classifier achieved an overall accuracy of 58.5%, and 41.5% of the testing rooms were classified wrongly. Although this performance is much worse than in Experiment 1, the results could be reasonably expected, as the differences in spatial layout of these room categories are much more nuanced and can easily confuse the classifier. To understand the particular subcategories of rooms that caused confusion, we developed an interactive tool that allows us to inspect which rooms contributed the most to confusion. Figure 13 shows how this tool allows the user to click on a cell in the Confusion Matrix, after which the system automatically finds the rooms that contributed to the confusion and shows them on the right-hand side. We use this interactive tool to inspect the confusion among subcategories. After a closer examination of the confusion matrix and the rooms associated with classification errors (Figure 13), we found that the errors were far from random. In particular, we developed the following insights.
- Finding 4.
- Shared offices (OF1) and individual reception offices (OF21) are quite distinct in terms of spatial layout; 84% of OF1 instances were correctly classified, and only 16% of them were misclassified as Lounge1 or OF21.
- Finding 5.
- Individual offices (OF22) including more than one chair can easily be confused with reception offices (OF21) or shared offices (OF1). In our experiment, all OF21 test samples were correctly classified (100%), which is amazingly surprising. Before the experiment, we anticipated that the OF21 rooms would be confused with the OF1 rooms, as they all have multiple tables and chairs. However, this experiment showed that their spatial layouts have different regular features.
- Finding 6.
- Small conference rooms (CON2) are likely to be confused with shared offices (OF1), as evidenced by all CON2 testing samples being misclassified as OF1 (100%). While only 50% of the CON1 (large conference room) samples were misclassified as OF1, OF1 rooms were rarely misclassified as other types. This is again the effect of the imbalance of the training sample, that is, more training samples in the OF1 class.
- Finding 7.
- Lounge rooms (Lounge1) could be confused with small meeting rooms (CON2) or shared offices (OF1). In Figure 13, it can be seen that 33% of the lounge rooms were misclassified as CON2 and another 33% were misclassified as OF1. After checking the original point cloud data, we confirmed that these three subcategories of rooms are indeed very confusing even for humans. Lounge rooms tend to have chairs and tables placed more randomly in relation to each other and to walls, making it hard to learn the common features of their spatial layout.
These findings show both the strengths and weaknesses of our method. For rooms that have clear patterns in terms of their furniture configurations, such as large conference rooms and shared offices, our method works extremely well. On the contrary, for rooms with ad hoc furniture patterns or few furniture objects, such as storage rooms and lounges, our classifier encounters difficulties.
4.4. Experiment 3: Room Use Classification Using Point Cloud Data without Semantic Labels
As described in Section 3.1, our proposed classifier assumes that the point sets of room scenes have been semantically labeled with room object classes. In reality, most point cloud data are not semantically labeled. This raises the question of what happens in the case of a dataset in which the point sets are not semantically labeled; while the S3DIS dataset used human annotators to label 3D points into thirteen semantic object categories, the process is very costly. An alternative would be to derive semantically labeled point clouds (SLPC) computationally. This option is illustrated in Figure 2 in . There exist many semantic segmentation algorithms that can automatically generate object class labels for each 3D point [26,44].
To explore the extent of this possibility and related performance changes, we extended the room usage classifier to include a front phase of semantic segmentation; see Figure 14. In this experiment, we implemented Box (semantic segmentation) using the PointNet++ algorithm [30], which takes point cloud room scenes and generates semantically labeled point cloud representation of rooms. Qi et al. [30] reported that PointNet++ achieved an overall accuracy of 90% + in segmenting structural objects (walls, ceilings, floors), although they only achieved accuracy of 70% in furniture objects when tested in S3DIS data. This level of imperfection in point-level semantic labels is likely to result in degraded room classification performance when used as input to our room classifier; the question then becomes whether our method is robust enough on point cloud data with poor quality semantic labels.
To answer the above question, we experimented with this extended room classifier using the same training set (RL) and testing set (RT) as in Experiment 1. We first trained a semantic segmentation model based on the PointNet++ framework and used the model to generate the semantic labels for the point clouds of rooms in the testing set (RT). The resulting SLPC data were then fed into the Room Usage Classifier for room classification, achieving an accuracy of 71% on Schema 1 categories (Figure 4. This is a significant drop from an accuracy of 91.8% achieved in Experiment 1 (Figure 10); however, it is quite promising considering that the entire process shown in Figure 14 was fully automated.
- Finding 8.
- Despite the low semantic segmentation accuracy when generating point-level semantic labels for furniture objects, our proposed room usage classification method achieved an overall accuracy of 71% on the top-level room categories. This suggests that our method remains quite robust even when the input data are of less than optimal quality.
5. Discussion and Conclusions
In this paper, we have described a room classification method to generate semantic labels for rooms in public buildings. The proposed method is based on the hypothesis that the placement of fixtures, furniture, and their spatial arrangement in a room is purposefully designed to support certain types of human activity. Based on this principle, we have adopted a multiscale feature learning architecture to extract the configuration features of room objects that have predictive power with regard to room usage. We conducted three experiments to assess the capacity of our method to generate room usage labels and compared their performance with human-generated ground truth. Based on the interpretation of the results, we report eight findings that answer our three research questions with positive evidence. All of our findings are consistent with the hypothesis that the spatial configuration of room objects offers strong clues about the intended use of rooms. Our method works extremely well in classifying offices and conference rooms, where furniture objects have relatively clear abundance and exhibit clear patterns in their layout. In contrast, our method performs poorly in classifying storage rooms, bathrooms, and hallways due to their lack of spatial configuration patterns. Overall, the results of this study suggest that the use of information about the spatial configuration of room objects for room classification tasks is a fruitful direction that deserves further exploration.
Our method has multiple design parameters that are currently optimized for classifying rooms in office buildings in the S3DIS data set. Thus, the choice of these parameter values may need to be reconsidered when applying this method to other types of buildings and room types. For example, our deep learning architecture has multiple search radii that determine the size of local regions for local feature extraction. The current search radii are (0.4 m, 0.6 m, 0,8 m, 1.0 m, 1.2 m,1.4 m, 1.6 m, 1.8 m, 2.0 m, 2.2 m); in practice, these should be adjusted according to room sizes, point densities, and types of furniture objects being considered.
Room classification tasks for tagging automated generation of room usage semantics is an important research goal in 3D indoor modeling and social robotics. In contrast to the existing work reviewed in Section 2, in this paper we have focused on classifying rooms in office buildings for the purpose of building 3D indoor models. Our method goes beyond previous work in three aspects:
- Our classifier directly operates on point cloud data, and can detect relevant scene features without the need for complex human effort in feature construction.
- Our method can classify furnished rooms that are in use (rather than BIM models) and takes advantage of the additional information available from the way furniture objects are laid out and configured in relation to each other and to structural elements.
- Our method recognizes that human conceptions of room usage are hierarchically organized; thus, it is not adequate to classify rooms only by top-level categories. For example, previous work has treated “offices” as one room function category; however, offices in an office building can have many subcategories, for example, reception rooms, single occupancy offices, multioccupancy offices, etc. The results of our Experiment 2 show that the proposed classifier can differentiate between “multi-occupancy offices” and “single-occupancy offices” with 84% accuracy.
Despite the promise of our method, the experiments reported in this paper indicate a number of limitations that affect the confidence of our findings.
- The data samples used to train the room classifiers were too small for most categories other than offices.
- The data samples used to train the room classifiers were highly imbalanced, increasing the risk of biased conclusions.
- The semantic labels on the point clouds in the S3DIS dataset were of low quality. During our visual inspection and coding of the 224 rooms, we found many errors in the human-generated labels. In particular, a large portion (~20%) of the point clouds were labeled as “clutter”, which are in fact meaningful objects. These issues affect the amount of information available in the point-cloud representation of room scenes.
- Our method is computationally very intensive and costly. It takes many hours of computation on a GPU-equipped machine to complete the training of a room classifier. Although this could be accelerated by incorporation of pre-trained models, it remains challenging for time-sensitive environments.
In our future work, we intend to refine the deep learning architecture and parameter settings of the proposed classifier to improve the chance of discovering signature features of the spatial layout of the room relevant to their functions. In particular, the choice of MLP layers, the radius values, and the method of feature pooling in the computational architecture (see Figure 2) need to be further explored to inform the implementation. Much more extensive testing of our method is needed using a wider variety of indoor environments (residential, commercial, office buildings, public buildings, etc.); however, we expect that the low availability of semantically labeled large indoor point-cloud datasets will continue to be a bottleneck in the foreseeable future.
Author Contributions
Conceptualization, Guoray Cai; data curation, Yimu Pan; funding acquisition, Guoray Cai; methodology, Guoray Cai and Yimu Pan; software, Yimu Pan; supervision, Guoray Cai; visualization, Yimu Pan; writing—original draft, Guoray Cai. All authors have read and agreed to the published version of the manuscript.
Funding
This research received no external funding.
Data Availability Statement
The 3D indoor point cloud data used in this paper can be requested from S3DIS project website (http://buildingparser.stanford.edu/dataset.html, accessed on 31 July 2023). This work generated several datasets (including human coding of room categories and room classification results from the three experiments), which can be downloaded from https://github.com/gxc26/RoomClassifier, accessed on 31 July 2023.
Acknowledgments
We acknowledge the support of a research seed grant from the College of Information Sciences and Technology, Penn State University.
Conflicts of Interest
The authors declare no conflict of interest.
References
- Zlatanova, S.; Isikdag, U. 3D Indoor Models and Their Applications. In Encyclopedia of GIS; Springer: Berlin/Heidelberg, Germany, 2017. [Google Scholar]
- Afyouni, I.; Ray, C.; Claramunt, C. Spatial models for context-aware indoor navigation systems: A survey. J. Spat. Inf. Sci. 2012, 4, 85–123. [Google Scholar] [CrossRef]
- Kang, Z.; Yang, J.; Yang, Z.; Cheng, S. A review of techniques for 3D reconstruction of indoor environments. ISPRS Int. J. Geo-Inf. 2020, 9, 330. [Google Scholar] [CrossRef]
- Naseer, M.; Khan, S.; Porikli, F. Indoor Scene Understanding in 2.5/3D for Autonomous Agents: A Survey. IEEE Access 2019, 7, 1859–1887. [Google Scholar] [CrossRef]
- Lin, Z.; Xu, Z.; Hu, D.; Hu, Q.; Li, W. Hybrid spatial data model for indoor space: Combined topology and grid. ISPRS Int. J. Geo-Inf. 2017, 6, 343. [Google Scholar] [CrossRef]
- Chen, J.; Clarke, K.C. Indoor cartography. Cartogr. Geogr. Inf. Sci. 2020, 47, 95–109. [Google Scholar] [CrossRef]
- Ryu, M.W.; Oh, S.M.; Kim, M.J.; Cho, H.H.; Son, C.B.; Kim, T.H. Algorithm for generating 3d geometric representation based on indoor point cloud data. Appl. Sci. 2020, 10, 8073. [Google Scholar] [CrossRef]
- Ikehata, S.; Yang, H.; Furukawa, Y. Structured indoor modeling. In Proceedings of the IEEE International Conference on Computer Vision, Santiago, Chile, 7–13 December 2015; pp. 1323–1331. [Google Scholar]
- Pintore, G.; Mura, C.; Ganovelli, F.; Fuentes-Perez, L.; Pajarola, R.; Gobbetti, E. State-of-the-art in Automatic 3D Reconstruction of Structured Indoor Environments. Comput. Graph. Forum 2020, 39, 667–699. [Google Scholar] [CrossRef]
- Armeni, I.; Sener, O.; Zamir, A.R.; Jiang, H.; Brilakis, I.; Fischer, M.; Savarese, S. 3D semantic parsing of large-scale indoor spaces. In Proceedings of the IEEE Computer Society Conference on Computer Vision and Pattern Recognition, Las Vegas, NV, USA, 27–30 June 2016; pp. 1534–1543. [Google Scholar]
- Poux, F.; Hallot, P.; Neuville, R.; Billen, R. Smart Point Cloud: Definition and Remaining Challenges. ISPRS Ann. Photogramm. Remote Sens. Spat. Inf. Sci. 2016, 4, 119–127. [Google Scholar] [CrossRef]
- Kang, H.K.; Li, K.J. A standard indoor spatial data model—OGC IndoorGML and implementation approaches. ISPRS Int. J. Geo-Inf. 2017, 6, 116. [Google Scholar] [CrossRef]
- Richter, K.F.; Winter, S.; Santosa, S. Hierarchical representations of indoor spaces. Environ. Plan. B Plan. Des. 2011, 38, 1052–1070. [Google Scholar] [CrossRef]
- Bloch, T.; Sacks, R. Comparing machine learning and rule-based inferencing for semantic enrichment of BIM models. Autom. Constr. 2018, 91, 256–272. [Google Scholar] [CrossRef]
- Macher, H.; Landes, T.; Grussenmeyer, P. From point clouds to building information models: 3D semi-automatic reconstruction of indoors of existing buildings. Appl. Sci. 2017, 7, 1030. [Google Scholar] [CrossRef]
- Mahdi, H.; Akgun, S.A.; Saleh, S.; Dautenhahn, K. A survey on the design and evolution of social robots—Past, present and future. Robot. Auton. Syst. 2022, 156, 104193. [Google Scholar] [CrossRef]
- Hu, X.; Fan, H.; Noskov, A.; Zipf, A.; Wang, Z.; Shang, J. Feasibility of using grammars to infer room semantics. Remote Sens. 2019, 11, 1535. [Google Scholar] [CrossRef]
- Hu, X.; Fan, H.; Noskov, A.; Wang, Z.; Zipf, A.; Gu, F.; Shang, J. Room semantics inference using random forest and relational graph convolutional networks: A case study of research building. Trans. GIS 2021, 25, 71–111. [Google Scholar] [CrossRef]
- Pronobis, A.; Jensfelt, P. Large-scale semantic mapping and reasoning with heterogeneous modalities. In Proceedings of the IEEE International Conference on Robotics and Automation, St. Paul, MI, USA, 14–18 May 2012; pp. 3515–3522. [Google Scholar]
- Othman, K.M.; Rad, A.B. An indoor room classification system for social robots via integration of CNN and ECOC. Appl. Sci. 2019, 9, 470. [Google Scholar] [CrossRef]
- Uršič, P.; Tabernik, D.; Boben, M.; Skočaj, D.; Leonardis, A.; Kristan, M. Room categorization based on a hierarchical representation of space. Int. J. Adv. Robot. Syst. 2013, 10, 94. [Google Scholar] [CrossRef]
- Yazdansepas, I.; Houshangi, N. Room Categorization utilizing Convolutional Neural Network on 2D map obtained by LiDAR. In Proceedings of the IEEE International Conference on Electro Information Technology, Romeoville, IL, USA, 18–20 May 2023; pp. 236–241. [Google Scholar]
- Zou, C.; Colburn, A.; Shan, Q.; Hoiem, D. LayoutNet: Reconstructing the 3D Room Layout from a Single RGB Image. In Proceedings of the IEEE Computer Society Conference on Computer Vision and Pattern Recognition, Salt Lake City, UT, USA, 18–22 June 2018; pp. 2051–2059. [Google Scholar]
- Zhang, J.; Kan, C.; Schwing, A.G.; Urtasun, R. Estimating the 3D layout of indoor scenes and its clutter from depth sensors. In Proceedings of the IEEE International Conference on Computer Vision, Sydney, Australia, 1–8 December 2013; pp. 1273–1280. [Google Scholar]
- Choi, W.; Chao, Y.W.; Pantofaru, C.; Savarese, S. Indoor Scene Understanding with Geometric and Semantic Contexts. Int. J. Comput. Vis. 2015, 112, 204–220. [Google Scholar] [CrossRef]
- Guo, Y.; Wang, H.; Hu, Q.; Liu, H.; Liu, L.; Bennamoun, M. Deep Learning for 3D Point Clouds: A Survey. IEEE Trans. Pattern Anal. Mach. Intell. 2020, 42, 1–24. [Google Scholar] [CrossRef]
- Ioannidou, A.; Chatzilari, E.; Nikolopoulos, S.; Kompatsiaris, I. Deep learning advances in computer vision with 3D data: A survey. ACM Comput. Surv. 2017, 50, 1–38. [Google Scholar] [CrossRef]
- Shi, W.; Ahmed, W.; Li, N.; Fan, W.; Xiang, H.; Wang, M. Semantic geometric modelling of unstructured indoor point cloud. ISPRS Int. J. Geo-Inf. 2019, 8, 9. [Google Scholar] [CrossRef]
- Qi, C.R.; Su, H.; Mo, K.; Guibas, L.J. PointNet: Deep learning on point sets for 3D classification and segmentation. In Proceedings of the 30th IEEE Conference on Computer Vision and Pattern Recognition, CVPR 2017, Honolulu, HI, USA, 21–26 July 2017; pp. 77–85. [Google Scholar]
- Qi, C.R.; Yi, L.; Su, H.; Guibas, L.J. Pointnet++: Deep hierarchical feature learning on point sets in a metric space. Adv. Neural Inf. Process. Syst. 2017, 30, 5099–5108. [Google Scholar]
- Hu, X.; Fan, H.; Zipf, A.; Shang, J.; Gu, F. A conceptual framework for indoor mapping by using grammars. ISPRS Ann. Photogramm. Remote Sens. Spat. Inf. Sci. 2017, 4, 335–342. [Google Scholar] [CrossRef]
- Hu, Q.; Yang, B.; Xie, L.; Rosa, S.; Guo, Y.; Wang, Z.; Trigoni, N.; Markham, A. RandLA-Net: Efficient Semantic Segmentation of Large-Scale Point Clouds. In Proceedings of the IEEE Conference on Computer Vision and Pattern Recognition (CVPR Oral), Seattle, WA, USA, 13–19 June 2020. [Google Scholar]
- Singh, A.; Raj, K.; Kumar, T.; Verma, S.; Roy, A.M. Deep Learning-Based Cost-Effective and Responsive Robot for Autism Treatment. Drones 2023, 7, 81. [Google Scholar] [CrossRef]
- Swadzba, A.; Wachsmuth, S. Indoor Scene Classification Using Combined 3D and GIST Features. In Proceedings of the ACCV 2010 10th Asian Conference on Computer Vision, Queenstown, New Zealand, 8–12 November 2010; Volume 6493, pp. 201–215. [Google Scholar]
- Mozos, O.M.; Mizutani, H.; Kurazume, R.; Hasegawa, T. Categorization of indoor places using the Kinect sensor. Sensors 2012, 12, 6695–6711. [Google Scholar] [CrossRef] [PubMed]
- Goeddel, R.; Olson, E. Learning semantic place labels from occupancy grids using CNNs. In Proceedings of the IEEE International Conference on Intelligent Robots and Systems, Daejeon, Republic of Korea, 9–14 October 2016; pp. 3999–4004. [Google Scholar]
- Zhao, J.; Zhang, X.; Wang, Y. Indoor 3D point clouds semantics segmentation base on the modified PointNet network. Int. Arch. Photogramm. Remote Sens. Spat. Inf. Sci. ISPRS Arch. 2020, 43, 369–373. [Google Scholar] [CrossRef]
- Yao, X.; Guo, J.; Hu, J.; Cao, Q. Using deep learning in semantic classification for point cloud data. IEEE Access 2019, 7, 37121–37130. [Google Scholar] [CrossRef]
- Malinverni, E.S.; Pierdicca, R.; Paolanti, M.; Martini, M.; Morbidoni, C.; Matrone, F.; Lingua, A. Deep Learning for Semantic Segmentation of 3D Point Cloud. Int. Arch. Photogramm. Remote Sens. Spat. Inf. Sci. Isprs Arch. 2019, 42, 735–742. [Google Scholar] [CrossRef]
- Cai, G.; Pan, Y. Learning Functional Properties of Rooms in Indoor Space from Point Cloud Data: A Deep Learning Approach. In Proceedings of the SIGSPATIAL ‘21, ACM International Symposium on Advances in Geographic Information Systems, New York, NY, USA, 2–5 November 2021; pp. 350–353. [Google Scholar]
- Aminoff, E.M.; Kveraga, K.; Bar, M. The role of the parahippocampal cortex in cognition. Trends Cogn. Sci. 2013, 17, 379–390. [Google Scholar] [CrossRef]
- Bilalić, M.; Lindig, T.; Turella, L. Parsing rooms: The role of the PPA and RSC in perceiving object relations and spatial layout. Brain Struct. Funct. 2019, 224, 2505–2524. [Google Scholar] [CrossRef]
- Kaur, H.; Pannu, H.S.; Malhi, A.K. A systematic review on imbalanced data challenges in machine learning: Applications and solutions. ACM Comput. Surv. 2019, 52, 1–36. [Google Scholar] [CrossRef]
- Liang, X.; Fu, Z. MHNet: Multiscale Hierarchical Network for 3D Point Cloud Semantic Segmentation. IEEE Access 2019, 7, 173999–174012. [Google Scholar] [CrossRef]
- Ismail, A.S.; Seifelnasr, M.M.; Guo, H. Understanding indoor scene: Spatial layout estimation, scene classification, and object detection. In Proceedings of the ICMSSP’18: 3rd International Conference on Multimedia Systems and Signal Processing, Shenzhen, China, 28–30 April 2018; pp. 64–70. [Google Scholar]
Figure 1.
Example of a room scene with furniture objects.

Figure 2.
From point cloud representation to inferred room usage categories.

Figure 3.
Architecture of the room usage classifier.

Figure 4.
Schema 1: six categories of room usage.

Figure 5.
Schema 2: room usage categories and subcategories.
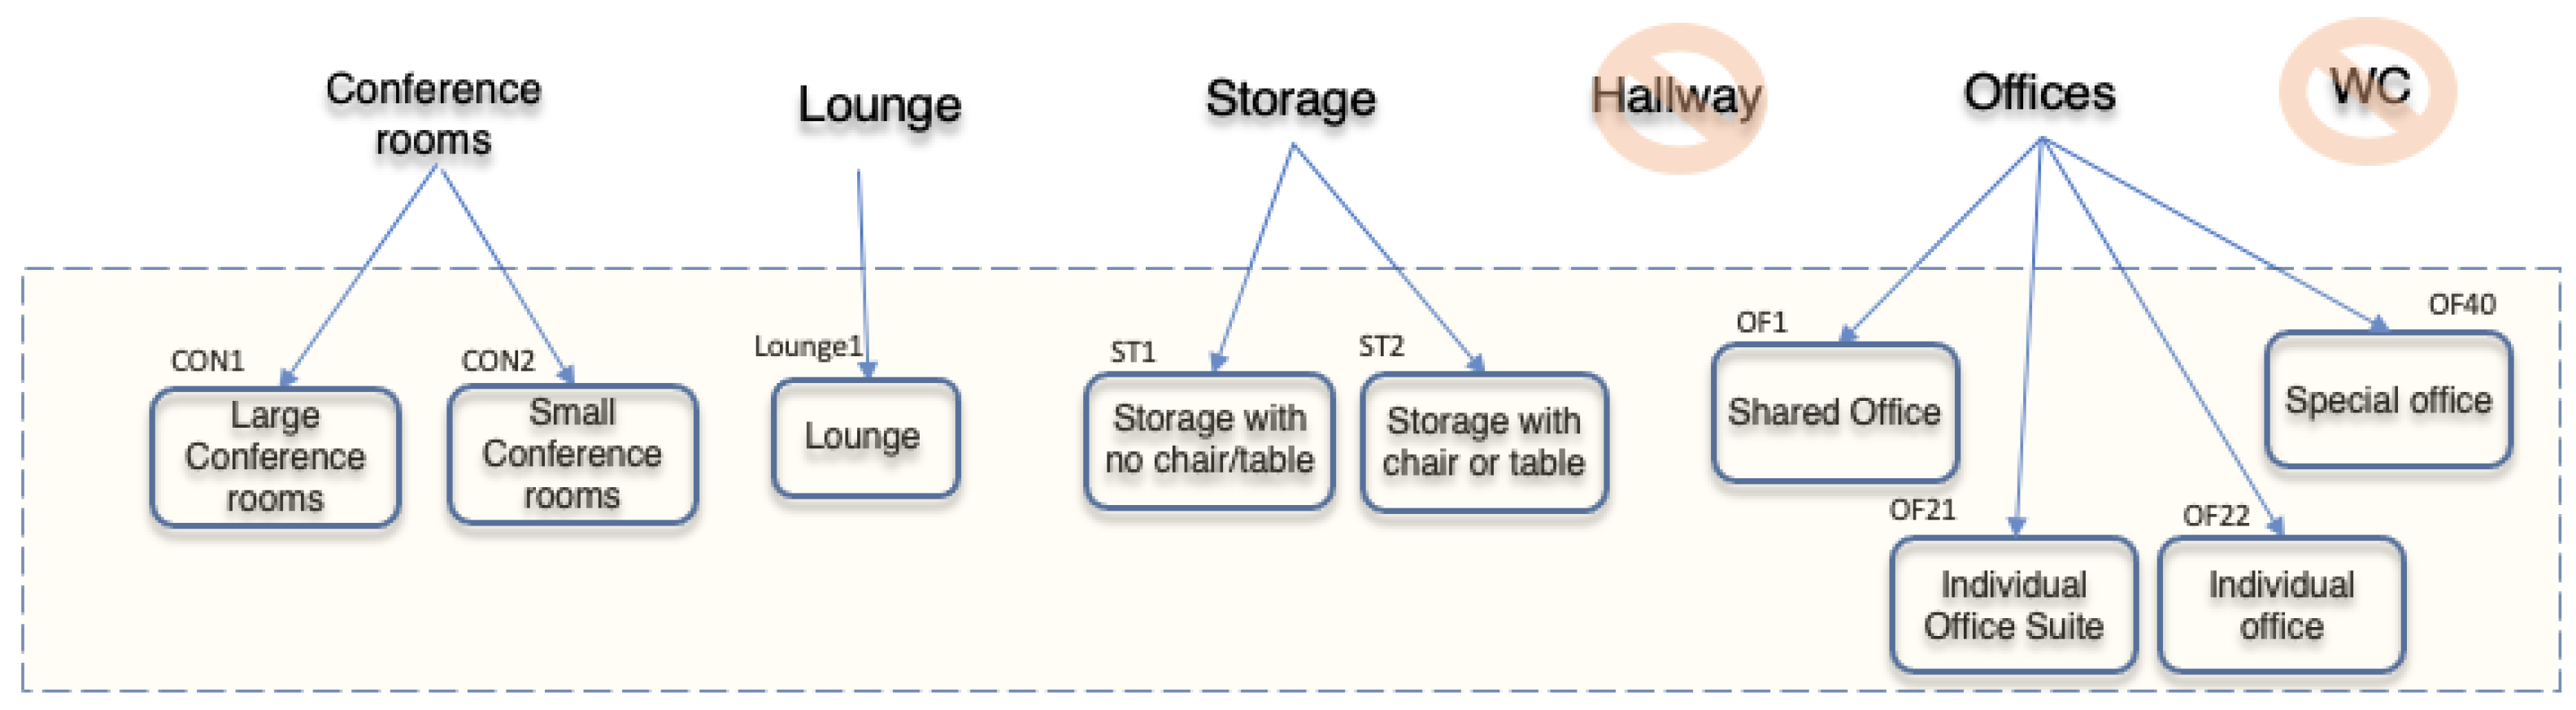
Figure 6.
Room usage categories and their hierarchical relationships.

Figure 7.
Six areas in the (S3DIS) Dataset.

Figure 8.
A room scene in the S3DIS Dataset.

Figure 9.
Number of rooms by category.

Figure 10.
Performance of the proposed room usage classifier using Schema 1: Accuracy, 91.8%; Misclassification, 8.2%.
Figure 10.
Performance of the proposed room usage classifier using Schema 1: Accuracy, 91.8%; Misclassification, 8.2%.

Figure 11.
Number of rooms by subcategories in Schema 2.

Figure 12.
Human interpretation of room spatial configurations.

Figure 13.
Performance of the proposed room function classifier on Schema 2: Overall Accuracy, 58.5%; Misclassification, 41.5%.
Figure 13.
Performance of the proposed room function classifier on Schema 2: Overall Accuracy, 58.5%; Misclassification, 41.5%.

Figure 14.
Extended room usage classifier.

Disclaimer/Publisher’s Note: The statements, opinions and data contained in all publications are solely those of the individual author(s) and contributor(s) and not of MDPI and/or the editor(s). MDPI and/or the editor(s) disclaim responsibility for any injury to people or property resulting from any ideas, methods, instructions or products referred to in the content. |
© 2023 by the authors. Licensee MDPI, Basel, Switzerland. This article is an open access article distributed under the terms and conditions of the Creative Commons Attribution (CC BY) license (https://creativecommons.org/licenses/by/4.0/).
Share and Cite
MDPI and ACS Style
Cai, G.; Pan, Y. Automated Generation of Room Usage Semantics from Point Cloud Data. ISPRS Int. J. Geo-Inf. 2023, 12, 427. https://doi.org/10.3390/ijgi12100427
AMA Style
Cai G, Pan Y. Automated Generation of Room Usage Semantics from Point Cloud Data. ISPRS International Journal of Geo-Information. 2023; 12(10):427. https://doi.org/10.3390/ijgi12100427
Chicago/Turabian StyleCai, Guoray, and Yimu Pan. 2023. "Automated Generation of Room Usage Semantics from Point Cloud Data" ISPRS International Journal of Geo-Information 12, no. 10: 427. https://doi.org/10.3390/ijgi12100427
Note that from the first issue of 2016, this journal uses article numbers instead of page numbers. See further details here.