Article

Analysis of Spatiotemporal Dynamics of Land Desertification in Qilian Mountain National Park Based on Google Earth Engine

1
College of Earth and Environmental Sciences, Lanzhou University, Lanzhou 730030, China
2
Center for Glacier and Desert Research, Lanzhou University, Lanzhou 730030, China
3
Scientific Observing Station for Desert and Glacier, Lanzhou University, Lanzhou 730030, China
*
Author to whom correspondence should be addressed.
ISPRS Int. J. Geo-Inf. 2024, 13(4), 117; https://doi.org/10.3390/ijgi13040117
Submission received: 21 February 2024 / Revised: 26 March 2024 / Accepted: 30 March 2024 / Published: 1 April 2024

Abstract

:
Notwithstanding the overall improvement in the ecological condition of the Qilian Mountains, there are localized occurrences of grassland degradation, desertification, and salinization. Moreover, timely and accurate acquisition of desertification information is a fundamental prerequisite for effective monitoring and prevention of desertification. Leveraging the Google Earth Engine (GEE) platform in conjunction with machine learning techniques, this study aims to identify and extract the spatiotemporal dynamics of desertification in the Qilian Mountain National Park (QMNP) and its surroundings (QMNPs) spanning from 1988 to 2023. Results show that based on the random forest algorithm, the multi-index inversion methodology achieves a commendable overall accuracy of 91.9% in desertification extraction. From 1988 to 2023, the gravity center of light desertification shifts southeastward, while centers characterized by moderate, severe, and extremely severe desertification display a westward retreat with fluctuations. The area of sandy land shows an expansion trend in the medium term, but after 2018, desertification in QMNPs reversed. As of 2023, the sandy land area measured 16,897.35 km2, accounting for 18.29% of the total area of QMNPs. The insights garnered from this study provide a valuable reference for regional desertification prevention and control in the future.

1. Introduction

Desertification is one of the main forms of land degradation and mainly occurs in arid, semi-arid, and partially semi-humid areas [1]. Desertification is defined as land degradation caused by the uncoordinated relationship between humans and land, which is mainly marked by wind and sand activities [2]. China is among the countries most severely affected by desertification, in which desertification land is mainly distributed in the northwest, north, and northeast regions. The results of the Sixth National Desertification and Desertification Investigation in China show that as of 2019, the total area of sandy land reached 168.78 million hectares, accounting for 17.58% of the land area; the land area with obvious desertification trends is 27.92 million hectares, accounting for 2.91% of the land area [3]. The decrease in land quality caused by desertification exerted considerable influence on the ecological environment and the sustainable development of human society [4,5,6,7]. The direct economic losses caused by dryland desertification in China are estimated at 33.1–94.9 × 10⁹ yuan per year [8]. Between 1980 and 2015, the area of drylands in China expanded by 8.3%. The expansion was primarily concentrated in the northeastern and southwestern regions of the Qinghai–Tibet Plateau [9].
Obtaining high-quality, reliable, and long-term desertification data, understanding the current status of desertification, monitoring its spatiotemporal dynamics, and clarifying the driving mechanisms can provide a basis for the prevention and control of the expansion of regional desertification. At present, there are many methods to obtain desertification information, including field investigation and remote sensing [10,11]. Traditional field investigation methods have high accuracy but require a great deal of time, expense, and manpower. In contrast, remote sensing technology has the advantages of convenient acquisition, wide spatial coverage, and low cost, and has been widely used in spatiotemporal dynamic monitoring of regional desertification [12,13,14]. Research utilizing satellite imagery for studying desertification has primarily focused on the causes of desertification, spatial patterns, evolutionary processes, prevention and control measures, and vulnerability assessment [15,16,17], among which dynamic monitoring of desertification serves as the foundation for other studies. Among numerous remote sensing data sources, medium-resolution remote sensing imagery such as Landsat data can both capture detailed changes in desertification processes and fulfill the requirements for long time-series dynamic monitoring. Machine learning algorithms offer the capability to establish a relational model between individual indicator factors and desertification information, capture nonlinear relationships between them, and then yield a desertification evaluation model with enhanced generalization ability [18]. In the study by Meng et al. [19], six machine learning methods were employed to categorize the degree of desertification in Mongolia, with the maximum entropy model demonstrating the highest accuracy. Similarly, Zhan et al. [20] utilized a hybrid approach, integrating decision trees and nearest neighbors to extract spatiotemporal dynamics of desertification along the Brahmaputra River.
Several studies applied vegetation indicators, such as NDVI, NPP, and FVC, for long-term series remote sensing monitoring [21,22]. However, desertification stems from multiple factors, including climate, vegetation, water, soil, and human activities. Relying solely on a single indicator complicates the acquisition of comprehensive desertification characteristics and fails to fully elucidate the desertification process. Land desertification severity exhibits spatial variation [23], with its progression diverging spatially and temporally [24]. To address this complexity and heterogeneity, a common approach involves employing multiple indicators to capture various geographical factors and amalgamating their effects to analyze desertification conditions [25]. This strategy has been integrated into remote sensing-based desertification monitoring initiatives [26,27,28,29].
The advent of cloud platforms such as Google Earth Engine (GEE) [30] has significantly enhanced the processing capabilities of remote sensing datasets and facilitated timely, accurate, and efficient monitoring of land cover changes. Leveraging cloud computing-based GEE, researchers utilize functionalities for data collection, preprocessing, feature extraction, machine learning-based classification, and accuracy evaluation [31,32]. Integration of machine learning algorithms and deep learning modules has positioned this platform as one of the foremost tools for large-scale monitoring research over the past decade [33]. Currently, there is a dearth of studies focusing on harnessing the GEE platform in conjunction with machine learning methods for land desertification identification.
The Qilian Mountains, recognized as a “natural wet island” and a vital ecological security barrier in northwest China and the northern margin of the Qinghai–Tibet Plateau, serve as a crucial water source and biodiversity sanctuary in the Yellow River basin. The phenomenon of land desertification in this region not only impacts the local ecological environment and economic development but also reverberates across China’s ecological and environmental dynamics. It is imperative to monitor the dynamics of desertification, elucidate the mechanisms driving desertification changes, and discern the primary factors influencing desertification and their interplay in the Qilian Mountain National Park (QMNP) and its surroundings. Despite previous studies focusing on the Qinghai–Tibet Plateau and northern China [34,35,36], detailed investigations in the Qilian Mountains remain unexplored. The trajectory of land desertification in the Qilian Mountains over recent decades, whether it has expanded or reversed, along with the spatial differentials and temporal dynamics of desertification, currently lack clarity.
Given the above, this study fills the existing gap regarding long-term spatiotemporal land desertification changes in QMNP. Depending on the Google Earth Engine platform in conjunction with machine learning techniques, Landsat TM/OLI images are applied to examine land desertification in QMNP and its surroundings (QMNPs) spanning from 1988 to 2023. The objective is to offer guidance for the judicious utilization of desertification lands and their adjacent regions, and in turn, furnish a scientific foundation for optimal resource allocation and sustainable development.

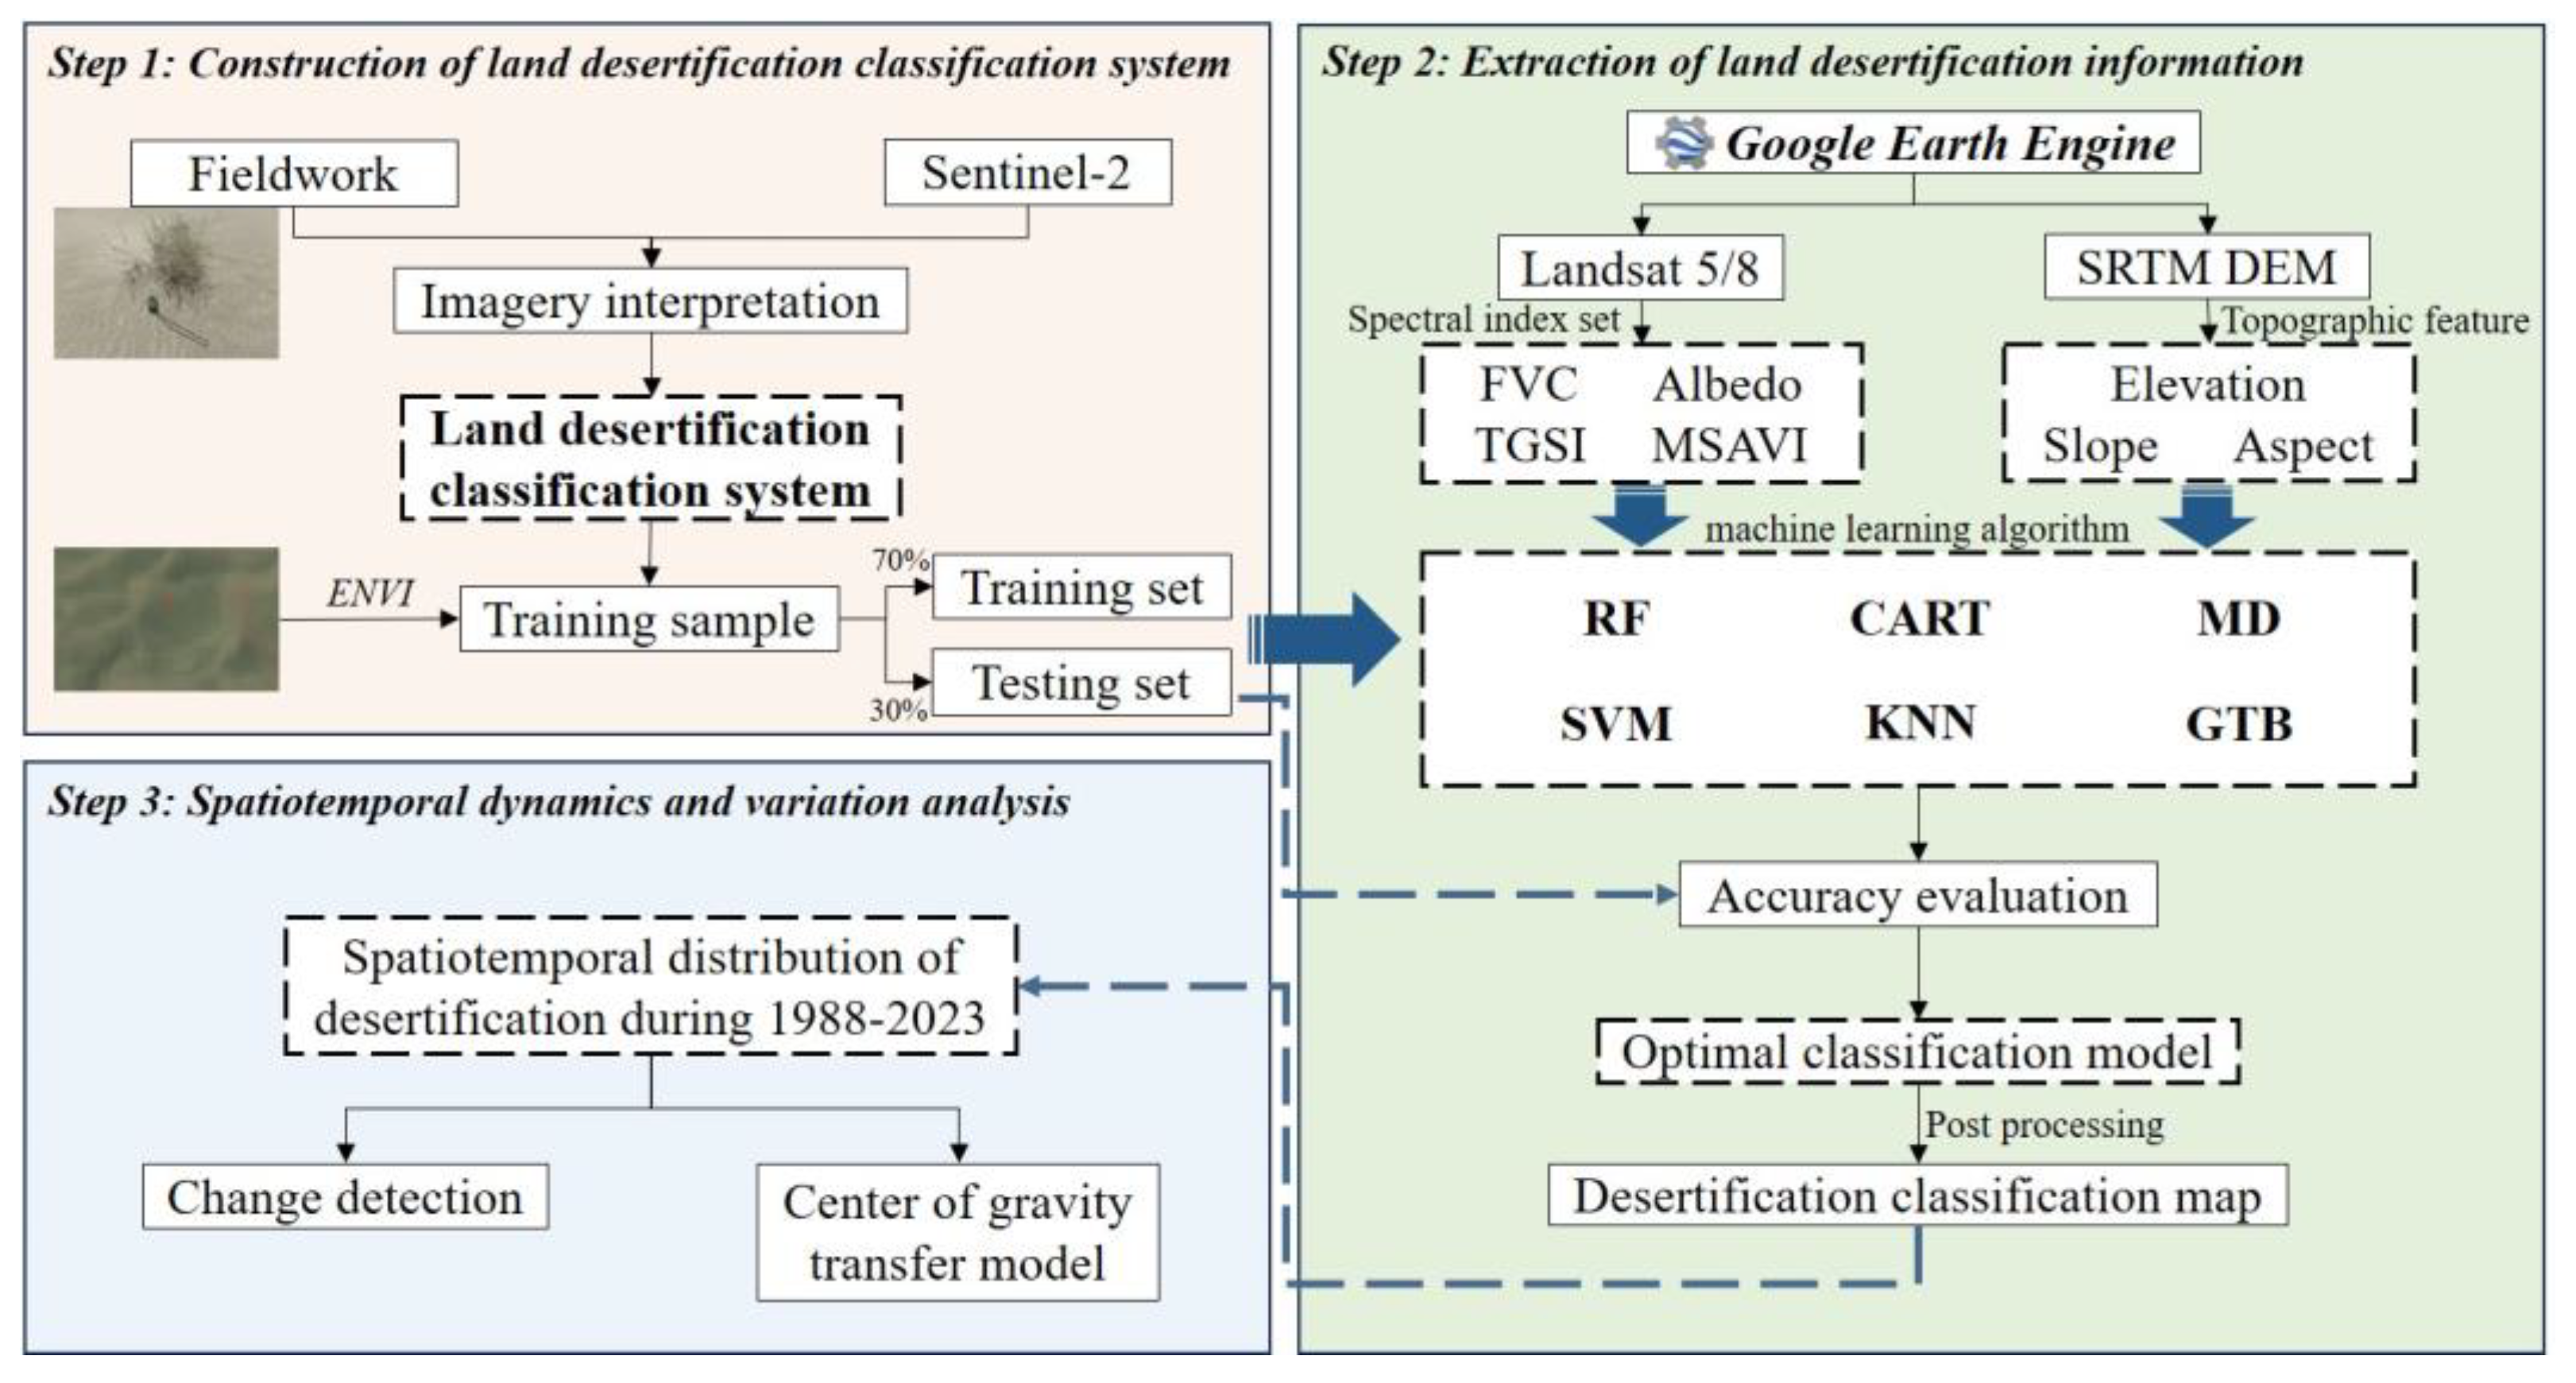
2. Materials and Methods

2.1. Study Area and Fieldwork

The QMNP, situated on the northeastern margin of the Qinghai–Tibet Plateau, is a confluence point for the Qinghai–Tibet Plateau, Mongolian Plateau, and Loess Plateau. Spanning Qinghai and Gansu provinces, the QMNP encompasses a vast area totaling 50,200 km2 with an array of mountain ranges, expansive valleys, and intermountain basins. The QMNP holds significant ecological functionality and serves as a pivotal area for biodiversity conservation in China [37]. As a semi-arid area in the northwest, the QMNP has a typical highland continental climate with a mean annual temperature of 4 °C, and mean annual precipitation of approximately 400 mm [38,39]. Modern climatology analyses pointed out that the QMNP is affected by the interplay of the Asian summer monsoon and mid-latitude westerlies [40]. The hydrological network radiates outward from the Qilian Mountains, principally comprising the Shiyang River, Heihe River, and Shule River systems, which are fed by precipitation and glacier meltwater inputs [41]. Prominent vegetation types, including alpine meadows, cold temperate coniferous forests, and temperate desert steppes, exhibit discernible zonal distributions, fostering habitats for numerous rare and endangered species such as snow leopards, white-billed sparrows, and black-necked cranes.
Our study area is delineated to encompass the QMNPs ,including both the Hala Lake and the Halten River (Figure 1), with a total area of 92,401.36 km2. Field investigations conducted by our team unveiled instances of land desertification in the study area. In August 2022, employing drones and assorted instrumentation, we meticulously documented the surface attributes of various land desertification degrees. Then, the geographical coordinates, environmental parameters, vegetation coverage, and quicksand proportions of representative sampling points were recorded. Subsequently, we established signposts for remote sensing image interpretation. A follow-up field investigation was conducted in August 2023 to validate our findings. A total of 308 sampling points were obtained, distinguishing between sandy (194) and non-sandy (114) terrain (Figure 1c). These points were strategically distributed along key geographical features such as the Danghe River, Yema River, Halten River, the eastern vicinity of Hala Lake, as well as the upper reaches of the Shule River. This comprehensive sampling strategy facilitated the assessment of the machine learning model’s classification accuracy across diverse landscape contexts.
Utilizing a combination of field investigation data, remote sensing data, and encapsulated functions offered by the GEE platform, we monitored land desertification within QMNPs. Subsequently, we conducted a thorough analysis of its spatiotemporal changes. A schematic workflow is illustrated in Figure 2, which can be divided into three parts as follows: (1) field investigation and construction of land desertification system; (2) construction of machine learning classification model and extraction of desertification information; and (3) analysis of spatiotemporal dynamics and evolution of desertification.

2.2. Remote Sensing Dataset

Utilizing the GEE platform, we acquired Sentinel-2 data from 2022 and Landsat datasets spanning five-year periods from 1988 to 2023 (Landsat 5 from 1988 to 2008 and Landsat 8 from 2013 to 2023). These datasets feature spatial resolutions of 10 m and 30 m, respectively. Notably, all images were carefully selected to correspond to the growing season, specifically June through August. To ensure data quality, a rigorous cloud masking procedure was implemented, filtering out images with cloud cover exceeding 20%. Subsequently, a median synthesis technique was applied to amalgamate remote sensing images for each designated period.

2.3. Classification System for Land Desertification

Scattered and patchy vegetation cover and sand layers are the main landscape features of grassland desertification areas, providing good visual indicators of environmental changes and desertification severity [42,43]. Referring to the “Technical code of practice on the sandified land monitoring” [44], and on-site inspections, a land desertification classification system suitable for QMNPs is constructed with vegetation coverage and quicksand ratio as the main criteria to judge the desertification status of grassland (Table 1). The degree of desertification in QMNPs is divided into five levels, namely no desertification, light desertification, moderate desertification, severe desertification, and extremely severe desertification. Among them, light desertification mainly refers to fixed sandy land with vegetation coverage of 50% or more, moderate desertification refers to fixed sandy land with vegetation coverage of 30% to 50%, and severe desertification refers to semi-fixed sandy land and semi-exposed sandy gravel land with vegetation coverage of 10% to 30%. Extremely severe desertification turns into mobile sandy land and exposed sandy gravel land with less than 10% vegetation coverage.

2.4. Extraction and Construction of Classification Feature Set

Fraction Vegetation Coverage (FVC), Topsoil Grain Size Index (TGSI), albedo, and Modified Soil Adjusted Vegetation Index (MSAVI) are chosen as key indicators to assess land desertification in QMNPs. Leveraging the Landsat dataset, these indicators were extracted and inverted to monitor desertification processes, which yields spatiotemporal series data from 1988 to 2023.
Vegetation is a critical component in the assessment of desertification. Under desertification pressures, vegetation growth experiences significant deterioration. Thus, FVC stands out as a prominent indicator for characterizing desertification conditions [45], which is calculated using the following formula:
FVC = (NDVINDVIsoil)/(NDVIvegNDVIsoil)
NDVI = (BnirBred)/(Bnir + Bred)
where NDVIsoil and NDVIveg correspond to the NDVI values representing bare land and pure vegetation coverage, respectively. Bnir is a near-infrared band of remote sensing data; Bred is a near-infrared band of remote sensing data. The values of NDVIsoil and NDVIveg will change with the image. In all years, NDVI values with cumulative probability distributions of 5% and 95% are selected to represent NDVIsoil and NDVIveg, respectively.
Surface albedo is a critical metric influencing the energy balance and variations in microclimate parameters such as temperature, aridity, and humidity within desertification-affected terrestrial environments [46,47]. Inversion of surface albedo is helpful in identifying surface changes [48], elevated surface albedo levels signify land quality degradation [49], which is typically attributed to diminished soil organic matter content and moisture levels [50]. Consequently, albedo emerges as a valuable indicator for monitoring desertification, with its calculation determined by the following formula:
Albedo = 0.356 Bblue + 0.13 Bred + 0.373 Bnir + 0.085 Bswir1 + 0.072 Bswir2 − 0.0018
where Bred, Bblue, Bnir, Bswir1, and Bswir2 are the red band, blue band, near-infrared band, swir1 band and swir2 band of remote sensing data, respectively.
Surface soil texture serves as a key indicator of land degradation severity. Zhu et al. [51] suggested that varying degrees of land desertification led to distinct surface soil textures, with more severe desertification resulting in thicker surface soil layers. TGSI is developed based on spectral reflectance analysis of soil surfaces and laboratory investigations of soil particles [52]. TGSI correlates with the thickness of fine sand composition in the surface soil, which is indicative of desertification. As desertification intensifies, the surface soil thickens. Higher TGSI values correspond to increased fine sand content in the surface soil and reduced clay content. TGSI is widely employed as a desertification evaluation indicator [53] and is calculated using the following formula:
TGSI = (BredBblue)/(Bred + Bblue + Bgreen)
where Bred, Bgreen, and Bblue are the red band, green band, and blue band of remote sensing data, respectively.
The research findings of Qi et al. [54] demonstrated that, compared with other commonly used vegetation indices, MSAVI mitigates the influence of soil background while enhancing sensitivity to vegetation. MSAVI is calculated using the following formula:
MSAVI = ( 2 B nir   + 1       ( 2 B nir + 1 ) 2     8   ( B nir     B red ) ) / 2
where Bred and Bnir are red waves and near-infrared bands of remote sensing data.
In the recognition and classification of remote sensing images, the participation of terrain features can improve the classification accuracy. Therefore, based on the SRTMGL1_003 digital elevation data product, the aspect, slope, and elevation are calculated and added to the remote sensing image as independent features.
Based on the above feature variables, two sets of feature sets are used to classify the images. When the feature variable combination is first input, only the spectral index participates in image classification (S1), and subsequently, the terrain features are introduced (S2).

2.5. Machine Learning

The classification process in GEE involves supervised learning with various machine learning algorithms. The classification algorithms used include random forest (RF), Decision Tree (CART), Support Vector Machine (SVM), Minimum Distance (MD), K Nearest Neighbor (KNN), and Gradient Boosted Decision Tree (GTB). Leveraging Sentinel-2 and Landsat 8 data from 2022, we constructed training samples and feature sets to develop classification models using the machine learning algorithms above.
Our dataset comprises a total of 3580 sample points, distributed as follows: 239 light desertification points, 253 moderate desertification points, 901 severe desertification points, 1057 extremely severe desertification points, and 1030 non-desertification points. To ensure the stability of model training and evaluation, these sample points were randomized, with 70% allocated to the training set and 30% allocated to the test set. The training set serves to train the classifier, while the test set evaluates model performance indicators. Afterward, we iteratively identify the optimal parameter settings for each algorithm to optimize classifier performance (Table 2), maximizing performance on the specific dataset. Crucially, the same set of training and test samples is used for each algorithm to facilitate reliable comparison of performance across different methods. This rigorous approach ensures the integrity and validity of our classification results.
The evaluation of model classification accuracy is achieved in two ways. On the one hand, the overall accuracy (OA), Kappa coefficient (Kappa), and Macro F1 score of model classification are calculated based on the confusion matrix (Table 3). These quantitative evaluation indicators can intuitively reflect the accuracy of model classification. On the other hand, field investigation ground verification points are used to verify the classification results and further compare their reliability.

2.6. Center of Gravity Migration Model

The center of gravity change model is used to measure the spatial distribution of desertification of varying degrees in the QMNPs, and the changes in distance and direction of the center of gravity are analyzed. The calculation formula of the center of gravity change model is as follows:
X = i = 1 n X i W i i = 1 n W i
Y k = i = 1 n Y i W i i = 1 n W i  
where Xk and Yk are the coordinates of the weighted center of gravity of the kth desertification level; Xi and Yi are the coordinates of element i; n is the total number of elements; and Wi is the weight of element i, represented by the area of element i.

3. Results

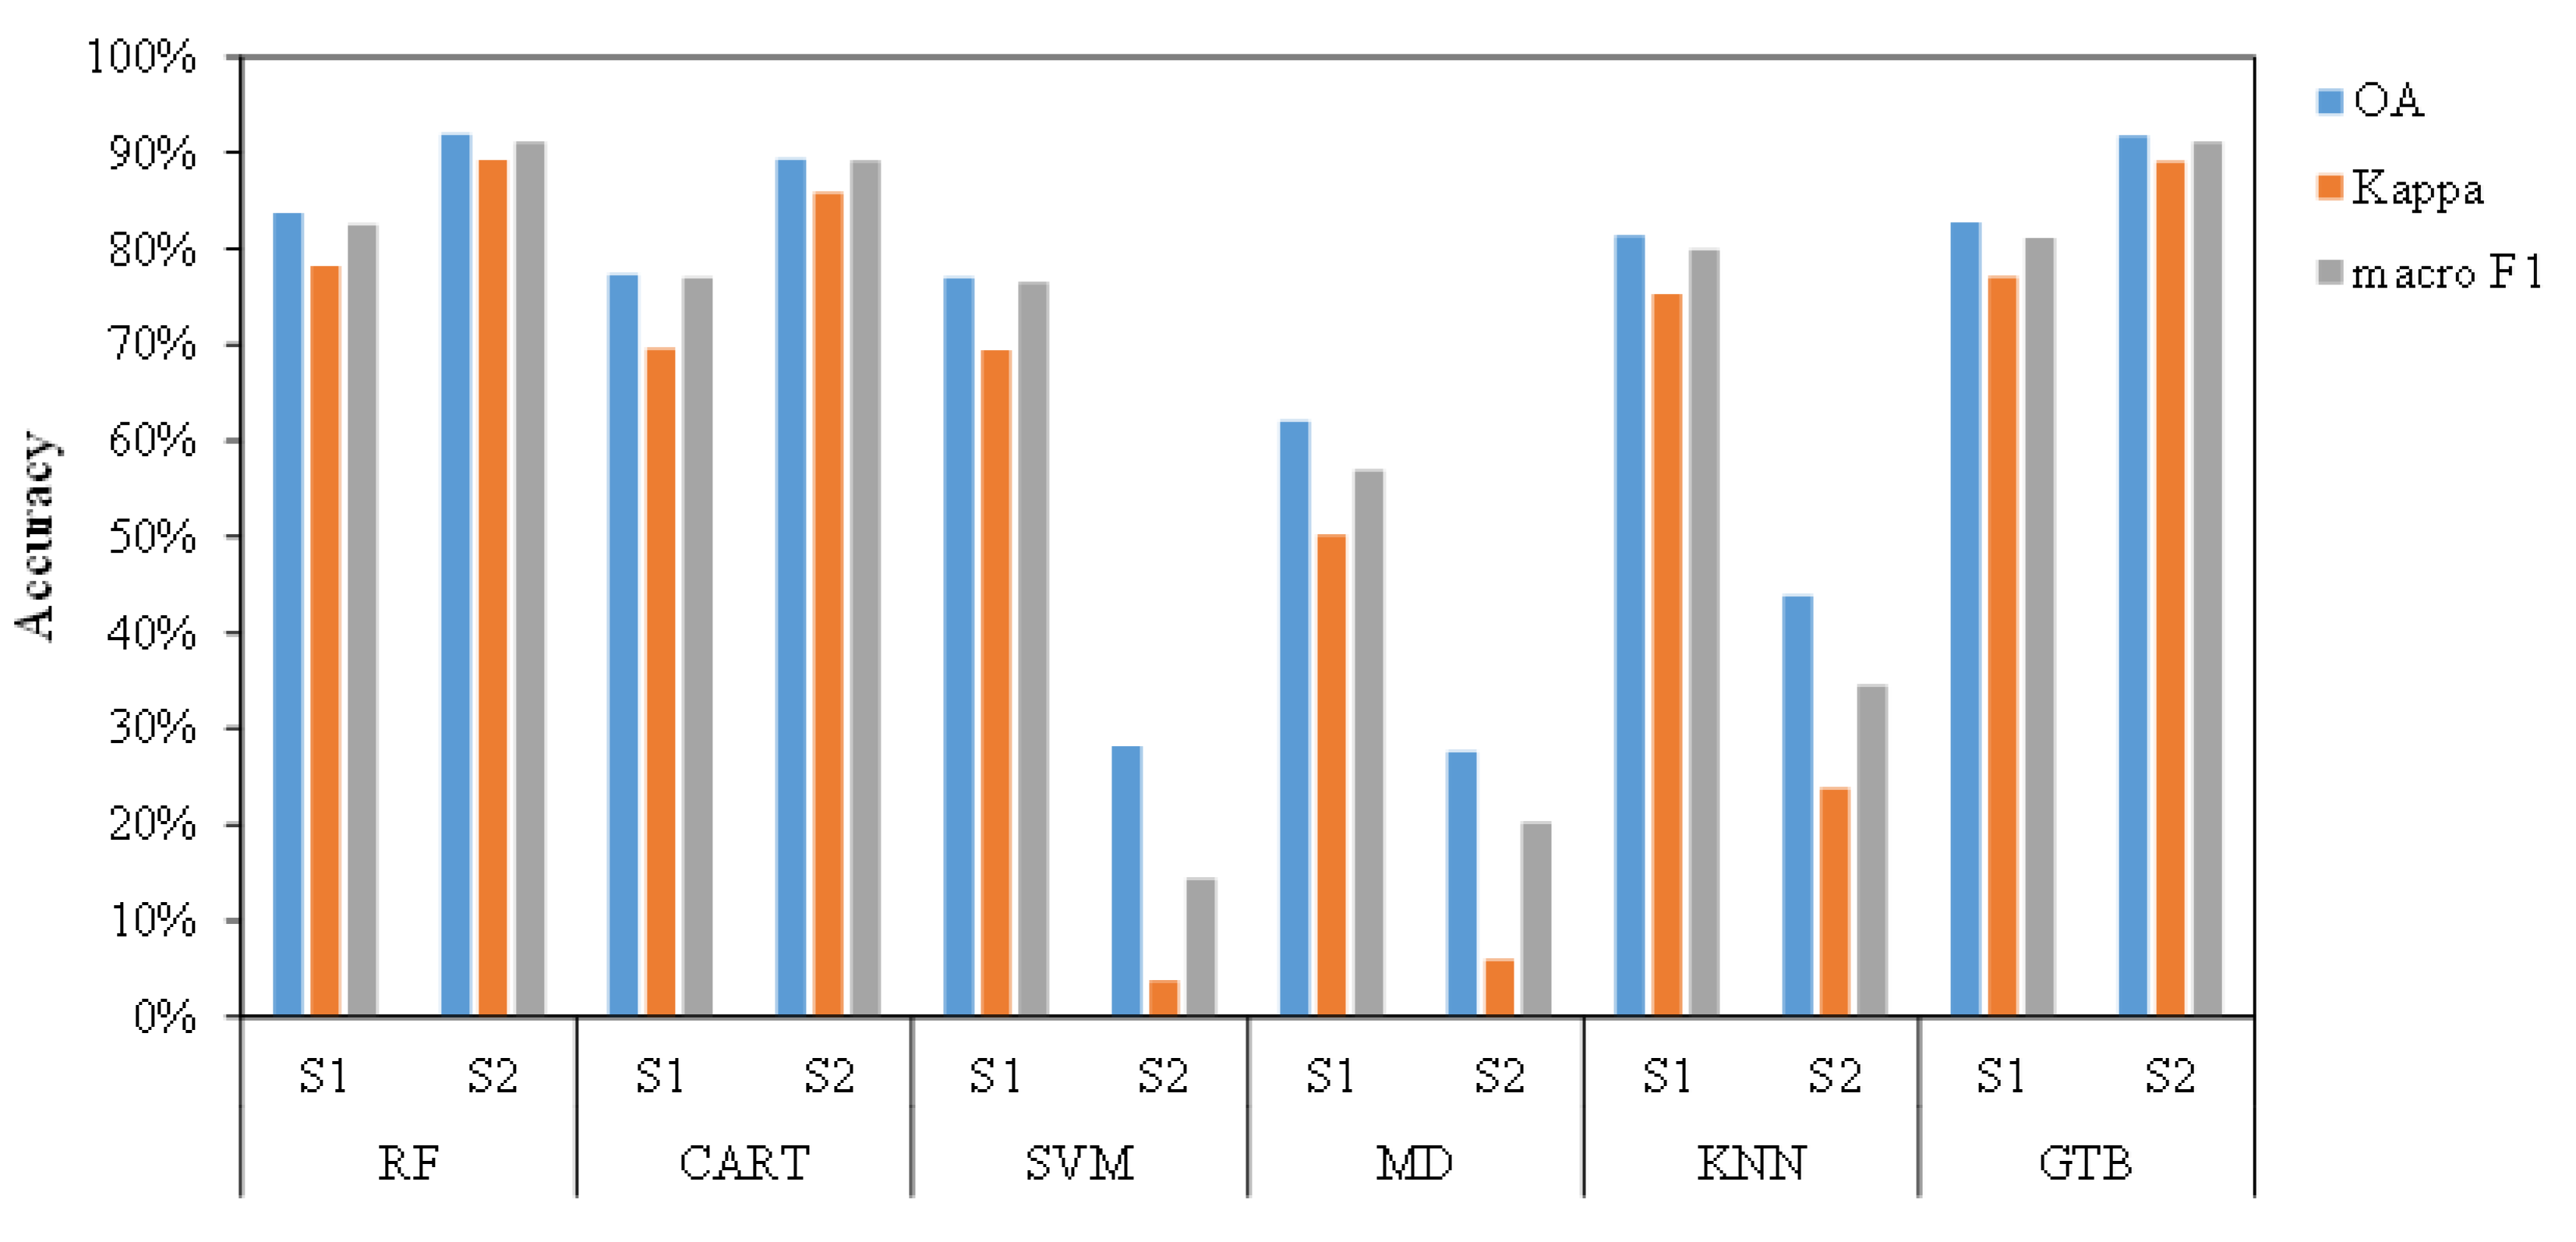
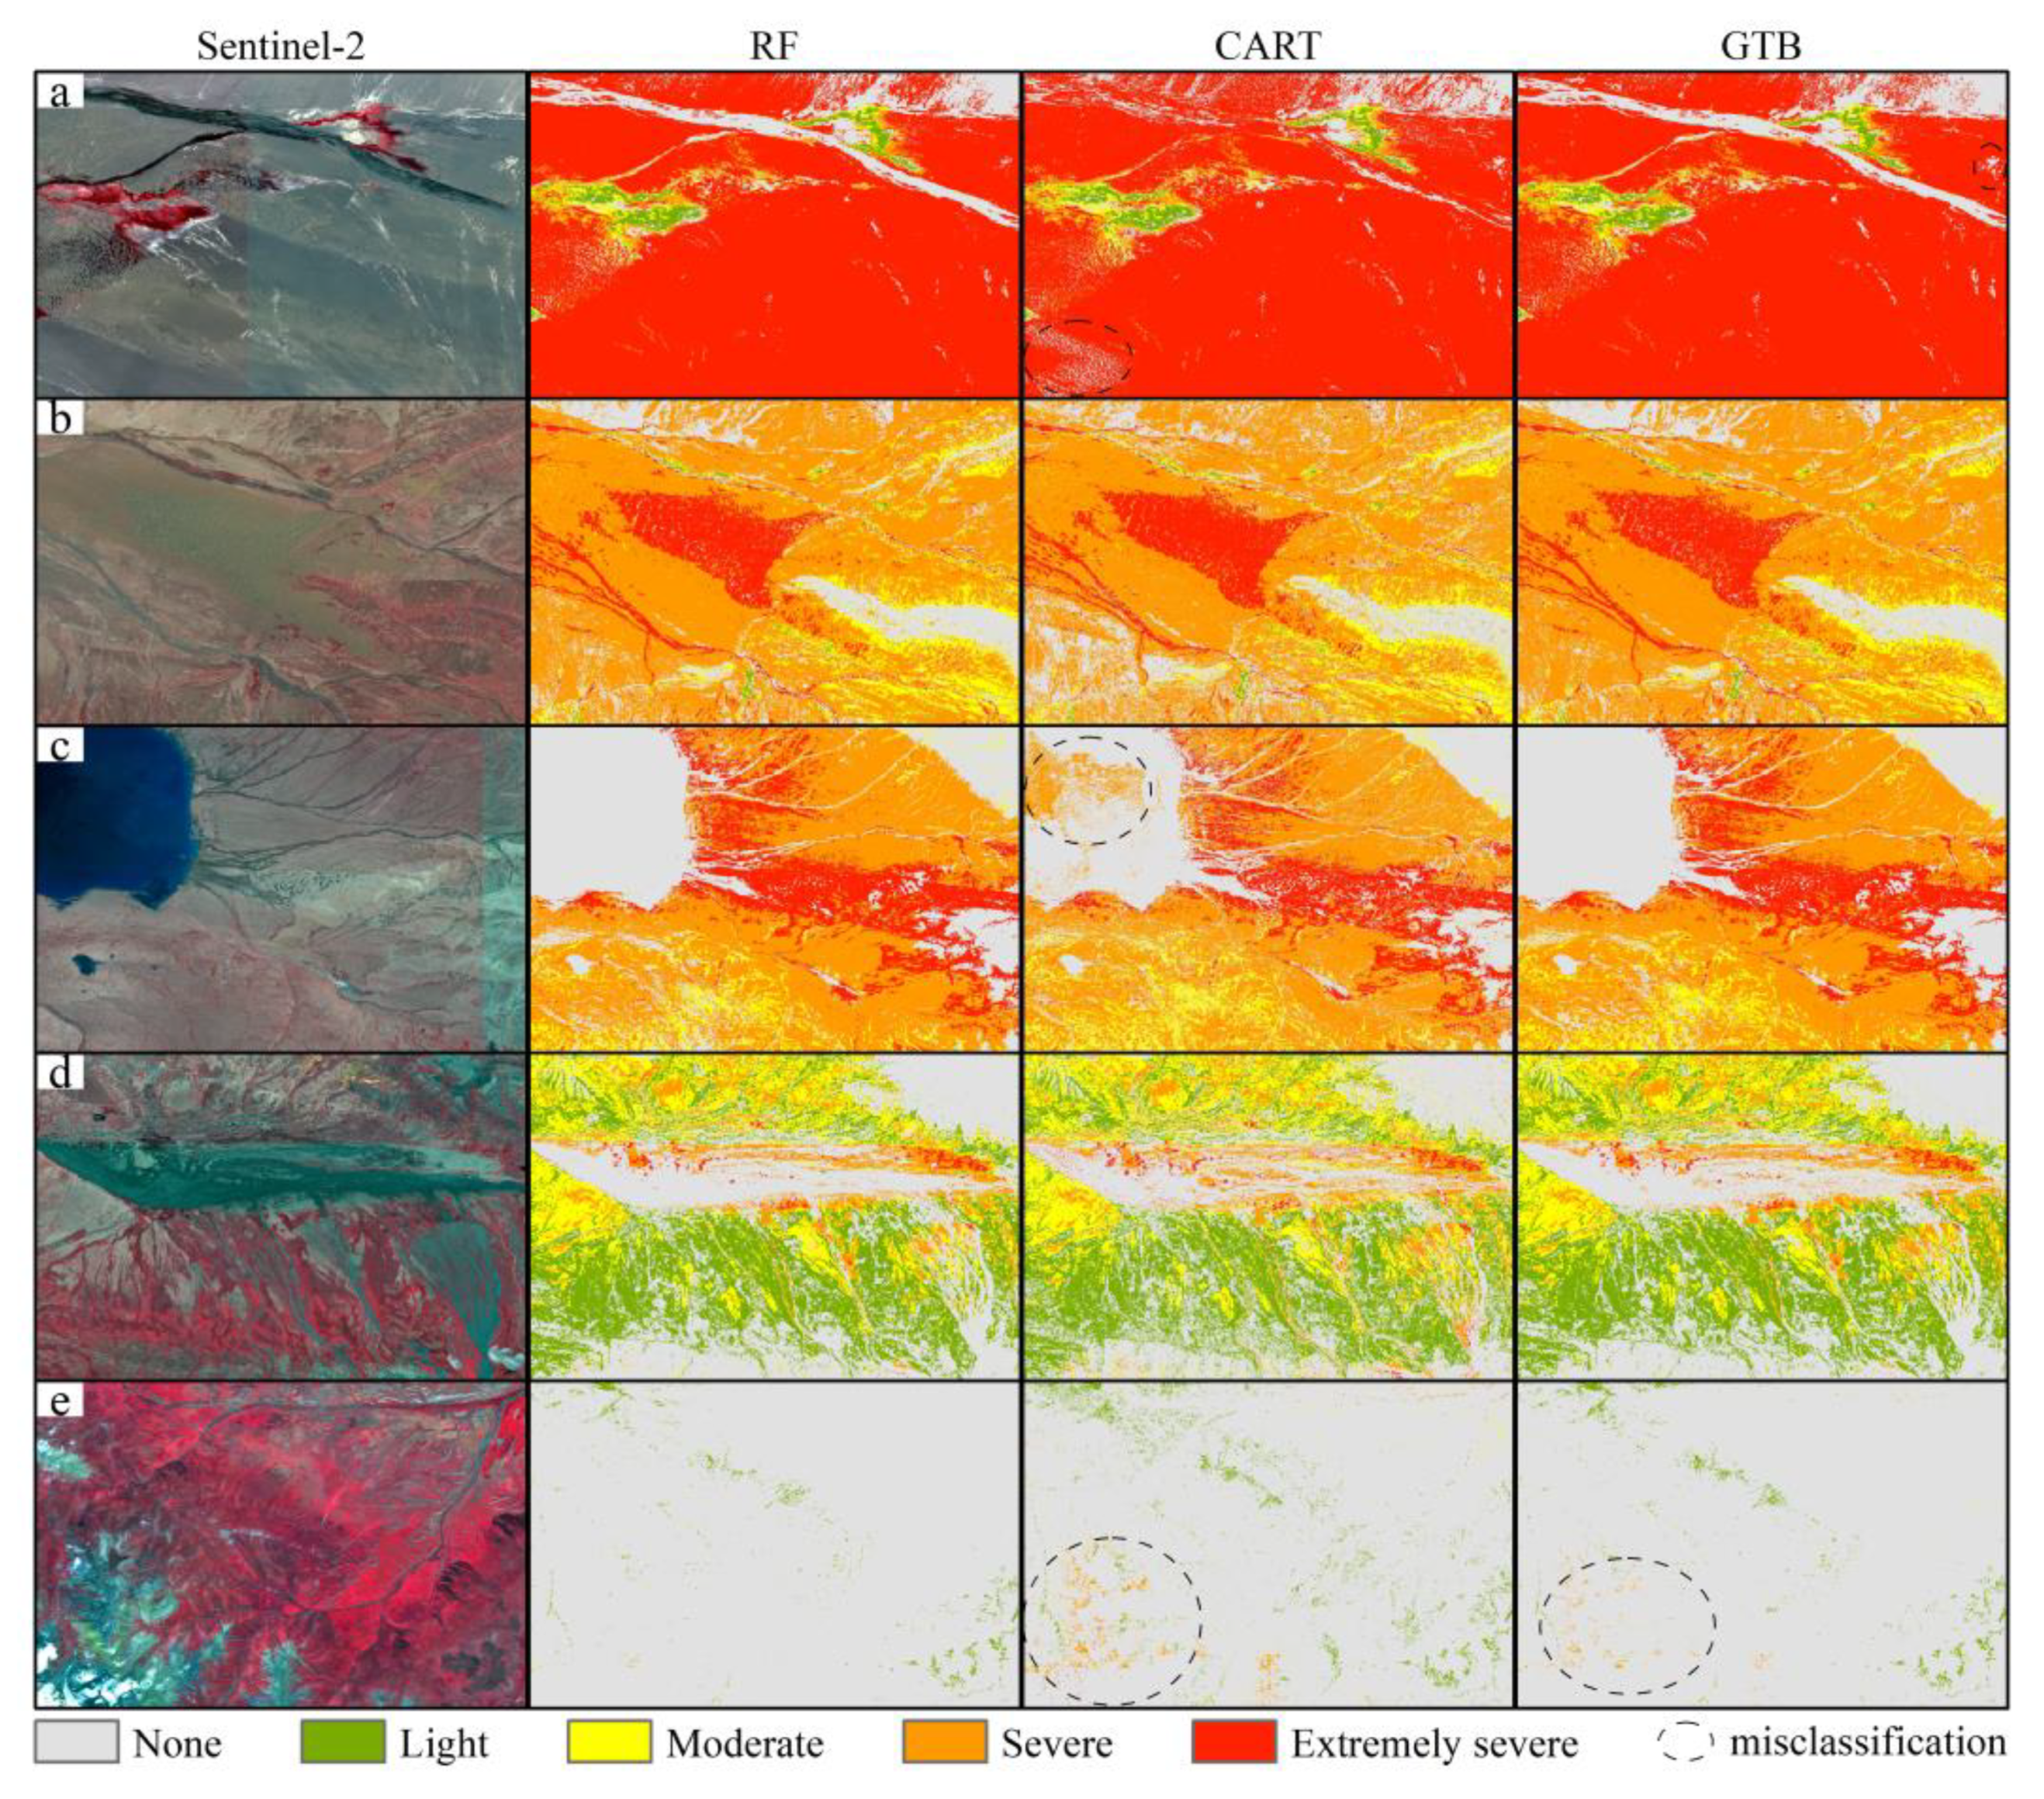
3.1. Performance Comparison of Machine Learning Algorithms

Based on remote sensing images in 2022, the classification results of land desertification in QMNPs are available (Figure 3). When the spectral index feature set (S1) is selected as the input feature, only three evaluation indicators of MD among the six classification algorithms are lower than 70%. Concretely, the overall accuracy is 62.09%, the Kappa coefficient is 50.16%, and the macro F1 score is 56.91%. The RF, KNN, and GTB algorithms perform well, with OA and macro F1 scores higher than 80% and the Kappa coefficient higher than 75%. However, such accuracy cannot meet our research requirements, and the machine learning classification model needs to be further optimized.
After the introduction of terrain features (S2), the classification accuracy of RF, CART, and GTB are significantly improved. Among them, the overall accuracy of RF is 91.9%, the Kappa coefficient is 89.26%, and the macro F1 score is 91.15%; the overall accuracy of CART is 89.36%, the Kappa coefficient is 85.88%, and the macro F1 score is 89.16%; the overall accuracy of GTB is 91.81%, the Kappa coefficient is 89.12%, and the macro F1 score is 91.13%. However, the classification accuracy of SVM, MD, and KNN is significantly reduced. Among them, the overall accuracy of SVM is 28.25%, the Kappa coefficient is 3.79%, and the macro F1 score is 14.44%; the overall accuracy of MD is 27.59%, the Kappa coefficient is 5.93%, and the macro F1 score is 20.25%; the overall accuracy of KNN is 43.88%, the Kappa coefficient is 23.82%, and the macro F1 score is 34.53%.
The classification accuracy indicators of RF, CART, and GTB are all above 85%, while the classification performance of RF and GTB algorithms are very similar due to their integrated learning characteristics. In order to further test the classification performance and model stability, as well as the transfer learning ability of the models, five representative areas, including four typical desertification areas and one non-desertification area, were selected for visual comparison of these three algorithms of the 2023 classification results (Figure 4 and Figure 5). In general, CART can better identify desertification areas, but the classification effect of non-desertification areas is poor with a large-scale misclassification phenomenon. Nevertheless, RF and GTB can better distinguish desertification areas from non-desertification areas. As depicted in Figure 5, the CART algorithm exhibits limitations by failing to identify all sandy land regions (Figure 5a) and misclassifying non-desertification areas (Figure 5c,d). In contrast, RF and GTB algorithms demonstrate favorable classification outcomes in areas a, b, c, and d. However, in area e, RF outperformed GTB in classifying non-desertification areas. In addition, we tested the reliability of the results by field investigation. The results show that the RF misclassification rate is 11.69%, the CART misclassification rate is 26.62%, and the GTB misclassification rate is 12.34%.
In summary, the classification results of the RF algorithm have higher consistency in the overall spatial distribution of different degrees of land desertification. It shows that the multi-index inversion technology based on the random forest algorithm can accurately extract and monitor desertification dynamics.

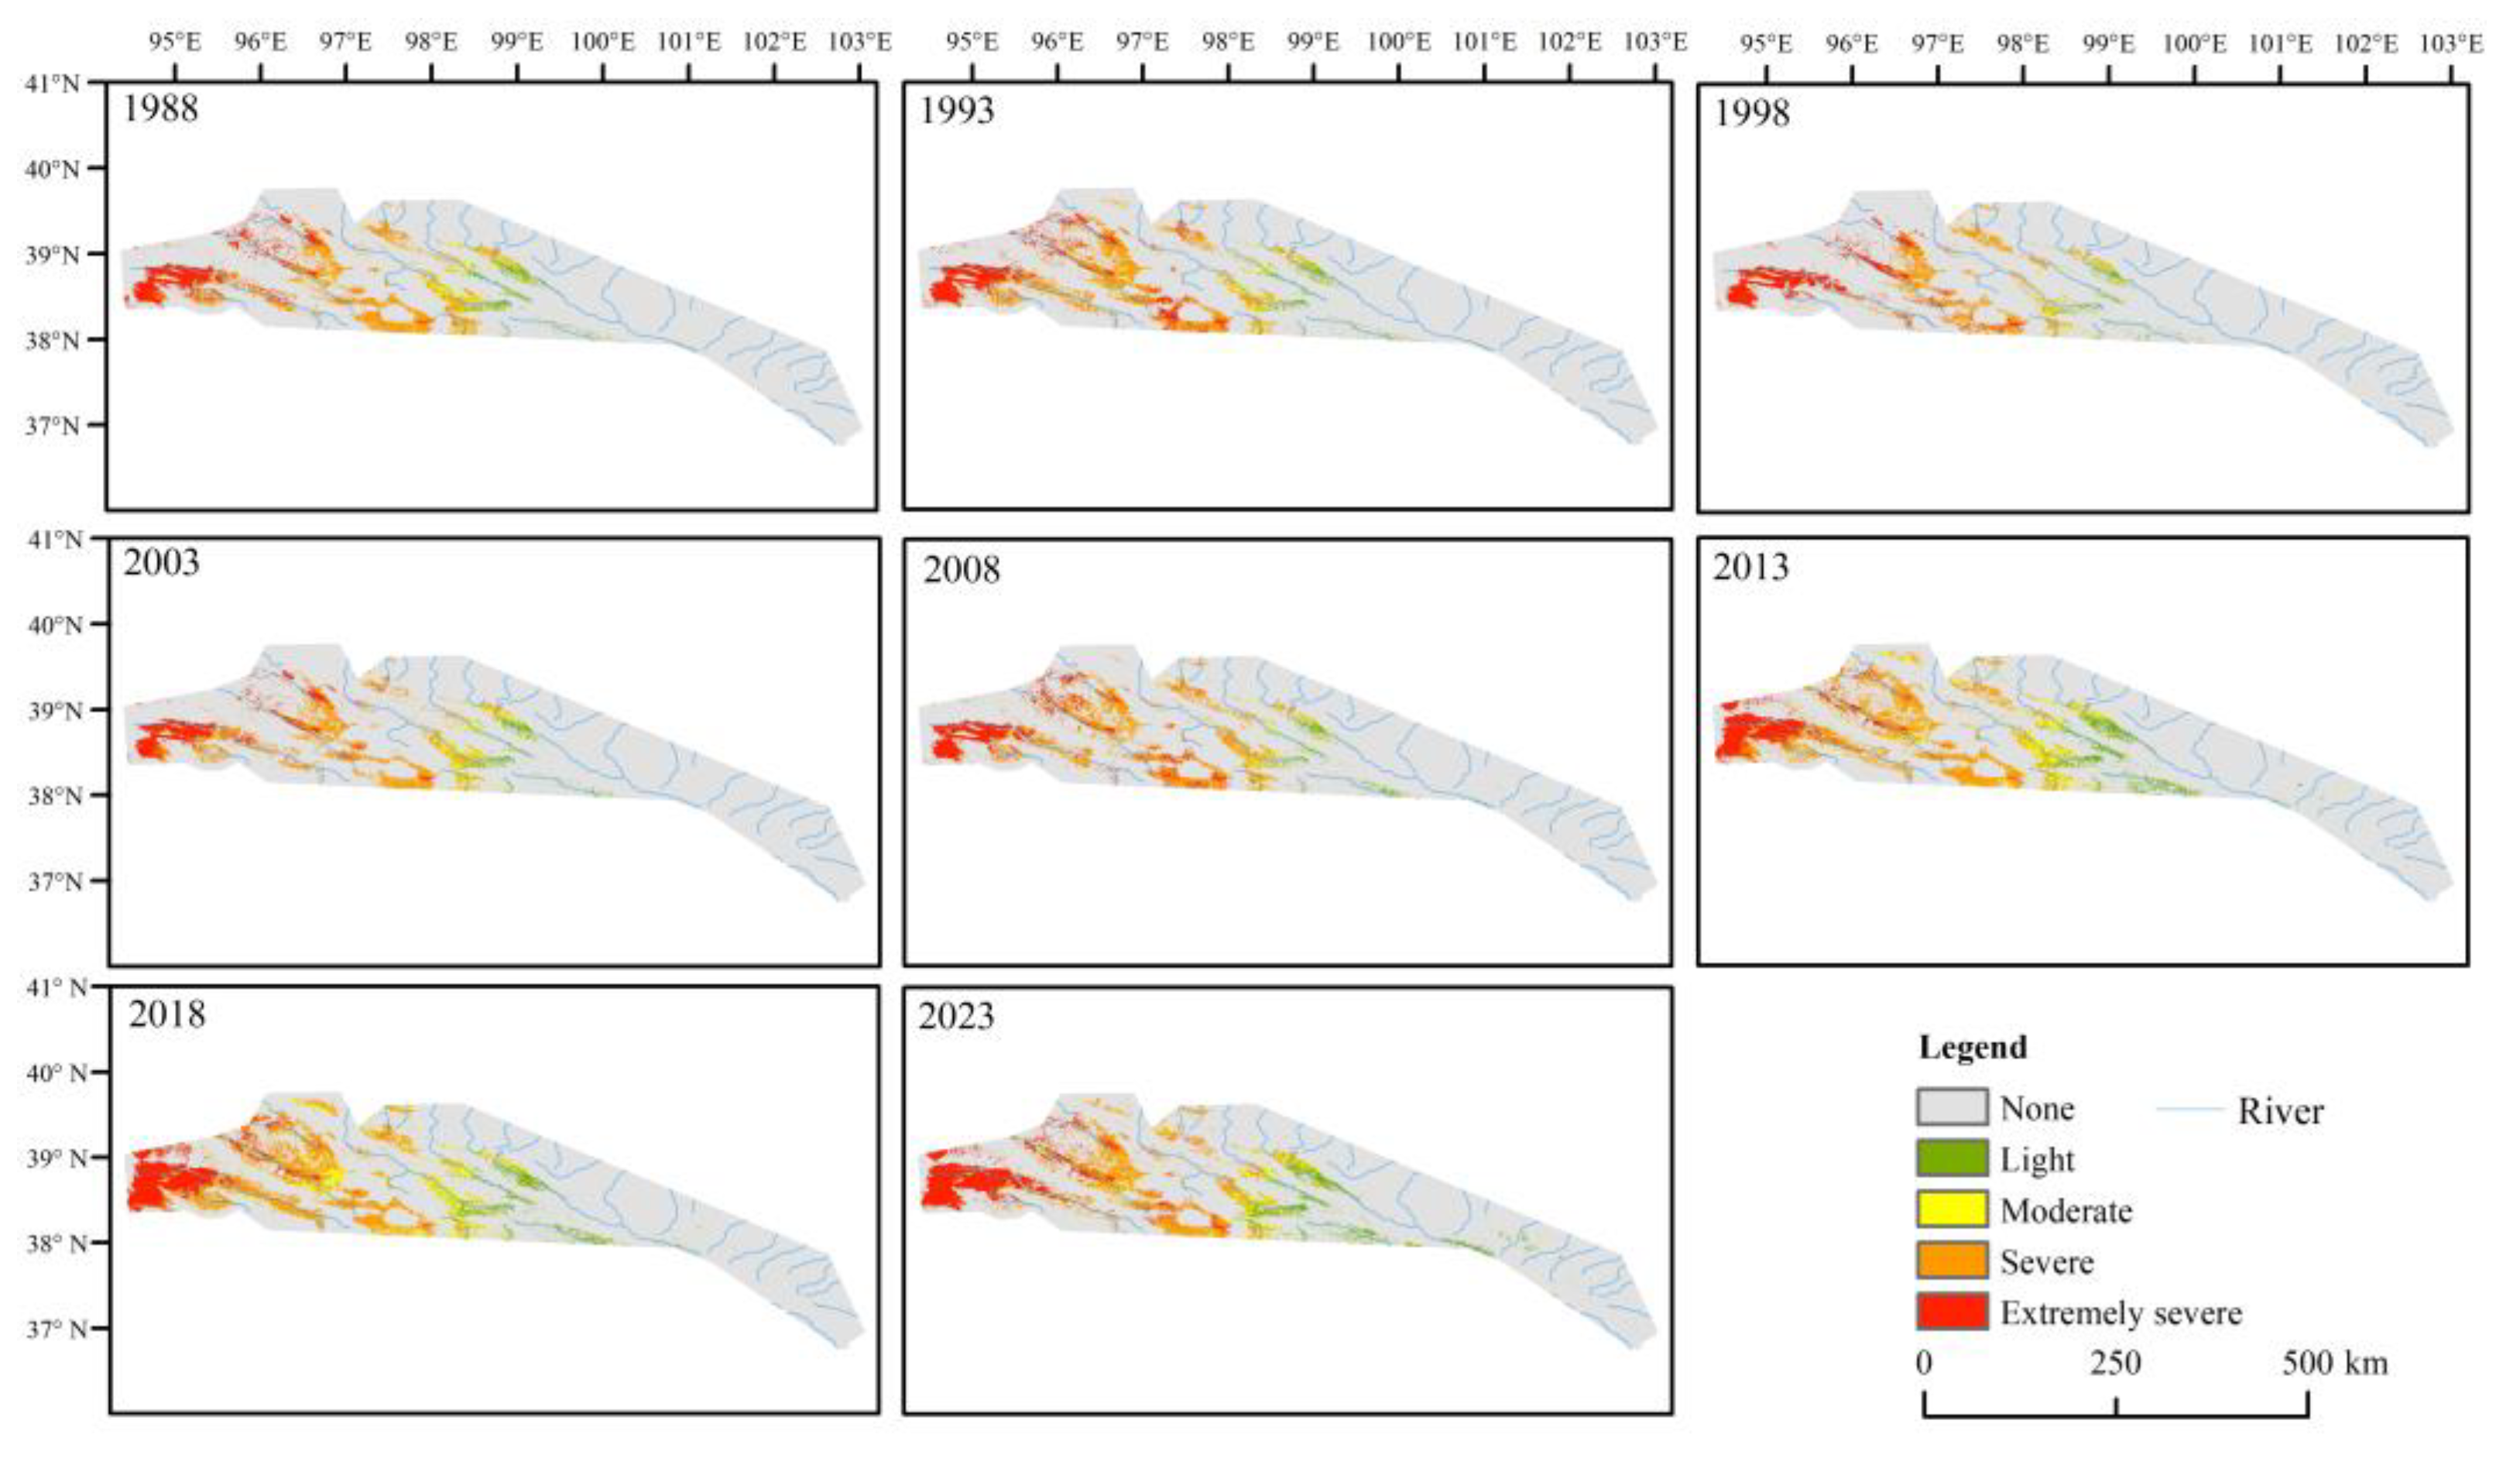
3.2. Spatiotemporal Dynamics of Land Desertification from 1988 to 2023

Based on the Model-based Transfer Learning and Landsat dataset, we utilized the established random forest classification model to quantitatively extract land desertification information at five-year intervals from 1988 to 2023. The image classification results are all post-classified through median filtering to effectively remove salt and pepper noise in the image. Thus, the spatiotemporal sequence data of land desertification in the past 35 years were constructed (Figure 6). The results show that as of 2023, the total area of land desertification is 16,897.35 km2, accounting for 18.29% of the total area of the study area, mainly distributed in the area of 3700~4200 m above sea level. It mainly occurs in the western region of QMNPs and is distributed along rivers, such as the Shule River, Danghe River, Yema River, and Halten River et al. Throughout the study period, the distribution of desertification at each level was spatially consistent.
Through statistics on the desertification areas of each grade (Table 4), it is found that from 1988 to 2023, the total desertification area expanded from 12,570.95 km2 to 16,897.35 km2, with land desertification encompassing 4.68% of the total area. Notably, each grade of desertification exhibited distinct expansion patterns. Specifically, the areas affected by light, moderate, severe, and extremely severe desertification increased by 1269.29 km2, 680.11 km2, 241.12 km2, and 2135.87 km2, respectively. This trend underscores a general escalation in desertification extent in QMNPs over the past 35 years. The total desertification area gradually expanded after 1998 until it reversed after 2018. As depicted in Figure 7, the distribution of different desertification grades varies across different periods. Severe desertification consistently dominates, fluctuating between 40% and 50% of the total desertification area. Subsequently, extremely severe desertification occupied 20% to 40% of the desertification areas. In contrast, the proportions of mild and moderate desertification areas remained relatively small, ranging from 6% to 17%. Remarkably, post-2008, there was an uptick in the proportion of mild and moderate desertification areas, while the shares of moderate and severe desertification areas gradually declined after 2003. Meanwhile, the proportion of extremely severe desertification areas exhibits fluctuating trends throughout the observation period.

3.3. Changing Trends of Land Desertification

The desertification extraction results of QMNPs from 1988 to 2023 are utilized to compare pixel-by-pixel changes in desertification between each two periods. This comparison facilitates the assessment of variations in intensity, area, and spatial distribution of desertification over time, elucidating the spatiotemporal evolution of desertification.
Figure 8 illustrates regions where land desertification experienced increments or reversals between 1988 and 2023. A changing trend value of 0 denotes unchanged land status, and values greater than 0 signify the exacerbation of desertification, with higher values indicating more significant aggravation. Conversely, values less than 0 indicate the reversal of land desertification, with lower values indicating a deeper reversal. Throughout the study period, the degree of desertification in the eastern QMNPs exhibits minimal change, while fluctuating desertification areas are predominantly observed in the western region.
Figure 9 intuitively shows the transition between desertification degrees in different periods. Throughout various periods, desertification at different severity levels remains in a state of instability, continuously transitioning in and out, with severe desertification being the most notable, while extremely severe desertification tends to exhibit relative stability.
Table 5 presents the desertification transfer matrix from 1988 to 2023. The main diagonal values denote areas that remain unchanged at each grade of desertification. The non-desertification area is recorded as 72,860.28 km2, while the cumulative area consistently desertified amounts to 7505.62 km2. Specifically, transitions from non-desertification to various degrees of desertification are delineated as follows: 1227.13 km2 to light, 785.15 km2 to moderate, 2347.25 km2 to severe, and 2610.61 km2 to extremely severe desertification. The augmentation in light desertification primarily stems from the transformation of previously non-desertification regions. Conversely, the expansion in moderate desertification is attributed to both the desertification of non-desertification areas and the reversal of severe desertification zones. Similarly, the escalation in severe desertification is influenced by both the desertification of non-desertification areas and the reversal of severe desertification zones, with a minor contribution from the reversal of extremely severe desertification. The upsurge in extremely severe desertification is chiefly driven by the severe desertification of non-desertification regions and the transformation of severe desertification areas. Remarkably, the reversal of desertification is predominantly evident in the reversal of severe desertification areas.

3.4. Changing Process of Land Desertification Gravity Center

Figure 10 shows the spatiotemporal changes in the center of gravity of desertification at different degrees. Overall, the gravity centers of desertification in the QMNPs lie between 38°20′–38°50′ N and 95°50′–99° E, with the centers of light, moderate, severe, and extremely severe desertification presenting a spatial pattern successively distributed from east to west. Among them, the gravity center of light desertification tends to migrate southeast; the gravity centers of moderate and severe desertification display a trend of fluctuating westward migration; and the gravity center of extremely severe desertification expands eastward before 2008 and then migrates westward.

4. Discussion

Research shows that the desertification trend in some areas of China has been effectively curbed, and the overall ecological condition continues to improve [55]. The spatiotemporal evolution of land desertification in the QMNPs based on the Landsat dataset in this study shows that land desertification reversed after 2018, although it expanded in the middle of the study period. This reversal of desertification may be due to a series of ecological protection measures in the Qilian Mountains. Since the end of the 1990s, in order to cope with climate change and protect the ecological environment, a series of ecological restoration projects such as the “returning farmland to forest project”, “natural forest protection project” [56], and “returning pasture to grassland project” have been implemented in the Qilian Mountains [57]. In 2017, a pilot project of QMNP was established. In December 2012, the National Development and Reform Commission of China officially approved the “Qilian Mountain Ecological Protection and Comprehensive Management Plan (2012–2020)” and its implementation was fully launched in August 2014. The biological desertification control project of Aksai County in 2020 was performed by means of sand barriers, natural vegetation restoration, and other methods, and 30,000 acres of desertification were controlled. In 2022, targeting key areas such as the Heihe River and Shule River, the construction of the water source conservation and ecological restoration project at the northern foot of the Qilian Mountains further promotes the comprehensive desertification prevention and control forest and grass project and plans to complete the comprehensive treatment of 74,600 acres of sandy land. The reversal of desertification since 2018 indicates that these engineering measures for sand control have begun to show effectiveness. However, the task of desertification prevention and control in QMNPs remains extremely challenging, as sand control is a long-term and continuous endeavor.
Cao et al. [58] pointed out that cost-effective and scientifically based strategies for dryland restoration require careful evaluation of local environmental conditions, long-term monitoring, and technological utilization, and the restoration of sandy areas is no exception. Large-scale afforestation on sandy and degraded lands is considered one of the most feasible methods for protecting the ecological environment [59,60,61]. However, some studies have suggested that planting water-demanding trees in arid and semi-arid areas of China may not be suitable as it could exacerbate land aridity and desertification, and alter watershed hydrological dynamics [62,63]. Furthermore, practical restoration efforts in Chinese drylands have shown low survival rates for many tree-planting initiatives [64]. In QMNPs, severe desertification, and extremely severe desertification always occupy a high proportion, reaching more than 70% (Figure 7). Research shows that for areas with severe and extremely severe desertification, shrubs have strong adaptability to the natural conditions of sandy land. Establishing shrub forests is one of the important approaches to reverse desertification, and the vegetation type should be adjusted according to local conditions such as precipitation [65,66]. Therefore, it is recommended to prioritize the protection of shrub forests for natural recovery and to carry out rational artificial restoration and planting initiatives. Future desertification control strategies must be carefully planned, well-monitored, and thoroughly assessed to protect non-desertification land, prevent further exacerbation of already desertified land, and achieve sustained reversal of land desertification.
In all, based on Sentinel-2 remote sensing images, we established training samples at a higher resolution to improve the accuracy of the samples. However, some of the Landsat data are missing due to cloud coverage. Four spectral indices of FVC, albedo, MSAVI, and TGSI were selected, and terrain features were introduced to construct a desertification monitoring model, which showed that the addition of terrain features can significantly improve the performance of machine learning classification. In the future, more characteristic variables can be considered to build a more effective desertification monitoring model. Taking five years as a time interval, the desertification results will be inevitably affected by climate change events. Subsequent desertification-related research can consider a more appropriate time interval.

5. Conclusions

Utilizing the Landsat dataset from 1988 to 2023 obtained via the GEE platform, we extract monitoring indicators and integrate them with machine learning techniques to develop a spatiotemporal desertification monitoring model tailored to the QMNPs. Subsequently, we employ change detection and gravity change models to analyze the spatiotemporal dynamics of desertification. Our conclusions are as follows: (1) Comparative analysis of machine learning algorithms on the GEE platform reveals that ensemble learning based on decision trees, particularly the random forest algorithm, exhibits robust performance in identifying land desertification information. By harnessing multi-temporal remote sensing data and multi-index feature sets available on the GEE platform, regional desertification information can be promptly and accurately identified and extracted. (2) Long-term series analysis underscores the persistent existence of the land desertification process in the QMNPs over the past 35 years, with significant expansion in desertification areas. However, desertification has been reversed since 2018. Through management efforts, the land desertification in QMNPs is in the initial stage of recovery, requiring further consolidation and enhancement of management effectiveness. The task of desertification prevention and control remains formidable.

Author Contributions

Conceptualization, Xiaowen Chen and Naiang Wang; methodology, Xiaowen Chen; software, Xiaowen Chen; validation, Xiaowen Chen and Naiang Wang; formal analysis, Xiaowen Chen; investigation, Xiaowen Chen, Naiang Wang, Nan Meng, and Haoyun Lv; resources, Naiang Wang; data curation, Xiaowen Chen and Naiang Wang; writing—original draft preparation, Xiaowen Chen; writing—review and editing, Xiaowen Chen and Simin Peng; visualization, Xiaowen Chen; supervision, Naiang Wang; project administration, Naiang Wang; funding acquisition, Naiang Wang. All authors have read and agreed to the published version of the manuscript.

Funding

This research was funded by the National Natural Science Foundation of China (Grant No. 42271131).

Data Availability Statement

The code that supports the findings of this study is openly available at https://code.earthengine.google.com/38cd82b784482ce62ead11ae58651252 (accessed on 26 December 2023).

Acknowledgments

We would like to express our sincere thanks to Dehao Sun, Yipeng Wang, Chufang Huang, and Hang Zhao for their assistance with fieldwork. We also thank Xiao Liu and Jiang Liu for their guidance in code editing.

Conflicts of Interest

The authors declare no conflicts of interest.

References

  1. UNCCD. United Nations Convention to Combat Desertification, Intergovernmental Negotiating Committee for a Convention to Combat Desertification, Elaboration of an International Convention to Combat Desertification in Countries Experiencing Serious Drought and/or Desertification, Particularly in Africa; U.N. Doc. A/AC.241/27, 33 I.L.M. 1328; UNCCD: New York, NY, USA, 1994. [Google Scholar]
  2. Wang, T.; Zhu, Z. Study on sandy desertification in China-1. Definition of sandy desertification and its connotation. J. Desert Res. 2003, 23, 209. [Google Scholar]
  3. Zan, G.; Wang, C.; Li, F. Key Data Results and Trend Analysis of the Sixth National Survey on Desertification and Sandifiction. For. Resour. Manag. 2023, 1, 1–7. (In Chinese) [Google Scholar]
  4. Li, J.; Yang, X.; Jin, Y.; Yang, Z.; Huang, W.; Zhao, L.; Gao, T.; Yu, H.; Ma, H.; Qin, Z.; et al. Monitoring and analysis of grassland desertification dynamics using Landsat images in Ningxia, China. Remote Sens. Environ. 2013, 138, 19–26. [Google Scholar] [CrossRef]
  5. Lyu, Y.; Shi, P.; Han, G.; Liu, L.; Guo, L.; Hu, X.; Zhang, G. Desertification control practices in China. Sustainability 2020, 12, 3258. [Google Scholar] [CrossRef]
  6. Schlesinger, W.H.; Reynolds, J.F.; Cunningham, G.L.; Huenneke, L.F.; Jarrell, W.M.; Virginia, R.A.; Whitford, W.G. Biological feedback in global desertification. Science 1990, 247, 1043–1048. [Google Scholar] [CrossRef] [PubMed]
  7. Zuo, X.A.; Zhao, H.L.; Zhao, X.Y.; Zhang, T.; Guo, Y.; Wang, S.; Drake, S. Spatial pattern and heterogeneity of soil properties in sand dunes under grazing and restoration in Horqin Sandy Land, Northern China. Soil Tillage Res. 2008, 99, 202–212. [Google Scholar] [CrossRef]
  8. Cheng, L.; Lu, Q.; Wu, B.; Yin, C.; Bao, Y.; Gong, L. Estimation of the costs of desertification in China: A critical review. Land Degrad. Dev. 2018, 29, 975–983. [Google Scholar] [CrossRef]
  9. Li, C.; Fu, B.; Wang, S.; Stringer, L.C.; Wang, Y.; Li, Z.; Liu, Y.; Zhou, W. Drivers and impacts of changes in China’s drylands. Nat. Rev. Earth Environ. 2021, 2, 858–873. [Google Scholar] [CrossRef]
  10. Yu, Q.; Wang, X.; Han, Z.; Miao, X.; Lu, H. Diverse Climatic and Anthropogenic Impacts on Desertification in the Middle Reaches of Yarlung Zangbo River Catchment on the Tibetan Plateau. J. Earth Sci. 2023, 34, 1816–1826. [Google Scholar] [CrossRef]
  11. Salih, A.; Ganawa, E.T.; Elmahl, A.A. Spectral mixture analysis (SMA) and change vector analysis (CVA) methods for monitoring and mapping land degradation/desertification in arid and semiarid areas (Sudan), using Landsat imagery. Egypt. J. Remote Sens. Space Sci. 2017, 20, S21–S29. [Google Scholar] [CrossRef]
  12. Pan, J.; Li, T. Extracting desertification from Landsat TM imagery based on spectral mixture analysis and Albedo-Vegetation feature space. Nat Hazards 2018, 68, 915–927. [Google Scholar] [CrossRef]
  13. Wu, Z.; Lei, S.; Bian, Z.; Huang, J.; Zhang, Y. Study of the desertification index based on the albedo-MSAVI feature space for semi-arid steppe region. Environ. Earth Sci. 2019, 78, 232. [Google Scholar] [CrossRef]
  14. Bezerra, F.G.S.; Aguiar, A.P.D.D.; Alvalá, R.C.D.S.; Giarolla, A.; Bezerra, K.R.A.; Lima, P.V.P.S.; Do Nascimento, F.R.; Arai, E. Analysis of areas undergoing desertification, using EVI2 multi-temporal data based on MODIS imagery as indicator. Ecol. Indic. 2020, 117, 106579. [Google Scholar] [CrossRef]
  15. Zhou, Y.; Hu, Z.; Geng, Q.; Ma, J.; Liu, J.; Wang, M.; Wang, Y. Monitoring and analysis of desertification surrounding Qinghai Lake (China) using remote sensing big data. Environ. Sci. Pollut. Res. 2023, 30, 17420–17436. [Google Scholar] [CrossRef] [PubMed]
  16. Hua, D.; Hao, X. Spatiotemporal change and drivers analysis of desertification in the arid region of northwest China based on geographic detector. Environ. Chall. 2021, 4, 100082. [Google Scholar]
  17. Wang, X.; Ge, Q.; Geng, X.; Wang, Z.; Gao, L.; Bryan, B.A.; Chen, S.; Su, Y.; Cai, D.; Ye, J.; et al. Unintended consequences of combating desertification in China. Nat. Commun. 2023, 14, 1139. [Google Scholar] [CrossRef] [PubMed]
  18. Lamchin, M.; Lee, J.Y.; Lee, W.K.; Lee, E.J.; Kim, M.; Lim, C.H.; Choi, H.A.; Kim, S.R. Assessment of land cover change and desertification using remote sensing technology in a local region of Mongolia. Adv. Space Res. 2016, 57, 64–77. [Google Scholar] [CrossRef]
  19. Meng, X.; Gao, X.; Li, S.; Li, S.; Lei, J. Monitoring desertification in Mongolia based on Landsat images and Google Earth Engine from 1990 to 2020. Ecol. Indic. 2021, 129, 107908. [Google Scholar] [CrossRef]
  20. Zhan, Q.; Zhao, W.; Yang, M.; Xiong, D. A long-term record (1995–2019) of the dynamics of land desertification in the middle reaches of Yarlung Zangbo River basin derived from Landsat data. Geogr. Sustain. 2021, 2, 12–21. [Google Scholar] [CrossRef]
  21. Wang, X.; Song, J.; Xiao, Z.; Wang, F.; Hu, F. Desertification in the Mu Us Sandy Land in China: Response to climate change and human activity from 2000 to 2020. Geogr. Sustain. 2022, 3, 177–189. [Google Scholar] [CrossRef]
  22. Tomasella, J.; Vieira, R.; Barbosa, A.; Rodriguez, D.A.; de Oliveira Santana, M.; Sestini, M.F. Desertification trends in the Northeast of Brazil over the period 2000–2016. Int. J. Appl. Earth Obs. Geoinf. 2018, 73, 197–206. [Google Scholar] [CrossRef]
  23. Owusu, A.B.; Cervone, G.; Luzzadder-Beach, S. Analysis of desertification in the upper east region (UER) of Ghana using remote sensing, field study, and local knowledge. Cartogr. Int. J. Geogr. Inf. Geovisualization 2013, 48, 22–37. [Google Scholar]
  24. Pickup, G. Desertification and climate change—The Australian perspective. Clim. Res. 1998, 11, 51–63. [Google Scholar] [CrossRef]
  25. Berry, L.; Ford, R.B. Recommendations for a System to Monitor Critical Indicators in Areas Prone to Desertification: A Report Submitted to the United States Agency for International Development and the Department of State under Contract Number Aid/Ta-C-1407 on Behalf of the United States Task Force on Desertification; Clark University: Worcester, MA, USA, 1977. [Google Scholar]
  26. Yang, Z.; Gao, X.; Lei, J.; Meng, X.; Zhou, N. Analysis of spatiotemporal changes and driving factors of desertification in the Africa Sahel. Catena 2022, 213, 106213. [Google Scholar] [CrossRef]
  27. Duan, H.; Wang, T.; Xue, X.; Yan, C. Dynamic monitoring of aeolian desertification based on multiple indicators in Horqin Sandy Land, China. Sci. Total Environ. 2019, 650, 2374–2388. [Google Scholar] [CrossRef] [PubMed]
  28. Jiang, M.; Lin, Y. Desertification in the south Junggar Basin, 2000–2009: Part I. Spatial analysis and indicator retrieval. Adv. Space Res. 2018, 62, 1–15. [Google Scholar] [CrossRef]
  29. Mai, M.; Tiyip, T.; JianlI, D. Decision tree classification for extracting information on sandy desertification land in the southern Taklamakan. Res. Environ. Sci. 2008, 21, 109–114. [Google Scholar]
  30. Gorelick, N.; Hancher, M.; Dixon, M.; Ilyushchenko, S.; Thau, D.; Moore, R. Google Earth Engine: Planetary-scale geospatial analysis for everyone. Remote Sens. Environ. 2017, 202, 18–27. [Google Scholar] [CrossRef]
  31. Amani, M.; Ghorbanian, A.; Ahmadi, S.A.; Kakooei, M.; Moghimi, A.; Mirmazloumi, S.M.; Moghaddam, S.H.A.; Mahdavi, S.; Ghahremanloo, M.; Parsian, S.; et al. Google earth engine cloud computing platform for remote sensing big data applications: A comprehensive review. IEEE J. Sel. Top. Appl. Earth Obs. Remote Sens. 2020, 13, 5326–5350. [Google Scholar] [CrossRef]
  32. Waleed, M.; Sajjad, M. Leveraging cloud-based computing and spatial modeling approaches for land surface temperature disparities in response to land cover change: Evidence from Pakistan. Remote Sens. Appl. Soc. Environ. 2022, 25, 100665. [Google Scholar] [CrossRef]
  33. Hird, J.N.; DeLancey, E.R.; McDermid, G.J.; Kariyeva, J. Google Earth Engine, open-access satellite data, and machine learning in support of large-area probabilistic wetland mapping. Remote Sens. 2017, 9, 1315. [Google Scholar] [CrossRef]
  34. Chen, A.; Yang, X.; Guo, J.; Xing, X.; Yang, D.; Xu, B. Synthesized remote sensing-based desertification index reveals ecological restoration and its driving forces in the northern sand-prevention belt of China. Ecol. Indic. 2021, 131, 108230. [Google Scholar] [CrossRef]
  35. Zhang, C.L.; Li, Q.; Shen, Y.P.; Zhou, N.; Wang, X.S.; Li, J.; Jia, W.R. Monitoring of aeolian desertification on the Qinghai-Tibet Plateau from the 1970s to 2015 using Landsat images. Sci. Total Environ. 2018, 619, 1648–1659. [Google Scholar] [CrossRef] [PubMed]
  36. Li, Q.; Zhang, C.; Zhou, N.; Shen, Y.; Wu, Y.; Zou, X.; Li, J.; Jia, W.; Wang, X. Spatial Distribution of Aeolian Desertification on the Qinghai-Tibet Plateau. J. Desert Res. 2018, 38, 690–700. (In Chinese) [Google Scholar]
  37. Yan, K.; Ding, Y. The Overview of the Progress of Qilian Mountain National Park System Pilot Area. Int. J. Geoheritage Parks 2020, 8, 210–214. [Google Scholar] [CrossRef]
  38. Peng, Q.; Wang, R.; Jiang, Y.; Li, C. Contributions of climate change and human activities to vegetation dynamics in Qilian Mountain National Park, northwest China. Glob. Ecol. Conserv. 2021, 32, e01947. [Google Scholar] [CrossRef]
  39. Qi, X.; Xu, H.; Chen, T.; Shan, S.; Chen, S. Effects of climate change, coal mining and grazing on vegetation dynamics in the mountain permafrost regions. Ecol. Inform. 2022, 69, 101684. [Google Scholar] [CrossRef]
  40. Schiemann, R.; Lüthi, D.; Schär, C. Seasonality and interannual variability of the westerly jet in the Tibetan Plateau region. J. Clim. 2009, 22, 2940–2957. [Google Scholar] [CrossRef]
  41. Li, S.; Su, S.; Liu, Y.; Zhou, X.; Luo, Q.; Paudel, B. Effectiveness of the Qilian Mountain Nature Reserve of China in reducing human impacts. Land 2022, 11, 1071. [Google Scholar] [CrossRef]
  42. Mainguet, M.; Da Silva, G.G. Desertification and drylands development: What can be done? Land Degrad. Dev. 1998, 9, 375–382. [Google Scholar] [CrossRef]
  43. Diouf, A.; Lambin, E.F. Monitoring land-cover changes in semi-arid regions:remote sensing data and field observations in the Ferlo, Senegal. J. Arid Environ. 2001, 48, 129–148. [Google Scholar] [CrossRef]
  44. State Forestry Administration of China. Technical Code of Practice on the Sandified Land Monitoring(GB/T 24255-2009); State Forestry Administration: Beijing, China, 2009. (In Chinese) [Google Scholar]
  45. Xiao, J.; Moody, A.A. comparison of methods for estimating fractional green vegetation cover within a desert-to-upland transition zone in central New Mexico, USA. Remote Sens. Environ. 2005, 98, 237–250. [Google Scholar] [CrossRef]
  46. Li, S.G.; Harazono, Y.; Oikawa, T.; Zhao, H.L.; He, Z.Y.; Chang, X.L. Grassland desertification by grazing and the resulting micrometeorological changes in Inner Mongolia. Agric. For. Meteorol. 2000, 102, 125–137. [Google Scholar]
  47. Jackson, R.D.; Idso, S.B. Surface albedo and desertification. Science 1975, 189, 1012–1013. [Google Scholar] [CrossRef]
  48. Barletta, C.; Capolupo, A.; Tarantino, E. Extracting Land Surface Albedo from Landsat 9 Data in GEE Platform to Support Climate Change Analysis. Geomat. Environ. Eng. 2023, 17, 35–75. [Google Scholar] [CrossRef]
  49. Robinove, C.J.; Chavez, P.S.; Gehring, D.; Holmgren, R. Arid land monitoring using Landsat albedo difference images. Remote Sens. Environ. 1981, 11, 133–156. [Google Scholar] [CrossRef]
  50. Rasmussen, K.; Fog, B.; Madsen, J.E. Desertification in reverse? Observations from northern Burkina Faso. Glob. Environ. Chang. 2001, 11, 271–282. [Google Scholar] [CrossRef]
  51. Zhu, Z.D.; Wang, T. Trends of desertification and its rehabilitation in China. Desertif. Control. Bull. 1993, 22, 27–30. [Google Scholar]
  52. Xiao, J.; Shen, Y.; Tateishi, R.; Bayaer, W. Development of topsoil grain size index for monitoring desertification in arid land using remote sensing. Int. J. Remote Sens. 2006, 27, 2411–2422. [Google Scholar] [CrossRef]
  53. Wei, H.; Wang, J.; Cheng, K.; Li, G.; Ochir, A.; Davaasuren, D.; Chonokhuu, S. Desertification information extraction based on feature space combinations on the Mongolian plateau. Remote Sens. 2018, 10, 1614. [Google Scholar] [CrossRef]
  54. Qi, J.; Chehbouni, A.; Huete, A.R.; Kerr, Y.H.; Sorooshian, S. A modified soil adjusted vegetation index. Remote Sens. Environ. 1994, 48, 119–126. [Google Scholar] [CrossRef]
  55. Bryan, B.A.; Gao, L.; Ye, Y.; Sun, X.; Connor, J.D.; Crossman, N.D.; Stafford-Smith, M.; Wu, J.; He, C.; Yu, D.; et al. China’s response to a national land-system sustainability emergency. Nature 2018, 559, 193–204. [Google Scholar] [CrossRef] [PubMed]
  56. Wang, Y.; Zhou, L.; Yang, G.; Guo, R.; Xia, C.; Liu, Y. Performance and obstacle tracking to natural forest resource protection project: A rangers’ case of Qilian Mountains, China. Int. J. Environ. Res. Public Health 2020, 17, 5672. [Google Scholar] [CrossRef]
  57. Guo, L.; Li, J.; Huang, Y.; Zuo, J. Exploring uncertainties of ecological management in the Qilian Mountain Nature Reserve, Northwest China. J. Nat. Conserv. 2023, 76, 126507. [Google Scholar] [CrossRef]
  58. Cao, S.; Sun, G.; Zhang, Z.; Chen, L.; Feng, Q.; Fu, B.; McNulty, S.; Shankman, D.; Tang, J.; Wang, Y.; et al. Greening china naturally. Ambio 2011, 40, 828–831. [Google Scholar] [CrossRef] [PubMed]
  59. Prăvălie, R. Drylands extent and environmental issues. A global approach. Earth-Sci. Rev 2016, 161, 259–278. [Google Scholar] [CrossRef]
  60. Posner, S.M.; McKenzie, E.; Ricketts, T.H. Policy impacts of ecosystem services knowledge. Proc. Natl. Acad. Sci. USA 2016, 113, 1760–1765. [Google Scholar] [CrossRef] [PubMed]
  61. Costanza, R.; De Groot, R.; Braat, L.; Kubiszewski, I.; Fioramonti, L.; Sutton, P.; Farber, S.; Grasso, M. Twenty years of ecosystem services: How far have we come and how far do we still need to go? Ecosyst. Serv. 2017, 28, 1–16. [Google Scholar] [CrossRef]
  62. Cao, S.; Chen, L.; Shankman, D.; Wang, C.; Wang, X.; Zhang, H. Excessive reliance on afforestation in China’s arid and semi-arid regions: Lessons in ecological restoration. Earth-Sci. Rev. 2011, 104, 240–245. [Google Scholar] [CrossRef]
  63. Wang, G.; Innes, J.L.; Lei, J.; Dai, S.; Wu, S.W. China’s forestry reforms. Science 2007, 318, 1556–1557. [Google Scholar] [CrossRef]
  64. Cao, S. Why large-scale afforestation efforts in China have failed to solve the desertification problem. Environ. Sci. Technol. 2008, 42, 1826–1831. [Google Scholar] [CrossRef] [PubMed]
  65. Qi, K.; Zhu, J.; Zheng, X.; Wang, G.G.; Li, M. Impacts of the world’s largest afforestation program (Three-North Afforestation Program) on desertification control in sandy land of China. GIScience Remote Sens. 2023, 60, 2167574. [Google Scholar] [CrossRef]
  66. Maestre, F.T.; Bowker, M.A.; Puche, M.D.; Hinojosa, M.B.; Martínez, I.; García-Palacios, P.; Castillo, A.P.; Soliveres, S.; Luzuriaga, A.L.; Sánchez, A.M.; et al. Shrub encroachment can reverse desertification in semi-arid Mediterranean grasslands. Ecol. Lett. 2009, 12, 930–941. [Google Scholar] [CrossRef] [PubMed]
Figure 1. Study area and fieldwork. (a) the location of QMNP; (b) the defined study area in this study based on QMNP; (c) distribution of field sampling points.
Ijgi 13 00117 g001
Figure 2. Workflow of spatiotemporal dynamics extraction and analysis of land desertification.
Ijgi 13 00117 g002
Figure 3. Accuracy evaluation of six classifiers under different combinations of features.
Ijgi 13 00117 g003
Figure 4. Classification results of RF, CART, and GTB algorithms in 2023. a (Halten River), b (Danghe River), c (Hala Lake), d (upper reaches of Shule River), and e (non-desertification area) represent the typical cases for regional comparison.
Ijgi 13 00117 g004
Figure 5. Regional comparison of model classification results. (a) Halten River; (b) Danghe River; (c) Hala Lake; (d) upper reaches of Shule River; (e) non-desertification area.
Ijgi 13 00117 g005
Figure 6. Spatial distribution of land desertification from 1988 to 2023.
Ijgi 13 00117 g006
Figure 7. Proportion of land desertification area in different degrees from 1988 to 2023.
Ijgi 13 00117 g007
Figure 8. Spatial change trends of land desertification in various periods.
Ijgi 13 00117 g008
Figure 9. The Sankey map showing the area of transition between different degrees of desertification (unit: km2) in each period drawn by the “Origin 2022 SR1” software.
Ijgi 13 00117 g009
Figure 10. Gravity center migration of different desertification levels. (a) Light. (b) Moderate. (c) Severe. (d) Extremely severe.
Ijgi 13 00117 g010
Table 1. Classification system of land desertification degree in QMTPs.
DegreeFVCQuicksand RatioDrone Aerial PhotographySentinel-2
(Nir, Red, Green)
Light≥50%
(fixed sandy land)
Ijgi 13 00117 i001Ijgi 13 00117 i002
Moderate30~50%
(fixed sandy land)
5~10%Ijgi 13 00117 i003Ijgi 13 00117 i004
Severe10~30%
(semi-fixed sandy land)
10~30%Ijgi 13 00117 i005Ijgi 13 00117 i006
10~30%
(semi-bare sandy land)
Ijgi 13 00117 i007Ijgi 13 00117 i008
Extremely severe<10%
(mobile sandy land)
>50%Ijgi 13 00117 i009Ijgi 13 00117 i010
<10%
(bare gravel sandy land)
Ijgi 13 00117 i011Ijgi 13 00117 i012
Table 2. Classifier parameter settings.
ClassifierParameter
CARTmaxNodes = null, minLeafPopulation = 1
RFnumberOfTrees = 800
SVMkernelType = RBF, gamma = 10, cost = 0.5
MDmetric = Euclidean, kNearest = 1
KNNk = 10
GTBnumberOfTrees = 160
Table 3. Detailed information of accuracy evaluation for Classifiers.
IndexExpressionExplain
OA i = 1 n p i i N The ratio of the number of samples to the correct sample to the total number of samples
Kappa N i = 1 n p i i i = 1 n p i + × p + i N ² i = 1 n p i + × p + i Measuring the consistency of classification results
Precision p i i p i + The ratio of the number of samples classified as positive in a certain category to the actual number of samples in the category
Recall p i i p + i The ratio of the actual number of samples in a certain category to the number of samples classified into this category
F1 P r e c i s i o n × R e c a l l P r e c i s i o n + R e c a l l × 2Harmonic average of recall and precision
Macro F1 i = 1 n F 1 n Average F1 scores for each category
Note: n is the total number of columns of the confusion matrix; pii is the number of correctly classified samples in the i-th row and i-column of the confusion matrix; pi+ and p+i are the total numbers of samples in the i-th row and i-column; N is used for verification the total number of samples.
Table 4. Land desertification area from 1988 to 2023 (area in km2).
YearLightModerateSevereExtremely SevereTotal
19881061.531262.806632.263614.3512,570.95
1993842.68886.777093.574184.5413,007.56
1998704.54633.834548.583807.459694.39
2003838.991149.625991.693027.0911,007.39
2008774.01749.316930.503888.9812,342.81
20132098.082423.169192.943716.8417,431.02
20181900.063176.929191.304733.9919,002.27
20232330.821942.916873.385750.2216,897.35
Table 5. Matrices of desertification and changes from 1988 to 2023 (area in km2).
NoneLightModerateSevereExtremely SevereTotal
None72,860.281227.13785.152347.252610.6179,830.41
Light293.70661.2196.1010.040.481061.53
Moderate208.68315.48495.12241.711.811262.80
Severe1473.61124.79559.103843.36631.416632.26
Extremely severe667.742.217.45431.032505.933614.35
Total75,504.012330.821942.916873.385750.2292,401.36
Disclaimer/Publisher’s Note: The statements, opinions and data contained in all publications are solely those of the individual author(s) and contributor(s) and not of MDPI and/or the editor(s). MDPI and/or the editor(s) disclaim responsibility for any injury to people or property resulting from any ideas, methods, instructions or products referred to in the content.

