
Research on the Spatial Network Structure of Tourist Flows in Hangzhou Based on BERT-BiLSTM-CRF

School of Earth Sciences, Zhejiang University, Hangzhou 310058, China
*
Author to whom correspondence should be addressed.
ISPRS Int. J. Geo-Inf. 2024, 13(4), 139; https://doi.org/10.3390/ijgi13040139
Submission received: 14 January 2024
/
Revised: 8 March 2024
/
Accepted: 19 April 2024
/
Published: 21 April 2024
Abstract
:Tourist flows, crucial information within online travelogues, reveal the interactive relationships between different tourist destinations and serve as the nerve center and link of the tourism system. This study takes Hangzhou, China, as a case to investigate the spatial network structure of its tourist flows. Firstly, a BERT-BiLSTM-CRF model and pan-attraction database are built to extract tourist attractions from online travelogues and create the tourist flow matrix. Then, this study uses social network analysis (SNA) to examine the structure of the tourist flow network from a county-level perspective. Additionally, GIS spatial analysis methods are applied to analyze the evolution of the tourist gravity center and standard deviation ellipse (SDE) of the network. The results reveal that the identification performances of the tourist flow extraction model this study proposed are significantly better than those of previous mainstream models, with an F1 value of 0.8752. Furthermore, the tourist flow network in Hangzhou displays a relatively sparse and unbalanced distribution, forming a “Core–Semi-Periphery–Periphery” structure. Lastly, from 2020 to 2022, the network’s gravity center experienced a shift towards the southwest, paralleled by an initial expansion and subsequent contraction of the SDE in the same southwest direction. These findings provide valuable insights into the spatial network structure of tourism in Hangzhou and can serve as a reference for policymakers to promote the “all-for-one” tourism.
1. Introduction
As a special social activity group flow, tourist flow, which refers to the movement of tourists within a region based on approximate tourism demands, reflects the relationship between the source and destination of tourists as well as other flows in tourism behaviors, such as information flow and material flow. Therefore, research on tourist flow has always been a crucial topic in tourism geography [1]. At the same time, with the growing presence of tourism elements in urban agglomerations, the city has gradually evolved into vital nodes and spatial conduits for tourist flows. Numerous scholars have conducted research on tourist flow for a long time, providing the foundation for improving urban tourism. This approach enables researchers and managers to gain a deeper understanding of the current state of tourism development, which can further have significant implications for regional coordination and high-quality development.
The research on tourist flow in Western tourism geography started in the 1960s and has been carried out mainly considering the spatial patterns [2,3], influencing factors [4], and forecast of the flow [5,6]. Research on tourist flows in China stared later, in the 1980s. It mainly focused on the spatial distribution [7], system research [8], and temporal evolution patterns [9]. In the early stage, the relevant research was relatively scarce, which mainly centered around basic concepts like tourism flow quantity and quality. Through the interdisciplinary application of various theories and methodologies such as econometric statistics, GIS analysis, regional economics, and physics, research on tourist flows has achieved significant advancements and established a relatively comprehensive research framework. It primarily encompasses the spatial structure of tourist flows, evolution mechanisms, influencing factors, flow effects and integration with other social hotspots. The spatial structure and spatio-temporal evolution of tourist flows are the fundamental aspects of tourism flow research. Yang et al. used the Zipf and variance indices to analyze the spatial structure and variance characteristics of tourist flows in Sichuan Province [10]. Li et al. assessed the spatial–temporal dynamic evolution of inbound tourist flows in Chinese tourist hotspots from 1998 to 2008 using a gravity model [11]. Mou et al. proposed a novel research framework for the space distribution and changes of tourist flow and study the structure of tourist flow in Shanghai [12]. Using hotspot analysis and kernel density estimation methods, Scholz et al. explored the temporal variations in the spatial distribution of tourist flows extracted from Twitter data [13]. As research on tourist flow spatial structure grows, some researchers have begun to focus on the factors affecting tourist flows. Taking the Beijing–Shanghai high-speed railway line as an example, Wang et al. explored the influencing factors of transportation on the spatial structure of tourist flows [14]. Chen et al. explored the factors influencing the structure of tourist flows using linear weighted regression methods [15]. In terms of impact effects, María et al. introduced an augmented gravity model to probe whether tourist traffic affects international trade [16]. Yun et al. analyzed the effect of tourist flow on province-scale food resource spatial allocation in China [17].
The research of the structure of tourist flows is the basis for other tourist flow studies and is of great importance for the spatial study of tourism. However, with the ongoing expansion of tourist destinations, the structure of tourist flows tends to become progressively more complex and networked. Therefore, a different perspective from existing ones is needed to elucidate these inherent network properties within the tourism phenomenon. Since the 21st century, social network analysis (SNA) has been introduced into tourist flow research by both domestic and international researchers. SNA is a method grounded in social network theory, used to study the complex interactions among individuals [18]. With this method, researchers can explore the tourist flow network between different destinations [19]. Wu et al. used SNA to examine the structural characteristics of the inbound tourist flow network between Beijing and Shanghai and explore its relationship with the aviation network [20,21]. Yan et al. conducted a comprehensive investigation into the spatial network characteristics of tourist flows in Luoyang [22] and further delved into the dynamic mechanism of city domestic tourist flows space base on this research. Zeng et al. identified five distinct flow network patterns of Chinese tourists in Japan from a SNA perspective [23]. Yu et al. chose SNA to learn the network structure and probe into the features of tourist flow network characteristics in Guilin [24]. However, these previous studies demonstrate a gap where the spatial differences and changes in the networks are somewhat unclear due to the weakness of SNA for deep spatial analysis. In these studies, GIS analysis methods are often confined to surface-level representations, with limited use of GIS-related analysis modules [25,26]. Therefore, there is a need to integrate appropriate geographic approaches with SNA to better delineate spatial variations in tourist flows.
In terms of research data, with the rapid development of digital technology, tourism digital footprint data was used to accurately and quantitatively reflect the structure and spatio-temporal evolution of tourist flow networks. Mou et al., collecting the online travelogues from 2012 to 2018, analyzed the spatial network patterns of tourist flows in Qingdao [27]. Li et al. incorporated Weibo check-in data during the National Day holiday to study the network structure and spatial distribution of tourist flow in China [28]. Wang et al., using cellular signaling data and SNA method, compared the residents and non-local tourist flow networks in Nanjing [29]. Online travelogues, a type of tourism digital footprint data, have been widely used by researchers due to the wealth of information they contain [30,31]. However, the increasing volume of data has highlighted certain limitations of online travelogue data, such as a lack of structure and high redundancy, which researchers must process [32]. In existing domestic research, this process is mainly limited to manual identification [33,34], which is time-consuming and labor-intensive. Some studies rely on manually determining keyword matches for identification [22,26] but encounter issues such as imperfect rules and incomplete information extraction. Hence, there is an urgent need to explore a more efficient and accurate method to deal with online travelogues. Named entity recognition (NER) models based on deep learning (DL), which can rapidly and accurately extract specific named entities from massive unstructured texts, have been introduced in geography. Wang et al. proposed a Neuro-net Toponym Recognition Model for extracting locations from social media messages and then conducted comparisons with different models to confirm the superiority of deep learning [35]. Zhang et al. proposed a RoBERTa-BiLSTM-CRF model to extract tourist attractions from tourism notes, which achieved an F1 value of 0.7141 [36]. However, progress has been relatively slow in the application of deep learning for the processing and analysis of data in the network structure of tourist flow research.
In terms of research scale, the research on the network structure of tourist flows can be broadly divided into national-scale, regional-scale, urban-scale and individual scenic spots. Shi et al. took 21APEC countries (regions) as the research area and analyzed the APEC tourism flow network from 2008 to 2018 [37]. Peng et al. focused on the tourist flow networks from a cross-provincial boundary perspective and explored the distribution and influencing factors of them in the Lugu Lake areas [38]. Wang et al. compared the evolution characteristics of the tourism flow network structure between the whole region and the central urban area of Wuhan [39]. In general, studies at different scales are relatively comprehensive. However, an absence is noticeable on the urban scale, as much of the spatial network structure analysis of tourist flows is directly based on the tourist attractions extracted from online travelogues, rather than place them at the county level. This approach neglects a broader county-level view, leading to potential exclusion of certain areas from the tourist flow network of the city. This limitation largely arises owing to the extraction of tourist nodes, where less visited nodal points are typically omitted in order to enhance the clarity of social network analysis. These neglected nodes are often scattered on the periphery of core tourism regions, whereas the retained visited tourist nodes are mainly clustered in particular core areas. For instance, in Hangzhou, well-attended sites—which show strong results in SNA—are mainly located in Xihu District and Shangcheng, while Qiantang District and Fuyang have no tourist nodes [40]. Moreover, “all-for-one tourism”, proposed in 2016 in China, seeks to surpass traditional sightseeing limitations and envisions expansive regional tourism areas to enhance the sustainability of tourism development [41]. This has designated two rounds of national demonstration zones for “all-for-one” tourism at the county level. Therefore, it is more meaningful to conduct research on the structure of urban tourist flow networks from a county-level perspective.
Hangzhou, celebrated as a captivating mix of China’s natural beauty and cultural heritage, attracts visitors from all over the world. However, the city’s current tourism development faces some challenges such as the uneven growth and less development in outer regions. There seems to be a noticeable gap in academic research from the county level to analyze Hangzhou’s tourism flow network patterns. This lack of finer-scale analysis limits our understanding of the broader tourism growth in Hangzhou, possibly influencing the progress of the “all-for-one” tourism approach.
To address these issues, this study first constructed a BERT-BiLSTM-CRF model to extract and identify specific locations and scenic entities within online travelogues for Hangzhou. A pan-attraction database of Hangzhou was also created to facilitate the construction of the tourist flow matrix. Then, social network analysis and GIS spatial analysis were used to study the spatial network structure of tourist flows in Hangzhou, specifically at the county level. In addition to fixing the deficiency in existing research, this paper also provides a scientific basis for Hangzhou to make more rational decisions in aspects such as tourism spatial planning and tourism route designation.
2. Materials and Methods
2.1. Study Area
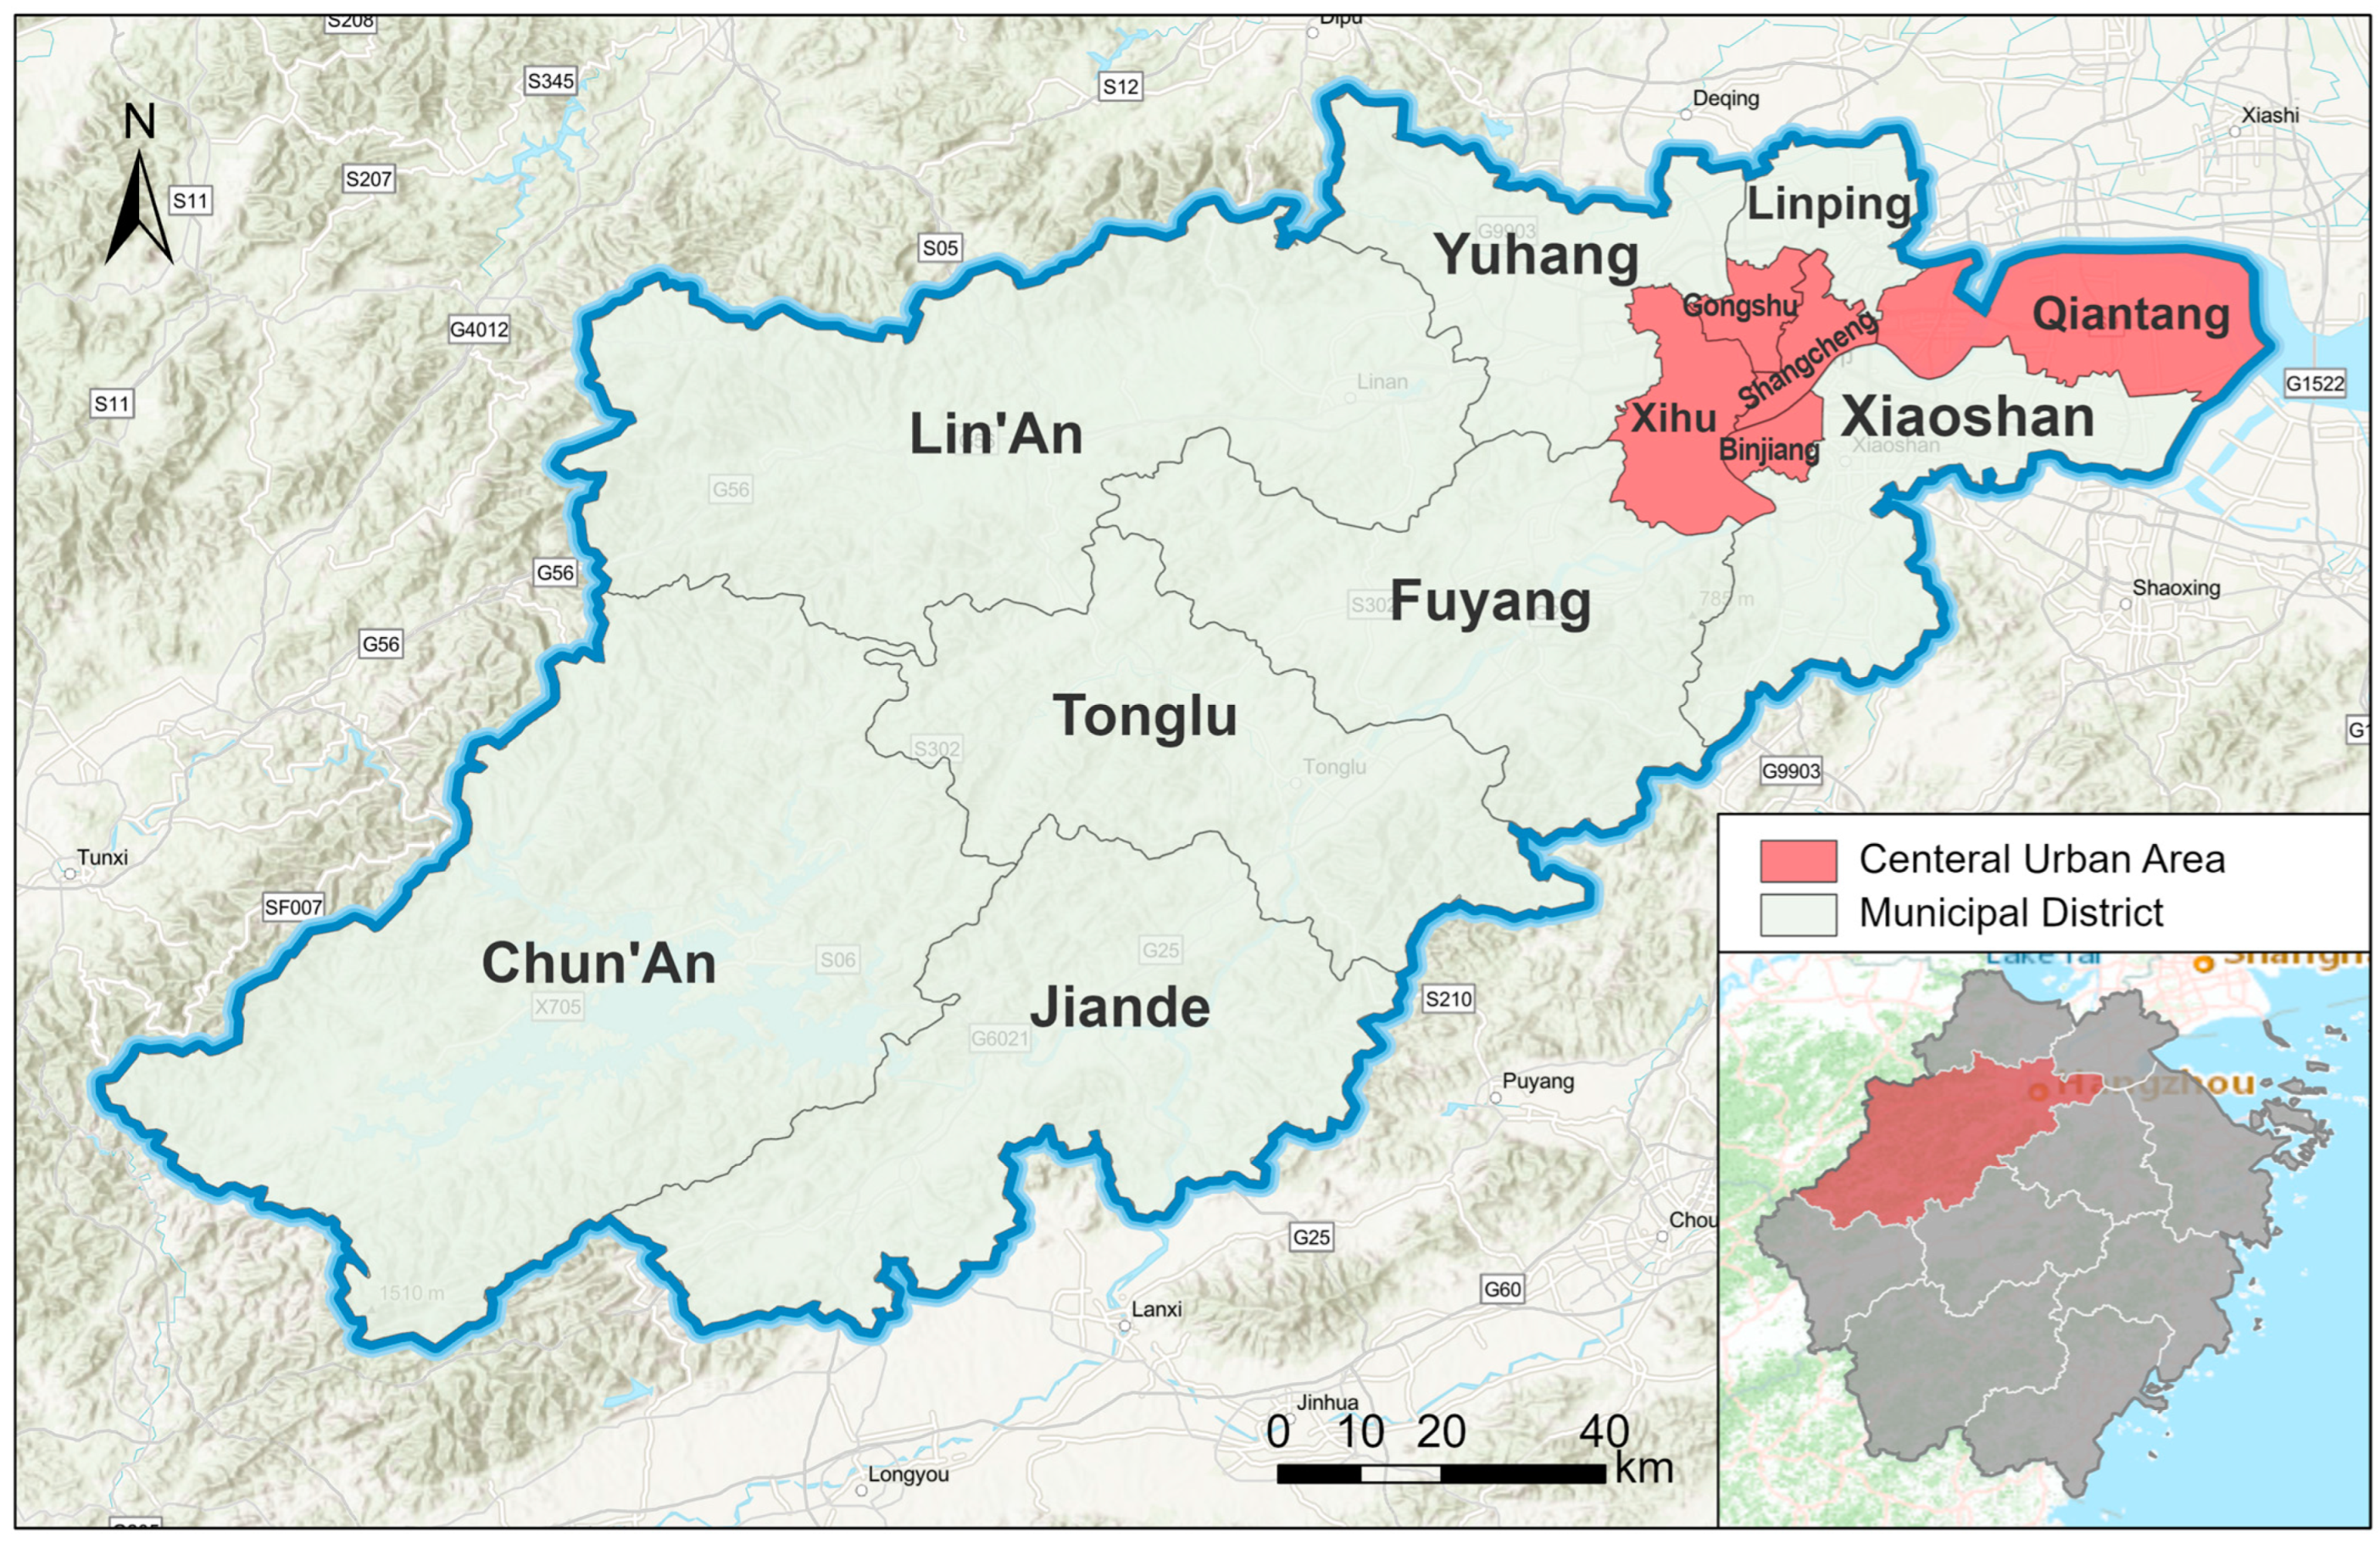
Hangzhou, located in the southern part of the Yangtze River Delta, is well-known for its abundant natural resources, picturesque landscapes, and rich historical and cultural heritage. It is positioned as a prominent tourism destination and serves as an example of Chinese “all-for-one” tourism practices. From 2015 to 2019, a significant surge was observed in Hangzhou’s total tourism revenue—it leaped from RMB 220.07 billion (approximately USD 31.44 billion, based on an exchange rate of USD 1 to RMB 7) to a staggering RMB 400.46 billion (roughly USD 57.21 billion). This remarkable upswing, almost 82%, unmistakably highlights a trend of vigorous development in Hangzhou’s tourism industry. In 2018, Hangzhou once again published pertinent opinions on “implementing the strategy for all-for-one tourism development”, aspiring to become a globally recognized center for tourism and leisure. This paper focuses on the 13 districts and counties of Hangzhou, namely Shangcheng District, Gongshu District, Xihu District, Binjiang District, Xiaoshan District, Yuhang District, Fuyang District, Lin’an District, Linping District, Qiantang District, Tonglu County, Chun’an County, and Jiande City, demonstrating a certain research representativeness (Figure 1).
First, the current “all-for-one” tourism development in Hangzhou is facing challenges due to disparities and diminished growth in peripheral regions. Particularly in the past three years, amidst the impact of the COVID-19 pandemic, there has been a noticeable trend of widening development gaps in the tourism industry among different counties, cities, and districts of Hangzhou. In 2022, Hangzhou accumulated a total tourism revenue of RMB 129.783 billion (around USD 18.54 billion), with nearly half—RMB 56.36 billion (around USD 8 billion)—originating from the central urban areas. In contrast, Jiande, a county-level city, contributed only RMB 5.2 billion (around USD 0.74 billion), positioning itself at the lower end of the revenue spectrum.
Second, Hangzhou serves as a good example of abundant tourism resources, both in quantity and quality, across its diverse regions. For example, Xihu District, boasting the highest concentration of tourism resources, has one scenic spot rated 5A and eight scenic spots rated 4A. In contrast, regions like Binjiang District and Qiantang lack any attractions rated 4A or higher. In 2021, a comprehensive census of cultural and tourism resources was undertaken in Zhejiang Province. This investigation identified a total of 4059 distinct tourist attractions in Hangzhou (Table 1), which were then divided into five grades (from 1 to 5) based on their Value and Influence Score (VIS). At the county level, a significant variation exists in the distribution of these resources. Traditional cultural and tourism clustering areas like Xihu District and Shangcheng harbor a superior quantity and quality of tourism resources. Conversely, regions such as Qiantang, Binjiang, and Linping have relatively fewer resources due to historical development, functional positioning, resource endowments, and spatial scale, suggesting need for improvement in tourism quality.
2.2. Data Sources
2.2.1. Online Travelogue Data
The study collected online travelogue data from tourism websites. To ensure the representativeness of the data, seven online travel platforms—Ctrip, Mafengwo, Qunar, Tuniu, Tongcheng, Qiongyou, and Lvmama—were handpicked. These choices were based on travel website ranking by Zhanzhangzhijia [42] “https://www.chinaz.com (accessed on 17 February 2023)”. With the help of the Octopus Collector, we used “Hangzhou” and its affiliated counties, cities, and districts as keywords to collect data for the years 2020, 2021, and 2022. In total, 1279, 1174, and 669 original travelogues for each of those years were collected, culminating in a total of 3122 travelogues. These travelogues cover all regions of Hangzhou and include information such as the title, author, travel time, text, and accompanying images. The data were then preprocessed, according to the following criteria: (1) removing duplicate, advertisement-oriented, or irrelevant travelogues; (2) excluding travelogues that primarily feature photo-sharing or have an insufficient word count; (3) removing travelogues where the exact travel time could not be identified; and (4) consolidating multiple travelogues published by the same author with continuous travel times. In the end, 1031 effectively refined travelogues were yielded.
2.2.2. Hangzhou Pan-Attraction Database
In today’s tourism industry, modern tourists are transitioning from traditional scenic spots to a variety of non-scenic destinations such as cultural landmarks and internet celebrity tourism spots [40]. To provide a more comprehensive and genuine representation of tourism activities, wider tourist attractions to Hangzhou were collected from both the Ctrip website and Autonavi Maps (Amap). By combining these data with the latest cultural and tourism resource survey data for Hangzhou, a pan-attraction database is established. This database includes eight distinct categories of tourism resources: landforms, bodies of water, organisms, celestial and climatic features, functional structures and contemporary, historical remains, cultural events and symbols, as well as cultural and tourism merchandise. Additionally, we utilize the Amap API to acquire county-level administrative subdivisions, thus crafting an inclusive dataset comprising a total of 6098 records.
2.3. Research Methods
2.3.1. Research Framework
The research framework of this study is depicted in Figure 2, consisting of three primary components: data collection, model identification, and spatial network analysis.
2.3.2. BERT-BiLSTM-CRF Model
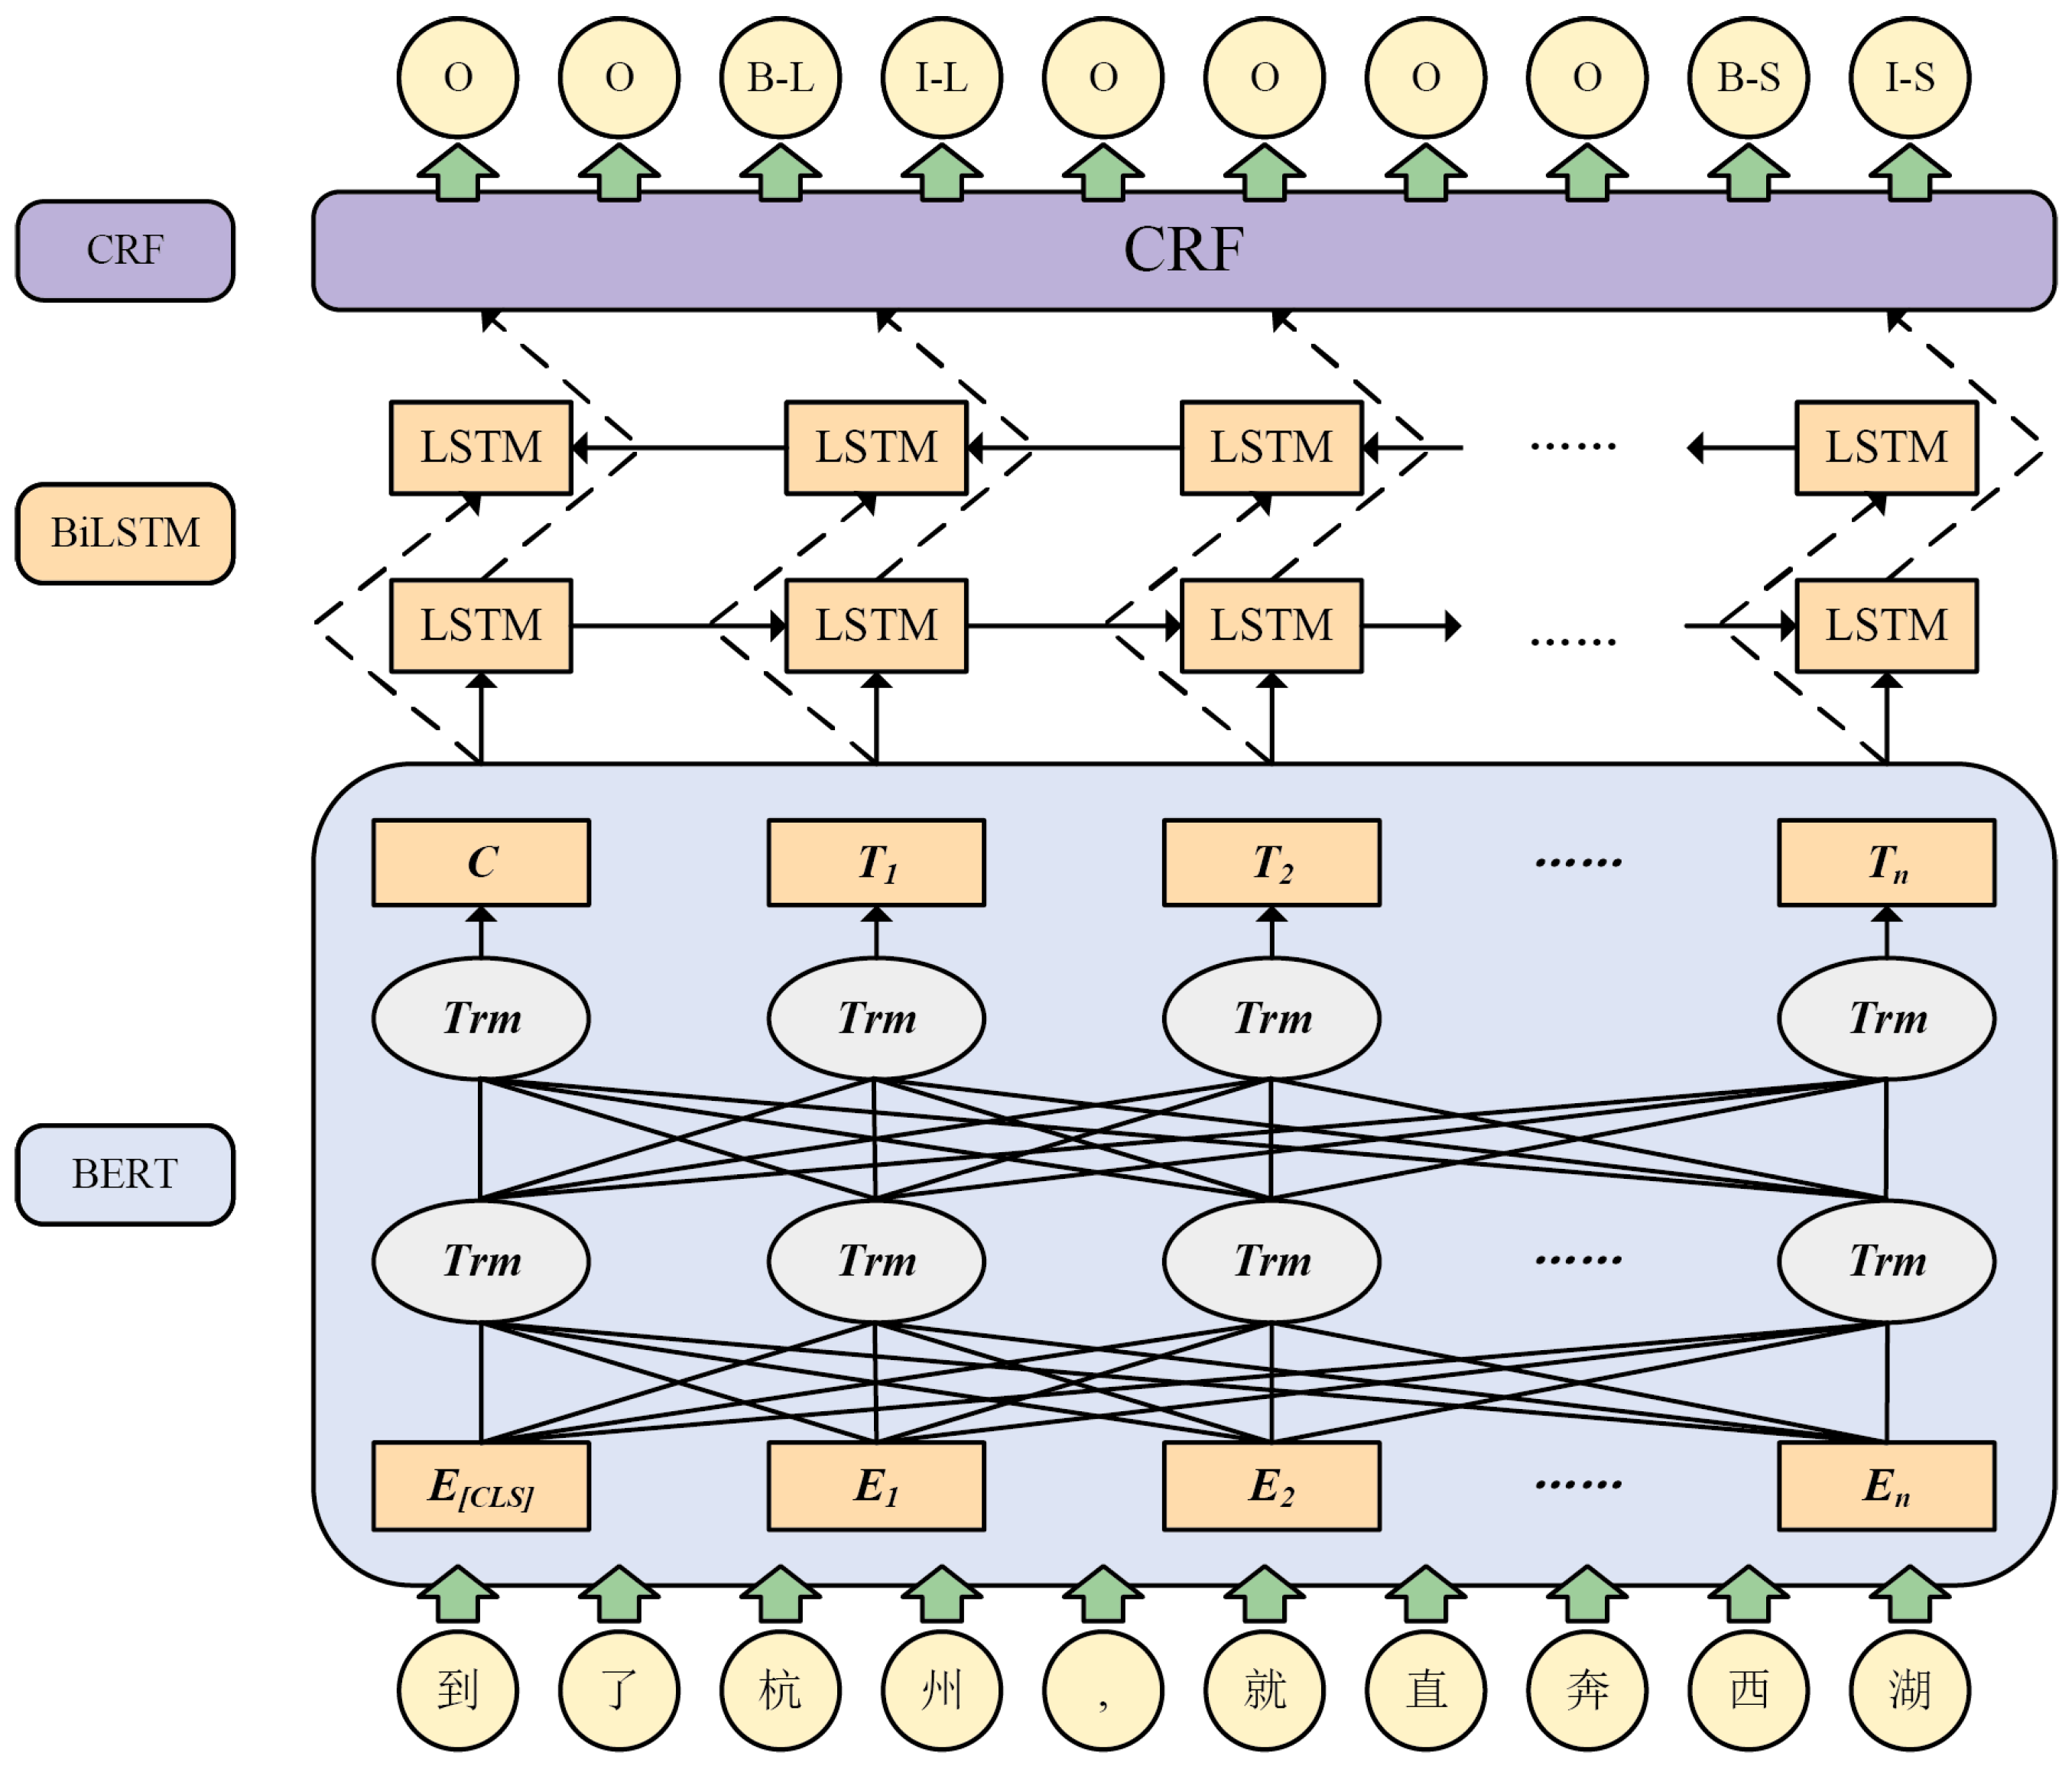
Named Entity Recognition (NER) is a fundamental task in natural language processing. It aims to identify entities such as personal names, locations, and organizations, within a specified body of text. In the context of online travel journals, the term “scene” represents a specific category of these named entities. However, manual identification of these tourism-related entities can become quite laborious due to the inherent redundancy in unstructured travelogue data and the commonality of alternate names for many attractions (for instance, “Lingyin Temple” is also referred to as “Yunlin Temple”). The BiLSTM-CRF model, derived from deep learning, possesses robust generalization and precision capabilities, adeptly negotiating complexities like polysemy. Unlike manual, rule-dependent, or machine learning methods, it negates the necessity for painstaking manual feature extraction, thereby saving substantial time. While the conventional BiLSTM-CRF model typically depends on word2vec for word-level representation, the more recently introduced BERT model by Google has displayed superior proficiency in extracting inter-word information. The BERT-BiLSTM-CRF model outperformed the word2vec-based BiLSTM-CRF, achieving F1 scores of 94.65% and 95.67% on the MSRA and People’s Daily corpora, respectively [43]. Therefore, this paper deploys Python 3.8 and Tensorflow 2.5.0 to construct a BERT-BiLSTM-CRF model aimed at entity recognition in travelogue texts.
The BERT-BiLSTM-CRF model consists of three main modules [36,43,44,45,46] (Figure 3). The input layer, powered by the BERT model, utilizes a bidirectional Transformer encoder to extract dynamic word vector information from pre-trained input text. This information is then passed on to the BiLSTM layer. The intermediate BiLSTM layer, a bidirectional long short-term memory network, further processes the pre-trained word vectors to extract essential text features, highlighting key features for entity recognition and disregarding irrelevant ones. The output layer, a Conditional Random Field (CRF) layer, takes the score matrix output from the BiLSTM layer. It determines the optimal predicted sequence based on the proximity of label relationships and produces results that strictly adhere to the format of the entity categories.
In particular, the proposed model for the named entity recognition in online travelogues introduces a corpus dataset during the fine-tuning stage to improve the performance, due to the distinctive features and distribution of landmark names compared to regular named entities. The corpus dataset used for fine-tuning is derived from online travelogue data collected through previous web crawling efforts. The procedure is detailed as follows: (1) employing regular expressions to eliminate extraneous symbols from the original travelogues and (2) segmenting the travelogues into sentences. After sentence segmentation, 254,971 sentences were obtained. A randomly selected subset of these sentences is then manually annotated for model fine-tuning and performance evaluation. Finally, the fine-tuned model is used to recognize entities in all sentences.
In accordance with the research objectives, the labeled entities are classified into two categories: location entities (Location) and scenes (Scene). The adopted annotation methodology employs the BIO system, where B (Begin) indicates the start of a label, I (Inside) indicates the middle, and O (Outside) indicates the exterior. Consequently, five labels arise: “B-Location”, “I-Location”, “B-Scene”, “I-Scene”, and “O” (Table 2).
The selected performance evaluation metrics for the model include precision, recall, and F1 score. Higher metric values indicate improved performance. The calculation methods are as follows:
where represents the count of entities that are both actual and correctly identified; represents the number of entities that are actually present but not correctly identified; and represents the count of entities that are actually incorrect but identified by the model.
2.3.3. Social Network Analysis
Social networks are constructed by socially engaged individuals and their interconnected relationships [38,47]. Social network analysis (SNA) employs quantitative methods, such as graph theory and mathematical models, to study and describe these relationships. Implementing this approach to analyze tourist flows furnishes a macro-level comprehension of the transit and distribution activities of tourists among different tourist nodes. Furthermore, it also reveals the progression of the tourist network structure, providing a precise representation of the interconnections among various tourist nodes. Specific indicators and calculation methods for this approach are detailed in the book “An Introduction to Social Network Analysis [47]”. For this study, Ucinet 6.0 software and ArcGIS 10.6 are primarily employed to outline the overall network and node networks of tourist flows within the counties of Hangzhou.
2.3.4. Tourist Gravity Center Model
The concept of a geographic center originates from the concept of gravity center in Mechanics [48] and serves as a significant geographical analysis tool for studying spatial changes in various elements within a region accompanying its development. It can largely demonstrate the differences and spatial equilibrium of regional development. The tourist gravity center refers to the gravity center formed by substituting tourism statistical indicators for regional mass; in other words, the tourism attractions and repulsions in various directions in the regional space can be balanced at this point. The calculation methods are as follows:
where () represents the coordinates of tourist gravity center of Hangzhou in each year; () represents the geographic center coordinates, denoted by administrative centers in different regions; and represents the coreness of tourist network in various regions of Hangzhou.
2.3.5. Standard Deviation Ellipse
Standard deviation ellipse (SDE) is one of the classic methods for analyzing the directional characteristics of spatial distribution, which is used to measure the overall characteristics of spatial statistical distribution of geographical elements [49], such as centrality and directionality. Taking the major axis, minor axis, azimuth and eccentricity of a spatial distribution ellipse as the basic parameters, the calculation methods of SDE are as follows:
where () represents the coordinates of each regions of Hangzhou; represents the tourism weight in region () represents the center of the ellipse; ) means the coordinate deviations; is the azimuth of the ellipse; and represent the standard deviations of the major axis and minor axis of the ellipse; and represents the eccentricity of the ellipse.
3. Results
3.1. Model Results and Tourist Flow Network Construction
In the experiment, it is observed that choosing 4000 annotated sentences as a corpus and randomly dividing them into training, validation, and test sets in a ratio of 7:2:1 [50] leads to better recognition results with reduced annotation effort (Table 3).
The BERT model is an improvement over the word2vec model, which uses the mechanism of the Transformer model to better understand the meaning of words in their context. Table 4 shows the results of experiments using different models, including the BERT-BiLSTM-CRF model and another five mainstream methods of NER. As shown in Table 4, BERT-BiLSTM-CRF performs better in recognizing two types of entities than other models, with the most significant improvement in precision, recall and F1 values. Moreover, the result shows that setting the training iteration to 50 achieves the highest F1 values for locations and scenes in the test set. The macro-average F1 value for the entire dataset reaches 87.52%, accompanied by relatively low loss values, suggesting a well-fitted model. Compared with RoBERTa-BiLSTM-CRF, this method has a higher precision and F1 score and significantly reduces the train time, despite a slight lag in recall for Location entities. Therefore, BERT-BiLSTM-CRF has the ability to extract tourist nodes from web travelogue data and is used for subsequent experiments.
With the application of the well-refined BERT-BiLSTM-CRF model, tourism sites within all travelogues are identified following the authors’ narrative sequence. This exercise results in the recognition of 233,196 entities, revealing various tourist routes depicted in the travelogues, such as the “West Lake→Leifeng Pagoda→Hefang Street→Olympic Sports Center” trajectory. Within this sequence, three direct movements are observed: “West Lake→Leifeng Pagoda”, “Leifeng Pagoda→Hefang Street”, and “Hefang Street→Olympic Sports Center”. Subsequently, based on the principle of fuzzy matching and matching with the Hangzhou Pan-attraction Database, these identified routes were assigned to county-level administrative divisions. Finally, this process reveals two instances of direct movement between county (city, district) pairs: “Xihu District→Shangcheng District” and “Shangcheng District→Xiaoshan District”, both recorded as “1”. The movement “Xihu District→Xiaoshan District” is considered indirect and recorded as “0”.
Following the aforementioned recognition principle, a 13 × 13 directional tourist flow matrix is established, with the nodes represented by the 13 counties, cities, and districts in Hangzhou. In this matrix, rows represent the starting points for tourist routes, columns represent the points of destination, and a “1” is assigned for each instance of directional flow. According to software guidelines, an appropriate threshold is introduced, thereby converting the original matrix into a binary matrix. In the binary matrix, nodes with flows exceeding the threshold are marked as “1”, with the rest recorded as “0”. Through a series of iterative experiments, a threshold value of 7 is ultimately chosen for carrying out the social network analysis. This approach facilitates a more accurate determination of the central nodes and their mutual relationships within Hangzhou’s tourist flow network.
3.2. The Overall Network Structure Characteristics of Tourist Flows
3.2.1. Network Density and Average Distance
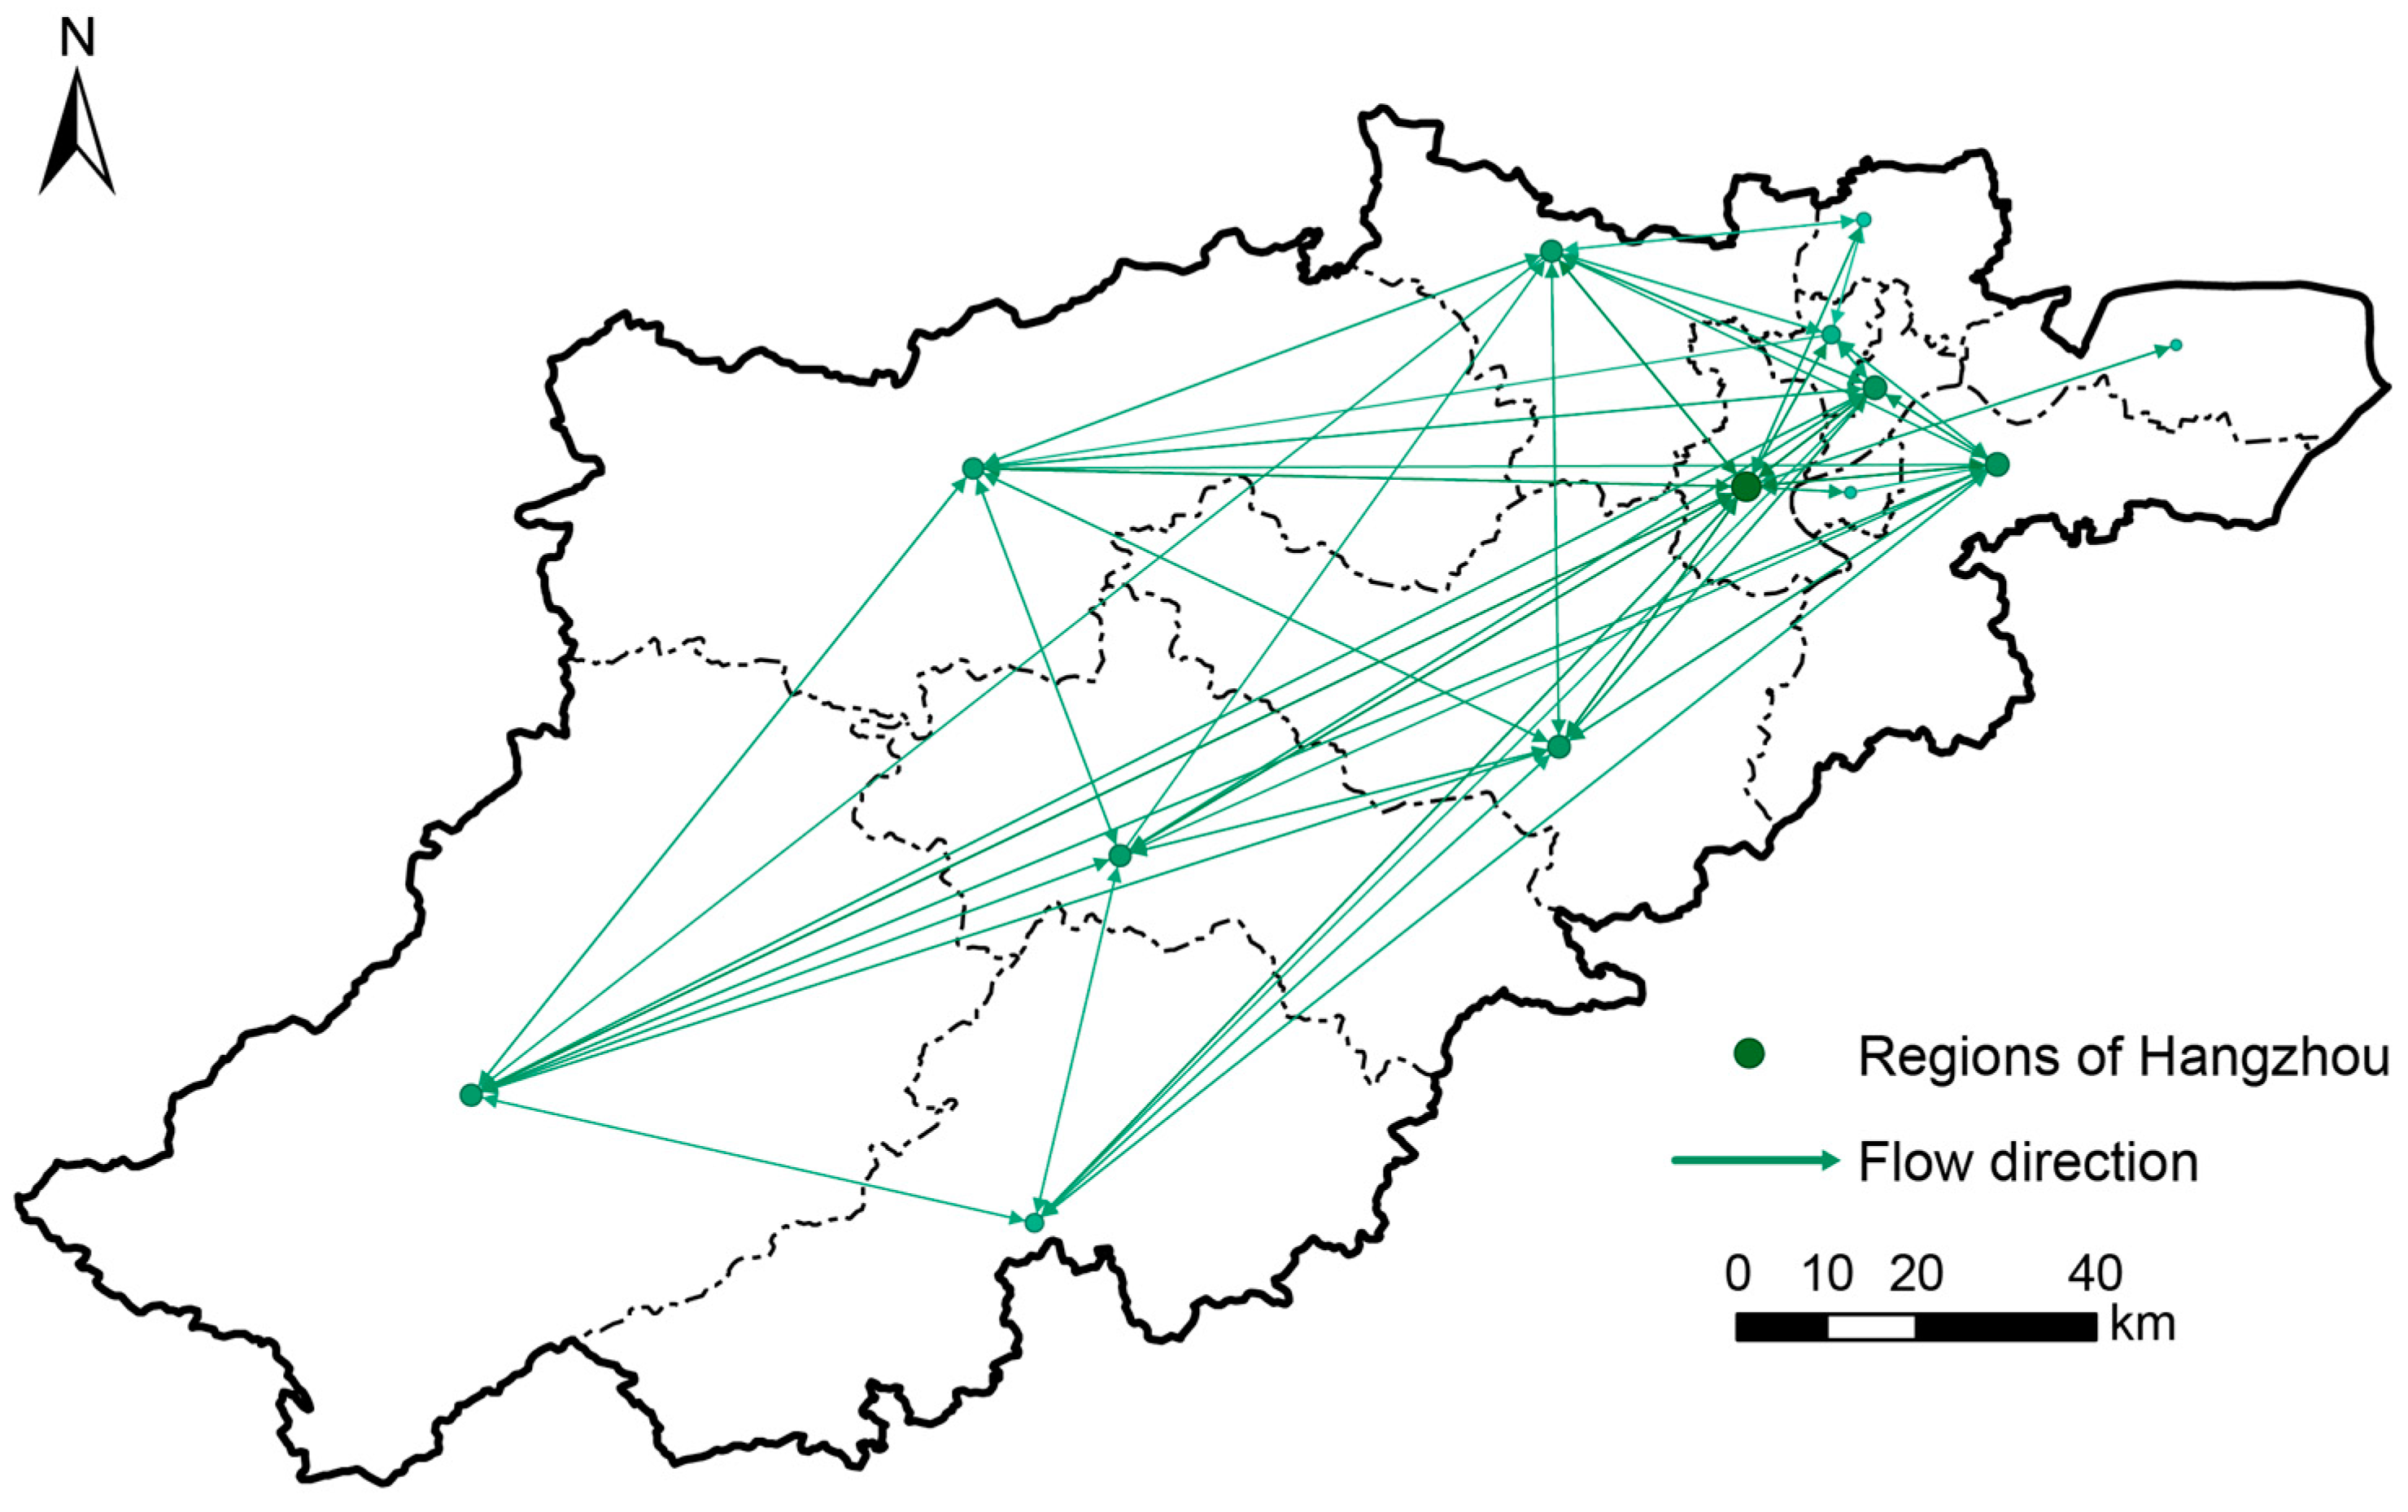
Network density serves as an indicator of the degree of interconnection among the nodes in a network. After analysis, it is found that a threshold value of 7 results in an optimal network structure, yielding a density of 0.532 (Table 5). The network has 83 directed relationships, which is less than the theoretical maximum of 156 connections among the 13 nodes. This suggests that the overall network density and strength in Hangzhou are comparatively low. As the threshold increases to 10, there follows a decline in the network density to 0.474, and a noticeable reduction in the actual relationships to 70. This reduction indicates that there is less flow and weaker connections between certain counties, cities, or districts, revealing an imbalance in the distribution of the network structure in Hangzhou. Figure 4 illustrates this tourist flow network at the county level in Hangzhou with the applied threshold. The size of the regional nodes shown in the figure represents the intensity of their connections with other regions. Some regions within the network exhibit relatively weak relationships. For example, Binjiang District is only associated with tourist inflow and lacks outflow. These observations highlight the requirement for enhanced collaboration and strengthening within the network.
As shown in Figure 4, a unique spatial pattern pertaining to the network density of tourism flow across Hangzhou county regions is apparent from 2020 to 2022. This pattern showcases an intensified density in the northeast juxtaposed with a relatively diminished density in the southwest. The prevailing pattern is mainly associated with Xihu District, as shown in Figure 5. Xihu District plays an important role in tourist flows, with frequent and noticeable interactions with four other regions. This can be attributed to its strong economy and abundant resources. In 2022, Xihu District witnessed a significant increase in the value-added of tertiary industry, escalating to RMB 1813.0 billion (roughly USD 259 billion). Meanwhile, it also boasts one 5A scenic spot, eight 4A scenic spots, and twenty-two 3A scenic villages in Zhejiang Province, establishing itself as an important tourism development center in Hangzhou. Additionally, it is observed that frequent tourist transfers occur between Chun’an and Jiande, as well as between Tonglu and Fuyang, due to their geographical closeness and convenient transportation links.
Signifying the mean number of shortest-path edges that interlink any two nodes within the network, the average distance stands as an indicator of network accessibility. Within the tourist flow network of Hangzhou, the average distance pegs at 1.468, complemented with a distance-based cohesion index of 0.766 (Table 5). The values inferred from these metrics collectively imply a well-interlinked network structure with a smooth overall flow. Even though some counties, cities, or districts may lack intimate connections, they still maintain relatively straightforward relationships. This facet accentuates a notable degree of accessibility across the network.
3.2.2. Graph Centralization
Graph centralization provides insights into the overall structure of a network, including three indicators: degree centralization, betweenness centralization, and closeness centralization. Degree centralization measures the extent of overall centralization throughout the network, while betweenness centralization identifies potential central nodes and cliques. Closeness centralization indicates the degree of variation among nodes. Meanwhile, in-degree and out-degree signify the network’s tendency for internal consolidation and outward divergence, respectively. According to Table 6, it is evident that both the out-degree centralization and in-degree centralization of the overall tourist flow network in Hangzhou stand at 0.507. In a fully connected pairwise network, the degree centralization is expected to equate to 0. This finding suggests an inconsistent regional distribution within Hangzhou’s tourist network. The closeness centralization for out-degree and in-degree reaches 0.679 and 0.675, respectively, indicating a clear trend of concentrated development in the network bearing recognizable central nodes. The betweenness centralization levels somewhat lower at 0.366, suggesting the existence of several regional nodes playing ‘middlemen’ roles to ensure effective connectivity between the core and peripheral network areas. These intermediary nodes should enhance their intermediary roles, collaborate with peripheral regions, and drive the launch of premium tourist routes to promote the high-quality development of tourism in Hangzhou.
3.2.3. Core–Periphery Model and Correlation Analysis
The results of the Core–Periphery Model (Table 7) further validate the earlier conclusions, outlining a “Core–Semi-Periphery–Periphery” structure based on coreness scores. Notably, Xihu District and Shangcheng attain a core status, given their coreness scores exceed 0.35, underscoring their significance as primary tourist destinations in Hangzhou. Fuyang, Tonglu, Xiaoshan, Chun’an, and Lin’an exhibit coreness scores above 0.30, placing them in a semi-peripheral role. Conversely, Yuhang, Gongshu, Jiande, Linping, Binjiang, and Qiantang occupy a peripheral position, displaying noticeable disparities in scores compared to the core zones. This suggests that the trickle-down effects from the core regions are limited, failing to effectively promote tourism development in the peripheral areas.
The quantity of cultural and tourism resources in each region is utilized as a measure of resource quantity, while the sum of cultural and tourism resources rated at levels 4–5 serves as an indicator of resource quality. With the assistance of SPSS 26.0, these elements are subjected to a Spearman correlation analysis alongside the core scores of each region. The results show a highly significant correlation (p < 0.01) between coreness and both resource quantity and quality. Specifically, the correlation coefficient associated with resource quantity is 0.913, and with resource quality, it is 0.746 (Table 8). This highlights the significant impact of resource conditions on the coreness scores of each region of Hangzhou, emphasizing the importance of resource endowment in regional tourism development. As a result, it is suggested that peripheral areas of tourists in Hangzhou should actively engage in collaborations with the core areas, leveraging the resource advantages of the core areas, enhancing their own tourist reception infrastructure, and benefiting from collaborative tourism development. Moreover, continuous exploration of unique resources, gradual adjustment in positioning, and leveraging the tourist flow network to attract more visitors should be part of their strategy. By aligning their development with the core areas, more new network cores can be established.
3.3. The Node Structure Characteristics of Tourist Flow Network
3.3.1. Nodal Flow Direction and Flow Rate
Through the analysis of original directional flows from online travel travelogues, Sankey diagrams are constructed to visualize the tourist movement across different districts and counties in Hangzhou (Figure 6). Xihu District and Shangcheng emerge as principal sources and destinations of the tourist flows, with a substantial number of movements between them. This pattern can be attributed to their mutual scenic attractions in the West Lake area and their close geographical adjacency. Additionally, frequent flows are observed between Xiaoshan, Yuhang, Gongshu, and the aforementioned districts. In contrast, regions like Fuyang, Lin’an, Tonglu, Chun’an, and Jiande show relatively diminished connectivity with the core districts. However, noticeable internal of tourist flows are detected within these five regions. Regions such as Binjiang, Qiantang, and Linping demonstrate restrained connectivity, potentially constrained by their respective tourism resource endowments, thus displaying less evident connections with other areas.
3.3.2. Point Centrality
Point centrality analysis is used to examine the specific role of nodes in social networks, involving three key metrics: degree centrality, betweenness centrality, and closeness centrality. Degree centrality measures the number of nodes that are directly connected to a particular node, which represents a local centrality index. Betweenness centrality characterizes a node’s ability to control connections between other nodes, while closeness centrality indicates how much a node can function independently from others.
By using Ucinet 6.0, a quantitative analysis of the nodes in the tourist network in Hangzhou is carried out, yielding the results as shown in Table 9:
In terms of average values of these metrics, each tourist node in the network is connected to approximately 6.385 other nodes and takes on an intermediary role approximately 5.615 times. The mean shortest distance to all nodes is 17.615, implying that the network density and strength are moderate overall. However, variance examination reveals an unbalanced distribution in the network strength across Hangzhou’s nodes. The variance of betweenness centrality stands at 13.024, the largest among the parameters, indicating a variance in the positions of nodes within the tourist network, with some nodes almost in isolation.
Reviewing specific scores, Xihu District emerges dominant across all three indicators, having the highest betweenness centrality and the lowest closeness centrality, indicating direct interaction with other nodes. As the primary hub for incoming and outgoing tourist flows (Figure 6), Xihu indisputably assumes a central role in Hangzhou’s tourist network. However, the tourist flow intensity between Xihu and other regions exhibits disparity, and Xihu appears to exert a comparatively limited impact on the peripheral areas. A notably high betweenness centrality score of 50.193 suggests that Xihu also plays a pivotal ‘middleman’ role, exerting considerable control over the tourist flow from other regions. Looking ahead, Xihu District should further explore its cultural and tourist potential, develop internationally appealing products, and amplify core strengths. This strategic direction would consolidate its role as an epicenter, driving optimization in Hangzhou’s overall tourist spatial dynamics.
The regions of Shangcheng, Xiaoshan, Fuyang, Tonglu, Chun’an, Yuhang, and Lin’an exhibit a relatively high degree of centrality and closeness centrality, indicating direct connections with most nodes and smooth tourist flows. These factors position them as secondary-level tourist nodes. As shown in Figure 6, these regions attract and channel a substantial number of tourists to and from Xihu District, collectively forming major tourist destinations in Hangzhou. As a strategy to enhance collaboration, these regions could improve the quality of tourism products, attract more visitors through economies of scale, and construct solid interconnections with peripheral areas. Specifically, Xiaoshan District demonstrates a substantial betweenness centrality of 6.850, taking the second position, emphasizing its potent control capabilities. Several regions lean on it as a crucial intermediary to forge connections with other areas. In contrast, Chun’an County, known for the 5A-level scenic spot Thousand Island Lake, exhibits a relatively lower betweenness centrality score of 1.376, ranking seventh. Its prominence within the network is not as distinguished.
The regions of Gongshu, Jiande, Linping, Binjiang, and Qiantang all bear inferior scores, with some even achieving a standing of zero. These nodes have limited influence across any given region, thus occupying a marginal position within the tourism network. Some are almost being identified as isolated nodes. For instance, Binjiang District merely boasts of a single linkage with Xihu. An urgent upgrade to the tourist infrastructure is vital for these domains. Furthermore, it is recommended that these peripheral regions connect with established tourist hotspots to co-develop tourism routes, subsequently integrating into the tourism network.
3.4. Tourist Gravity Center Distribution and Migration
The tourist coreness scores for each county and district are individually computed for the years 2020 through 2022, aiming to unveil the tourist gravity center in Hangzhou during this period (Table 10). The migration trajectory of the tourist gravity center is visualized using ArcGIS 10.6 (Figure 7).
From a spatial perspective, the tourist gravity center was located in Fuyang District, between 119.79° E and 119.87° E and 30.01° N and 30.07° N, in the southwest of Hangzhou’s administrative center (119.95° E, 30.11° N). This suggests that the overall tourist activity in the semi-peripheral regions of the southwest surpasses that of the northeast, despite the presence of core areas such as West Lake and Shangcheng District in the latter. From a temporal perspective, a discernible southwestward migration trajectory of the tourist gravity center was evident. From 2020 to 2021, it moved southwest from Fuchun Street to the junction of Fuchun Street and Chunjian Township, covering a distance of 1.147 km. From 2021 to 2022, it moved southwest continuously from Fuchun Street to Xindeng Town. The moving distance increased significantly to 8.74 km. The moving trajectory of the tourist gravity center indicates a more obvious tendency for the tourist network to move further into the suburban areas and away from central urban areas.
This shift can be largely attributed to the impact of the rapid development of COVID-19 in urban areas, becoming increasingly pronounced with its progression. Statistical data reveal a staggering increase in confirmed COVID-19 cases in Hangzhou, with the incidence rising over 40-fold in 2022 compared to 2021. Notably, 87.4% of cases were concentrated in the northeast. Driven by risk aversion tendencies, tourists show a strong preference for destinations perceived to have lower risk levels [51]. Moreover, tourists’ travel preferences have changed with the influence of the pandemic. Under the regular epidemic prevention, natural scenic destinations have emerged as tourism hotspots, particularly in the southwest of Hangzhou where attractions like Thousand Island Lake and Daciyan Scenic Spot are widely distributed.
3.5. Spatio-Temporal Analysis with the Standard Deviation Ellipse
To further illustrate the spatial characteristics of Hangzhou’ tourist network, SDE analysis was conducted for 2020, 2021, and 2022, as well as for the entire period of 2020–2022 (Table 11 and Figure 8).
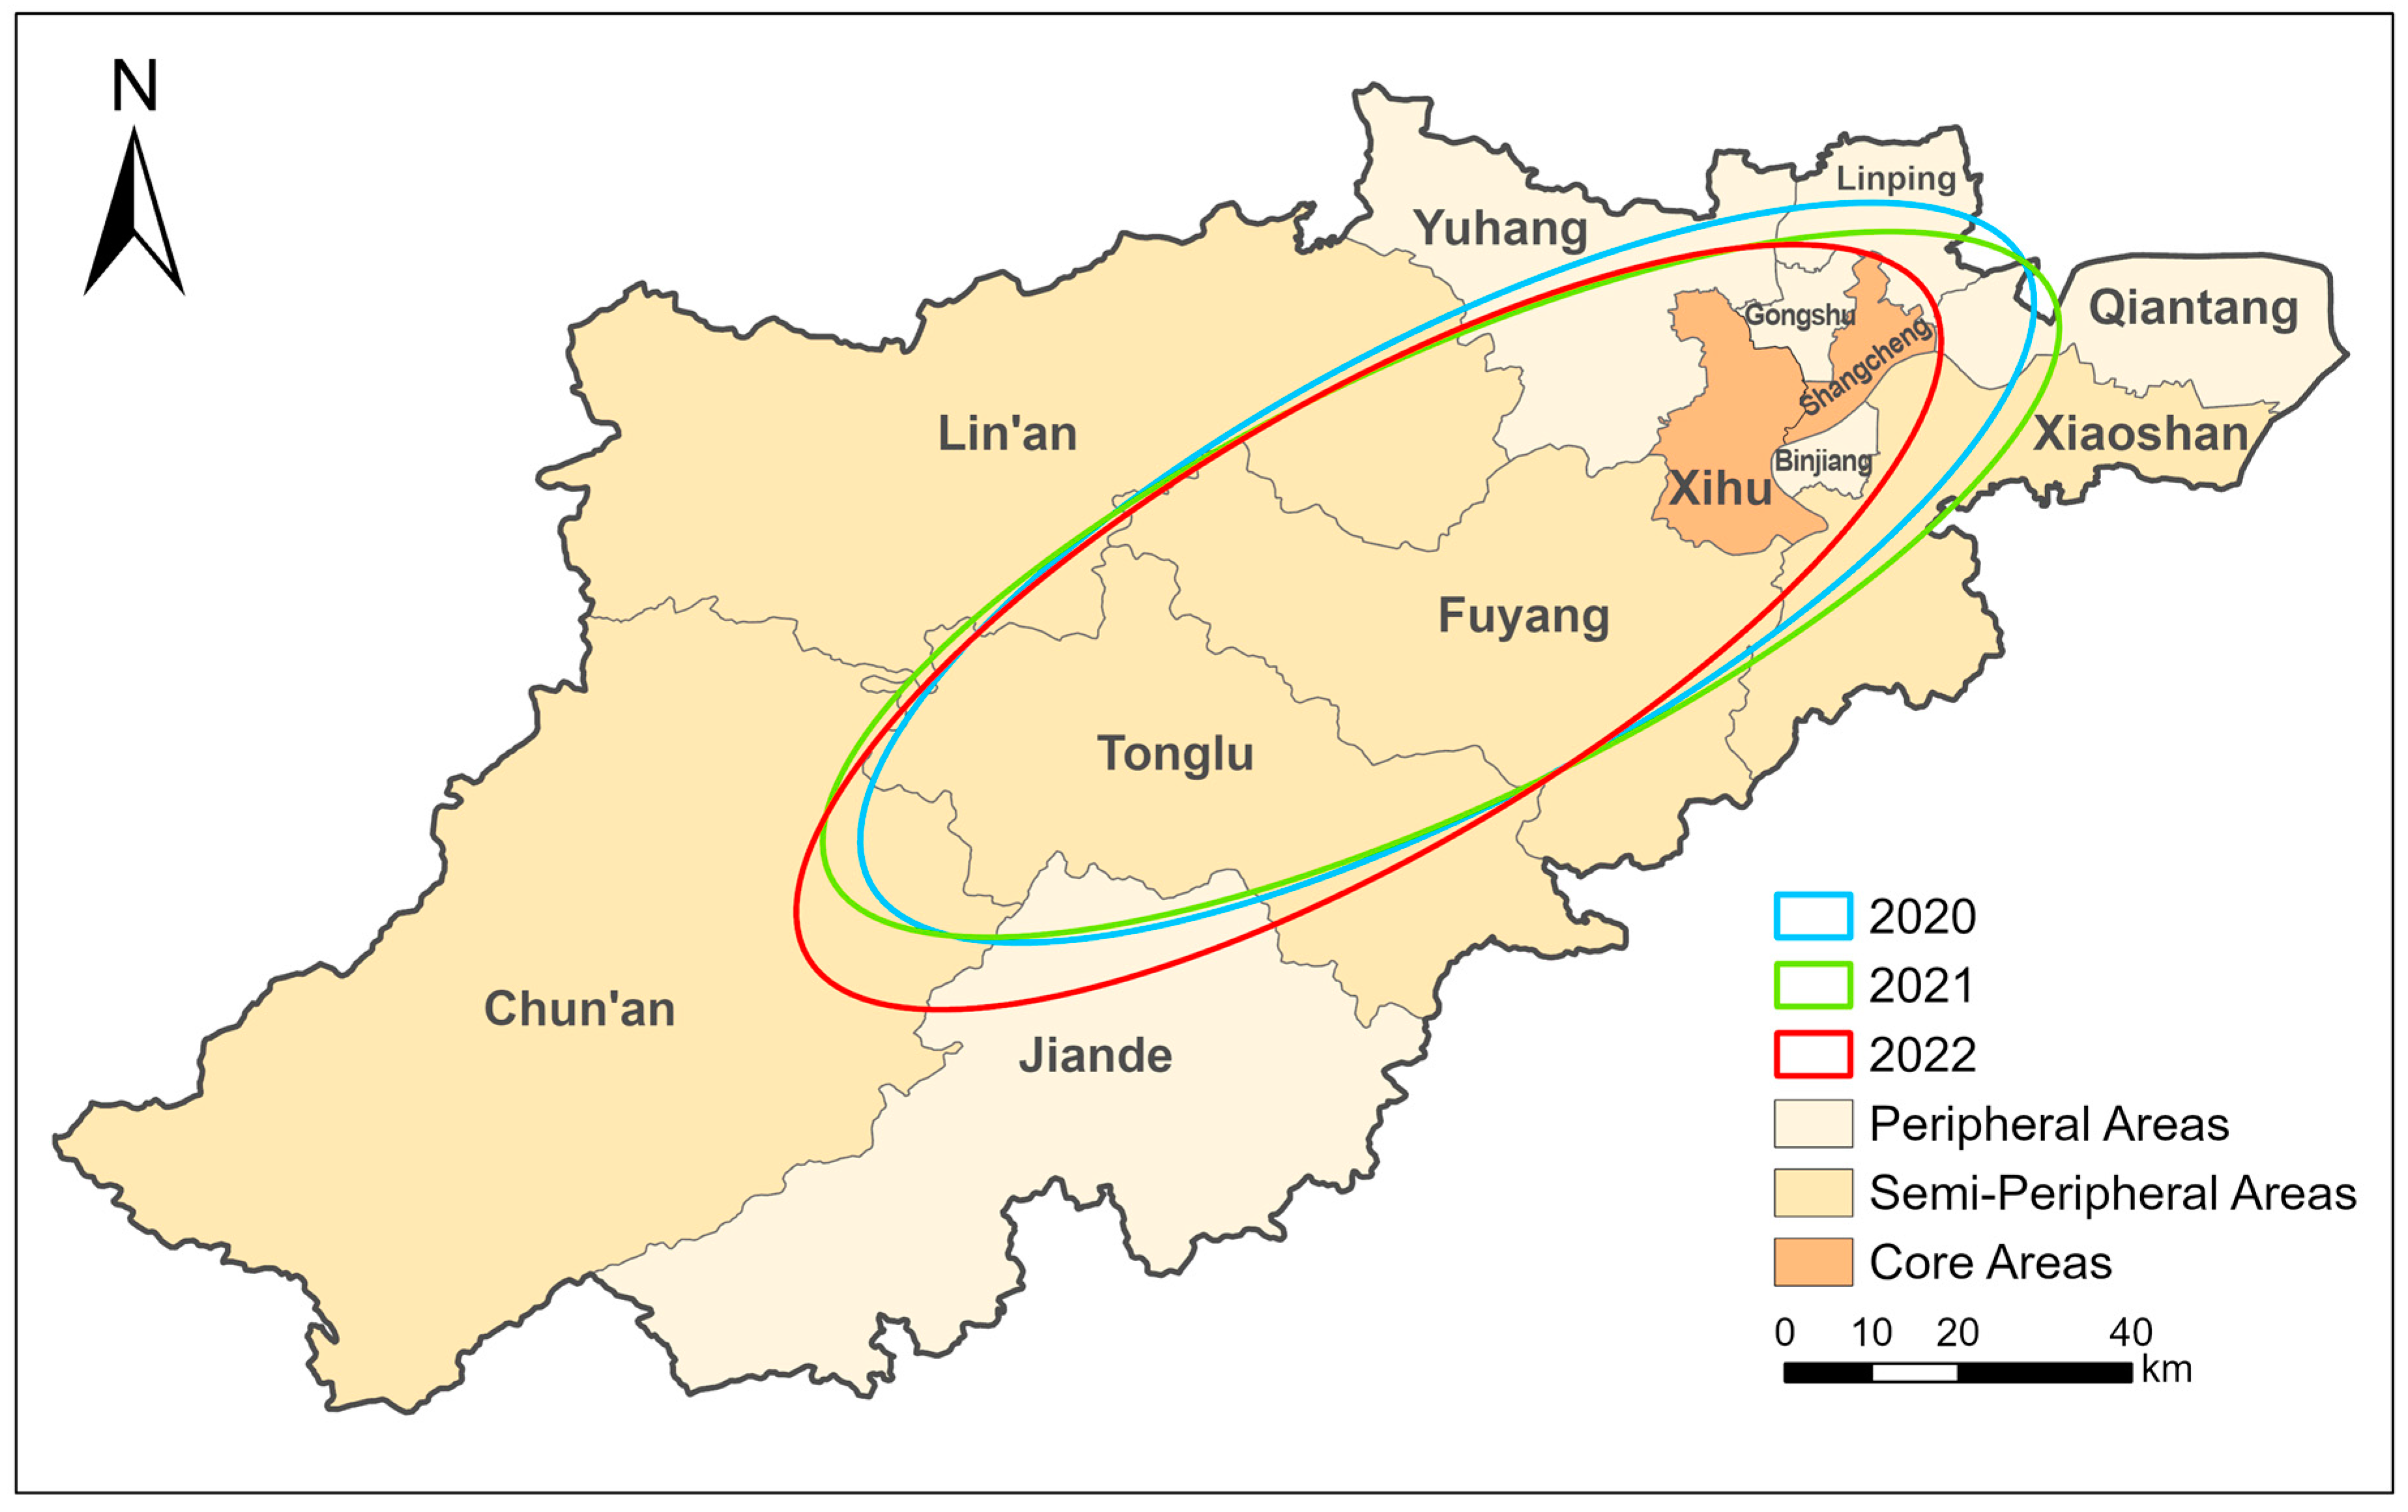
Throughout the years 2020 to 2022, the SDE of Hangzhou’s tourism network generally shows a “northeast–southwest” distribution. It mainly covers six districts and counties, including West Lake District, Shangcheng District, Gongshu District, Binjiang District, Fuyang District, and Tonglu County. From 2020 to 2021, the major axis increased from 67.96 km to 69.76 km, the minor axis decreased from 25.33 km to 24.65 km, and the angle of rotation increased by 3.24°. These changes indicate slight strengthening in the directional distribution of Hangzhou’s tourist network, particularly with more noticeable difference in the east–west direction. And there was a trend towards expansion, as indicated by the increased area of the ellipses. From 2021 to 2022, the major axis decreased by 1.9 km, the minor axis increased by 0.15 km, and the angle of rotation decreased by 5.48°. This suggests a more noticeable shift in spatial distribution during this period, with the disparities in the north–south distribution widening once again. The network demonstrates a tendency to contract towards the southwest direction, accompanied by a distinct reduction in ellipse areas.
The small expansion of the SDE areas from 2020 to 2021 is primarily due to the development of the pandemic, resulting in a reduction in tourist concentration trends and a shift towards dispersion. Conversely, the contraction towards the southwest regions of the SDE from 2021 to 2022 can be attributed to the changes in tourist preferences for travel behavior under the influence of the pandemic, resulting in a further decline in the status of the northeastern core areas.
4. Discussion
Drawing on travelogue data from tourism websites and BERT-BiLSTM-CRF Model deep learning models, this research studied the spatial structures of both the overall and nodal network of tourist flows in Hangzhou at the county level during the during the post-pandemic period from 2020 to 2022. GIS spatial analysis methods, such as the tourist gravity center model and standard deviation ellipse, were also employed to further elucidate the spatial difference within the network. In the following, we will discuss the characteristics of the key findings, research contributions, and limitations of this study.
- (1)
- More efficient methods for data processing and comprehensive extraction of data information
With the evolution of internet technology and data, an increasing amount of User-Generated Content data has been used in research on tourist flow. However, challenges such as data overload, complexity, and redundancy have limited the further application of tourism big data. This study, in contrast to traditional manual data processing methods [33,34], utilizes advanced deep learning techniques to recognize and extract extensive, unstructured web text data. In comparison with other mainstream models, the BERT-BiLSTM-CRF model demonstrates a higher F1 score of 87.52%, significantly enhancing the speed of information extraction while maintaining a high level of accuracy. This advancement can contribute to the efficacy of big data-driven research on tourism flows.
Moreover, as opposed to exclusively extracting data from a single website as seen in other studies, our research crawled data from seven different travel websites to ensure the authenticity of the tourist flow network structure. In contrast to other studies that are limited to researching A-level attractions, this study employs web crawling and on-site surveys to build a comprehensive database of attractions in Hangzhou. By incorporating popular online tourist destinations into our research, we have ensured a more accurate and reasonable identification of tourist node information.
- (2)
- The spatial structure of tourist flow networks from a county perspective
While previous studies on tourist flows in Hangzhou have mainly focused on analyzing individual attractions at a micro-level, this study aims to meet the growing demand of “all-for-one” tourism development and conduct the analysis from a county perspective. This analysis bridges the gap in the existing literature and provides valuable insights for urban–rural integration development.
As the findings reveal, the overall tourist flow network structure in Hangzhou is in line with previous studies, demonstrating a pattern of higher density in the northeast and lower density in the southwest. This pattern showcases a “core–semi-periphery–periphery” structural characteristic, which is significantly influenced by the quantity and quality of tourism resources.
However, the study reveals unique findings at the county level, which are distinct from those in other studies. Firstly, in past analyses of node networks, Thousand Island Lake has typically demonstrated a significant effect on tourist flow network [52]. However, despite housing this attraction, Chun’an County does not stand out within the network in Hangzhou. This may result from its relatively remote geographical location and the large scale of the Thousand Island Lake scenic area. Often, tourists opt to move between Thousand Island Lake and other attractions in Chun’an, rather than going to other districts and counties. This leads to Chun’an not appearing as closely linked to other areas from a county-level perspective. Secondly, despite Xiaoshan District’s lack of particularly prominent tourist nodes and fewer high-grade resources, its high betweenness centrality score suggests a significant position within the network. This could be attributed to Xiaoshan’s transportation hubs, such as Xiaoshan Airport and Hangzhou South Station. These instances underline the impact of infrastructure, regional connectivity, and other factors on individual positions within the network and overall network development, emphasizing the need for further exploration.
- (3)
- Geographical spatial distribution differences from 2020 to 2022
This research also utilizes the tourist gravity center model and SDE method to complement the analysis of the geographical spatial changes in the tourist network. The results show that the tourist gravity center of Hangzhou is mainly located in Fuyang District and has a significant southwest shift, especially from 2021 to 2022. The SDE exhibited successive expansions in the north–south and east–west directions. The overall size expanded slightly and then contracted significantly, indicating a phase of decentralization followed by centralization in tourism. This trend was not observed in previous studies on the structure of the tourism network of Hangzhou during the epidemic period. By combining these approaches, the temporal and spatial evolution of the tourist network can be comprehensively evaluated.
- (4)
- Limitations and Future research
At the same time, this research bears some limitations. Regarding the research data, online travelogue data are often subjective, influenced by the personal opinions and emotions of the writer, which may not reflect the actual situation or general consensus. Secondly, the accuracy and credibility of such data may be hard to verify. A travel blogger might embellish or omit certain details, leading to a skewed representation of a place. In our efforts to curb these issues, we undertook pre-processing measures to enhance the overall trustworthiness of the dataset. Lastly, access to data may be restricted by website policies, potentially leading to gaps in the dataset. As a result, the time range of this study is limited to 2020–2022, making comparative analysis of longer time series difficult.
Regarding the research content, in this study, a basic correlation analysis of the factors influencing the structure of the tourism network was conducted, and it was determined that the quantity and quality of tourism resources is an important factor. It was also found that the expansion of COVID-19 may largely change the tourist gravity center. However, the causal analysis of the structure of the network deserves closer observation in future research.
Future research could consider collecting more data from other social media platforms to explore the temporal evolution of tourism networks, such as the periods before, during, and after the epidemic. And it would be meaningful to further analyze the causal mechanisms and spillover effects for the spatial network structure of tourist flow.
5. Conclusions
Collecting online travelogue data from seven platforms between 2020 and 2022 and implementing the method SNA and GIS spatial analysis, this paper investigates the spatial structure of Hangzhou’s tourist flow network at the county level. Due to the large number of online travelogues and the difficulties in manual identification, the paper also introduces the BERT-BiLSTM-CRF model from deep learning to streamline data processing, which yields significant results. The specific conclusions are as follows:
Firstly, the BERT-BiLSTM-CRF model achieves an impressive F1 score of 87.52% during training, which outperforms other models and effectively identifies tourist entities in travel data. This highlights the model’s feasibility in tourist flow research, making it a reliable alternative to manual efforts. The successful use of deep learning methods in handling extensive data in the tourist flow domain provides valuable insights for future research.
Secondly, the distribution of the tourist flow network within Hangzhou’s counties is somewhat sparse and uneven, while presenting desirable accessibility. Geographically, it exhibits a distinct pattern of dense connections in the northeast and sparse connections in the southwest, indicating regional imbalances and a significant centralization trend. The structure follows a ‘core–semi-peripheral–peripheral’ pattern. Xihu and Shangcheng serve as core nodes, exerting strong dominance and fostering intimate ties with semi-peripheral areas. However, connections with peripheral areas appear weaker, resulting in limited trickle-down effects. Some regions, such as Qiantang District, have relatively few connections, even approaching isolation. During the year-to-year evolution of the tourism network, the network’s center of gravity has consistently shifted towards the southwest, largely influenced by the COVID-19 pandemic. Furthermore, the overall size of the network exhibits a pattern of slight expansion followed by contraction.
Finally, in light of the above conclusions, the study proposes several suggestions for regional development. For areas such as Xihu District and Shangcheng, which possess strategic positioning for high tourism development, a dual focus is needed: first, there is a need to improve the quality of tourism to build a global brand; second, there is a need for the initiative of enhancing the trickle-down effects by strengthening connections with peripheral areas. Semi-periphery regions should actively assume the role of the “middleman”, directing tourists towards peripheral areas to enhance network connectivity. Peripheral areas require swift enhancements to their infrastructure, collaboration with core regions to introduce high-quality tourist routes, and efforts to increase their visibility.
Author Contributions
Conceptualization, Danfeng Qi and Pingbin Jin; methodology, Danfeng Qi; software, Bingbing Wang and Qiuhao Zhao; validation, Danfeng Qi and Bingbing Wang; formal analysis, Danfeng Qi; investigation, Danfeng Qi, Pingbin Jin, Bingbing Wang, Qiuhao Zhao; resources, Danfeng Qi, Pingbin Jin, Bingbing Wang, Qiuhao Zhao; data curation, Danfeng Qi; writing—original draft preparation, Danfeng Qi; writing—review and editing, Danfeng Qi; visualization, Danfeng Qi; supervision, Pingbin Jin; project administration, Bingbing Wang; funding acquisition, Pingbin Jin. All authors have read and agreed to the published version of the manuscript.
Funding
This research received no external funding.
Data Availability Statement
The data presented in this study are available from the author upon reasonable request.
Acknowledgments
We thank the Hangzhou Municipal Bureau of Culture, Radio, TV and Tourism and the Hangzhou Municipal Bureau of Statistics for providing data support for this study.
Conflicts of Interest
The authors declare no conflicts of interest.
References
- Yang, X.Z.; Gu, C.L.; Wang, Q. Urban Tourism Flow Network Structure Construction in Nanjing. J. Geogr. Sci. 2007, 62, 609–620. [Google Scholar]
- Hills, T.L.; Lundgren, J. The Impact of Tourism in the Caribbean: A Methodological Study. Ann. Tour. Res. 1977, 4, 248–267. [Google Scholar] [CrossRef]
- Jansen-Verbeke, M.; Spee, R. A Regional Analysis of Tourist Flows within Europe. Tour. Manag. 1995, 16, 73–80. [Google Scholar] [CrossRef]
- Uysal, M.; Crompton, J.L. Determinants of Demand for International Tourist Flows to Turkey. Tour. Manag. 1984, 5, 288–297. [Google Scholar] [CrossRef]
- Witt, C.A.; Witt, S.F.; Wilson, N. Forecasting International Tourist Flows. Ann. Tour. Res. 1994, 21, 612–628. [Google Scholar] [CrossRef]
- Kulendran, N.; King, M.L. Forecasting International Quarterly Tourist Flows Using Error-Correction and Time-Series Models. Int. J. Forecast. 1997, 13, 319–327. [Google Scholar] [CrossRef]
- Zhang, L.Y. The Spatial Distribution Model of Tourism Flow: The Extension of Prolog Theory in Quantitative Research. Areal Res. Dev. 1988, 7, 41–42. [Google Scholar]
- Tang, S.T.; Guo, L.X. Research on Tourism Flow System. Tour. Trib. 1998, 3, 38–41. [Google Scholar]
- Zhu, T.L. Research on the spatiotemporal distribution of domestic tourism flow in Jiuhua Mountain. J. Anqing Norm. 1998, 4, 45–50. [Google Scholar]
- Yang, G.L.; Zhang, J.; Ai, N.S.; Liu, B. Zipf Structure and Difference Degree of Tourist Flow Size System: A Case Study of Sichuan Province. Acta Geogr. Sin. 2006, 61, 1281–1289. [Google Scholar]
- Li, C.X.; Ma, Y.F.; Zhang, Y.Y.; Gao, J. An Analysis of Space-time Dynamic Evolution and Dislocation of Inbound Tourism Based on Typical Cities—With the Gracity Model as an Empirical Research. Econ. Geogr. 2010, 30, 1372–1377. [Google Scholar] [CrossRef]
- Mou, N.; Yuan, R.; Yang, T.; Zhang, H.; Tang, J.; Makkonen, T. Exploring Spatio-Temporal Changes of City Inbound Tourism Flow: The Case of Shanghai, China. Tour. Manag. 2020, 76, 103955. [Google Scholar] [CrossRef]
- Scholz, J.; Jeznik, J. Evaluating Geo-Tagged Twitter Data to Analyze Tourist Flows in Styria, Austria. ISPRS Int. J. Geo-Inf. 2020, 9, 681. [Google Scholar] [CrossRef]
- Wang, D.G.; Chen, T.; Lu, L.; Wang, L.; ALAN, A.L. Mechanism and HSR effect of spatial structure of regional tourist flow: Case study of Beijing-Shanghai HSR in China. Acta Geogr. Sin. 2015, 70, 214–233. [Google Scholar]
- Chen, X.; Huang, Y.; Chen, Y. Spatial Pattern Evolution and Influencing Factors of Tourism Flow in the Chengdu–Chongqing Economic Circle in China. ISPRS Int. J. Geo-Inf. 2023, 12, 121. [Google Scholar] [CrossRef]
- Santana-Gallego, M.; Ledesma-Rodríguez, F.J.; Pérez-Rodríguez, J.V. International Trade and Tourism Flows: An Extension of the Gravity Model. Econ. Model. 2016, 52, 1026–1033. [Google Scholar] [CrossRef]
- Li, Y.; Zhou, B.; Wang, L.; Cheng, S. Effect of Tourist Flow on Province-Scale Food Resource Spatial Allocation in China. J. Clean. Prod. 2019, 239, 117931. [Google Scholar] [CrossRef]
- Wellman, B.; Berkowitz, S.D. Social Structures: A Network Approach; CUP Archive: Cambridge, UK, 1988; Volume 15, ISBN 0-521-28687-5. [Google Scholar]
- Zhang, Y.Y.; Gu, J.; Ma, Y.F. Tourist Flow: Research Progress, Evaluation and Outlook. Tour. Trib. 2013, 28, 38–46. [Google Scholar]
- Wu, J.F.; Pan, X.L. Characteristic of Beijing and Shanghai inbound tourists flow network. Sci. Geogr. Sin. 2010, 30, 370–376. [Google Scholar]
- Wu, J.F.; Pan, X.L. Study on the Relationship Between Inbound Tourism Flows Network and Aviation Network. J. Geo-Graph. Sci. 2010, 25, 39–43. [Google Scholar]
- Yan, S.S.; Jin, C. Characteristics of Spatial Network Structure of Tourist Flow in Urban Area of Luoyang. Sci. Geogr. Sin. 2019, 39, 1602–1611. [Google Scholar] [CrossRef]
- Zeng, B. Pattern of Chinese Tourist Flows in Japan: A Social Network Analysis Perspective. In Tourism Spaces; Routledge: London, UK, 2021; ISBN 978-1-00-315245-3. [Google Scholar]
- Yu, C.H.; Lian, T.H.; Geng, H.B.; Li, S.X. Analyzing the Structure of Tourism Destination Network Based on Digital Footprints: Taking Guilin, China as a Case. Data Technol. Appl. 2023, 57, 56–83. [Google Scholar] [CrossRef]
- Seok, H.; Barnett, G.A.; Nam, Y. A Social Network Analysis of International Tourism Flow. Qual. Quant. 2021, 55, 419–439. [Google Scholar] [CrossRef]
- Li, X.; Yao, J.S.; Liu, Y.L. Research on the Network Structure of Tourist Flow in Guilin Based on Online Travel Notes. J. China West Norm. Univ. 2023; accepted. [Google Scholar]
- Mou, N.; Zheng, Y.; Makkonen, T.; Tengfei, Y.; Tang, J.; Song, Y. Tourists’ Digital Footprint: The Spatial Patterns of Tourist Flows in Qingdao, China. Tour. Manag. 2020, 81, 104151. [Google Scholar] [CrossRef]
- Li, A.; Mou, N.; Zhang, L.; Yang, T.; Liu, W.; Liu, F. Tourism Flow Between Major Cities During China’s National Day Holiday: A Social Network Analysis Using Weibo Check-in Data. IEEE Access 2020, 8, 225675–225691. [Google Scholar] [CrossRef]
- Wang, L.; Wu, X.; He, Y. Nanjing’s Intracity Tourism Flow Network Using Cellular Signaling Data: A Comparative Analysis of Residents and Non-Local Tourists. ISPRS Int. J. Geo-Inf. 2021, 10, 674. [Google Scholar] [CrossRef]
- Fang, Y.L.; Huang, Z.F.; Li, J.L.; Cheng, X.L.; Su, X.Q. Research on the Spatial Differentiation and Effects of Network Structure in Tourism Flow in Chinese Cities: Big Data Mining Based on Ctrip. J. Nat. Resour. 2022, 37, 70–82. [Google Scholar] [CrossRef]
- Wang, R.Y.; Zhang, W.K.; Cheng, S.W. Study on the Changes of Spatio-temporal Characteristics of Tourism Flow in Guangzhou City Before and After. Tournal of Natural Science of Hunan Normal University. 2023, 46, 133–143. [Google Scholar]
- Zhu, H.; Long, J.Z.; Liu, J.M.; Zhang, S.Y.; Lin, S.R. Progress and Prospects of International Research on Tourism Flows from the Perspective of Big Data Applications. Tour. Hosp. Prospect. 2023, 7, 78–97. [Google Scholar]
- Ren, H.K.; Wei, W.; Wang, K.H. Structural Evolution of Tourism Flow Network in Ningxia Under the Influence of COVID-19. Arid Land Geogr. 2023, 46, 316–324. [Google Scholar]
- Liu, Y.; Teng, M.Q. The Structure of Night Tourism Flow Based on Tourism Digital Footprints: A Case of Guangzhou City. J. Northwest Univ. 2021, 51, 279–286. [Google Scholar]
- Wang, J.; Hu, Y.; Joseph, K. NeuroTPR: A Neuro-net Toponym Recognition Model for Extracting Locations from Social Media Messages. Trans. GIS 2020, 24, 719–735. [Google Scholar] [CrossRef]
- Zhang, C.; Zhang, Y.; Zhang, J.; Yao, J.; Liu, H.; He, T.; Zheng, X.; Xue, X.; Xu, L.; Yang, J.; et al. A Deep Transfer Learning Toponym Extraction and Geospatial Clustering Framework for Investigating Scenic Spots as Cognitive Regions. ISPRS Int. J. Geo-Inf. 2023, 12, 196. [Google Scholar] [CrossRef]
- Shi, J.Z.; Fan, Q. The Evolution and Influencing Factors of APEC Tourism Flow Network Structure. J. Nat. Resour. 2022, 37, 2169–2180. [Google Scholar] [CrossRef]
- Peng, H.; Zhang, J.; Liu, Z.; Lu, L.; Yang, L. Network Analysis of Tourist Flows: A Cross-Provincial Boundary Perspective. Tour. Geogr. 2016, 18, 561–586. [Google Scholar] [CrossRef]
- Wang, X.F.; Guo, Y.; Li, Y.S.; Zheng, W.S. Evolutionary Research on Network Structure of Urban Tourism Flow from a Multi-scale Perspective: A Case Study of Wuhan City. Areal Res. Dev. 2023, 42, 93–99. [Google Scholar]
- Li, J.; Ge, Y.H. Research on the Evolution of Urban Tourism Flow Network Structure Based on Digital Footprint—A Case Study of Hangzhou City. Resour. Dev. Mark. 2021, 37, 620–628. [Google Scholar]
- Gan, L.; Wen, Q.; Lev, B.; Jiang, W. Tourism Ecological Security Evaluation Based on Dynamic Super-Efficiency Network SBM from the Perspective of All-for-One Tourism. J. Clean. Prod. 2023, 429, 139333. [Google Scholar] [CrossRef]
- Wang, C.H.; Tang, C.S.; Qiao, H.H.; Zhang, W.; Xing, L.Y. Spatial Structure Characteristics of Rural Tourism Flow Based on Digital Footprint: Taking Huzhou City in Zhejiang Province for Example. Econ. Geogr. 2020, 40, 225–233. [Google Scholar]
- Xie, T.; Yang, J.A.; Liu, H. Chinese Entity Recognition Based on BERT-BiLSTM-CRF Model. Comput. Syst. Appl. 2020, 29, 48–55. [Google Scholar]
- Zhao, P.; Sun, L.Y.; Wan, Y.; Ge, N. Chinese Scenic Spot Named Entity Recognition Based on BERT+BiLSTM+CRF. J. Comput. Appl. 2020, 29, 169–174. [Google Scholar]
- Tang, J.Y.; Li, D.J.; Liu, B. Named Entity Recognition of Geographic Entity Based on BERT-BiLSTM-CRF Model. Beijing Surv. Mapp. 2023, 37, 143–147. [Google Scholar]
- Wu, K.H.; Zhang, X.Y.; Ye, P.; Zhang, H. A Chinese Address Resolution Method Based on BERT-BiLSTM-CRF. Geogr. Geo-Form. Sci. 2021, 37, 10–15. [Google Scholar]
- Liu, J. An Introduction to Social Network Analysis; Social Sciences Academic Press (China): Beijing, China, 2004. [Google Scholar]
- Fu, J.; Gao, Z.; Huang, L.; Zhang, L. The Movement Route of Consumption Gravity Center of Xinjiang from 1965 to 2009 Based on GIS. Procedia Earth Planet. Sci. 2011, 2, 321–326. [Google Scholar] [CrossRef]
- Duman, Z.; Mao, X.; Cai, B.; Zhang, Q.; Chen, Y.; Gao, Y.; Guo, Z. Exploring the Spatiotemporal Pattern Evolution of Carbon Emissions and Air Pollution in Chinese Cities. J. Environ. Manag. 2023, 345, 118870. [Google Scholar] [CrossRef] [PubMed]
- Deng, Q.K.; Li, X.L. Semantic Analysis of Chinese Location Based on BERT-BiLSTM-CRF Model. Softw. Guide 2022, 21, 37–42. [Google Scholar]
- Li, X.; Gong, J.; Gao, B.; Yuan, P. Impacts of COVID-19 on Tourists’ Destination Preferences: Evidence from China. Ann. Tour. Res. 2021, 90, 103258. [Google Scholar] [CrossRef]
- Dou, Y.; Li, J. Research on the Spatial Structure Characteristics of Hangzhou Tourism Flow Network Based on Network Big Data. J. Sichuan Tour. 2023, 74–80. [Google Scholar]
Figure 1.
Research area.

Figure 2.
Research framework.

Figure 3.
Framework of BERT-BiLSTM-CRF model.

Figure 4.
Overall network structure of tourist flow in Hangzhou (threshold value = 7).

Figure 5.
Original flow of tourism in Hangzhou. In the figure, dots represent the different county-level administrative divisions of Hangzhou. Larger, redder dots indicate stronger connections with other areas. Lines stand for the original tourism flow, with thicker, redder lines signifying heavier traffic.

Figure 6.
Sankey diagram of Hangzhou’s tourism flow. The left column indicates the places where tourists originate, and the right column represents the destinations where tourists arrive.
Figure 6.
Sankey diagram of Hangzhou’s tourism flow. The left column indicates the places where tourists originate, and the right column represents the destinations where tourists arrive.

Figure 7.
The moving trajectory of the tourist gravity center in Hangzhou from 2020 to 2022.

Figure 8.
The SDE changes in the tourist flow network in Hangzhou from 2020 to 2022.


Table 1.
Quantity and grading of cultural and tourism resources in different regions of Hangzhou.
| Grade 5 | Grade 4 | Grade 3 | Grade 2 | Grade 1 | Total C | |
|---|---|---|---|---|---|---|
| Shangcheng District | 8 | 24 | 133 | 115 | 124 | 404 |
| Gongshu District | 4 | 27 | 45 | 70 | 50 | 196 |
| Xihu District | 19 | 54 | 291 | 260 | 25 | 649 |
| Binjiang District | 2 | 3 | 17 | 35 | 58 | 115 |
| Xiaoshan District | 3 | 13 | 84 | 149 | 108 | 357 |
| Yuhang District | 78 | 16 | 55 | 123 | 109 | 311 |
| Fuyang District | 2 | 21 | 110 | 132 | 65 | 330 |
| Lin’an District | 4 | 22 | 74 | 144 | 103 | 347 |
| Linping District | 0 | 9 | 56 | 69 | 78 | 212 |
| Qiantang District | 0 | 2 | 10 | 26 | 47 | 85 |
| Tonglu County | 3 | 18 | 104 | 120 | 104 | 349 |
| Chun’an County | 3 | 15 | 151 | 170 | 57 | 396 |
| Jiande City | 5 | 11 | 101 | 124 | 67 | 308 |
| Total G | 61 | 235 | 1231 | 1537 | 995 | 4059 |
Data source: Hangzhou city cultural and tourism resource survey project. Note: Grade 5: Value and Influence Score (VIS) between 90 and 100; Grade 4: VIS between 75 and 89; Grade 3: VIS between 60 and 74; Grade 2: VIS between 45 and 59; Grade 1: VIS between 30 and 44; Total C: the total number of resources in each administrative region; Total G: the total number of resources at each grade.
Table 2.
BIO Labeling examples.
| Original Text | Label |
|---|---|
| 到 | O |
| 了 | O |
| 杭 | B-Location |
| 州 | I-Location |
| , | O |
| 就 | O |
| 直 | O |
| 奔 | O |
| 西 | B-Scene |
| 湖 | I-Scene |
Chinese: 到了杭州, 就直奔西湖. English: Once we arrival in Hangzhou, we headed straight for the West Lake.
Table 3.
Distribution of the number of recognized entities in the corpus.
| Training Data | Validation Data | Test Data | |
|---|---|---|---|
| Location | 1276 | 344 | 161 |
| Scene | 2962 | 825 | 369 |
Table 4.
Experiment results using different models.
| Model | Label | Precision | Recall | F1 | Train Time (min) |
|---|---|---|---|---|---|
| BERT-BiLSTM-CRF | Location | 0.8817 | 0.8663 | 0.8739 | 257 |
| Scene | 0.8762 | 0.8752 | 0.8757 | ||
| Macro-average | 0.8778 | 0.8725 | 0.8752 | ||
| RoBERTa-BiLSTM-CRF | Location | 0.8805 | 0.8779 | 0.8792 | 748 |
| Scene | 0.8131 | 0.8752 | 0.8430 | ||
| Macro-average | 0.8329 | 0.8760 | 0.8536 | ||
| BiLSTM-CRF | Location | 0.6832 | 0.6395 | 0.6607 | 170 |
| Scene | 0.6911 | 0.6182 | 0.6526 | ||
| Macro-average | 0.6889 | 0.6245 | 0.6550 | ||
| CNN-LSTM | Location | 0.5519 | 0.5407 | 0.5463 | 107 |
| Scene | 0.4793 | 0.5188 | 0.4983 | ||
| Macro-average | 0.5007 | 0.5252 | 0.5124 | ||
| BiLSTM | Location | 0.5748 | 0.5698 | 0.5723 | 98 |
| Scene | 0.4858 | 0.5600 | 0.5203 | ||
| Macro-average | 0.5120 | 0.5629 | 0.5356 | ||
| CRF | Location | 0.3559 | 0.4738 | 0.4065 | 2 |
| Scene | 0.4362 | 0.5927 | 0.5026 | ||
| Macro-average | 0.4126 | 0.5577 | 0.4743 |
Table 5.
Density and distance of the overall network in Hangzhou.
| Density | Number of Ties | Average Distance | Distance-Based Cohesion | |
|---|---|---|---|---|
| Threshold = 7 | 0.532 | 83 | 1.468 | 0.766 |
| Threshold = 10 | 0.474 | 70 | - | - |
Table 6.
Evaluation indicators for the overall network structure of Hangzhou.
| Degree Centralization | Closeness Centralization | Betweenness Centralization | ||
|---|---|---|---|---|
| Out-Degree | In-Degree | Out-Degree | In-Degree | |
| 0.507 | 0.507 | 0.679 | 0.675 | 0.366 |
Table 7.
Core–edge characteristics of the overall network of Hangzhou.
| Counties (Cities, Districts) | Coreness | |
|---|---|---|
| Core Areas | Xihu | 0.414 |
| Shangcheng | 0.370 | |
| Semi-Peripheral Areas | Fuyang | 0.335 |
| Tonglu | 0.335 | |
| Xiaoshan | 0.323 | |
| Chun’an | 0.314 | |
| Lin’an | 0.304 | |
| Peripheral Areas | Yuhang | 0.260 |
| Gongshu | 0.221 | |
| Jiande | 0.211 | |
| Linping | 0.107 | |
| Binjiang | 0.088 | |
| Qiantang | 0.049 |
Note: the correlation coefficient is 0.739.
Table 8.
Spearman correlation test.
| Quantity of Re-sources | Quality of Resources | ||
|---|---|---|---|
| Coreness | Significance | 0.000 | 0.003 |
| Correlation | 0.913 * | 0.746 * |
Note: * means extremely significant correlation at p < 0.01.
Table 9.
Evaluation indicators of nodal network structure of Hangzhou.
| Degree Centrality | Closeness Centrality | Betweenness Centrality | |||
|---|---|---|---|---|---|
| Out-Degree | In-Degree | Out-Degree | In-Degree | ||
| Xihu | 12 | 12 | 12 | 12 | 50.193 |
| Shangcheng | 9 | 8 | 15 | 16 | 3.160 |
| Xiaoshan | 8 | 9 | 16 | 15 | 6.850 |
| Fuyang | 8 | 8 | 16 | 16 | 1.793 |
| Tonglu | 8 | 7 | 16 | 17 | 1.176 |
| Chun’an | 7 | 8 | 17 | 16 | 1.376 |
| Yuhang | 7 | 8 | 17 | 16 | 5.126 |
| Lin’an | 7 | 7 | 17 | 17 | 1.183 |
| Gongshu | 6 | 5 | 18 | 19 | 2.143 |
| Jiande | 5 | 6 | 19 | 18 | 0.000 |
| Linping | 3 | 3 | 21 | 21 | 0.000 |
| Binjiang | 2 | 1 | 22 | 23 | 0.000 |
| Qiantang | 1 | 1 | 23 | 23 | 0.000 |
| Average | 6.385 | 6.385 | 17.615 | 17.615 | 5.615 |
| Standard Deviation | 2.897 | 3.052 | 2.897 | 3.052 | 13.024 |
Table 10.
The moving direction and distance of the tourist gravity center in Hangzhou, 2020-2022.
| Year | Center Coordinate | Moving Direction | Moving Distance (km) |
|---|---|---|---|
| 2020 | 119.87° E, 30.07° N | Southwest | - |
| 2021 | 119.86° E, 30.06° N | Southwest | 1.147 |
| 2022 | 119.79° E, 30.01° N | Southwest | 8.740 |
Table 11.
The SDE parameters of tourist flow network in Hangzhou, 2020–2022.
| Year | Major Axis (km) | Minor Axis (km) | Area (km2) | Rotation (°) | Eccentricity |
|---|---|---|---|---|---|
| 2020 | 67.96 | 25.33 | 5403.89 | 55.75 | 0.928 |
| 2021 | 69.76 | 24.65 | 5408.56 | 58.99 | 0.935 |
| 2022 | 67.86 | 24.80 | 5331.18 | 53.51 | 0.931 |
Disclaimer/Publisher’s Note: The statements, opinions and data contained in all publications are solely those of the individual author(s) and contributor(s) and not of MDPI and/or the editor(s). MDPI and/or the editor(s) disclaim responsibility for any injury to people or property resulting from any ideas, methods, instructions or products referred to in the content. |
© 2024 by the authors. Licensee MDPI, Basel, Switzerland. This article is an open access article distributed under the terms and conditions of the Creative Commons Attribution (CC BY) license (https://creativecommons.org/licenses/by/4.0/).
Share and Cite
MDPI and ACS Style
Qi, D.; Wang, B.; Zhao, Q.; Jin, P. Research on the Spatial Network Structure of Tourist Flows in Hangzhou Based on BERT-BiLSTM-CRF. ISPRS Int. J. Geo-Inf. 2024, 13, 139. https://doi.org/10.3390/ijgi13040139
AMA Style
Qi D, Wang B, Zhao Q, Jin P. Research on the Spatial Network Structure of Tourist Flows in Hangzhou Based on BERT-BiLSTM-CRF. ISPRS International Journal of Geo-Information. 2024; 13(4):139. https://doi.org/10.3390/ijgi13040139
Chicago/Turabian StyleQi, Danfeng, Bingbing Wang, Qiuhao Zhao, and Pingbin Jin. 2024. "Research on the Spatial Network Structure of Tourist Flows in Hangzhou Based on BERT-BiLSTM-CRF" ISPRS International Journal of Geo-Information 13, no. 4: 139. https://doi.org/10.3390/ijgi13040139
Note that from the first issue of 2016, this journal uses article numbers instead of page numbers. See further details here.