1. Introduction
The open data movement is changing the way that people do science [
1,
2,
3]. A conventional process of scientific research begins with background study and hypothesis generation. Then data will be collected in experiments and the results of data analysis will be used to approve or revise the hypothesis. With abundant datasets made freely accessible through the open data movement, researchers can now retrieve massive datasets from the open data environment on the Web [
4]. However, researchers often struggle to develop hypotheses despite the abundance of data available to them. In this new era of science, methods and tools are desired to help researchers generate and test hypotheses.
Studies in data science can provide methods to address this challenge. Data science is the study of the generalizable extraction of knowledge from data [
5]. The theoretical foundations of data science have strong connections to the disciplines of mathematics, statistics, computer science, and more [
6]. In the field of statistics, the method of exploratory data analysis (EDA) is used as a step for hypothesis generation before the step of confirmatory data analysis (CDA) (i.e., statistical hypothesis testing) [
7,
8]. In recent years, EDA has been suggested by data scientists [
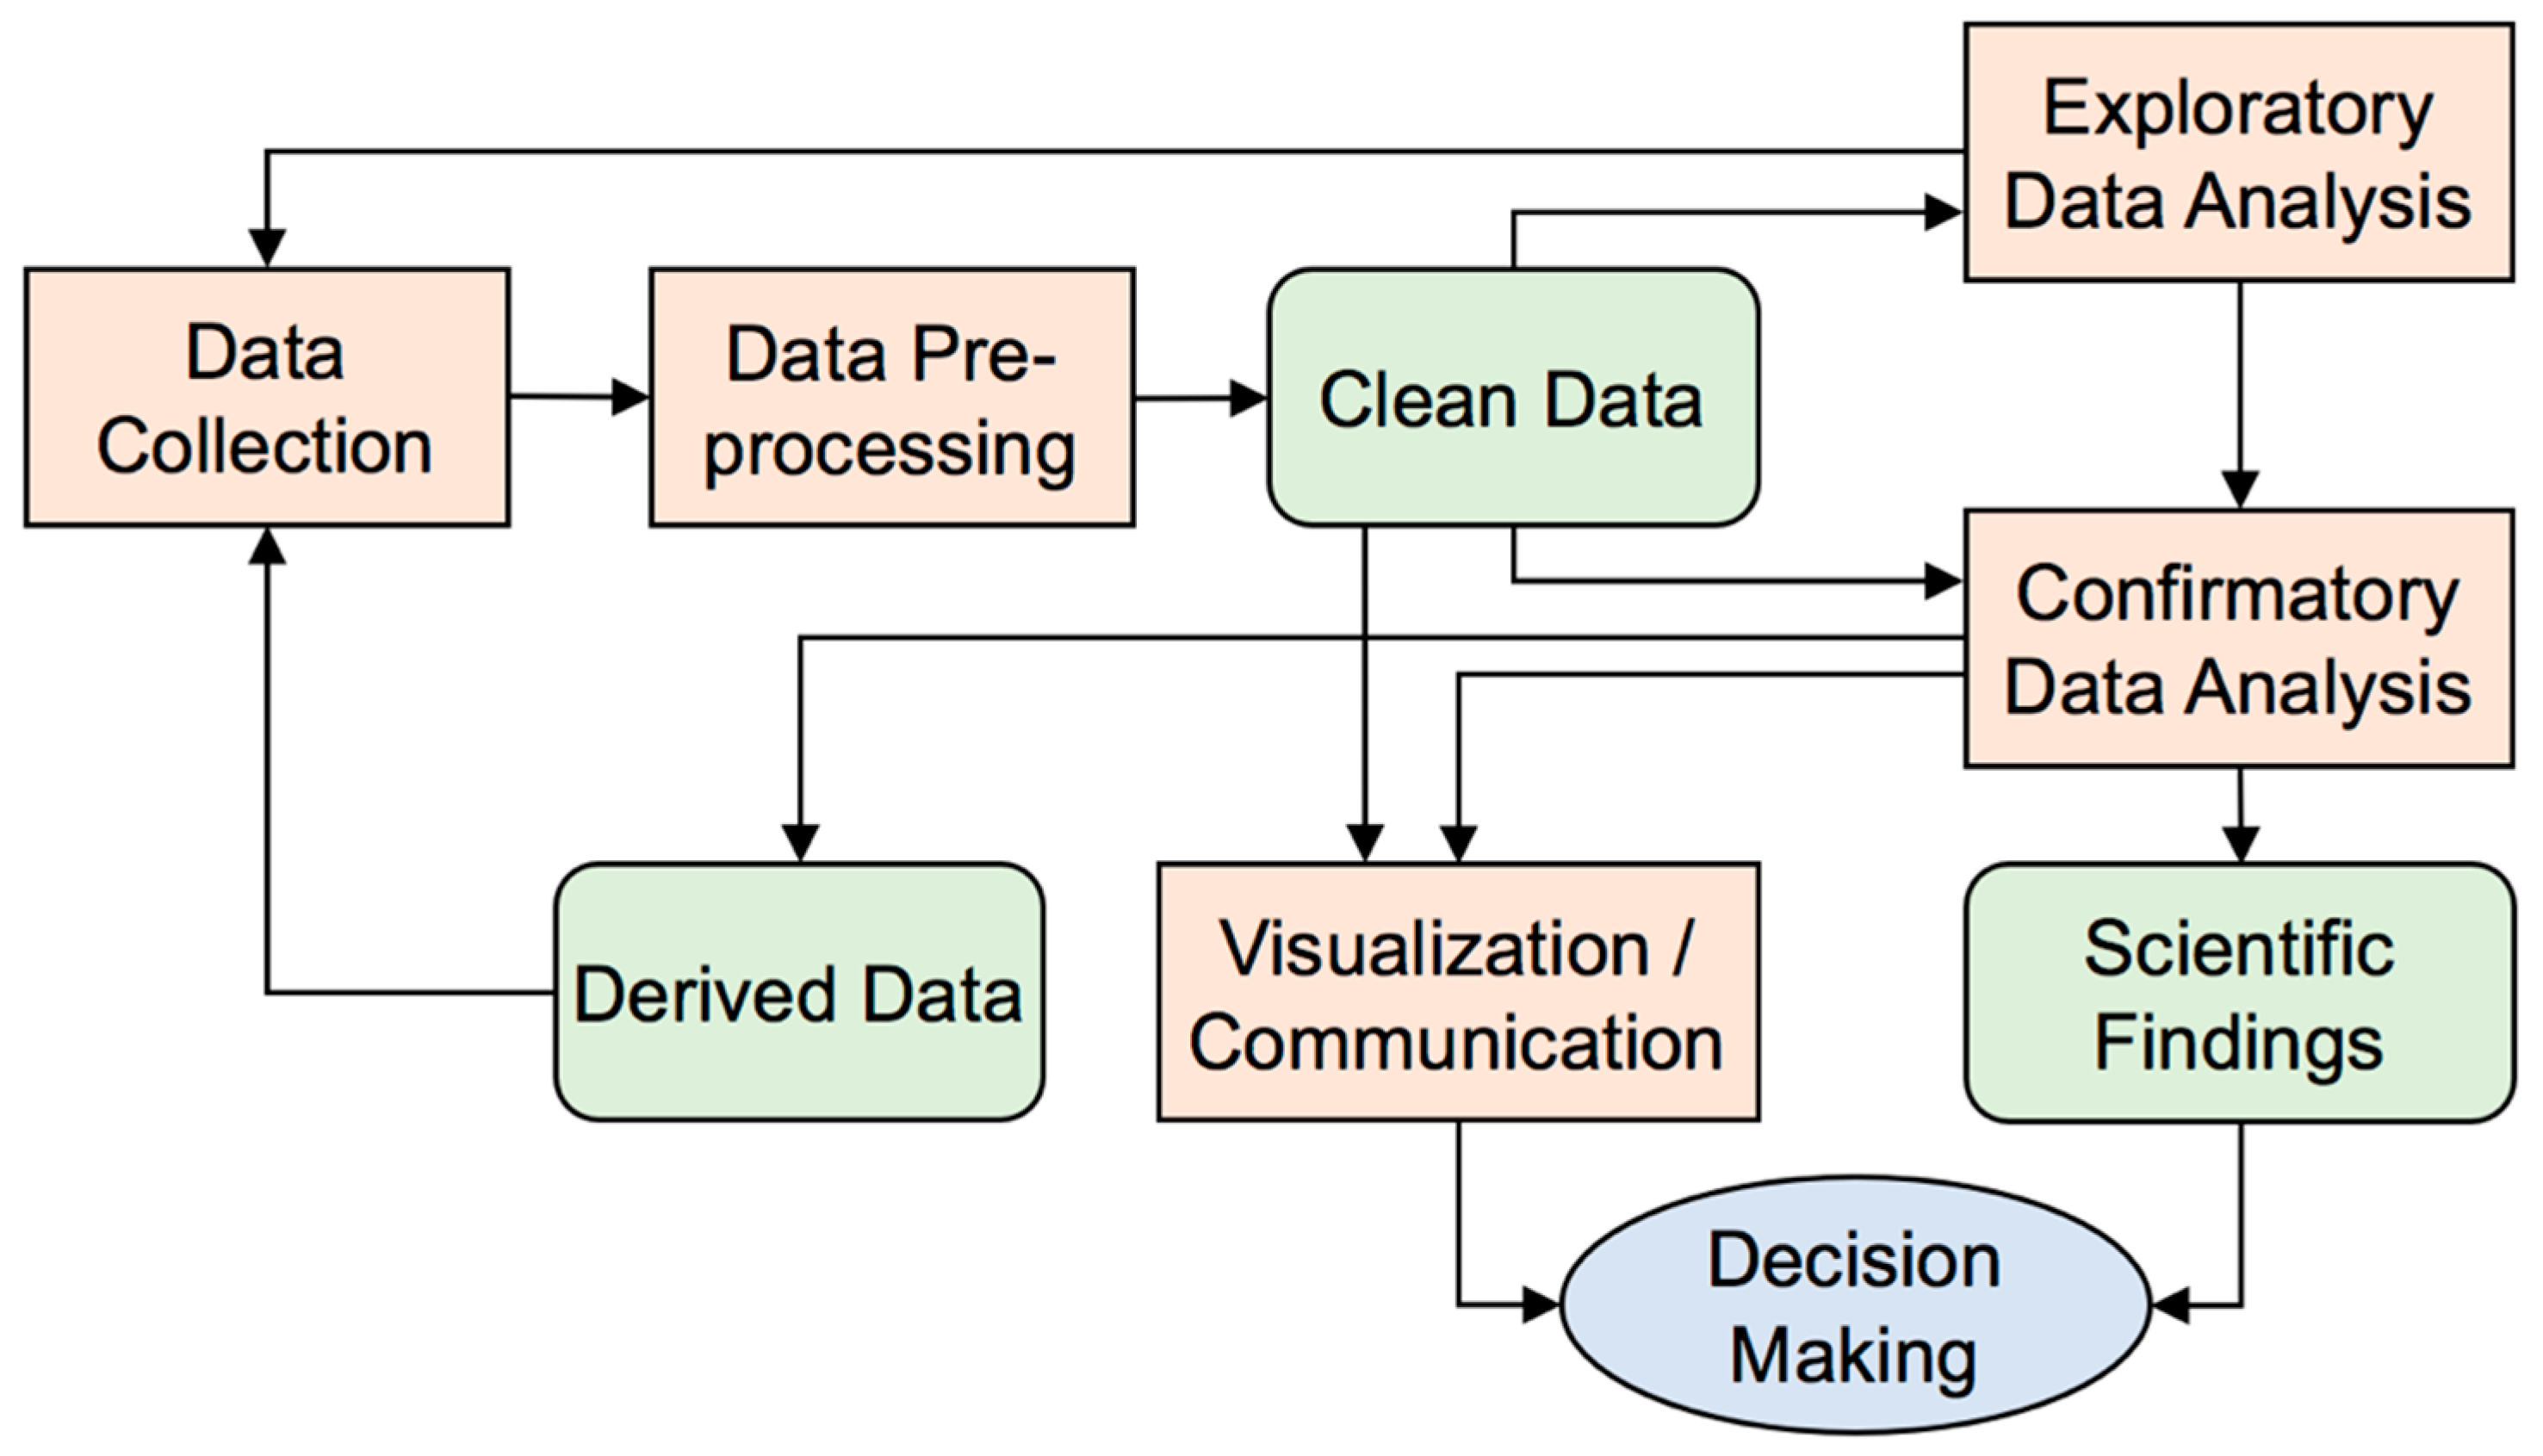
3] as an effective step for pattern recognition and hypothesis generation in a data science process (
Figure 1). The term “exploratory” represents the characteristics of the method: The EDA process is flexible and the result is uncertain, so it can be used to search for characteristics that are believed to be present or absent [
9].
The data science process featured in EDA is comparable to the approach of data-driven abductive discovery [
10,
11,
12]. Abduction is defined as the formation of a plausible explanation for an observed phenomenon [
13]. Charles S. Peirce (1839–1914) viewed abduction as the first stage of scientific reasoning, i.e., to create a hypothesis [
14]. Following abduction, deduction is carried out to refine the hypothesis based on other plausible premises and to determine the specific evidence needed to support the hypothesis. Finally, induction is used to extrapolate a general rule or principle from the findings. Abduction and deduction are a part of the conceptual understanding of a phenomenon, and induction is the quantitative verification. Ho [
10] used a short sentence to summarize the interactions among the three concepts: “Abduction creates, deduction explicates, and induction verifies”. This process fits well with the two steps of EDA and CDA in the data science process (
Figure 1). For a domain-specific study that aims to leverage abduction and the data science process, Hazen’s summary [
11] might also be useful: deduction and induction are to discover what we know we do not know, and abduction is to discover what we do not know we do not know.
Data visualization is an efficient way to display the results of a data science process [
15,
16]. In recent years, researchers have also proposed that data visualization should be applied in each step of the data science process rather than only for the end product [
17]. In EDA for statistics, data visualization is an essential part of quantitative datasets. Many visualization techniques have already been developed, such as scatter plots, box plots, histograms, stem-and-lead plots, and more. For EDA in cross-disciplinary studies, other types of visualization techniques may also be applied, such as mind maps [
18], conceptual maps [
19], and workflow visualizations [
20]. Through the usage of those visualization techniques, researchers from different backgrounds can quickly obtain an overview of the subject under study, gain insights about the datasets, and discuss hypotheses for the focused work of the next step [
21,
22].
The domain of Earth and space sciences, like other disciplines, faces opportunities raised by open data, and requires methods and technologies to help transform massive amounts of data into meaningful information [
23,
24]. The objective of this paper is to present our experience of applying visual EDA to facilitate cross-disciplinary research collaboration and hypothesis generation. A few use cases of applying a three-dimensional matrix to show co-relationships among chemical elements and mineral species will be used to demonstrate the collaborative process. The increasing complexity of datasets and research discussions along with those use cases also reflects the effectiveness of this method for formulating hypotheses. The presented use cases are from studies of mineral evolution in the Deep Time Data Infrastructure (DTDI) [
25], a research initiative that joins data science with geoscience and bioscience to study the co-evolution of Earth systems. The remainder of this paper is organized as follows:
Section 2 describes the data sources of this study, the methods of visual EDA, and the design of a workflow;
Section 3 presents a demonstration system that implements the designed workflow, and also demonstrates the usefulness the system through a few focused use cases;
Section 4 highlights several research topics in the data science process and lists a few topics for future work; and, finally,
Section 5 concludes the paper.
2. Datasets and Methods
More than 5000 mineral species have been discovered on Earth. Each mineral species is a natural chemical compound characterized by a definite crystalline structure. Through the studies of chemistry, physical properties, crystal structure, and geographical distribution of those mineral species, the geoscience community has built many reusable data resources. For example, the database of Raman spectroscopy, X-ray diffraction and chemistry of minerals (RRUFF) [
26] aims at creating and sharing a complete set of high-quality spectral data from well-characterized minerals. The collected data [
27] provide a standard for structural, spectroscopic, and chemical mineral identification, and can be used in studies of Earth and other planets. RRUFF also hosts a continually updated list of mineral names that are officially accepted by the International Mineralogical Association (IMA) and the detailed source information of those minerals [
28]. The website of the IMA mineral list [
29] provides an interactive user interface that allows users to search the list and the source information in various ways and download for research uses. Another useful data resource is Mindat [
30], a crowd-sourced website that collects and shares information about mineral species, their properties, and their geographic distribution on Earth.
The abundant datasets about minerals and their properties have initiated new ideas and studies in recent years. DTDI is an integrated program that leverages various existing data sources to discover patterns in the evolution of Earth’s environment, including the geosphere and biosphere. One of the umbrella research themes in DTDI is mineral evolution—the mineralogy of terrestrial planets and moons evolves as a consequence of a range of physical, chemical, and biological processes that lead to the formation of new mineral species [
31]. In the past few years, several new findings have been reported. One of them is the pattern of Large Number of Rare Events (LNRE) in the frequency distribution of mineral species [
32]. By extrapolations from the LNRE model, researchers can predict how many new mineral species can be discovered at an assumed larger observation size. Going further from that work, studies on the population probabilities of all mineral species have led to the characterization and comparison of Earth-like planets [
33,
34].
To leverage more studies with those open data mineral resources, we designed and developed a pilot system that can be used to support EDA in the multidisciplinary data science process (
Figure 1) of the above-mentioned mineral evolution research. Our idea was to construct a three-dimensional (3D) matrix to visualize co-relationships among mineral-forming chemical elements and mineral species found on Earth. The three axes in this matrix, X, Y, and Z, were identical lists of arranged chemical elements. A simple example was to list 30 key mineral-forming elements along each axis. This 30 × 30 × 30 3D matrix resulted in 27,000 cells, in which we could assign different values, such as the raw number of minerals in which elements X, Y, and Z co-exist. If each cell was rendered in a color according to the value of the number inside it, then the 3D matrix could reveal patterns in the co-relationships among elements and minerals, such as clusters of high mineral species numbers for the element triplets F-Si-O, Na-Si-O, Mg-Si-O, Al-Si-O, F-Al-O, Na-Al-O, and Mg-Al-O. We also developed functions to manipulate the matrix, so that a user could rotate the matrix, zoom in and out, select and highlight certain cubes or patterns, and slice one or more two-dimensional planes out from the matrix to see patterns of interest. Those detected patterns may lead to the formation of research hypotheses for further works, such as why oxygen has the highest number of mineral species among all mineral-forming elements. Such a visualization system is easy to understand and operate for both geologists and data scientists. It lowers the barrier of communication between collaborators, and facilitate discussion on research topics.
The multidisciplinary collaboration in DTDI follows the data science steps shown in
Figure 1. The pilot system played an important role in the EDA step. Before carrying out EDA, data collection and data pre-processing were conducted by DTDI team members who were familiar with the subject, structure, and format of datasets in RRUFF, the IMA mineral list, and Mindat. The resulting clean data were well-organized in a sample structure, which saved a great deal of time for data science team members when it came to loading and visualizing the data in the 3D matrix of the pilot system. A few meaningful visualization outputs from the EDA could be published as research results directly. The case studies in the next section will illustrate a few visualization outputs of this kind, such as the co-relations between primary and secondary cobalt minerals shown in Figure 5. Another relevant DTDI research of network analysis and visualization [
35] also revealed a similar EDA approach but applied different techniques. Those visualization results and recognized patterns were used in research discussions and to support decision-making. Derived datasets could be published, shared, and reused in other research (i.e., another round of the data science process).
3. Implementation and Case Studies
The team that conducted this research consisted of geoscience and computer science researchers with complementary academic backgrounds in minerology, paleontology, data management, data visualization, and data analysis. A use case-driven iterative approach [
36,
37] was applied throughout the whole work to facilitate the interactions among team members. Several use case studies were conducted in this research with an iterative process. For computer scientists, this iterative approach helped refine the functions of the developed pilot system because each use case had unique datasets and data visualization requirements. For geoscientists, the information revealed through the EDA of each use case was meaningful and led to the discussion of more research topics. We used comma separated values (CSV) as the file format for the dataset, and reused a JavaScript library three.js [
38] to develop the visualization. The current pilot system was made accessible online [
39]. The source code and datasets of the demo system were shared on Github [
40].
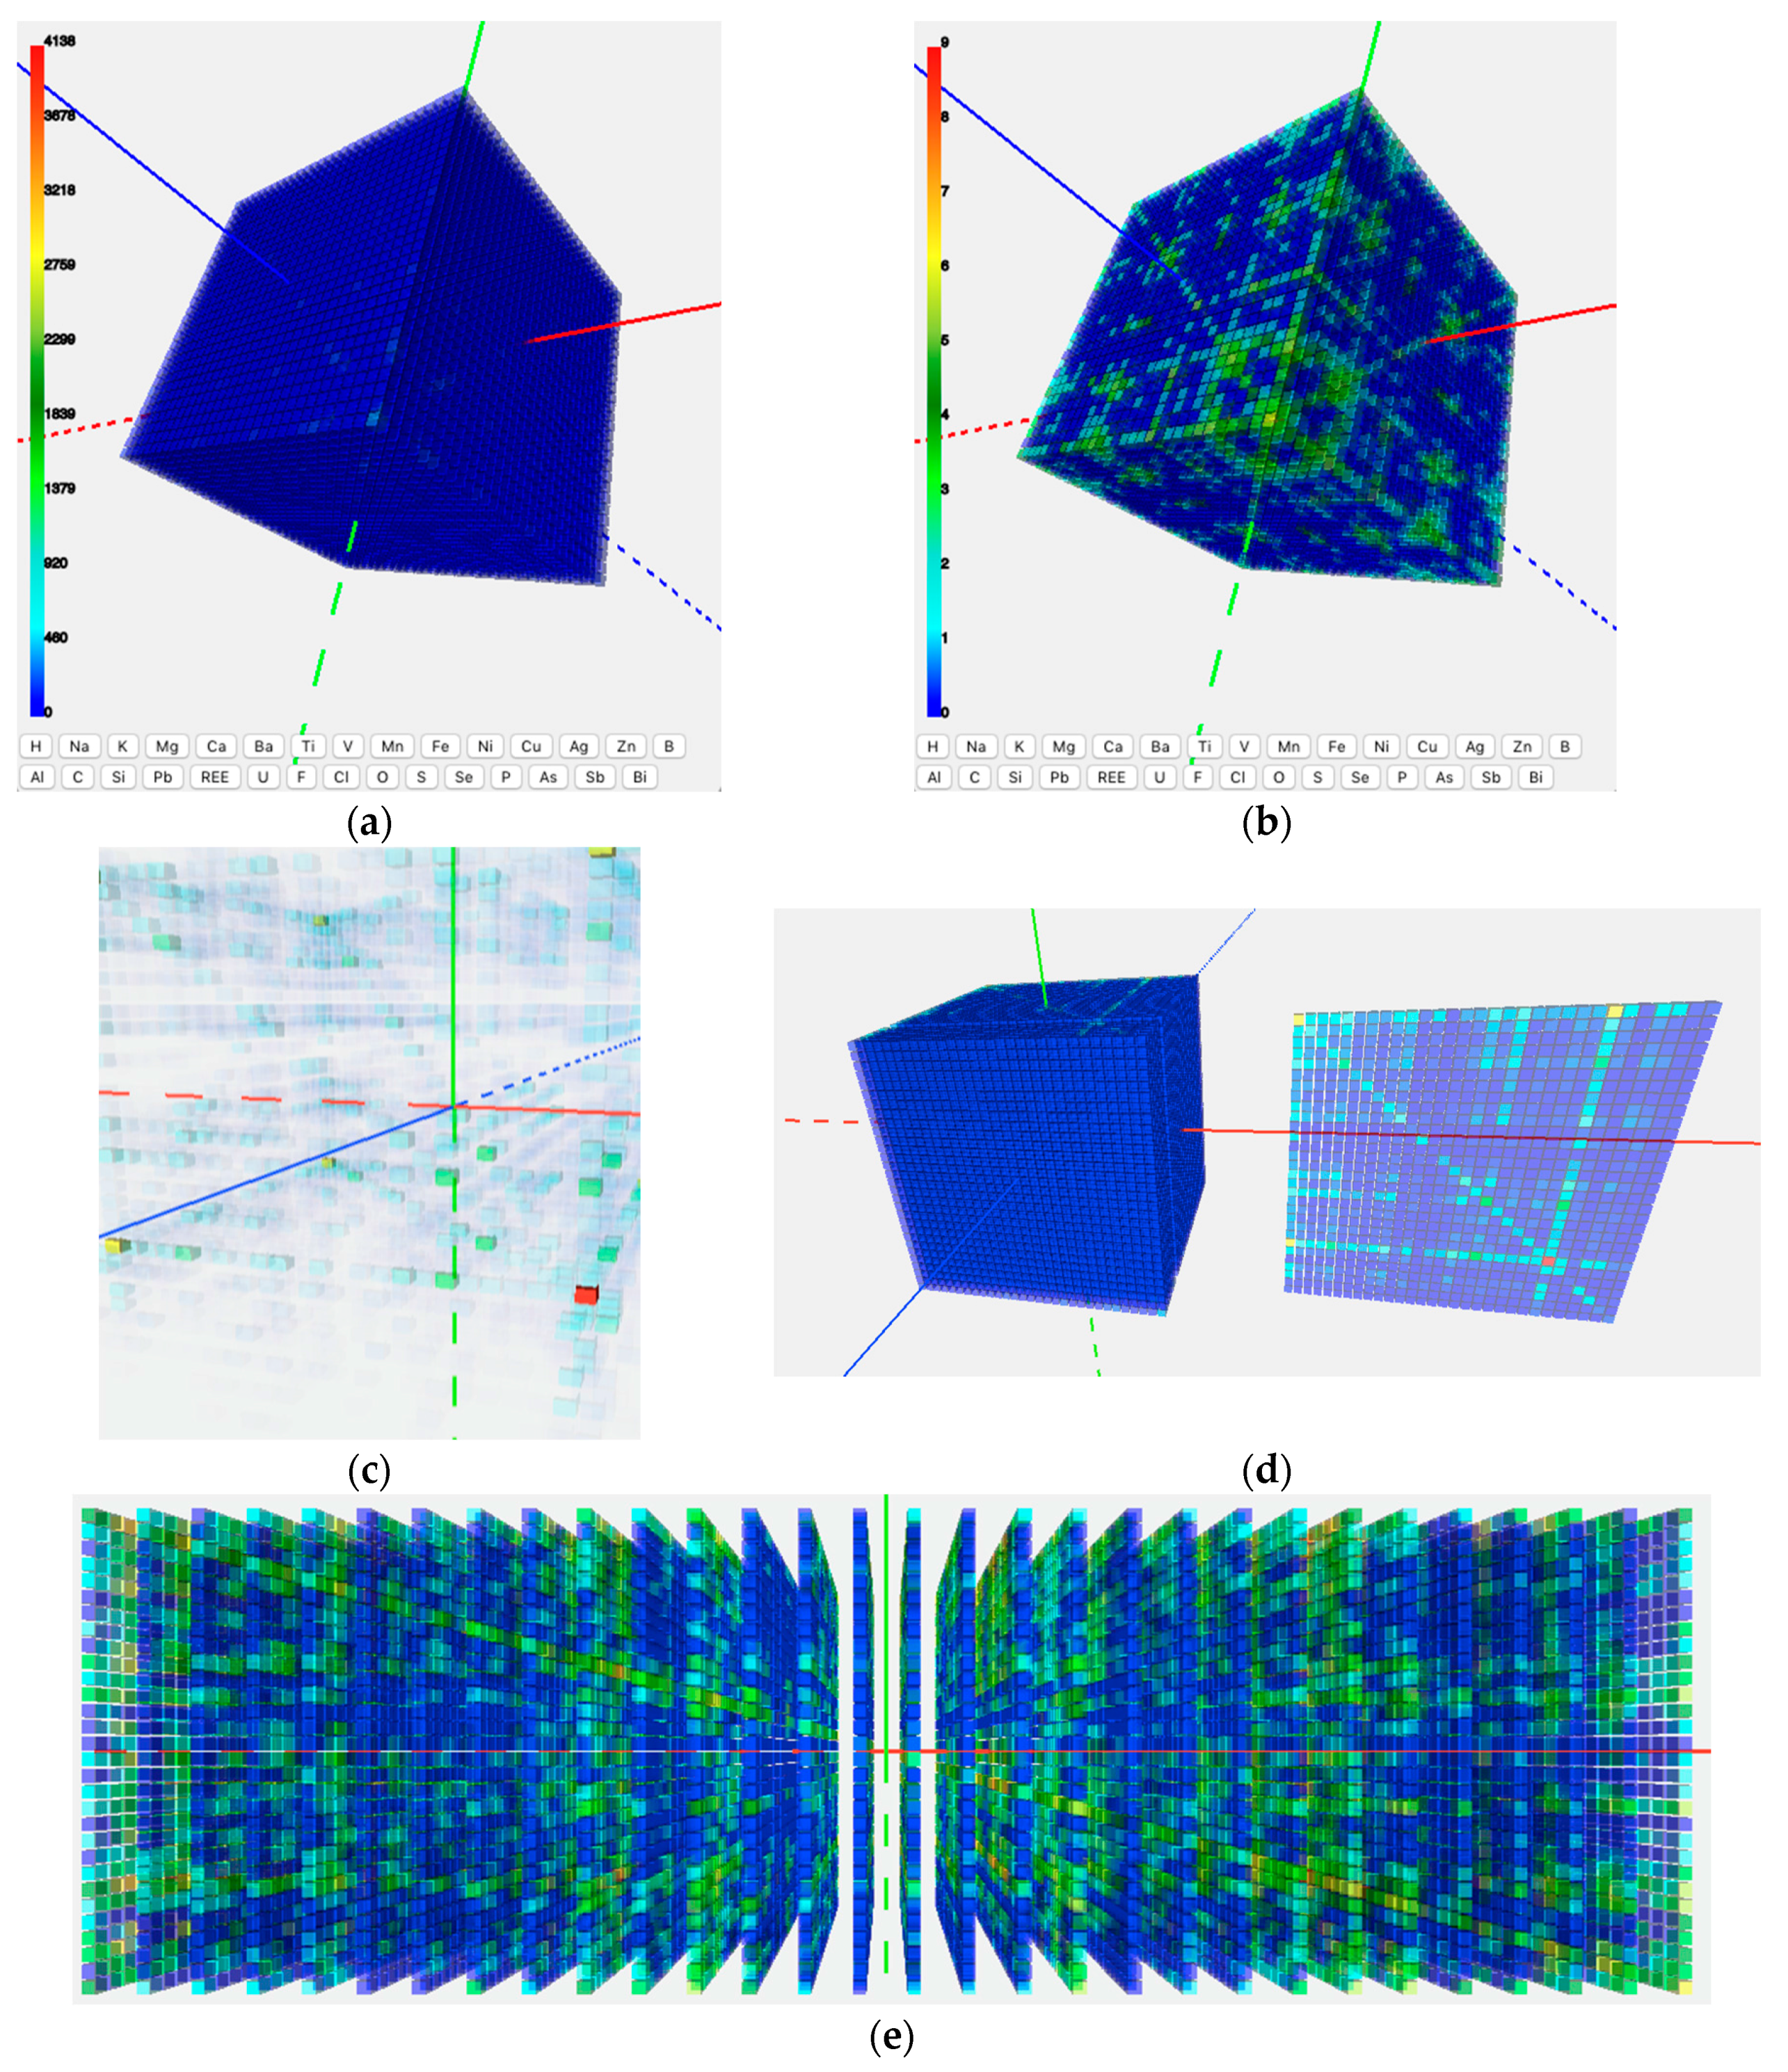
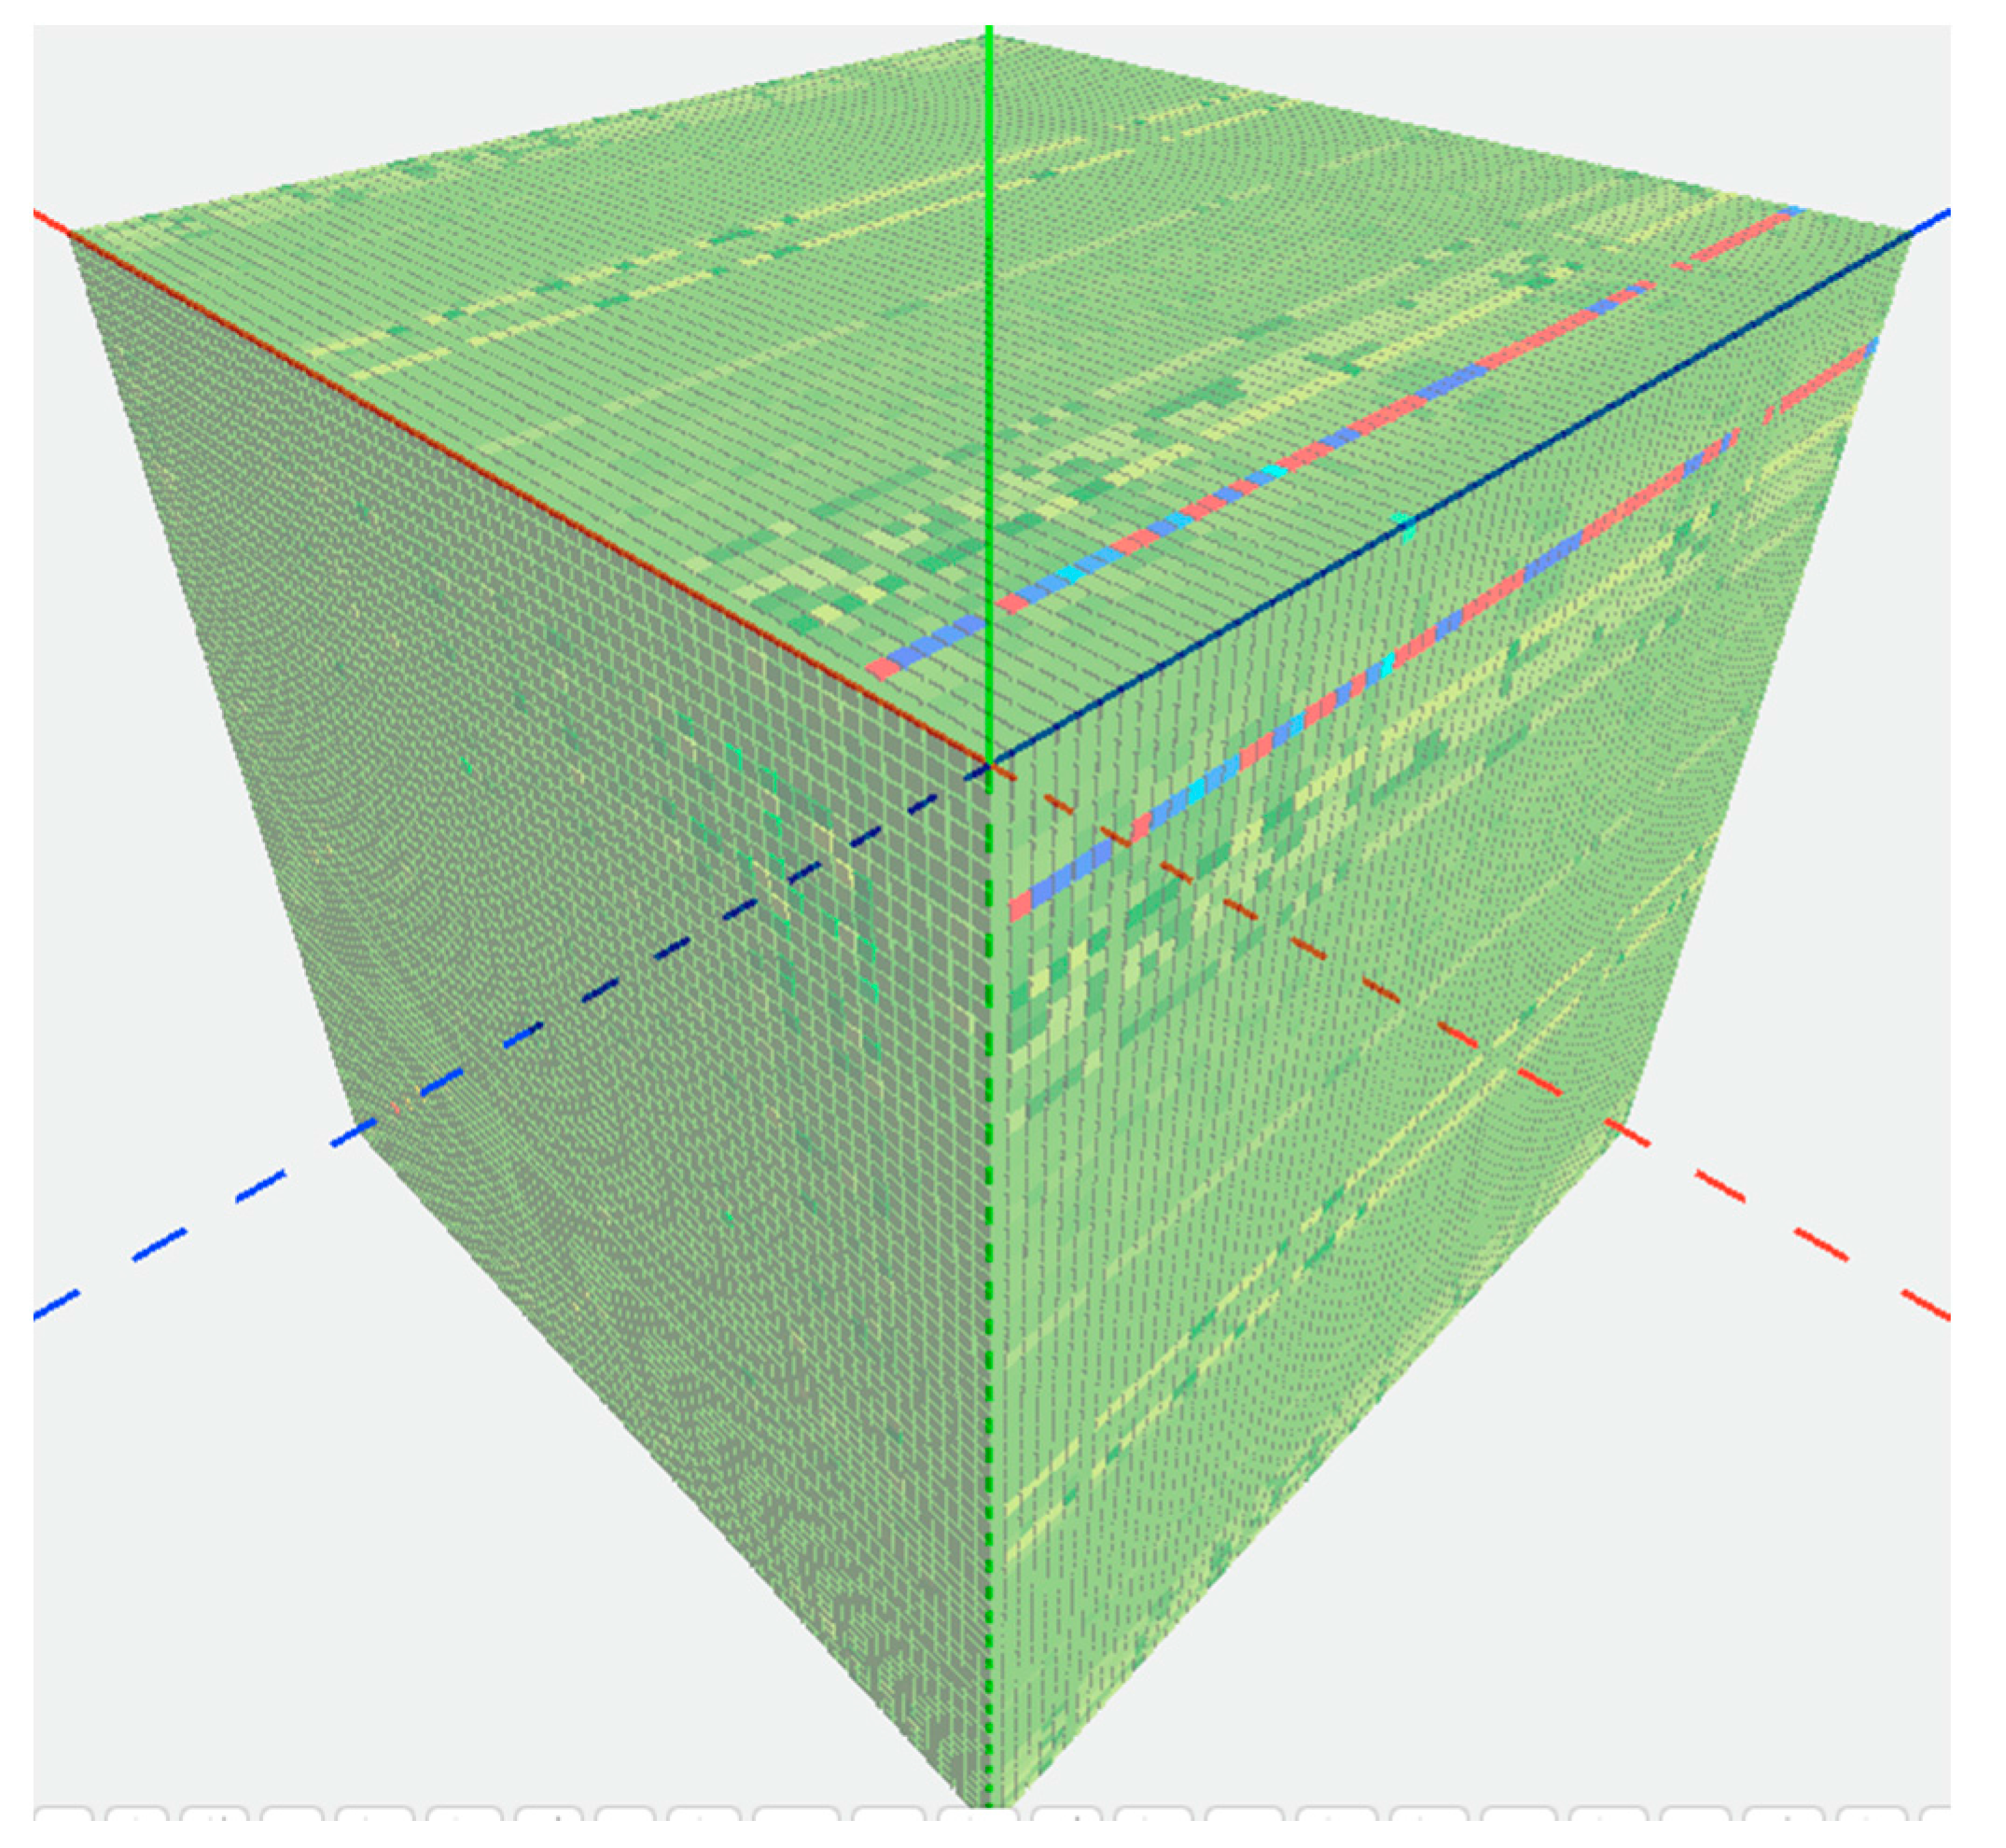
Our first use case was the co-existence of key elements in minerals. The objective of this case study was to examine the correlation between triplets of elements by counting the number of mineral species in which those three elements co-exist. By plotting the same list of 30 key mineral-forming elements along each axis of a 3D coordination system, we constructed a 30 × 30 × 30 matrix. We then referred to the RRUFF and the IMA mineral list to find the numbers of minerals in which elements X, Y, and Z coexist, and filled those numbers into the corresponding 27,000 cells in the 3D matrix. Subsequently, we developed a color spectrum according to the range of the numbers in the matrix, and applied the spectrum to the matrix to render each cell with a color.
Figure 2a shows an initial output from the first use case. Subsequently, the geoscientists team members offered suggestions on how to make the visualization outputs easier to operate and more meaningful from the geoscience perspective. By using the developed functions, geoscientists could manipulate the 3D matrix, sliced out planes, conduct transformations, and observed the clustering patterns (
Figure 2b–e). Through this use case, the basic visualization toolkits were set up. Although the clusters of high values in the matrix clearly demonstrate there are more minerals for certain elements, the mineralogists in the research team wanted a deeper view of the relationship. This led to the second use case.
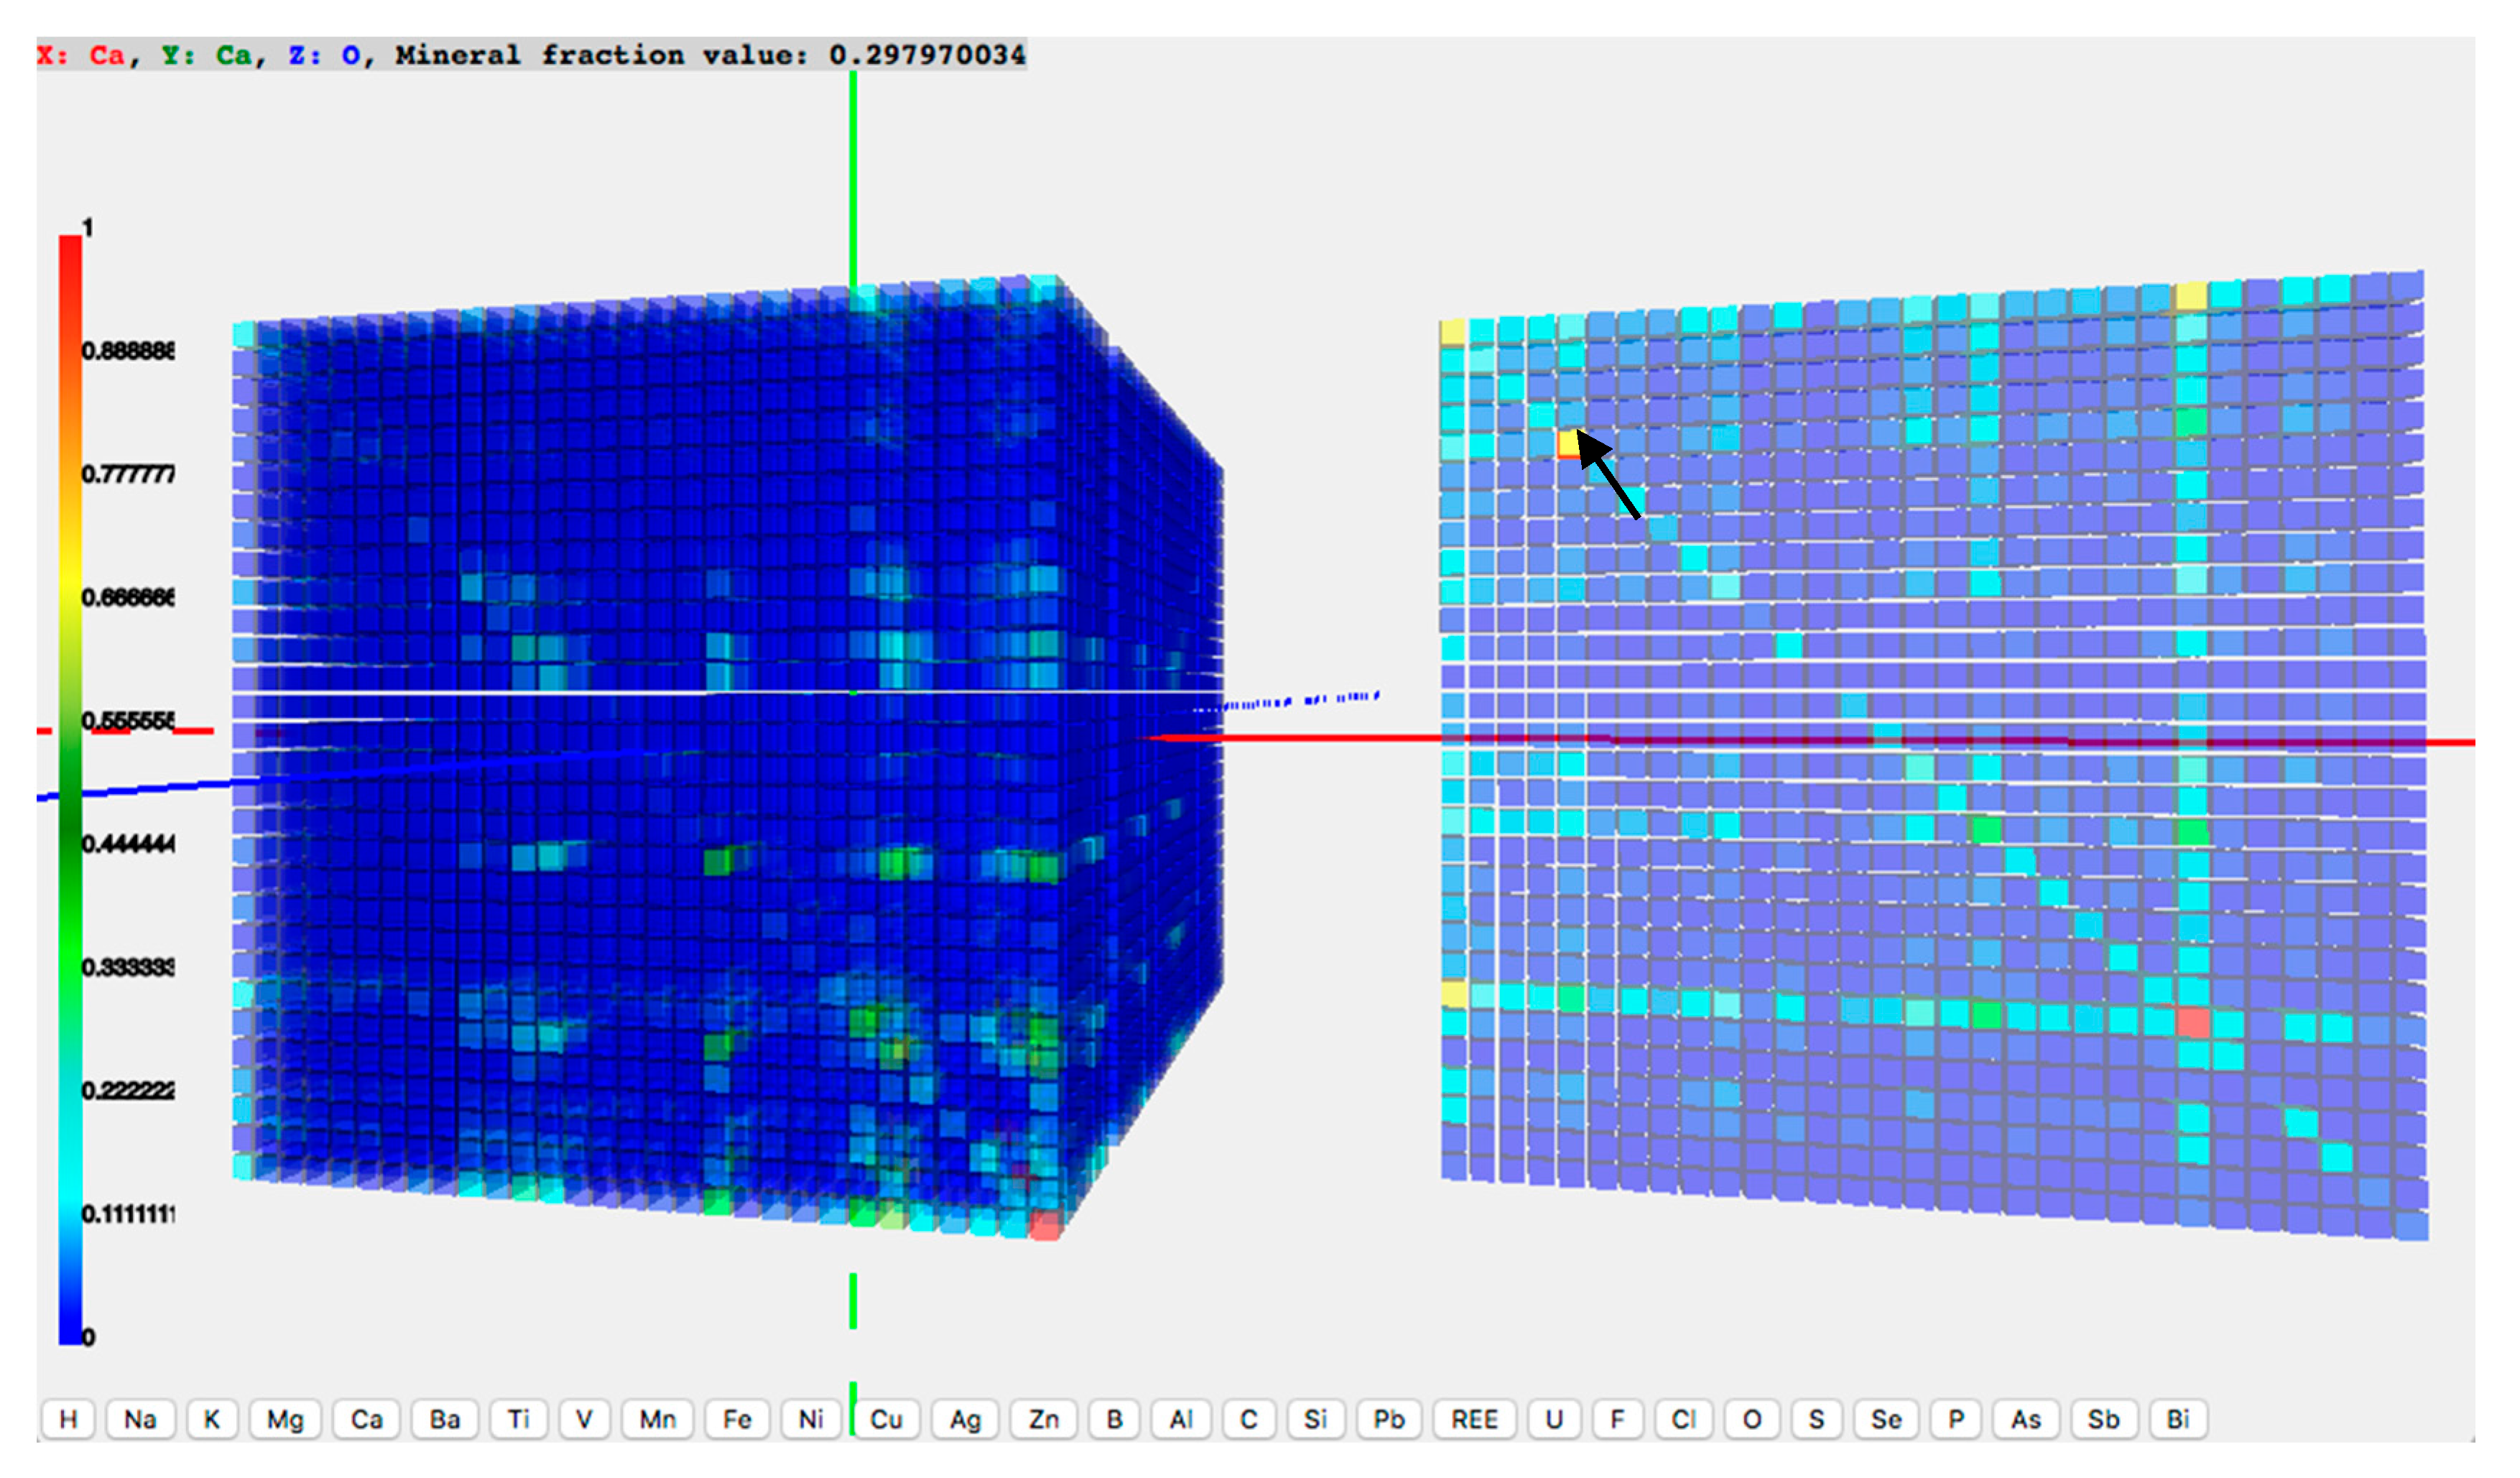
The second use case was a small research topic initiated by the visualization output of the first use case. It had the same objective as the first use case to show the co-existence of elements in mineral species, but with updated datasets. In the first use case, the value in each matrix cell was the mineral counts. In the second use case, the dataset was replaced by one in which the cell values represented the fraction of minerals containing an element on the Z-axis that also contain both X- and Y-axes. A new function developed in the pilot system was to show attributes of a matrix cell when the cursor is placed over it. In
Figure 3, the plane of oxygen is sliced out such that oxygen is the Z element for all cells on the plane. When a user moves the cursor over the cells in the plane, the cell below the cursor is highlighted and the attributes of that cell will be shown on top of the 3D matrix in the browser window. In
Figure 3, the shown attributes read ‘X: Ca, Y: Ca, Z: O, Mineral fraction value: 0.297970034’. This means that about 29.8% of minerals containing oxygen also contain calcium. After finished the first two use cases with the 30 key mineral-forming elements, the research team decided to expand the scope of the dataset, and move on to all 72 mineral-forming elements.
In the third use case, we expanded the dataset to cover all 72 mineral-forming elements. Correspondingly, a 72 × 72 × 72 matrix was constructed with a same list of 72 elements along each axis. Instead of filling raw mineral numbers, we used a chi-squared test to generate values in the 373,248 cells of the 3D matrix. The aim of those values is to answer the question ‘Does the presence of element Z affect the correlation between elements X and Y in mineral species?’ For example, in
Figure 4 the rows of red and blue cells corresponding to the O-H plane highlight different elements’ association with hydrated minerals. The Z axis, representing all the elements pairing with O and H, is shown in dark blue. Cells that are colored red represent elements that correlate strongly to O–H bearing minerals, and cells colored blue represent elements that are anti-correlated to O–H bearing minerals. These results indicate that some elements are very common in hydrated mineral species, while others are rarely found in hydrated minerals. This is an entirely new result gained from this use case, and leads geoscientists to new questions regarding what causes an element to associate with hydrated minerals.
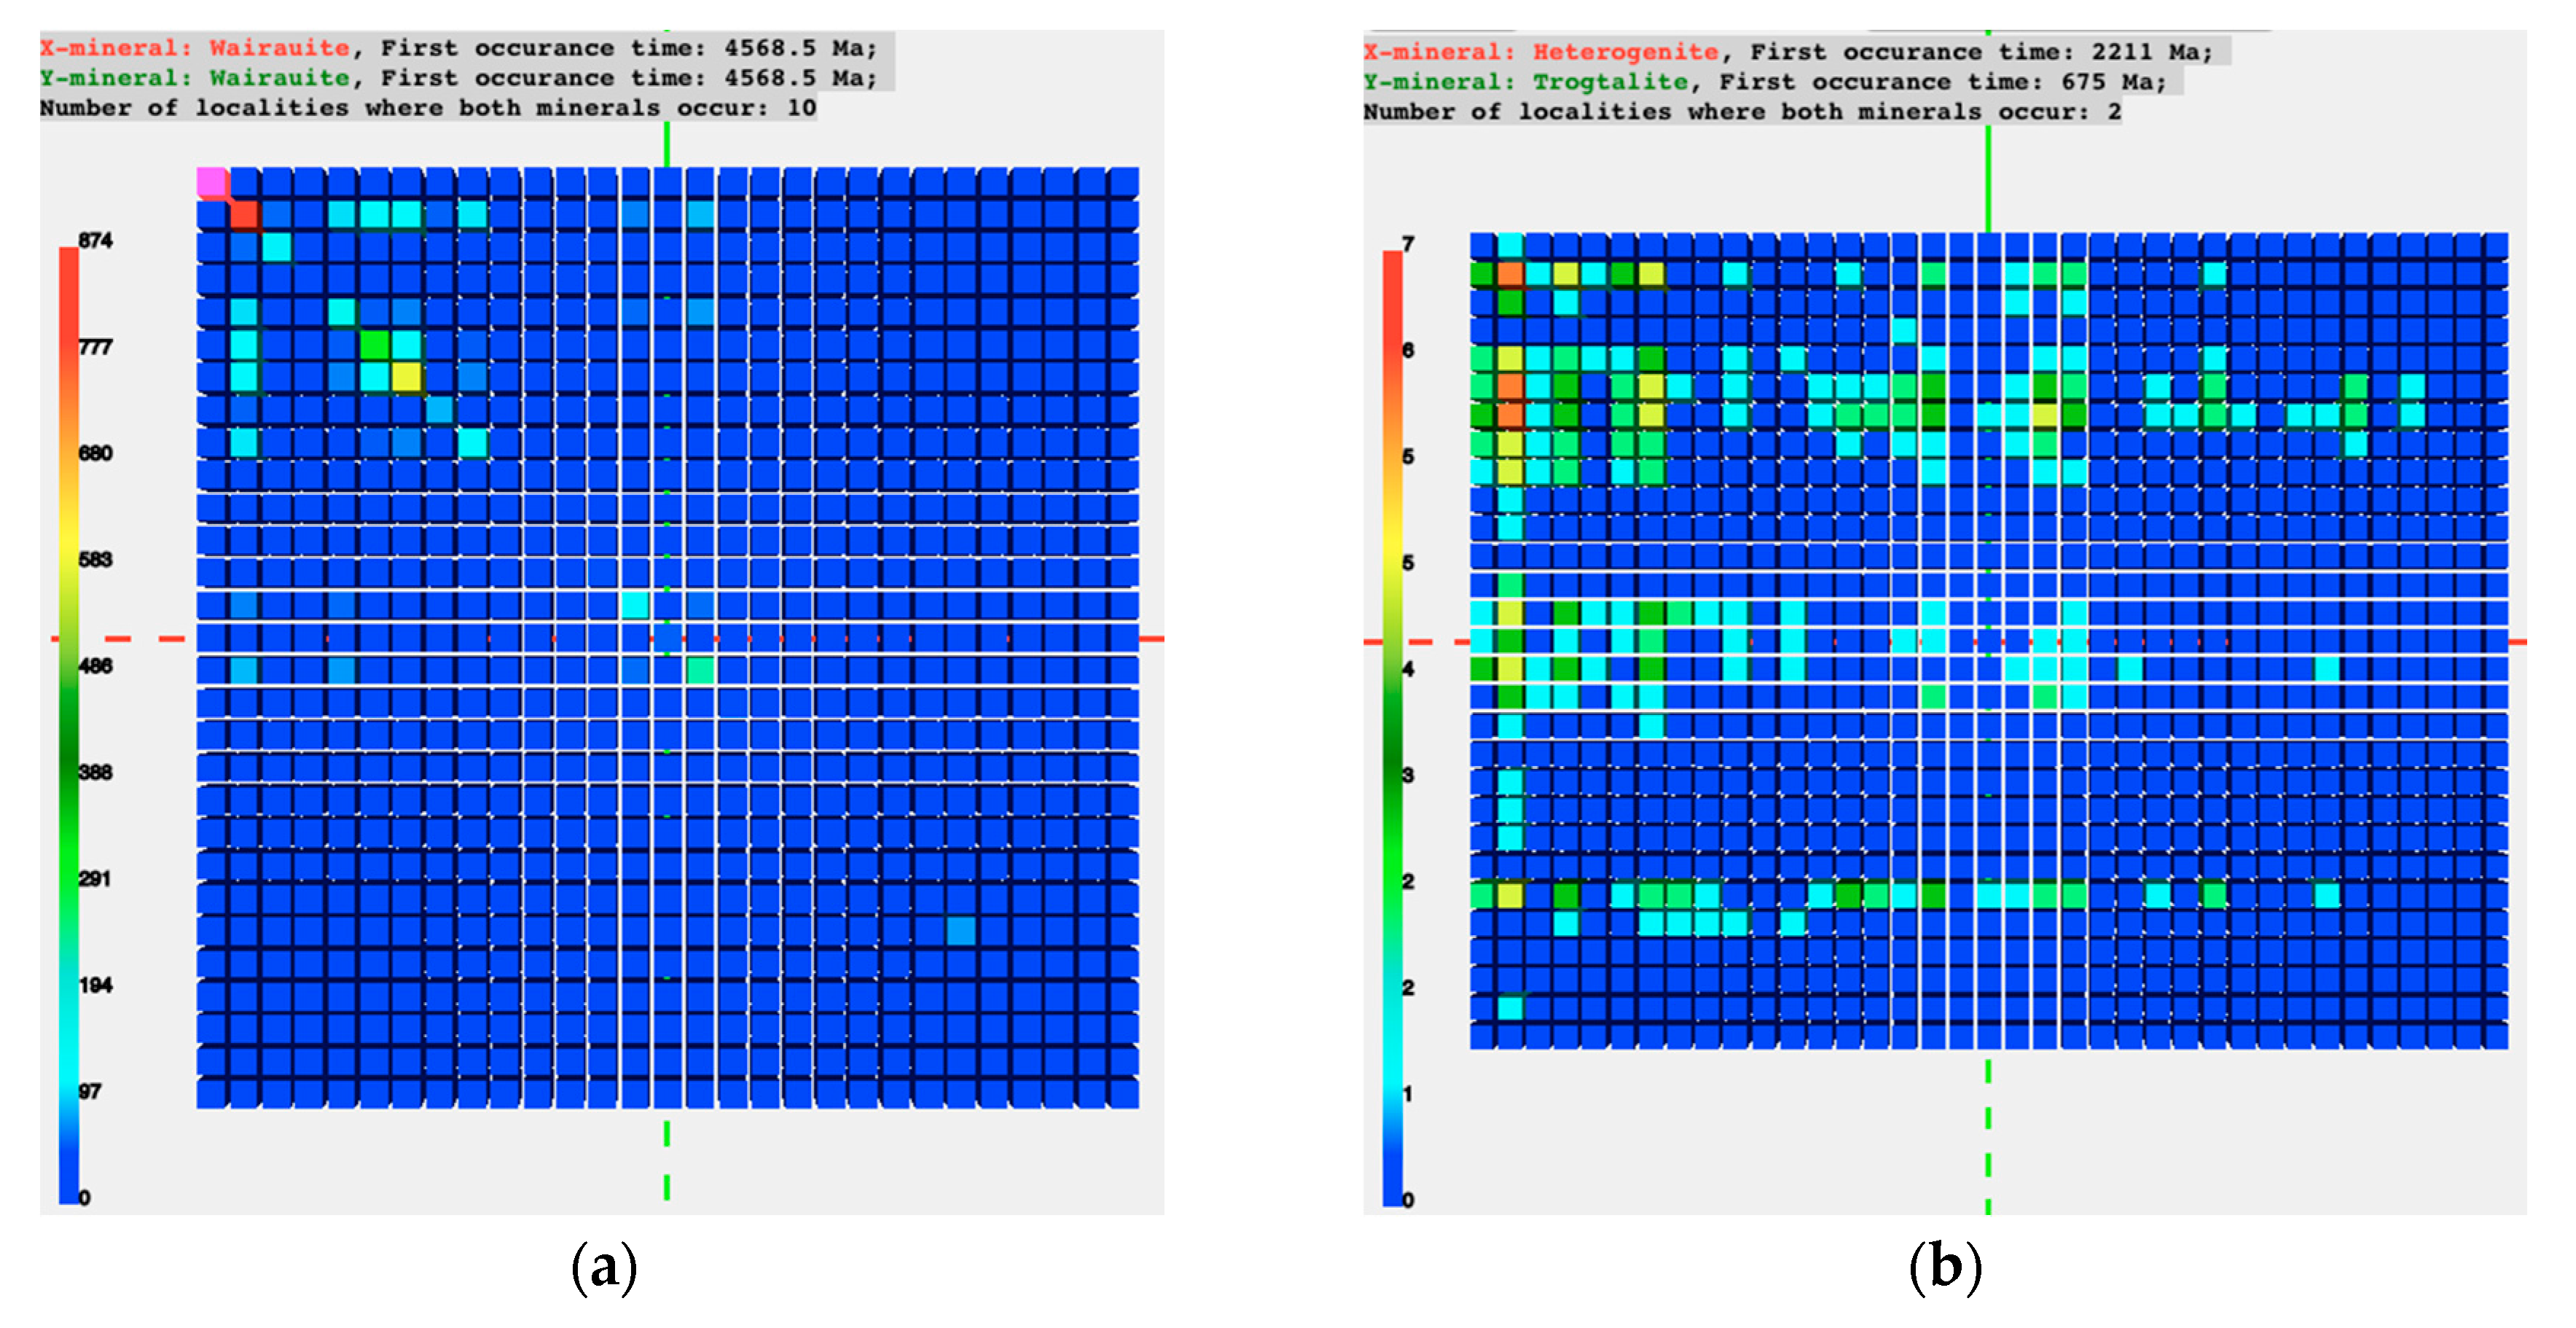
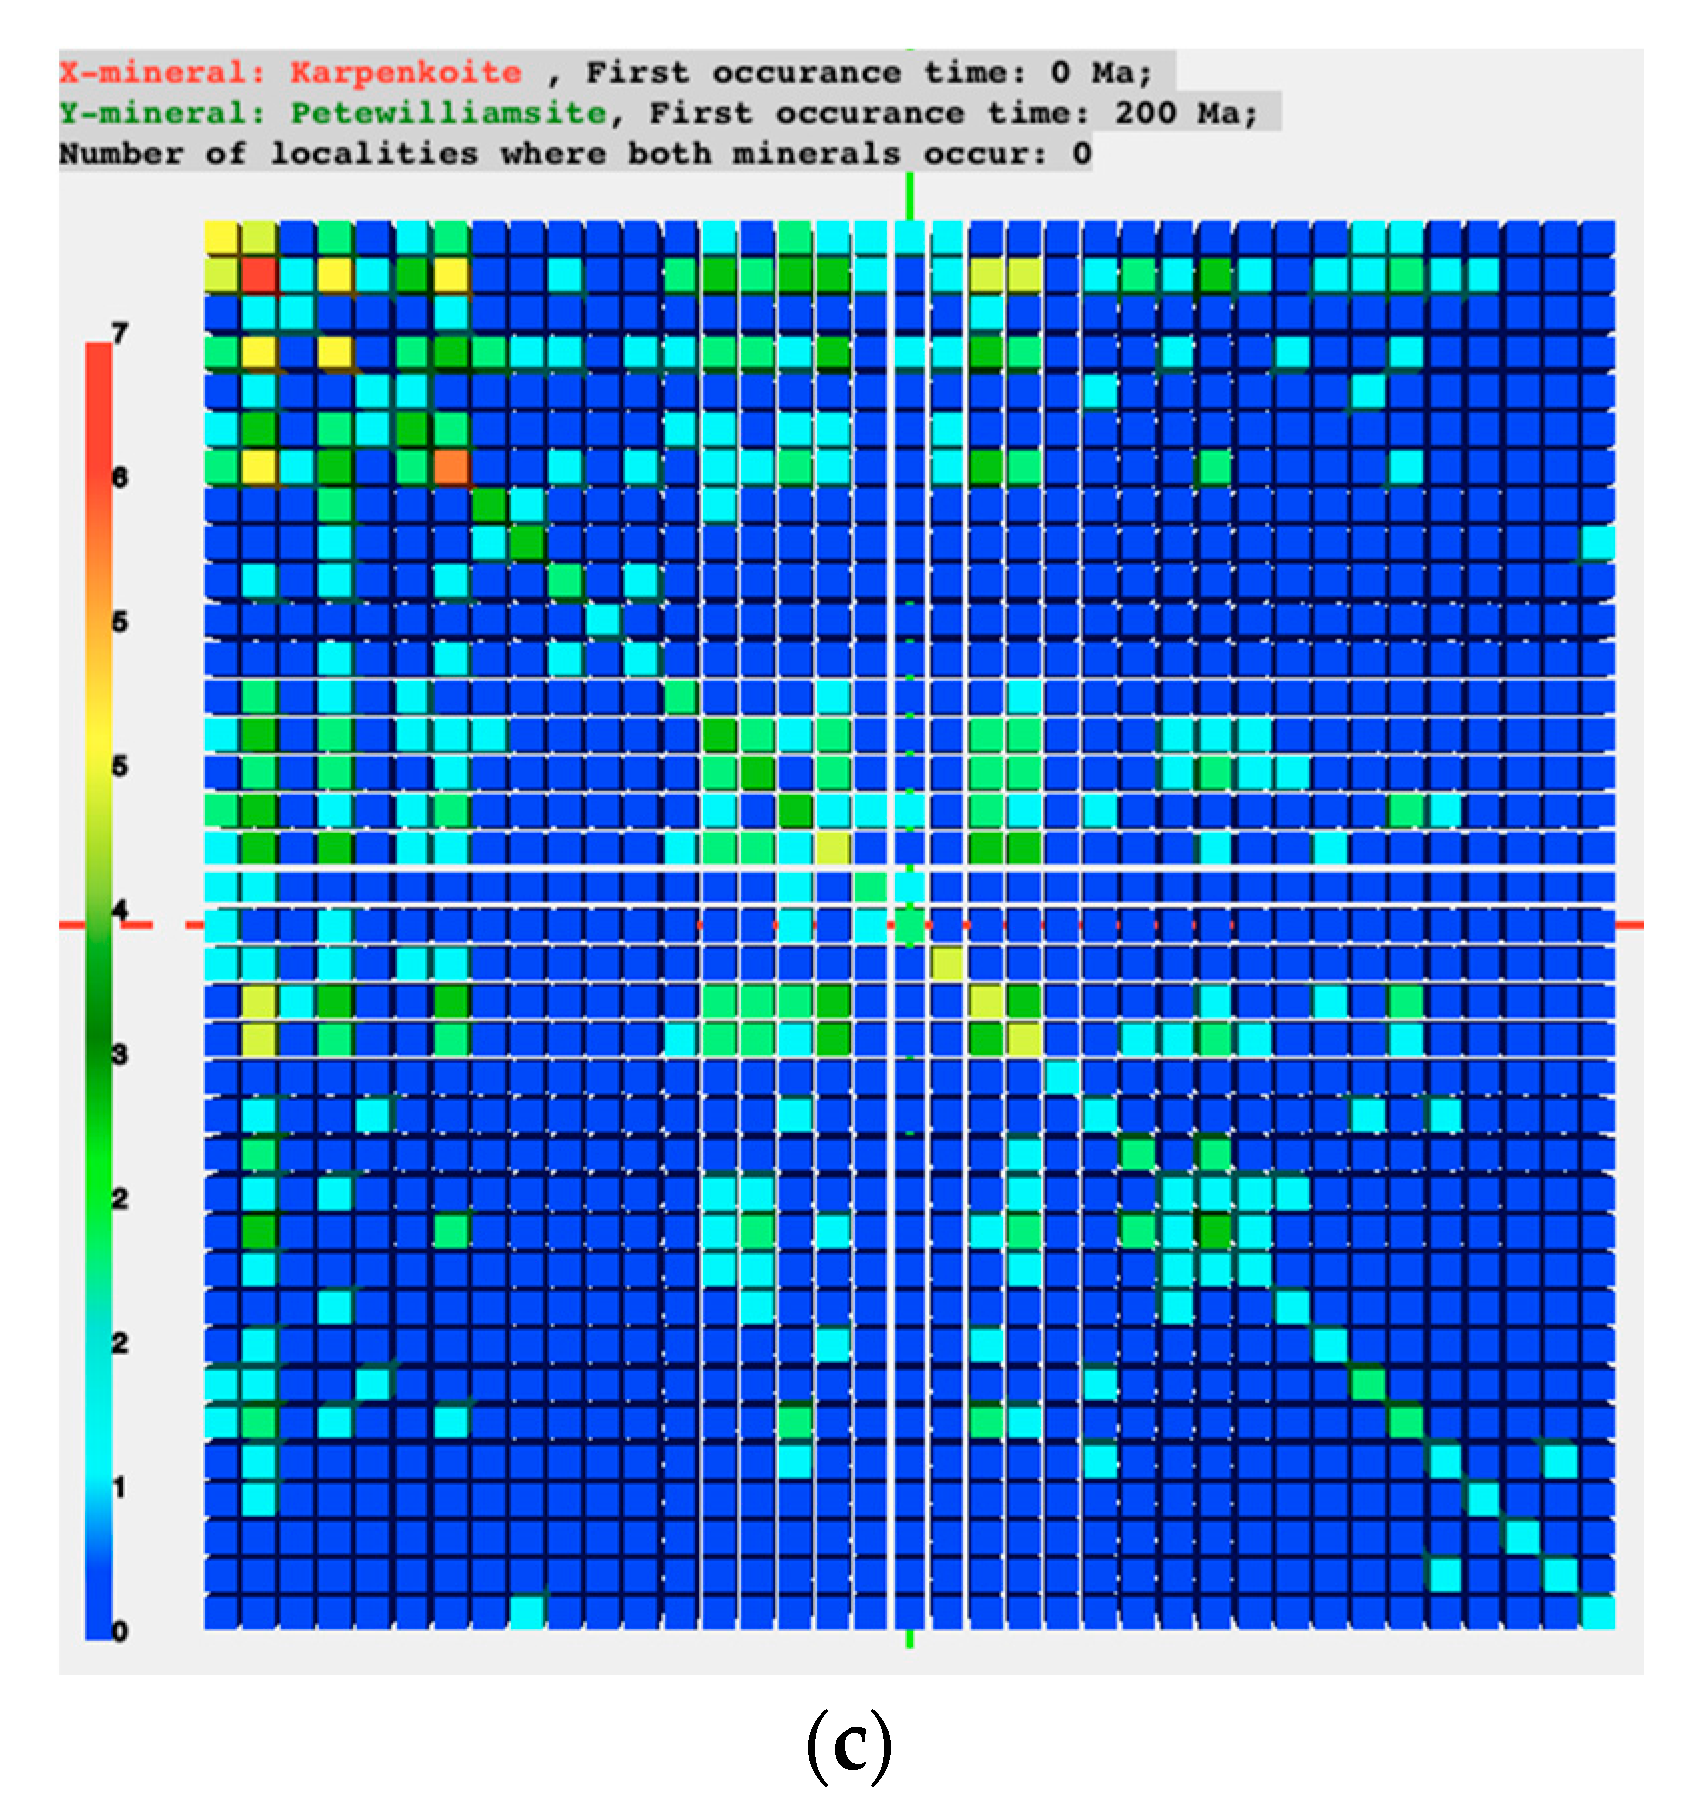
The above three use cases helped the team develop most of the functions in the pilot system. With minor adaption to the code, the system was also used to visualize and analyze datasets in a few other use cases. One of them was the study of co-relations between primary and secondary cobalt (Co) minerals. A primary mineral is any mineral formed during the original solidification (crystallization) of the host igneous rock. A secondary mineral is any mineral that forms later through processes such as hydrothermal alteration and weathering. In this use case, the raw datasets were collected from Mindat and the IMA mineral list, and were organized in a two-dimensional matrix.
Figure 5 shows the visualization output from the pilot system. Rows of higher values in
Figure 5b show a clear correlation of certain secondary Co minerals arising with certain primary Co minerals, and at certain geologic time. This type of previously unrecognized correlation is of great interest to geoscientists for further research.
4. Discussion
Our experience of developing and using the pilot system in the DTDI project demonstrates the usefulness of visual EDA for facilitating hypothesis generation in cross-disciplinary collaboration. Data visualization leverages human’s visual ability to detect complex relationships in data that are difficult to reveal through numbers and text. Quick prototypes and outputs in the EDA increase the chance to see unexpected discoveries. Through the use case-driven, iterative approach, geoscientists and computer scientists from different disciplinary backgrounds had a context to communicate and could work together on focused topics. The accumulated small works could lead to useful technology or a tool that can be reused, such as the pilot system in our work [
39] and the shared code and dataset [
40]. With several rounds of EDA case studies, the research team obtained a better understanding of the underlying data structure and were able to choose appropriate models and plan future data collection.
The results of the presented use cases led to new questions and hypotheses for researchers in geoscience. For example, one use case revealed that elements are divided into those that strongly favor hydrated minerals versus those that do not. Since water is considered a volatile constituent in minerals, this result leads to questions about other volatile elements. Can elements be sorted into groups based on correlation or anti-correlation with fluorine? Can they be sorted based on correlation or anti-correlation with chlorine? Do these divisions tell us something new about the sorting of elements in geochemical environments? These are all examples of research hypotheses that arise from the EDA techniques presented here.
Although this research was in the domain of geoscience, the function of visual EDA in a data science process and the experience of the use case-driven, iterative approach can also be translated into other disciplines. The way people do science is being changed by massive open and/or proprietary data resources. Researchers of various disciplines can benefit from the visual EDA for hypothesis generation. In addition to the application in cross-disciplinary contexts, the visual EDA can also be applied to intra-disciplinary applications through a data science process. In general, data science helps transform raw data into meaning and understanding [
41]. Small and focused use cases help researchers understand the datasets, choose the research question, and efficiently collaborate on data analysis [
42]. In addition to the changes in hypothesis generation, the data science process in an open data environment also has a few other characteristics. Since the datasets are collected from different resources, there could be heterogeneities in the data format, conceptual structure, and even the terminology. A step of data pre-processing or data wrangling [
43] is needed to transform the raw datasets into an organized form that is appropriate for EDA and CDA. Data pre-processing was a very important step in our research as we had raw datasets from three sources: RRUFF, the IMA mineral list, and Mindat. Several team members worked together to find connections among those datasets, build a data structure to host the connected records, and transform it into the CSV format. The EDA in our work focused on quick prototype and visualization output. The well-organized dataset from the pre-processing allowed quick visualization outputs through very easy operations, so the team could have more time to focus on analyzing patterns in the result. Some clues for the EDA were generated in the step of data pre-processing when we were discussing the connections between data resources. We then reflected the discussed idea in the data structure and visualized the dataset in the EDA step.
A few future research topics can be proposed. To facilitate more interactive collaboration in a cross-disciplinary research team, we can leverage virtual or augmented reality in the visual EDA, such as the Microsoft HoloLens or the Computer Animated Visualization Environment (mini-CAVE). The developed 3D matrix pilot system and the conducted use case studies also resulted in a few new research hypotheses. We can calculate the expected numbers of minerals with X + Y + Z based on average crustal abundances. By comparing the observed and expected numbers, we will be able to estimate the extent to which the element triplets occur with greater or lesser frequency than would be expected. In the 3D matrix, the arranged elements on each axis can have multiple associated parameters. For example, we can add data on atomic number, ionic radius, period, electronegativity, crustal abundance, and more. By using those parameters, we can order elements along the three axes automatically to test different clustering of elements. The value in each cell of the 3D matrix can also represent other properties besides the mineral counts. Furthermore, using cation and anion oxidation states instead of chemical elements on the axes may allow us to see dramatic correlations based on redox.

 ,
, 