Geo-Environmental Estimation of Land Use Changes and Its Effects on Egyptian Temples at Luxor City


 ,
, 
Abstract
1. Introduction
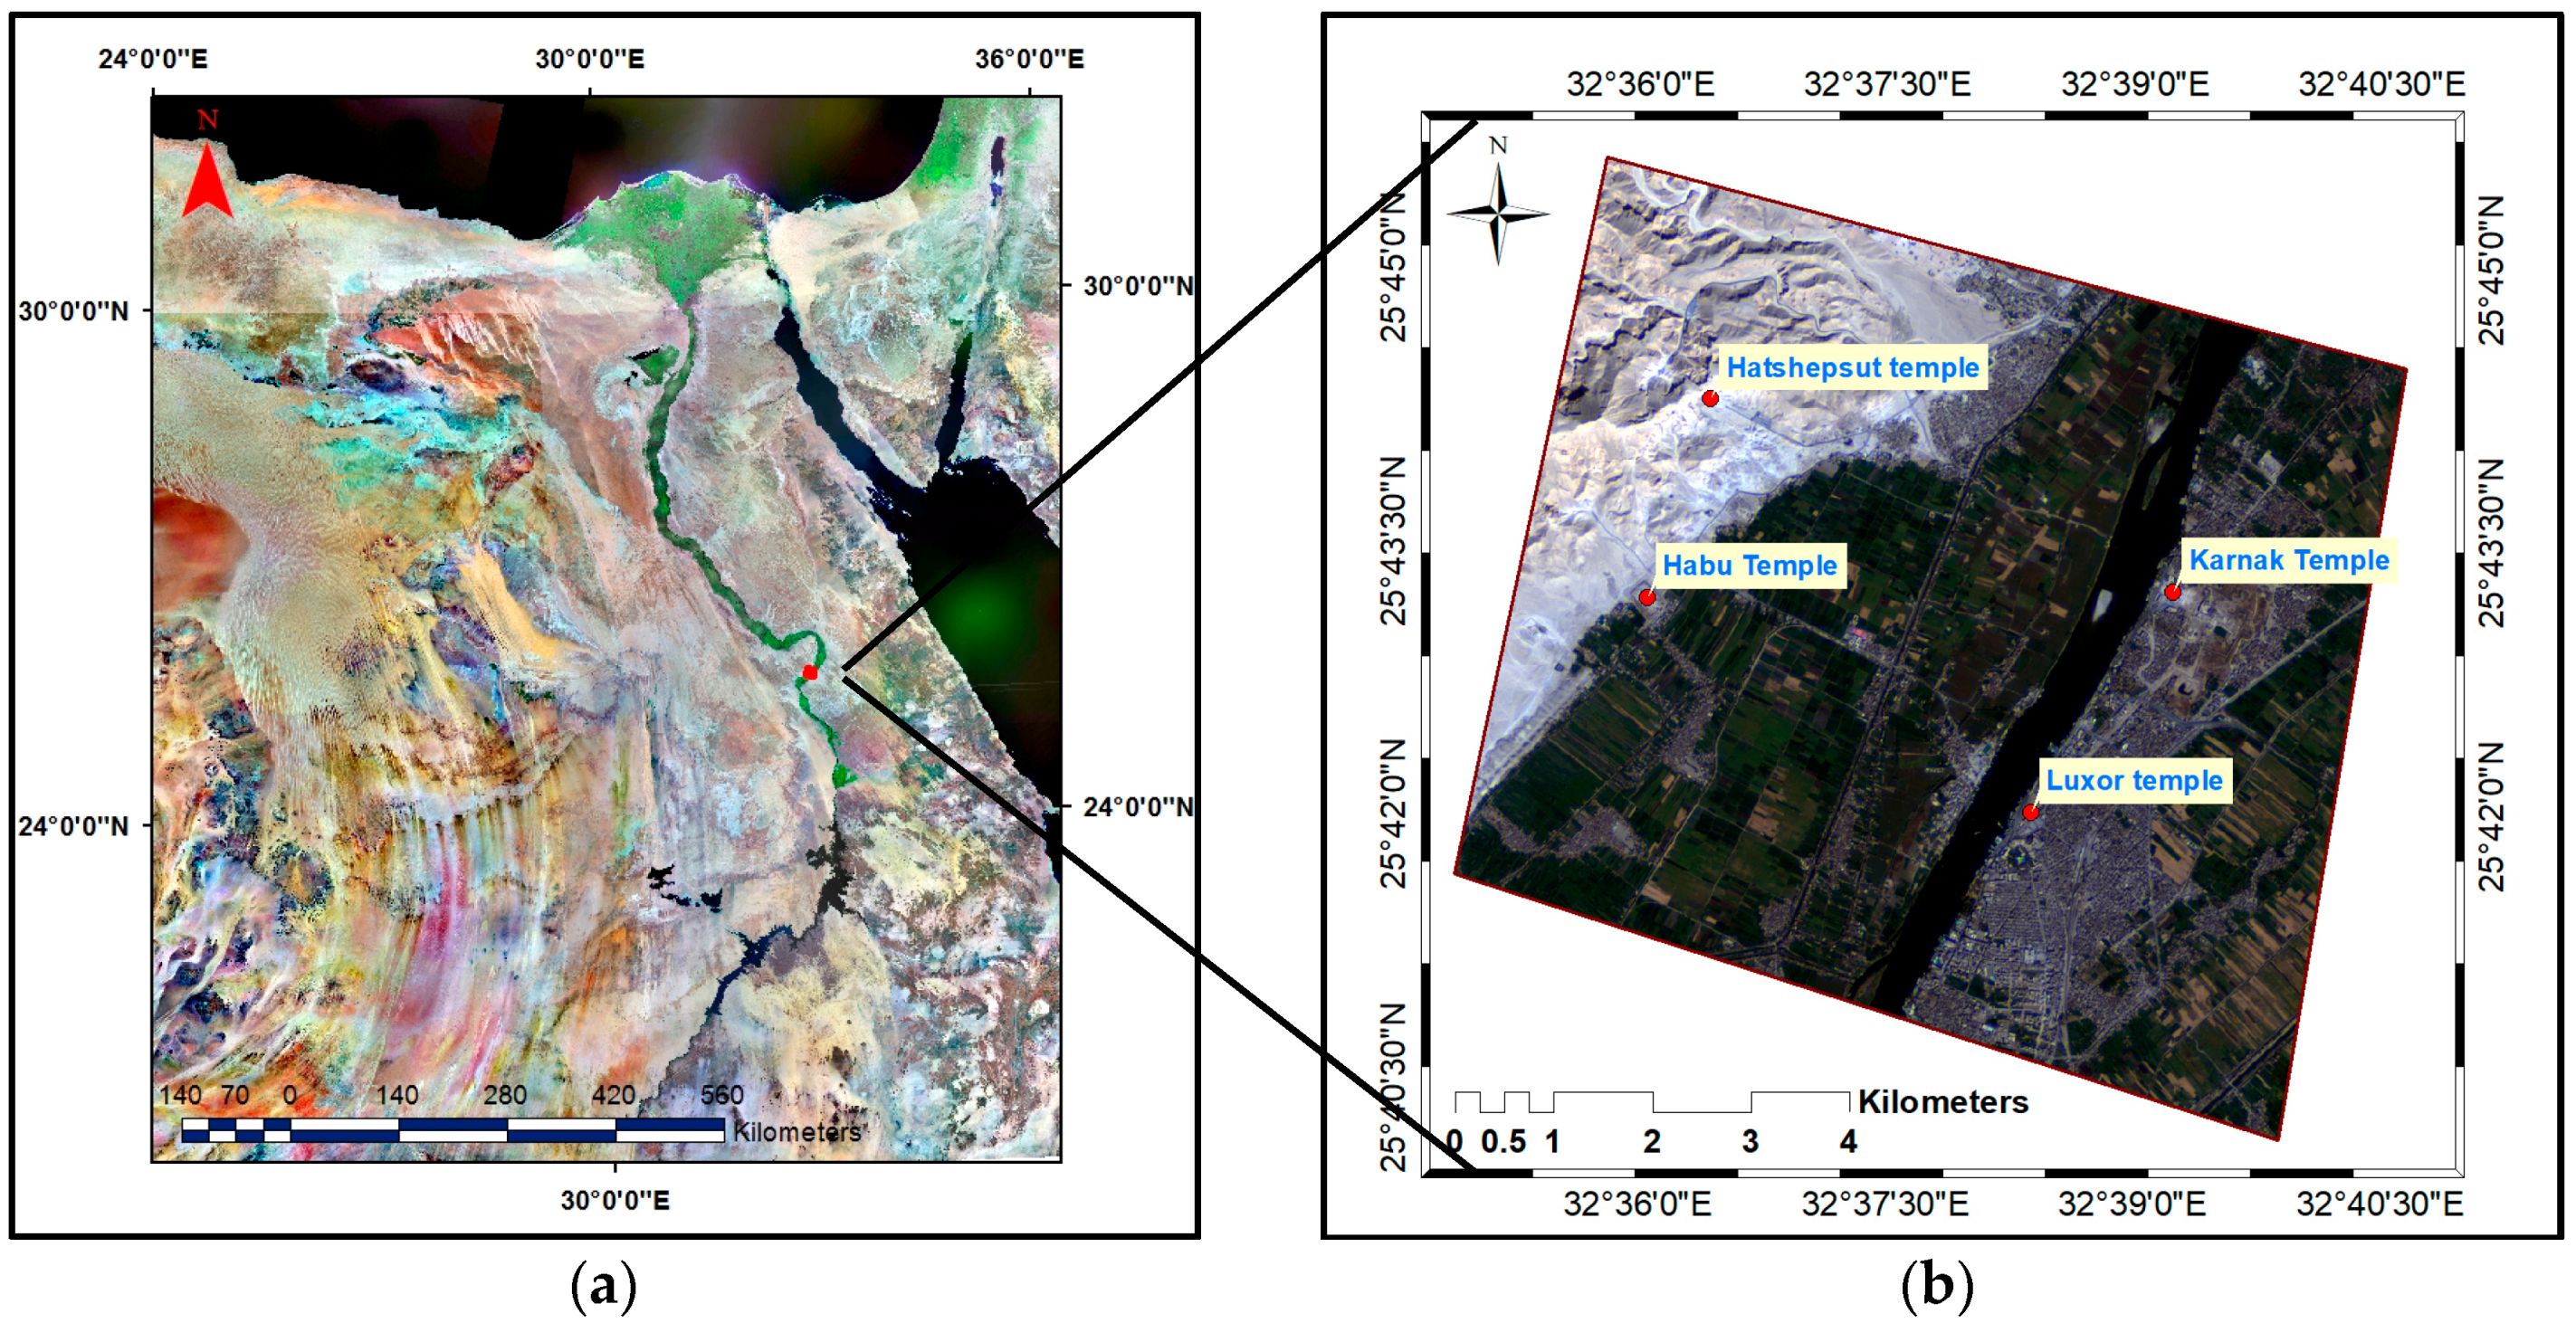
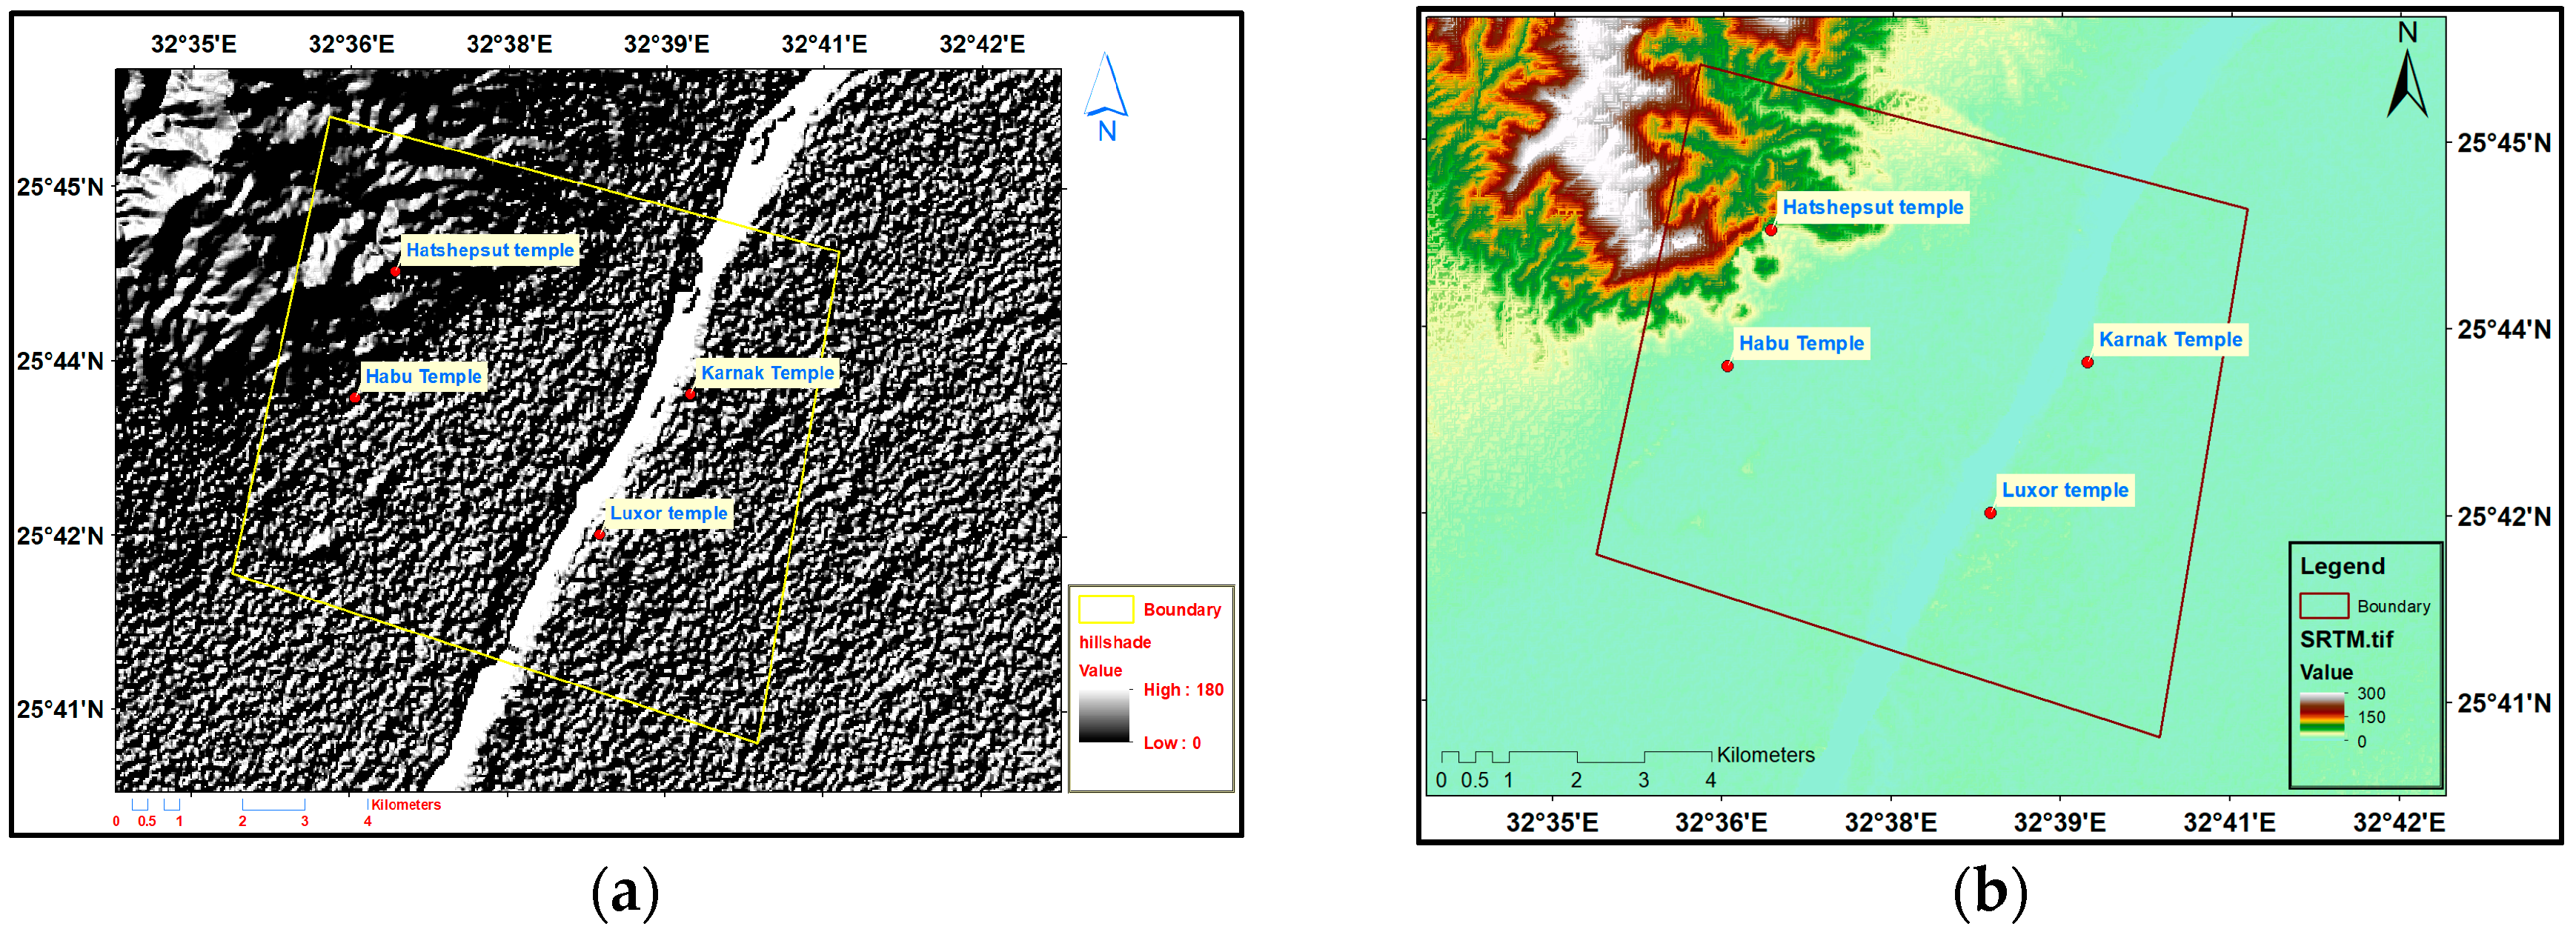
1.1. Study Area
1.2. Luxor City Temples
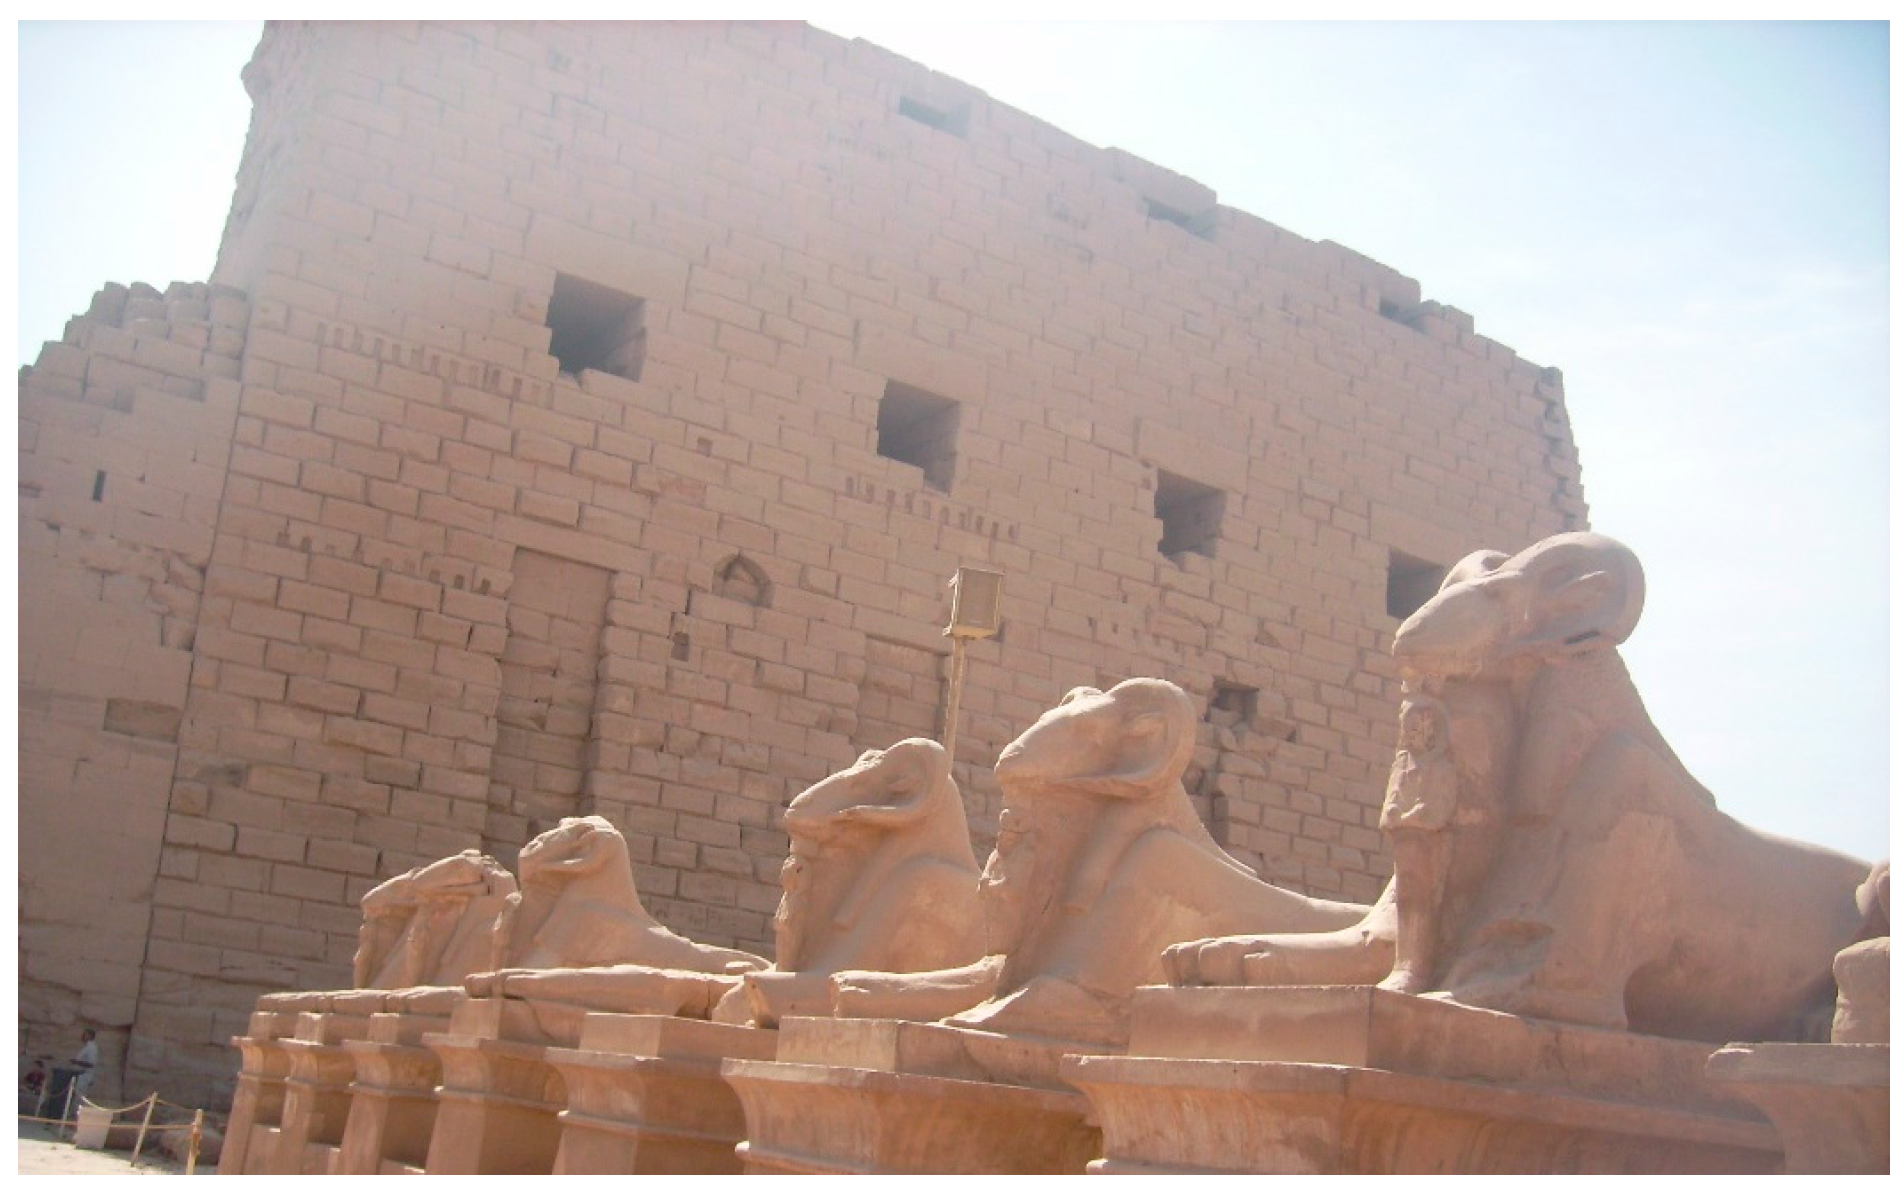
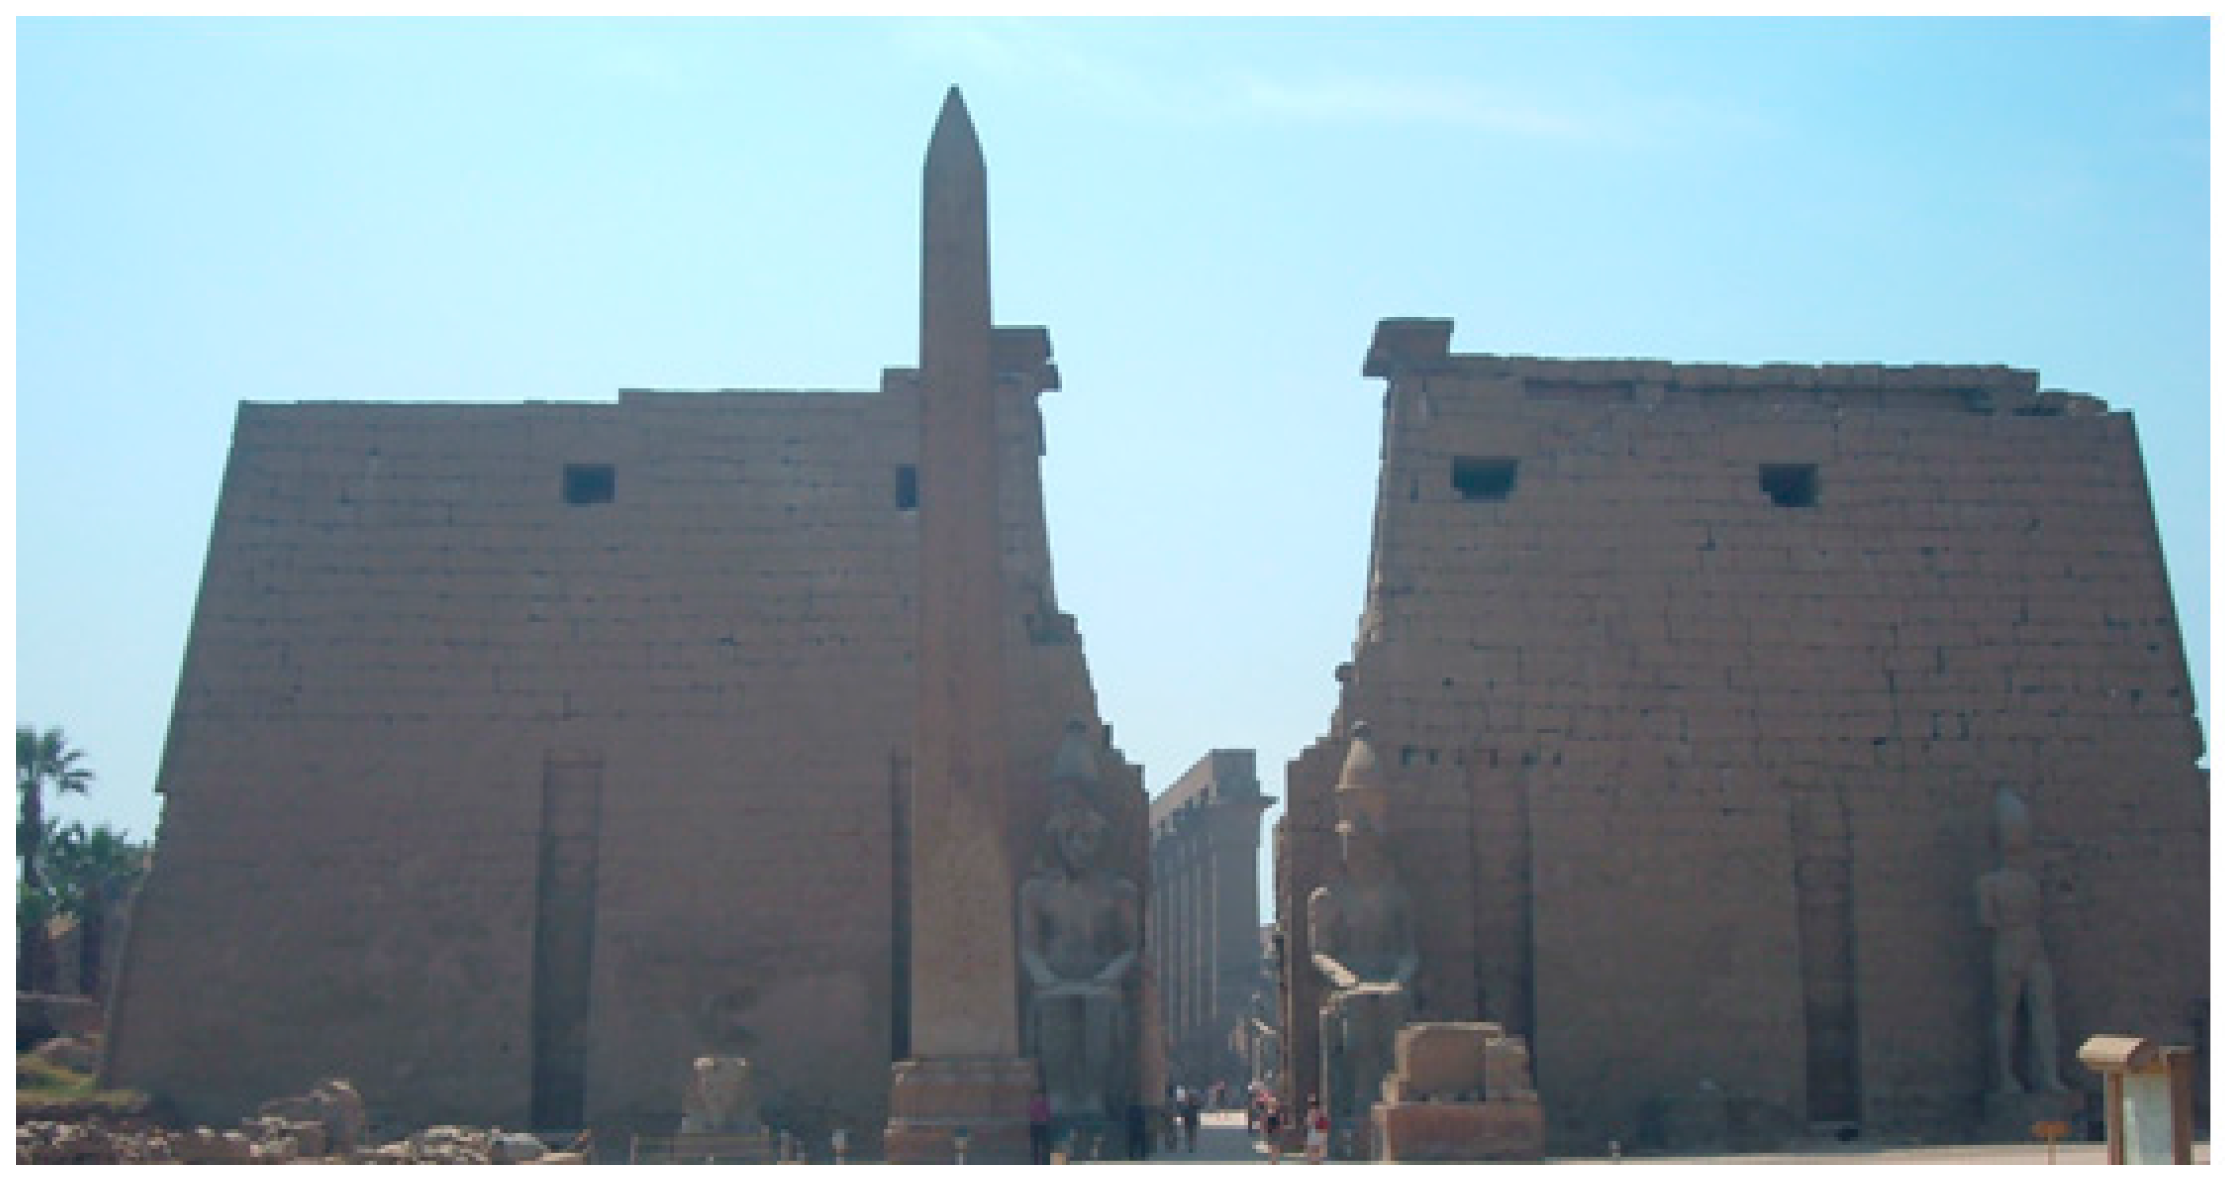
1.2.1. East Luxor City Temples
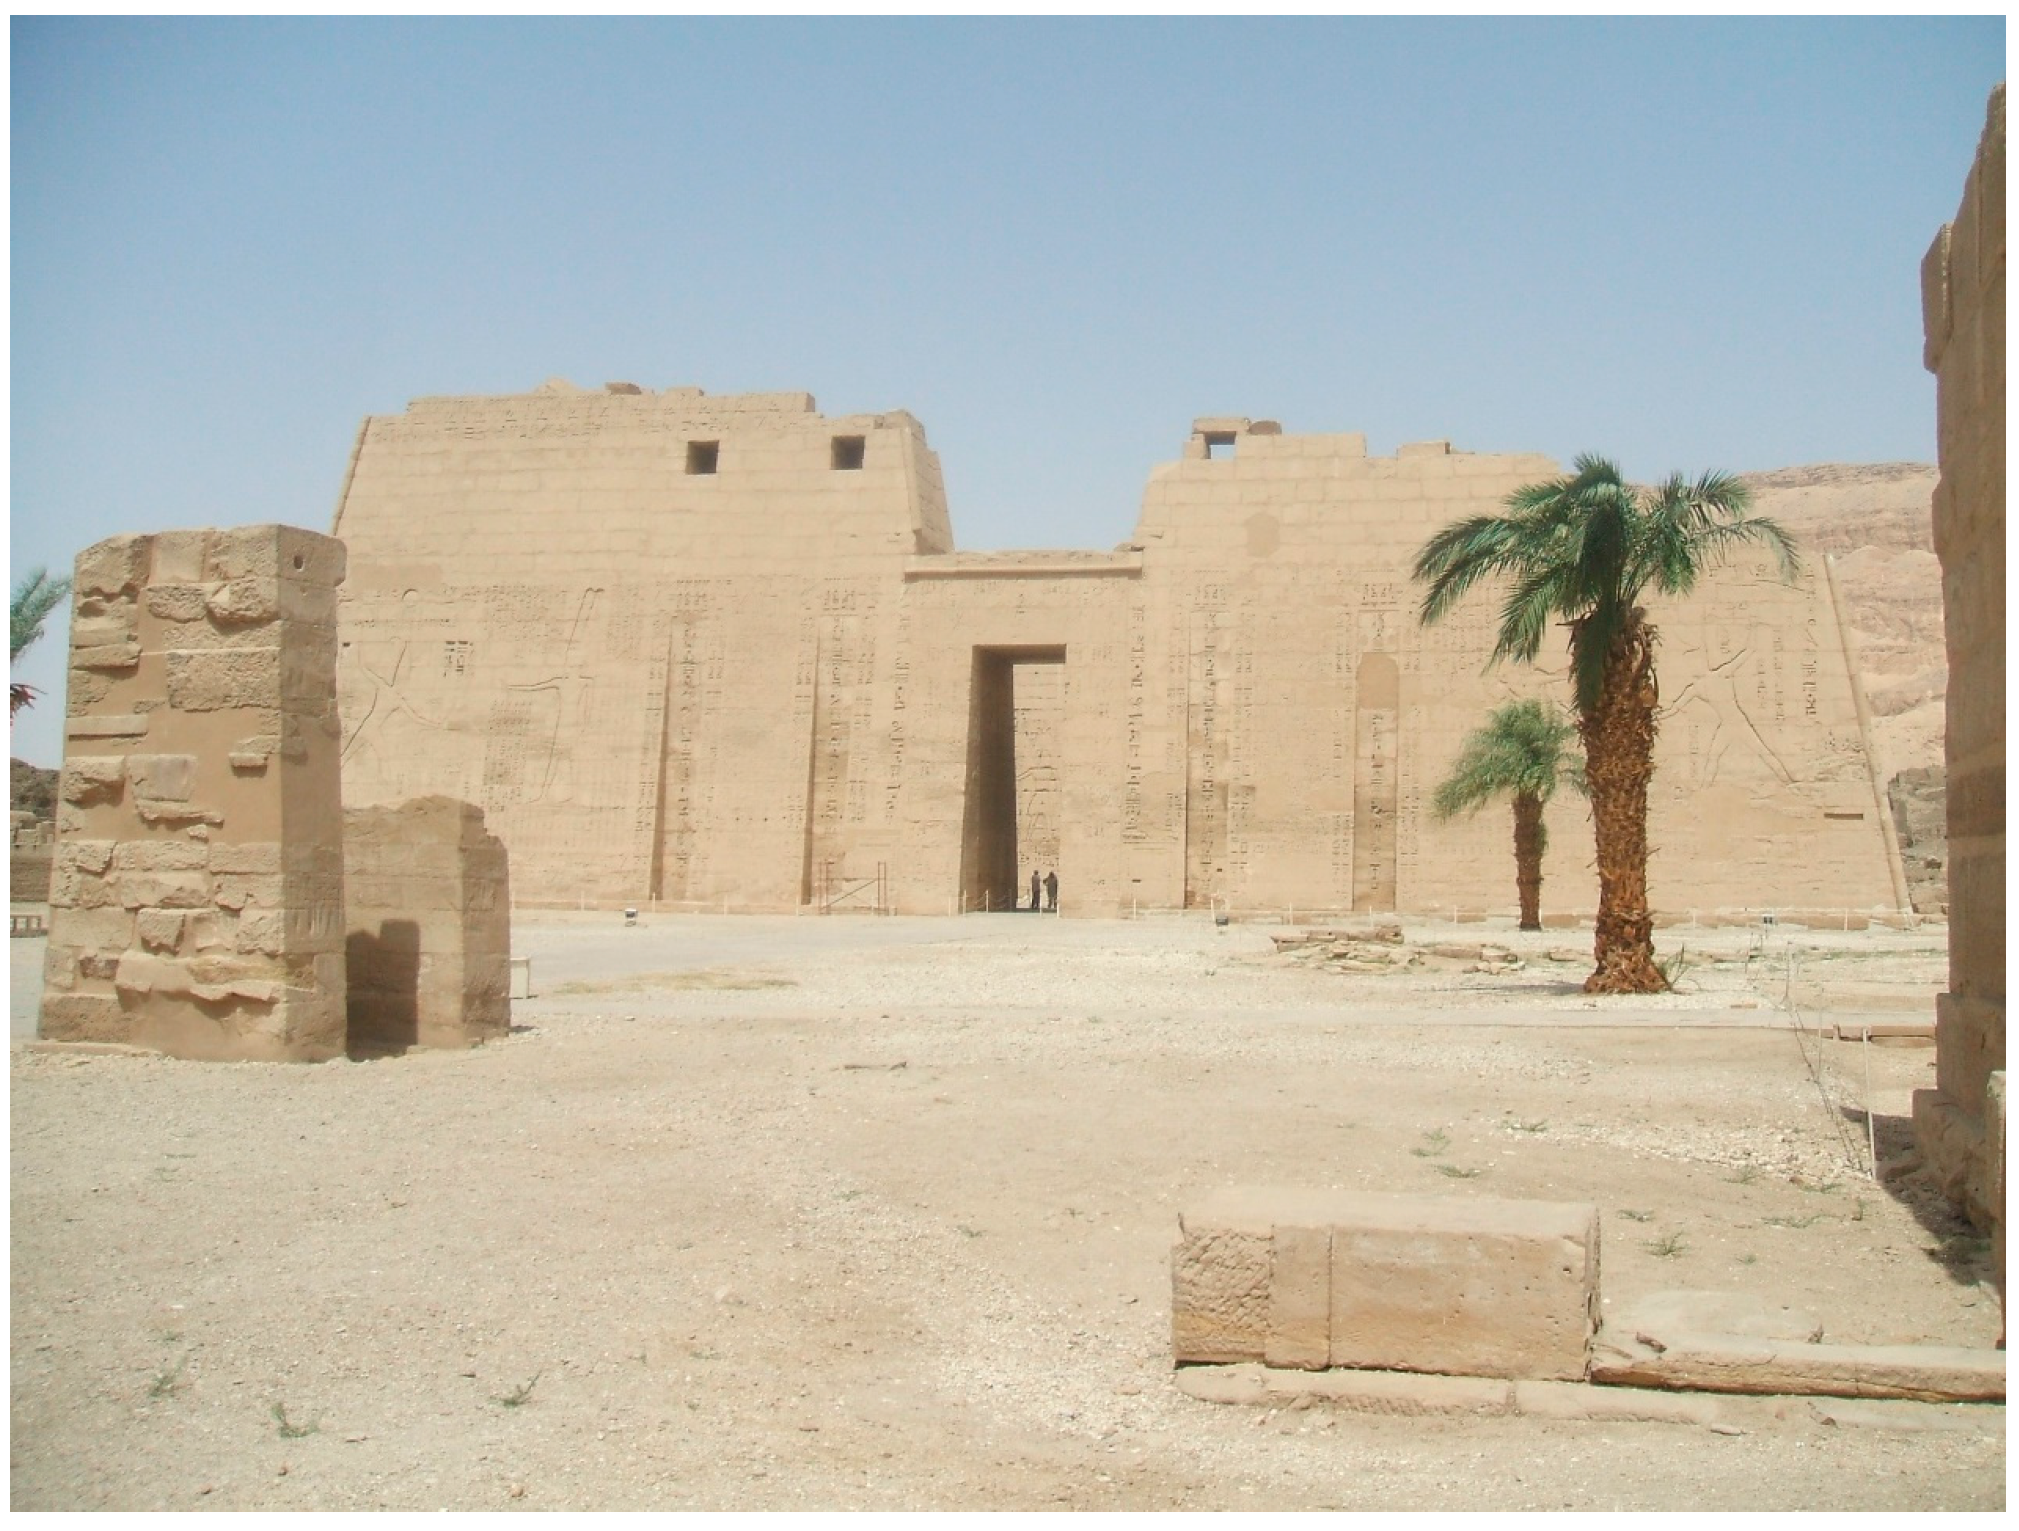
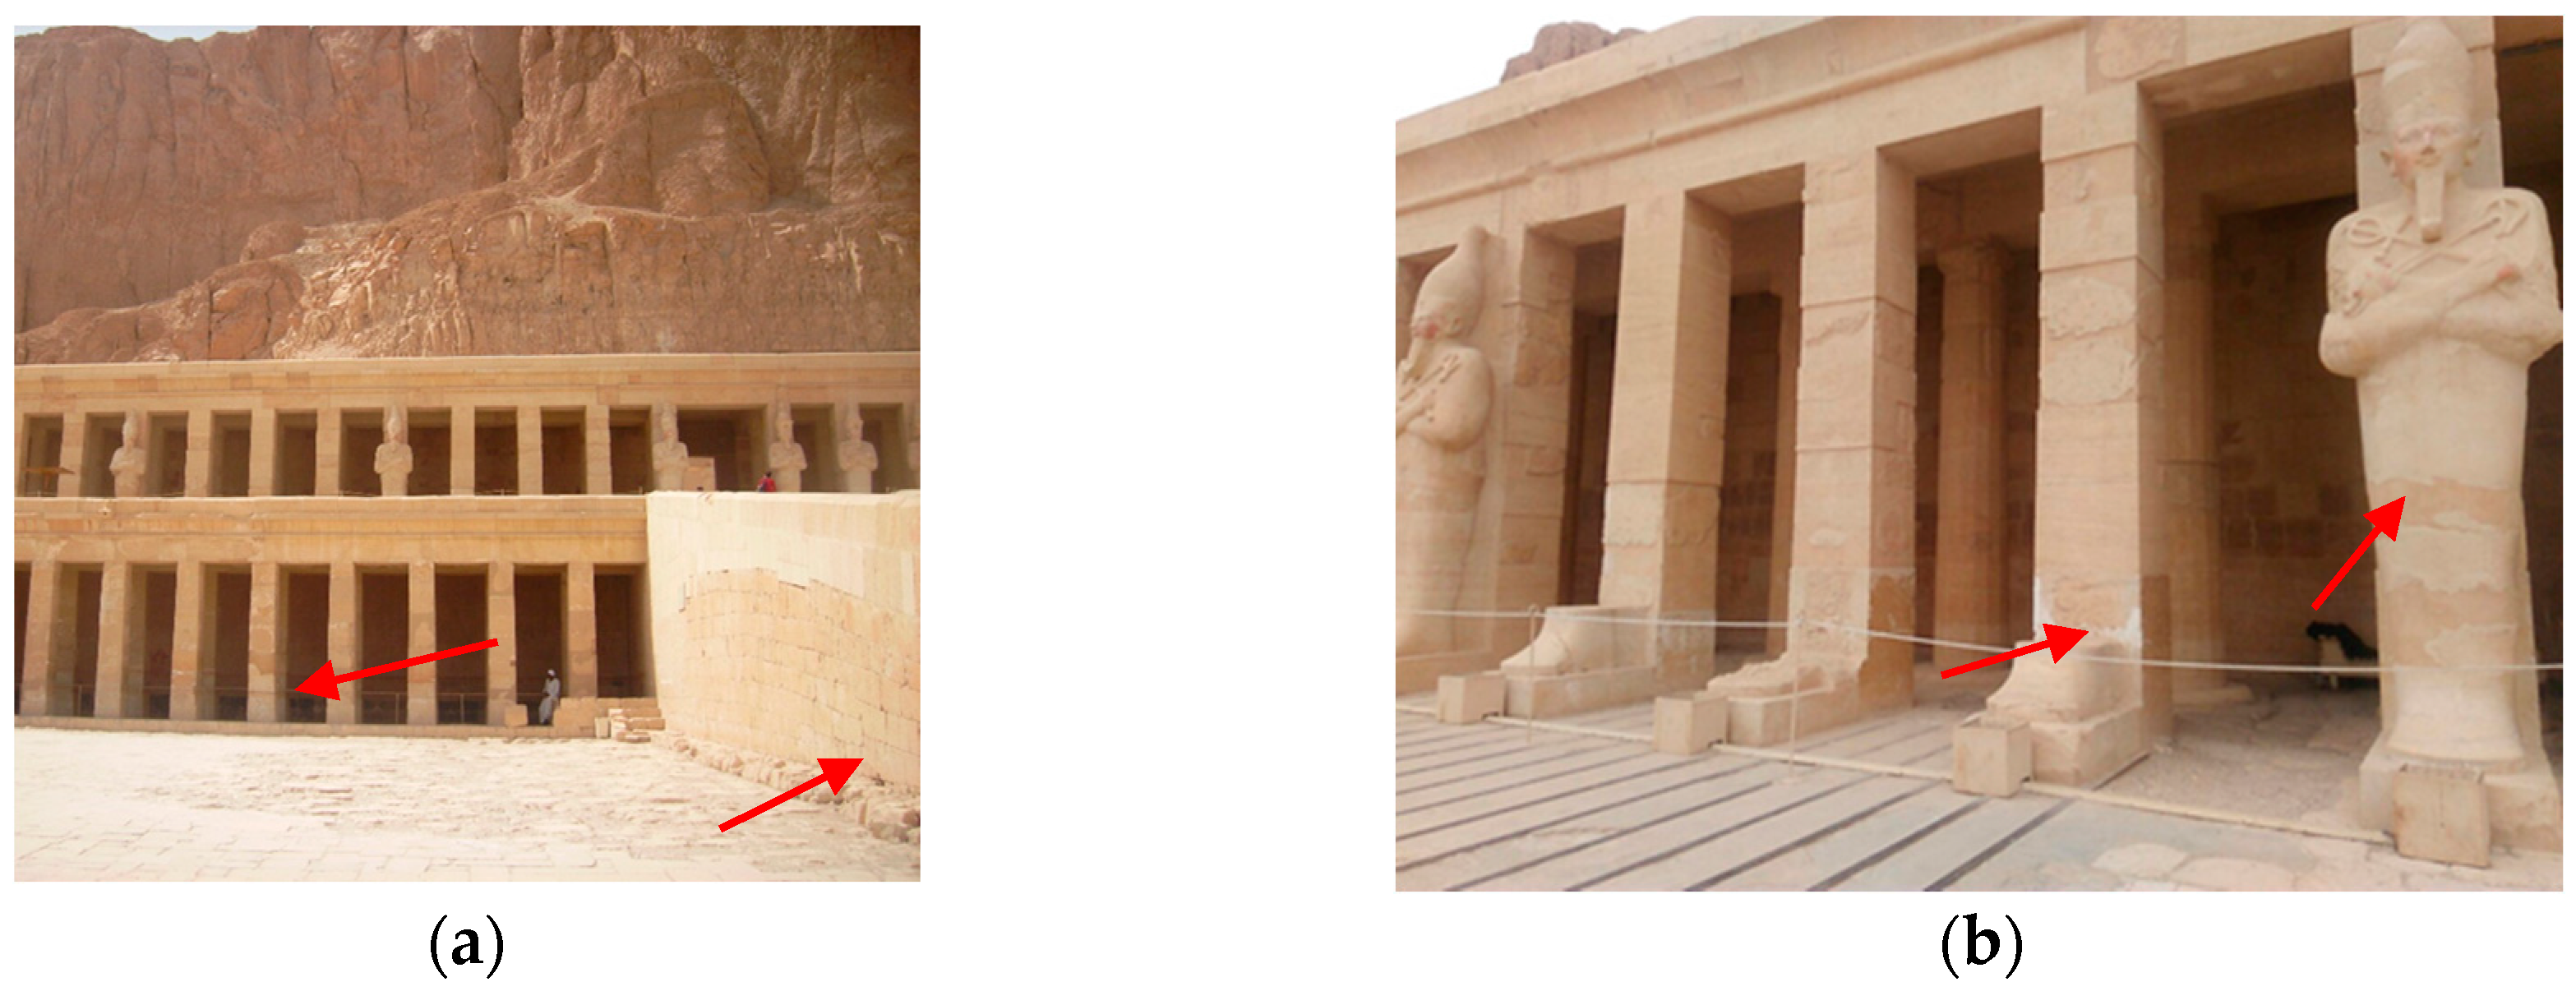
1.2.2. West Luxor City Temples
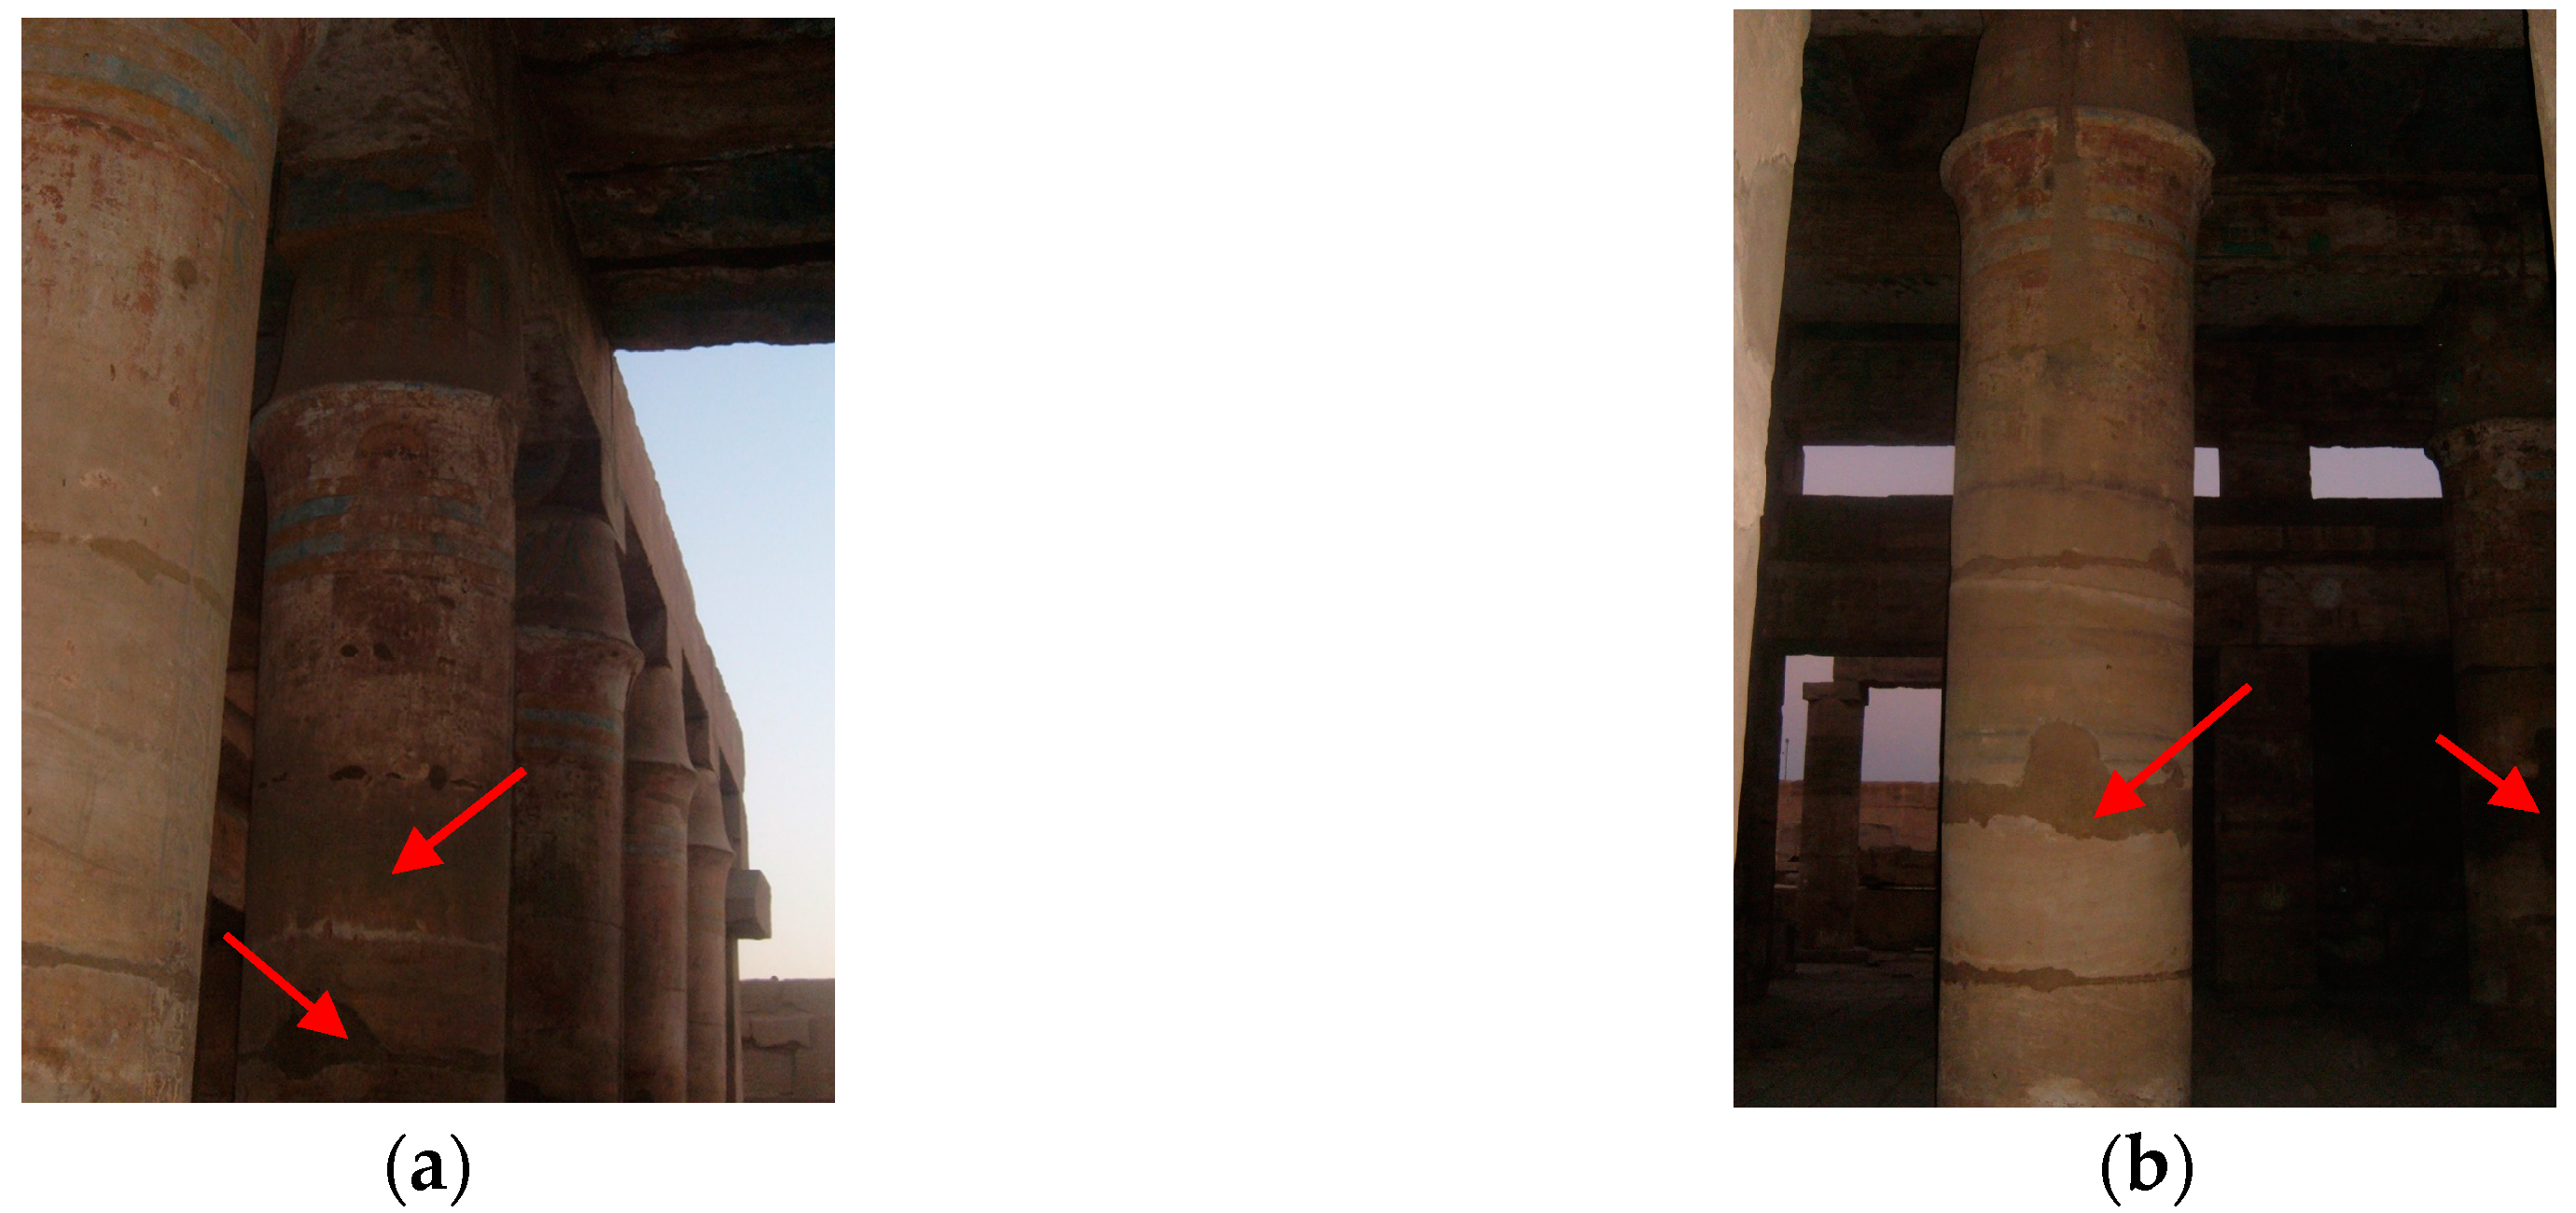
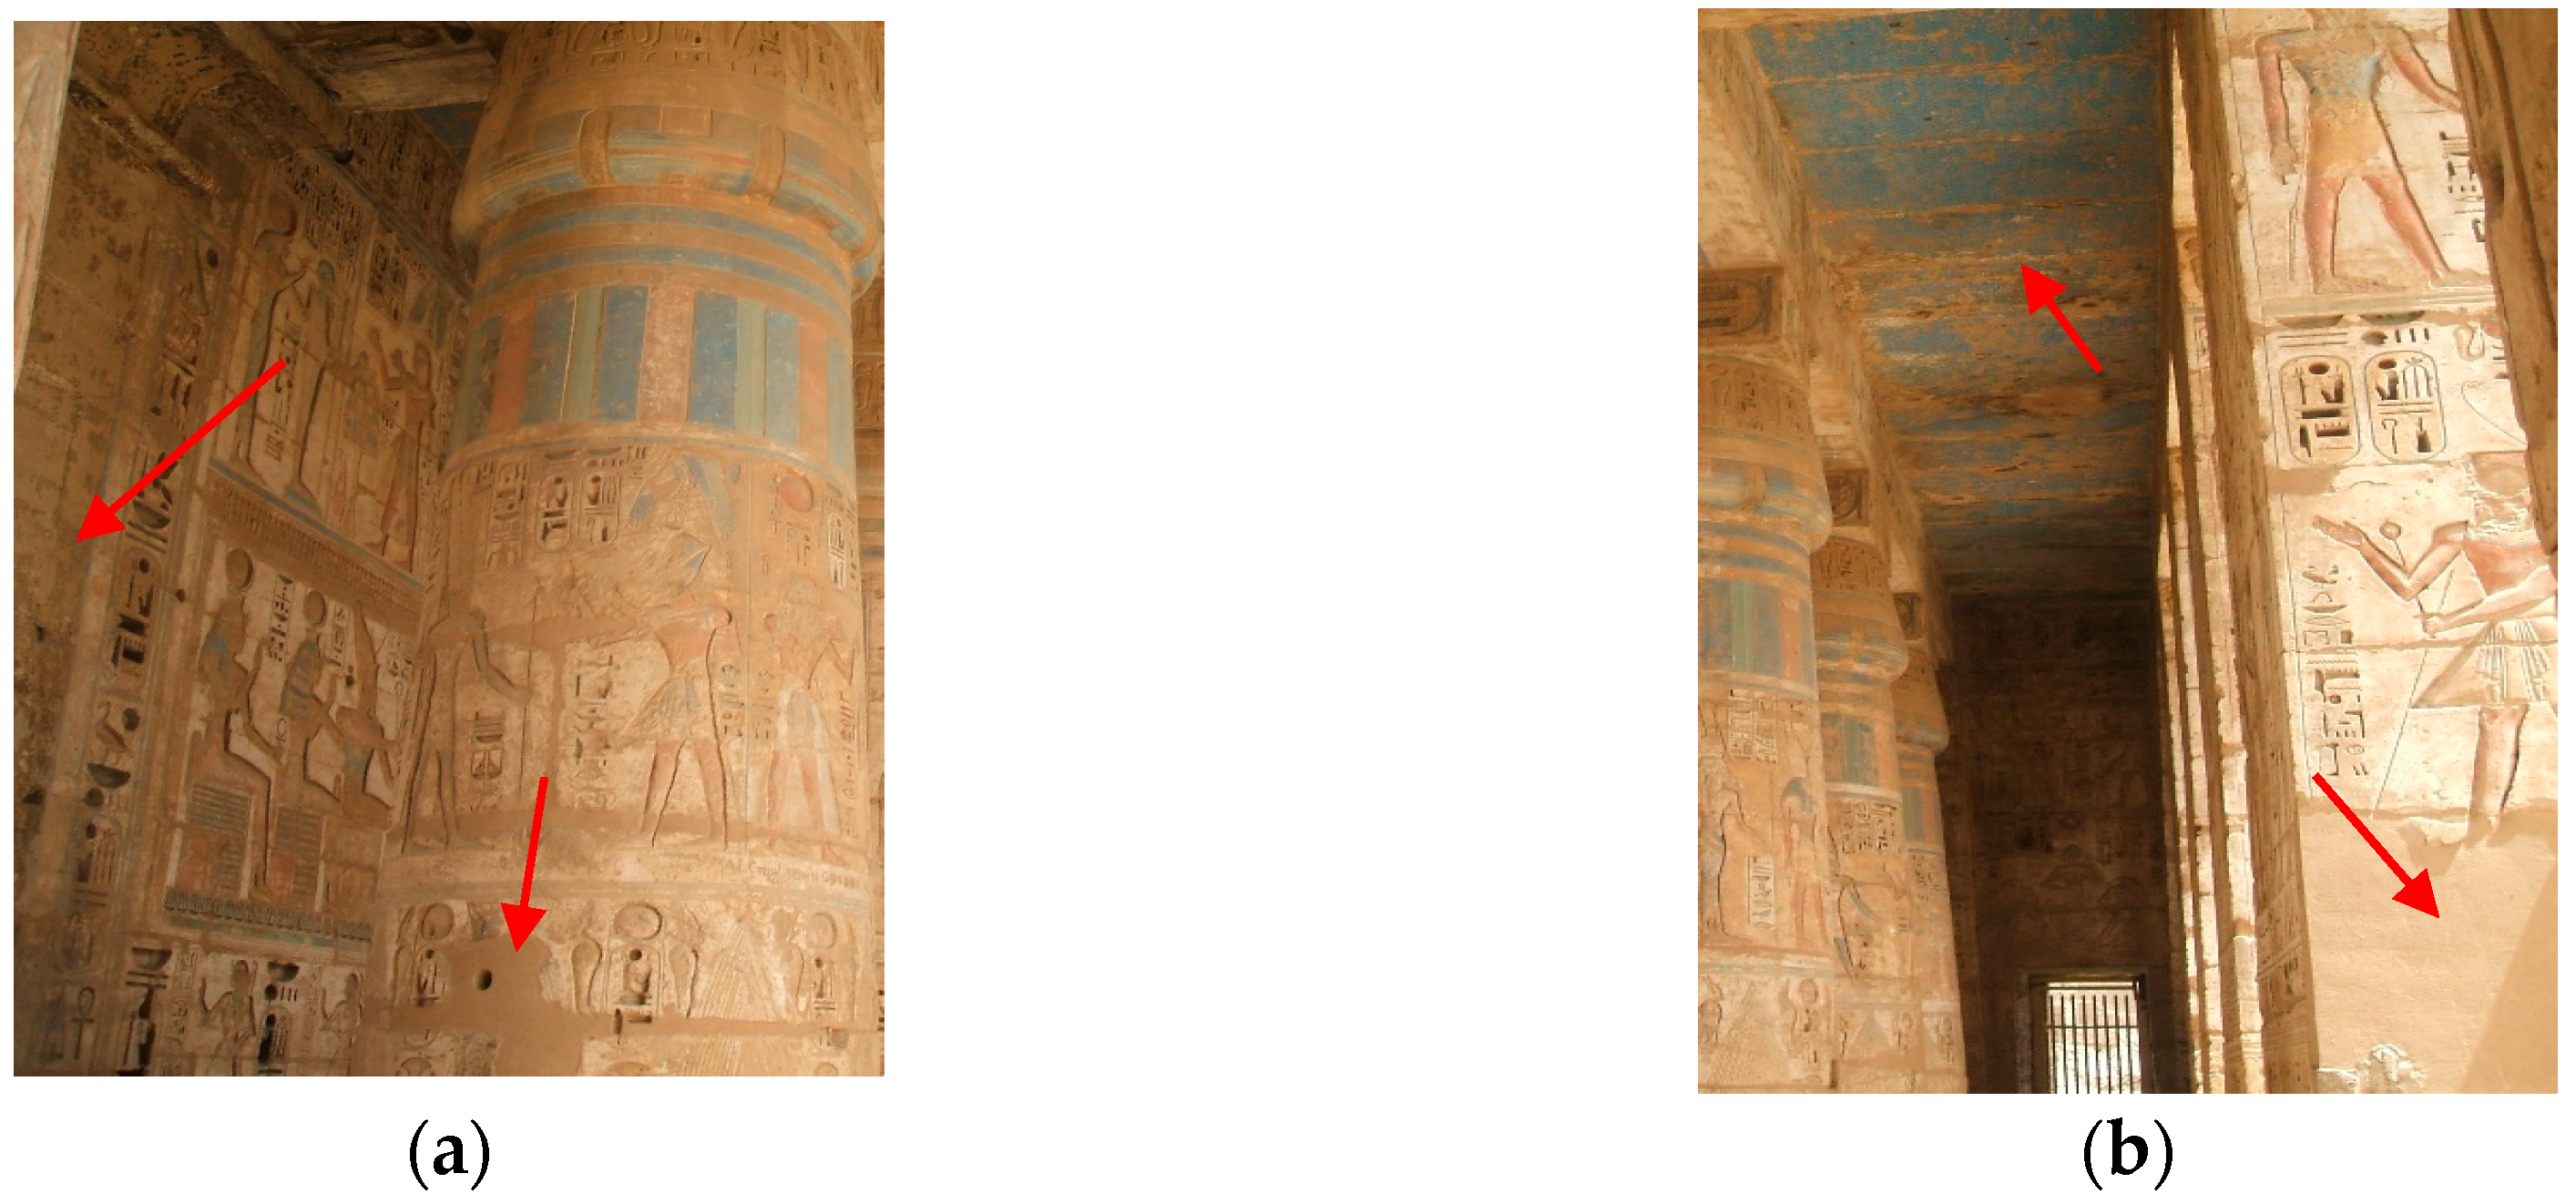
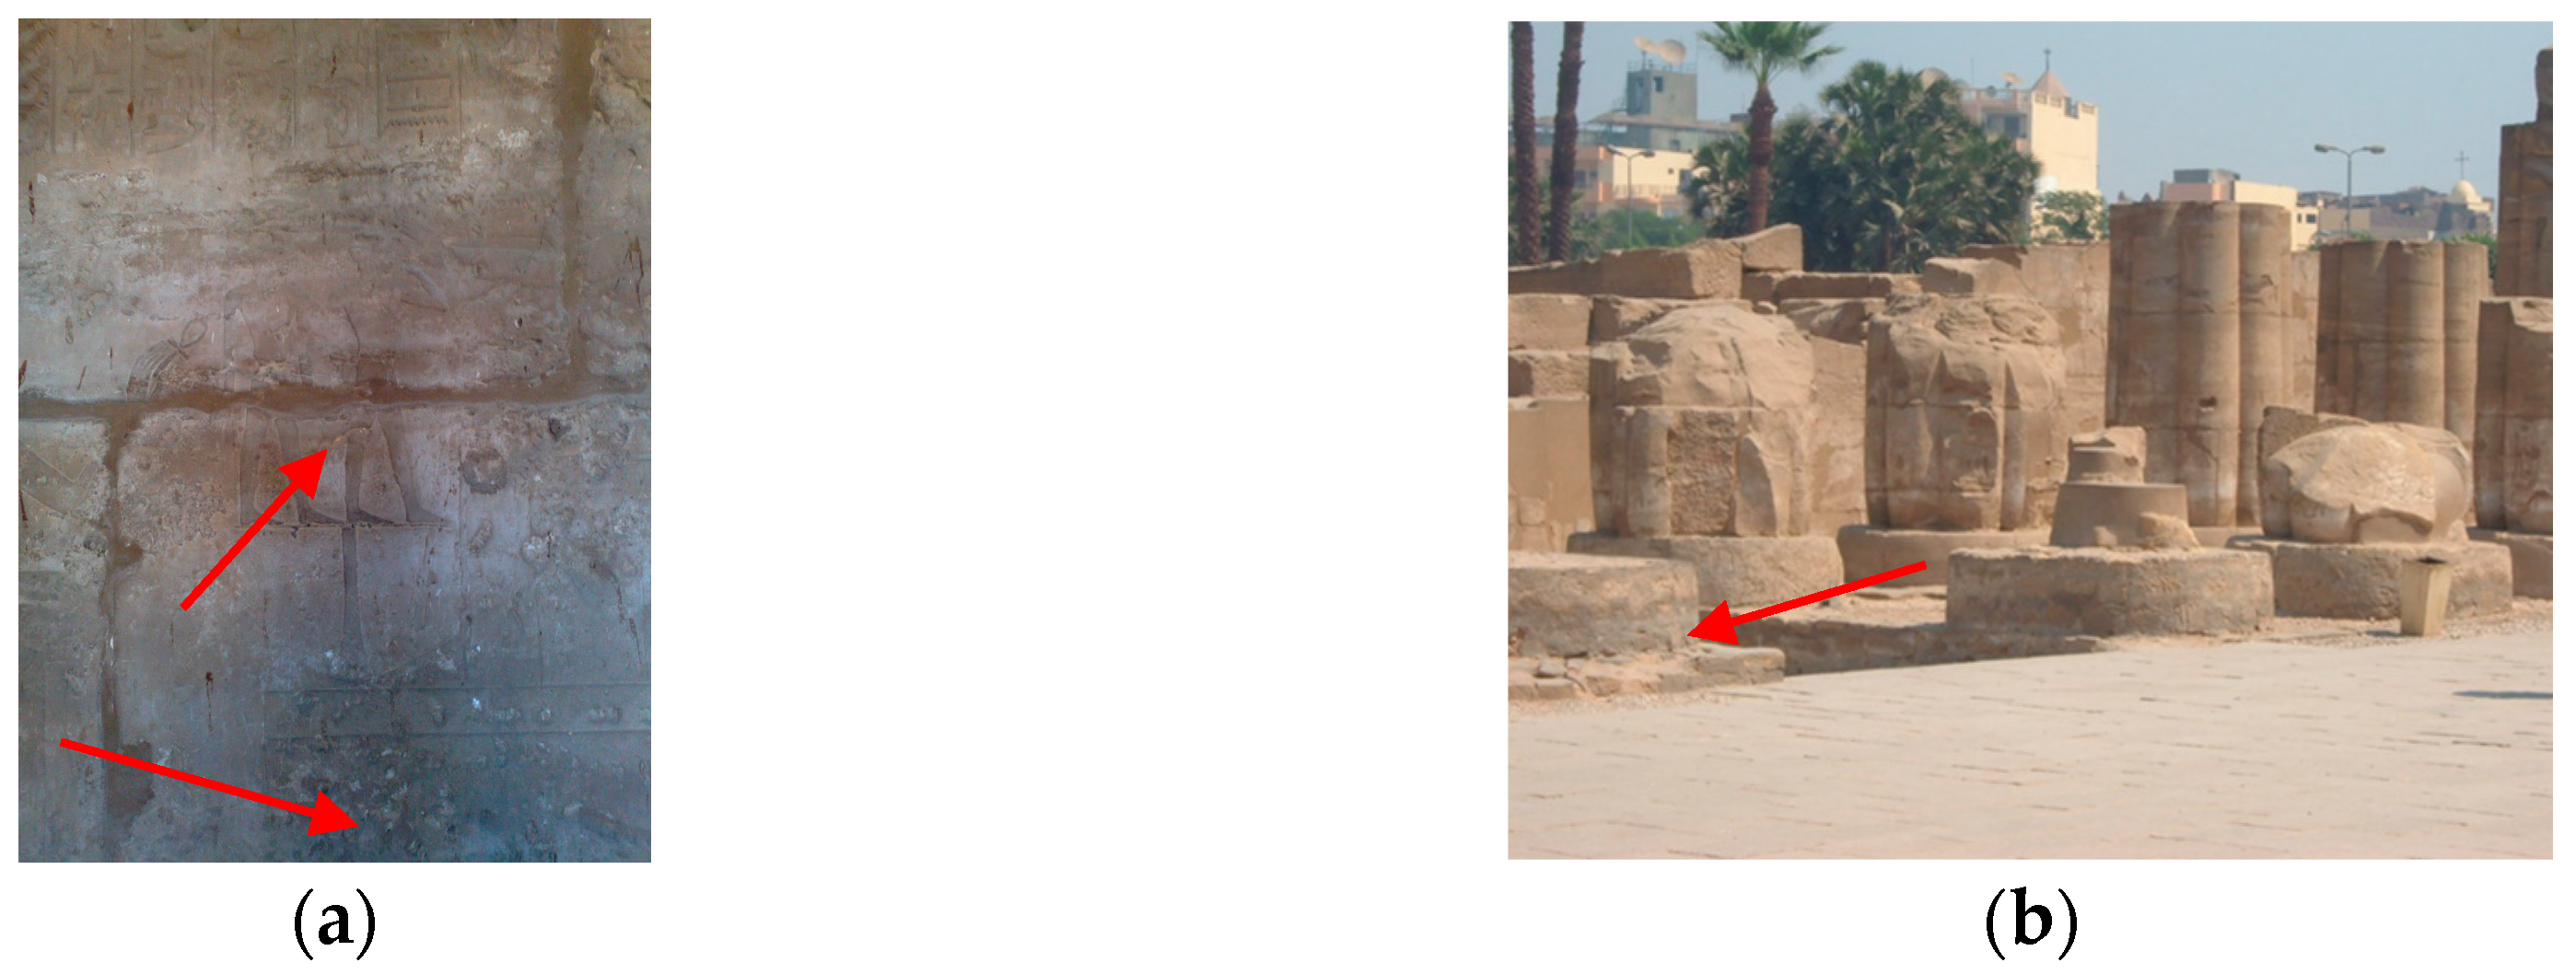
1.3. Environmental Status
2. Materials and Methods
2.1. Materials
2.2. Methods
2.2.1. Image Processing
Band Combination
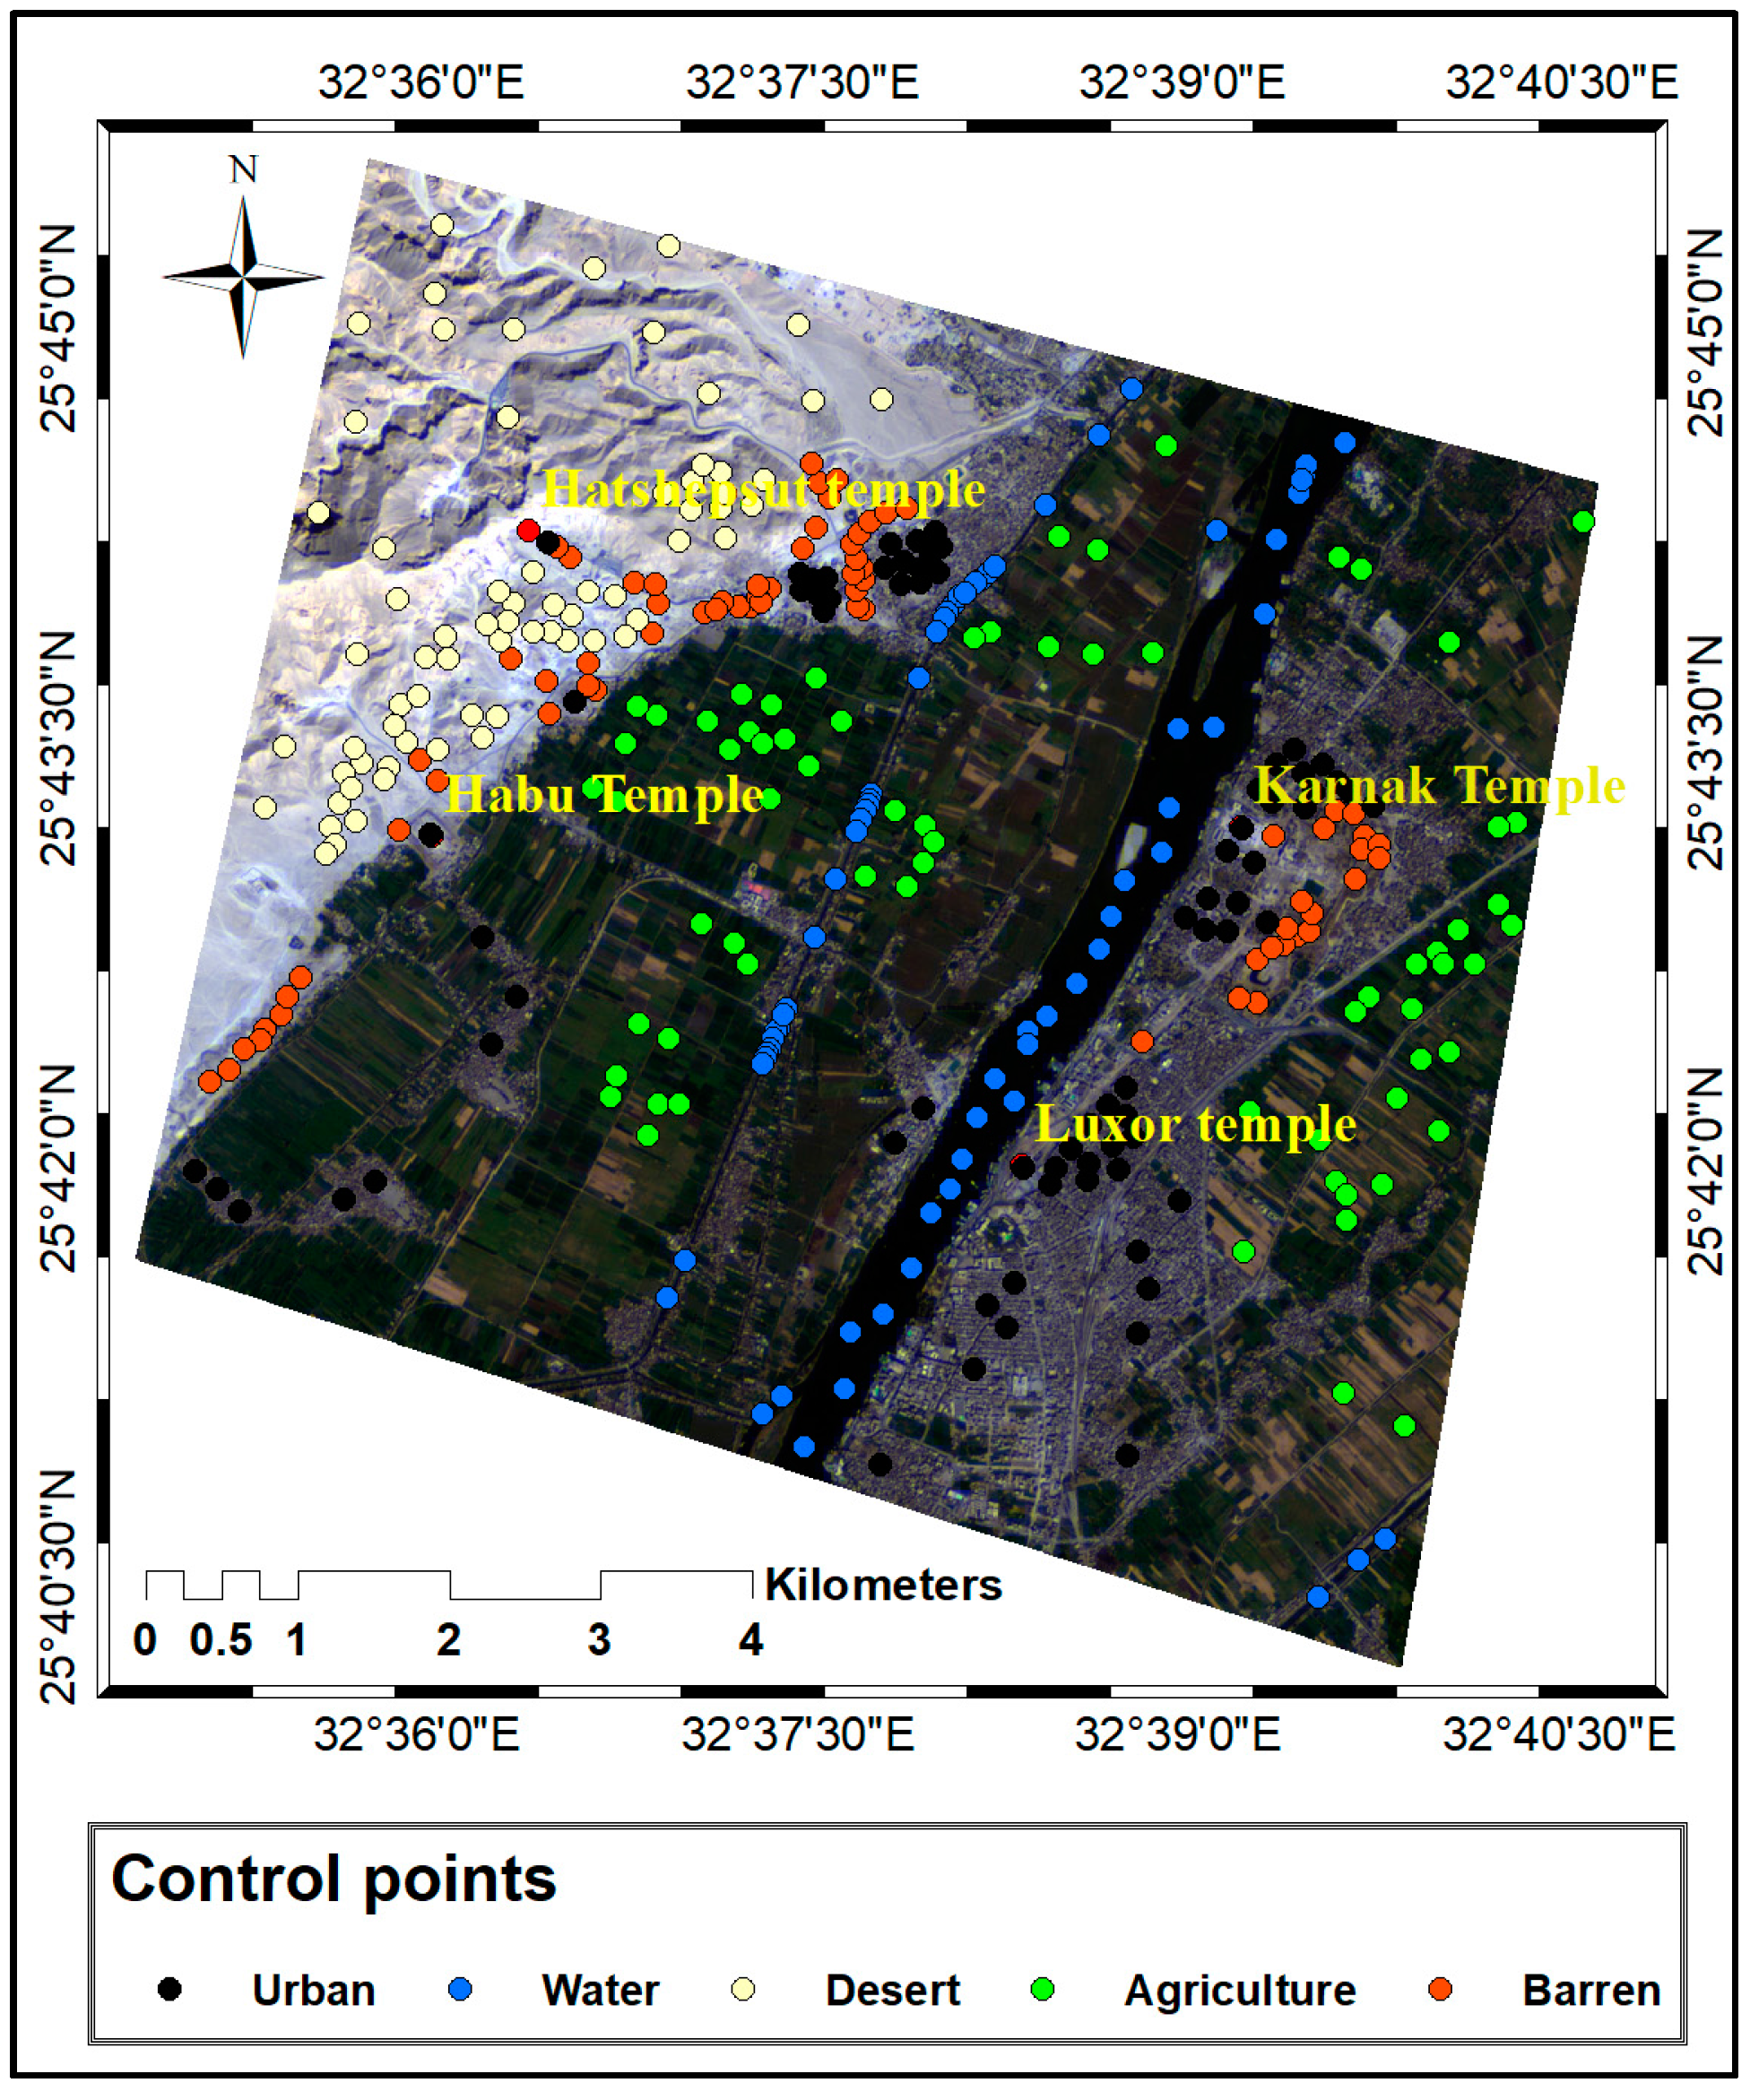
Supervised Classification of Images
Accuracy Assessment
3. Results and Discussion
4. Recommendation
- Deliberate destruction of heritage
- Flooding
- Housing
- Impacts of tourism/visitor/recreation
- Land conversion
- Management activities
- Management systems/management plan
- Water (rain/water table)
- Other Threats
- Rising underground water level
- Risks of flooding (Valleys of Kings and Queens)
- Absence of a comprehensive Management Plan
- Major infrastructure and development projects taking place or scheduled
- Uncontrolled urban development
- Housing and agricultural encroachment on the West Bank of the Nile
- (I).
- Current space technologies could be incorporated in traditional technologies for improving environmental analysis, following Lasaponara et al. [65,66,67,68,69] and the approaches proposed by UNESCO in the Man and Biosphere Program (MAB); that is based on the application of the concept of “biosphere reserves
- (II).
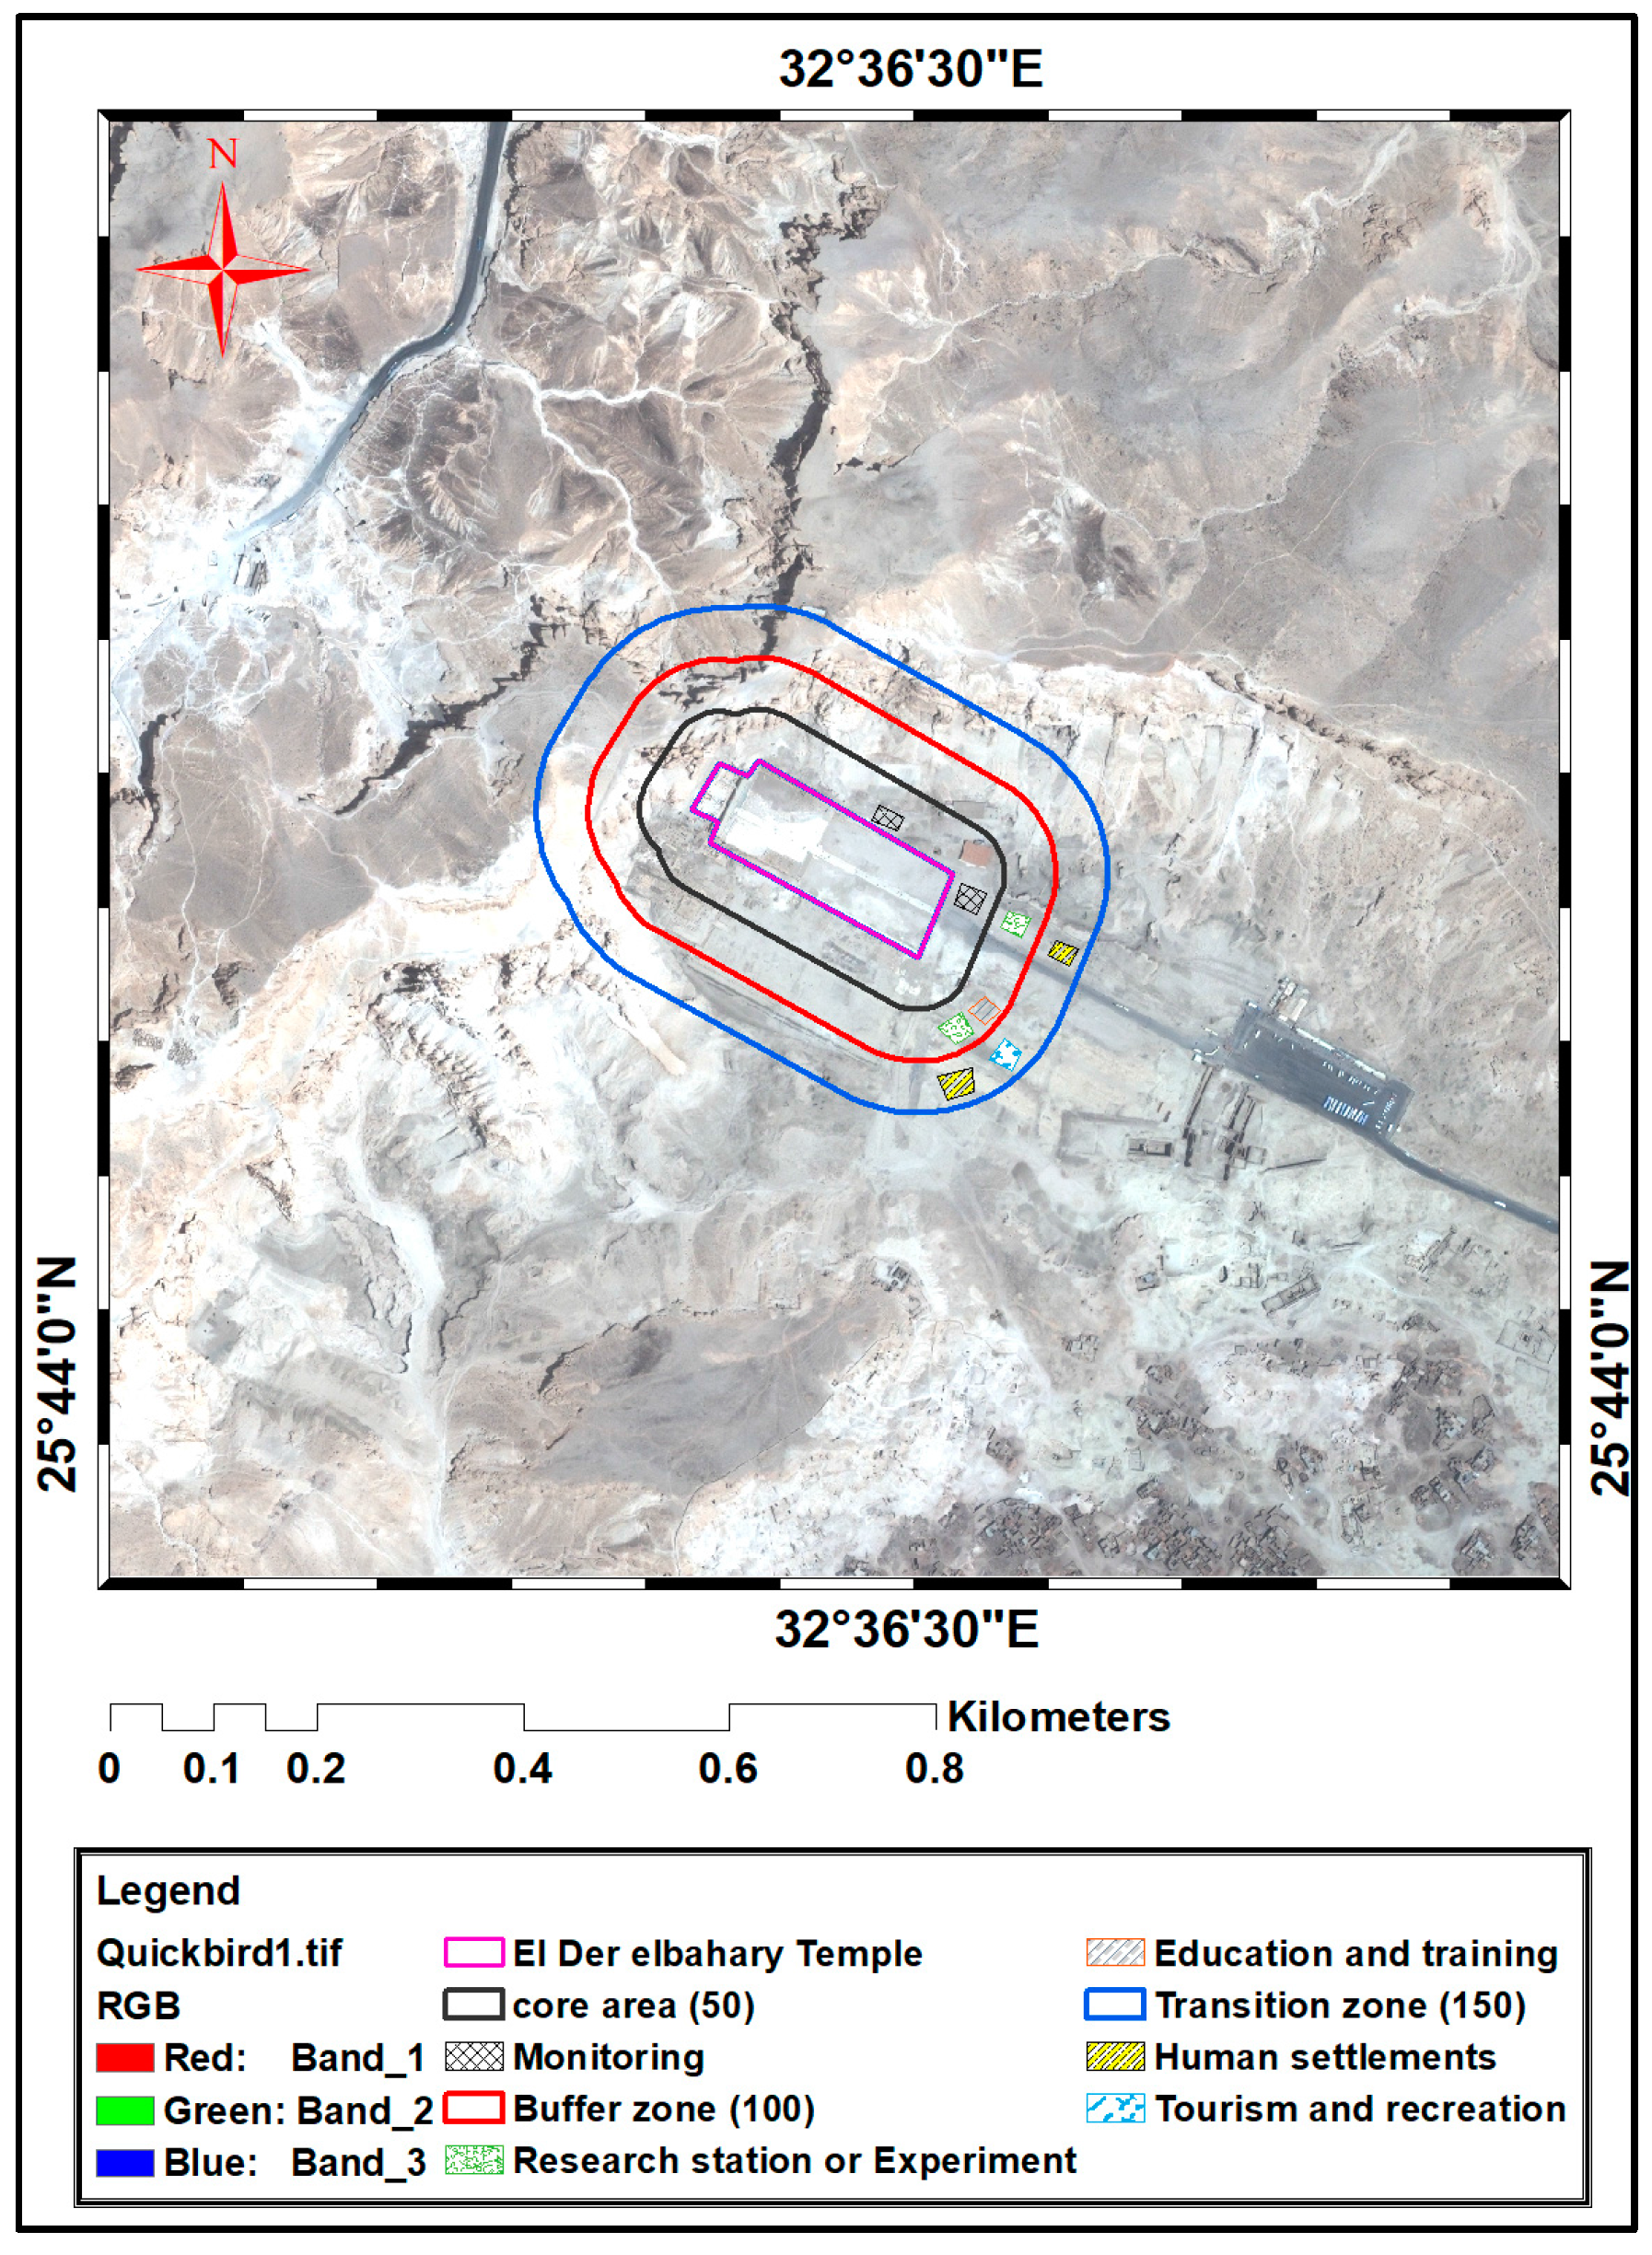
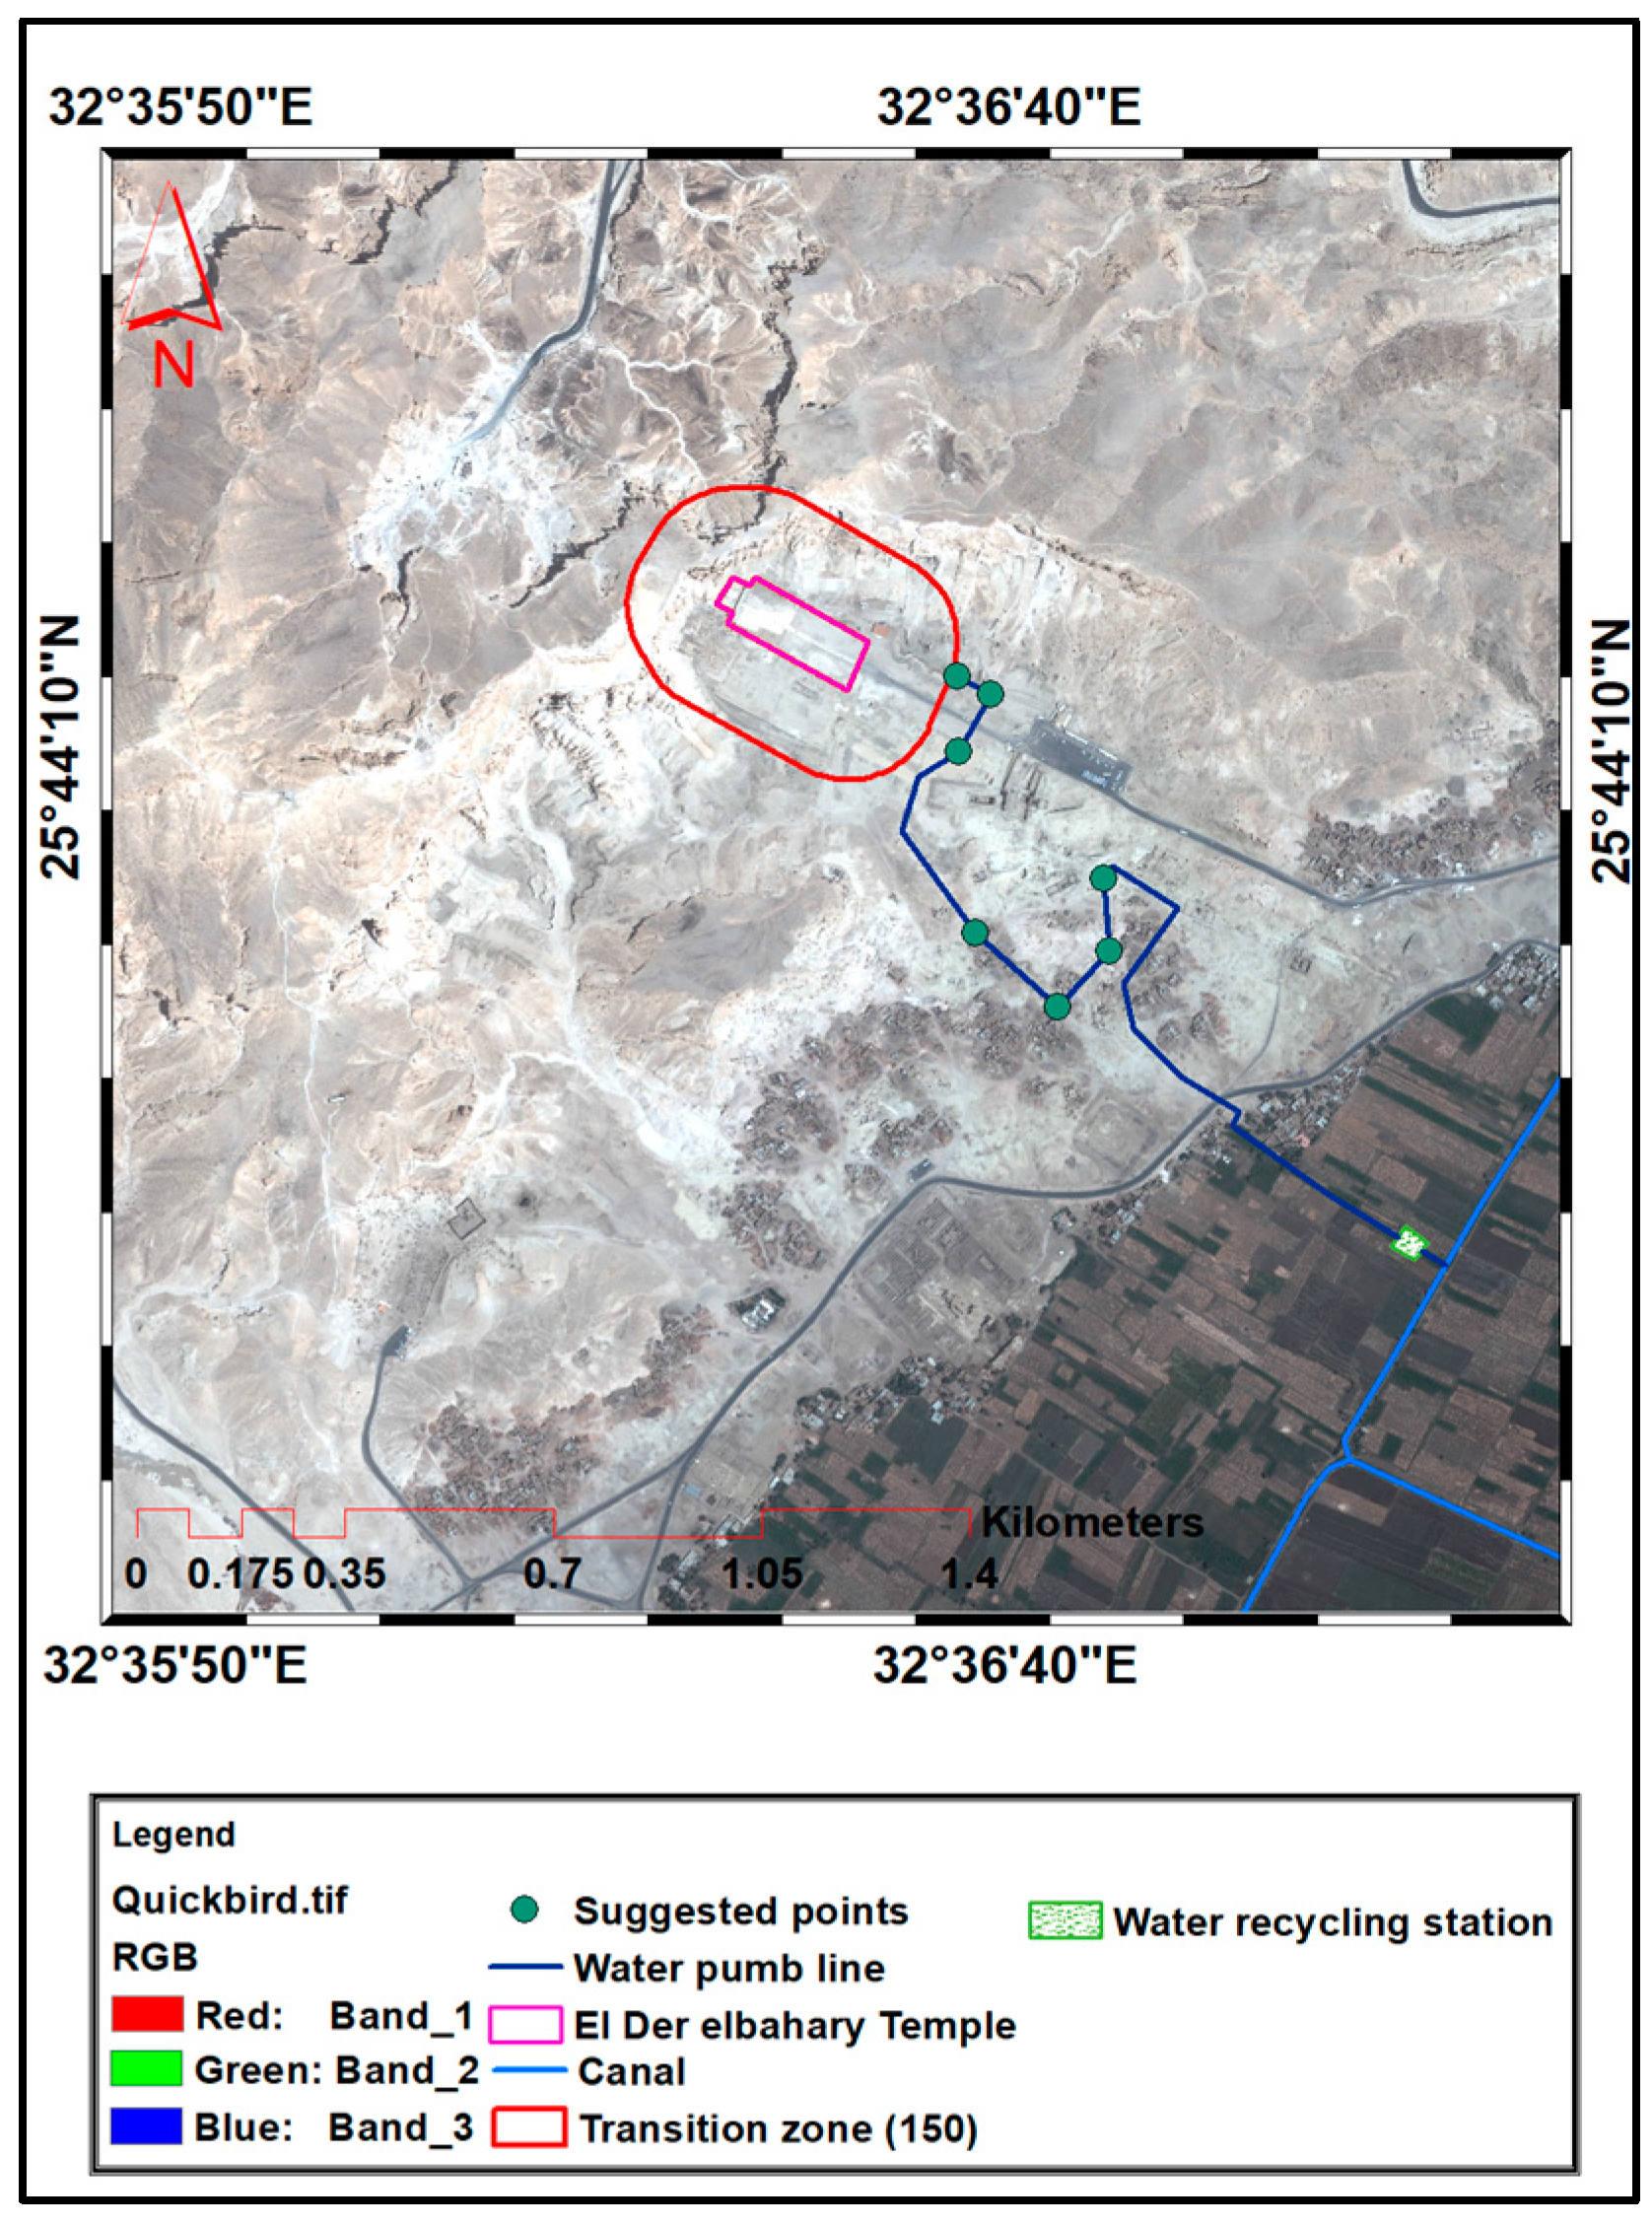
- In Luxor, the risk mitigation can be performed using a “Zonation System” that applies different management policies to different zones {50 m}. The archaeological area is to be surrounded by three areas, as suggested by UNESCO. The first area for monitoring; the second for the research, experiment, education, and training; and, the third area for tourism and recreation (Figure 16). The proposed zonation is based on the consideration that for the Hatshepsut temple the areas identified have to cope with the need to.
- (III).
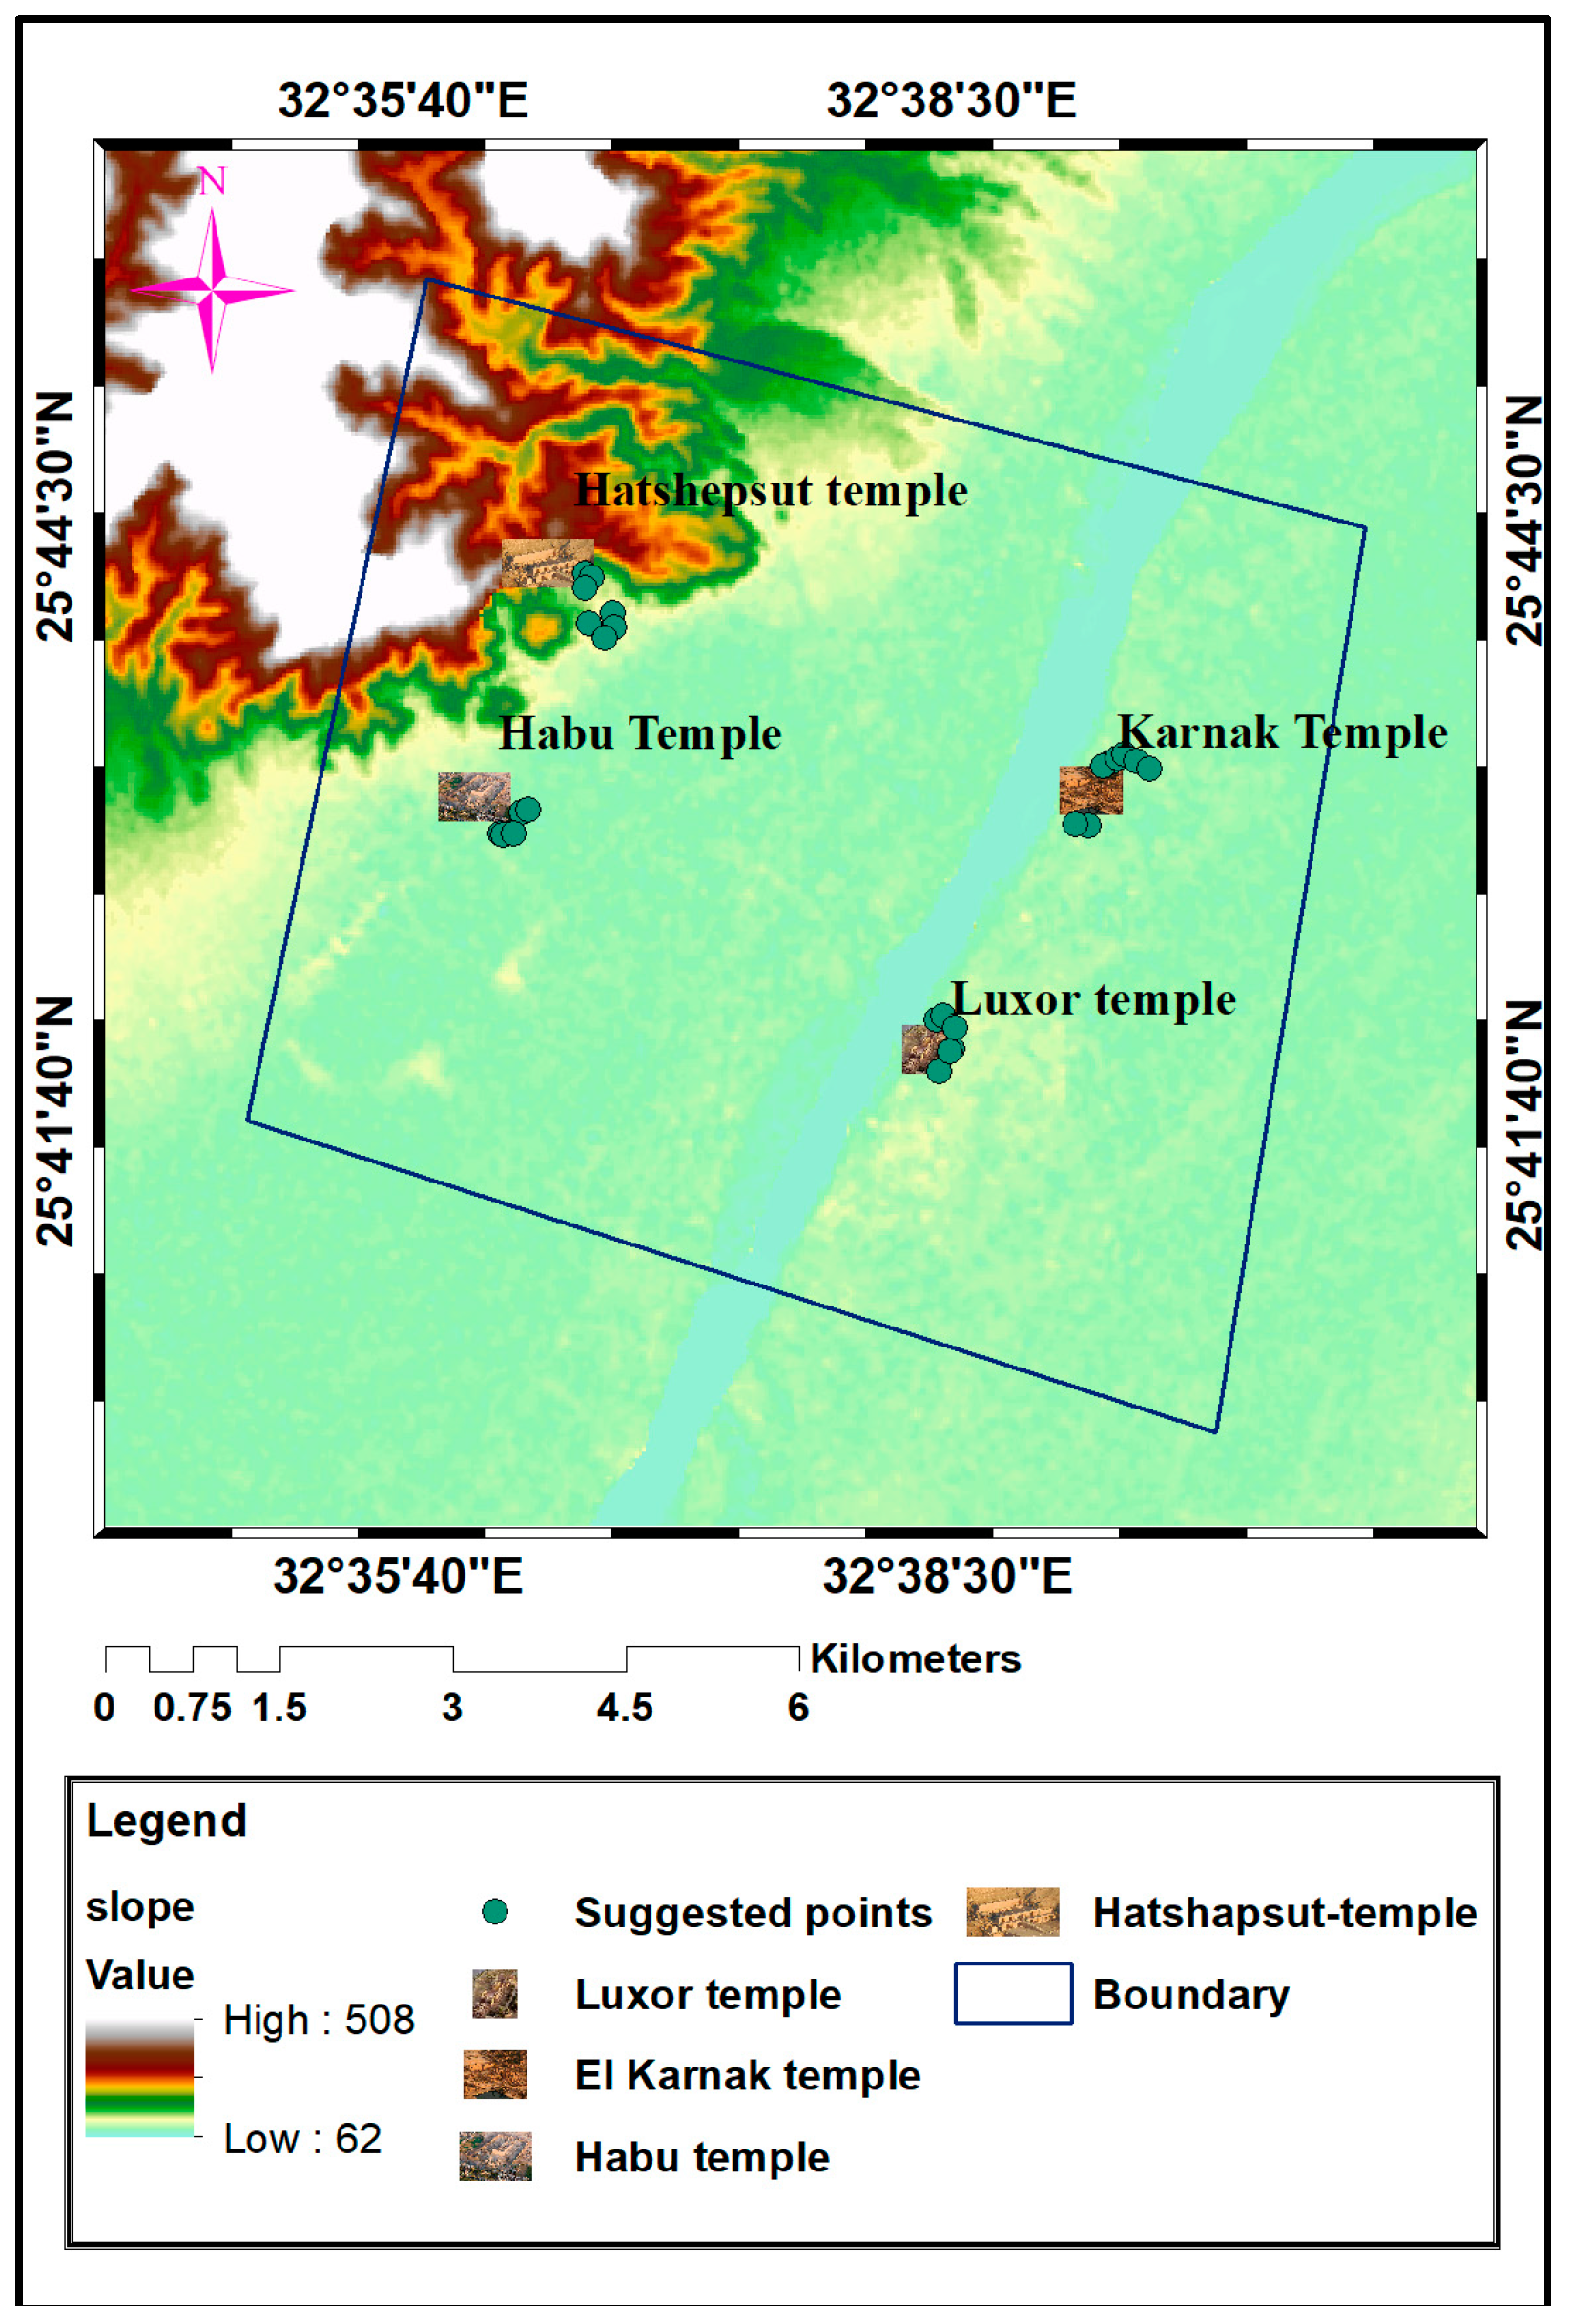
- As a result of the bad environmental status around the archaeological area of Luxor, it becomes very necessary to choose some suitable places to dig some trenches in order to collect the ground water, including the wastewater originated by the urban uncontrolled expansion (to cope with the needs highlighted in the UNESCO reports). Figure 17 shows the location of the trenches that are connected with pumps defined considering ancillary information and the slope of the area, also depicted in Figure 17. When considering the slope and topographical features of the area, these trenches, connected with pumps, should be located at a depth around 9 m. Moreover, these wastewaters will be transferred to a water recycling station, which finally will move them to the nearest canal, to purify water made them suitable for irrigation.
- (IV).
- In the next future, additional investigations based on GIS-modeling methodology will also be addressed to the identification the alternative sites for urban areas and agricultural activities to minimize their adverse impact on the cultural properties. Potential feasible sites will be identified on the basis of external impact factors such as Roads, DEM, archaeological area, Agriculture land, and Urban (see Figure 17 and Figure 18), management purposes, following the UNESCO recommendations.
5. Conclusions
Acknowledgments
Author Contributions
Conflicts of Interest
References
- Lasaponara, R.; Masini, N. Satellite remote sensing in archaeology: Past, present and future perspectives. J. Archaeol. Sci. 2011, 38, 1995–2002. [Google Scholar] [CrossRef]
- Lasaponara, R.; Masini, N. Satellite synthetic aperture radar in archaeology and cultural landscape: An overview. Archaeol. Prospect. 2013, 20, 71–78. [Google Scholar] [CrossRef]
- Chen, F.; Lasaponara, R.; Masini, N. An overview of satellite synthetic aperture radar remote sensing in archaeology: From site detection to monitoring. J. Cult. Herit. 2017, 23, 5–11. [Google Scholar] [CrossRef]
- Cigna, F.; Lasaponara, R.; Masini, N.; Milillo, P.; Tapete, D. Persistent scatterer interferometry processing of COSMO-SkyMed StripMap HIMAGE time series to depict deformation of the historic centre of Rome, Italy. Remote Sens. 2014, 6, 12593–12618. [Google Scholar] [CrossRef]
- Lasaponara, R.; Leucci, G.; Masini, N.; Persico, R.; Scardozzi, G. Towards an operative use of remote sensing for exploring the past using satellite data: The case study of Hierapolis (Turkey). Remote Sens. Environ. 2016, 174, 148–164. [Google Scholar] [CrossRef]
- Beck, A.; Philip, G.; Abdulkarim, M.; Donoghue, D. Evaluation of Corona and Ikonos high resolution satellite imagery for archaeological prospection in Western Syria. Antiquity 2007, 81, 161–175. [Google Scholar] [CrossRef]
- Wilkinson, K.; Philip, G.; Beck, A. Satellite imagery as a resource in the prospection for archaeological sites in central Syria. Geoarchaeology 2006, 21, 735–750. [Google Scholar] [CrossRef]
- Parcak, S. Satellite Remote Sensing Methods for Monitoring Archaeological Tells in the Middle East. J. Field Archaeol. 2007, 32, 65–81. [Google Scholar] [CrossRef]
- Etaya, M.; Sudo, N.; Sakata, T. Detection of subsurface ancient Egyptian remains utilizing optical and microwave satellite data. In Proceedings of the 2000 IEEE International Geoscience and Remote Sensing Symposium, Honolulu, HI, USA, 24–28 July 2000; Volume 6, pp. 2480–2482. [Google Scholar]
- Robinson, C.A. Potential and applications of radar images in Egypt. Egypt. J. Remote Sens. Space Sci. 1998, 1, 25–56. [Google Scholar]
- Parcak, S. Site survey in Egyptology. In Egyptology Today; Wilkinson, R.H., Ed.; Cambridge University Press: Cambridge, UK, 2008; pp. 57–76. [Google Scholar]
- Stewart, Ch.; Lasaponara, R.; Schiavon, G. ALOS PALSAR Analysis of the Archaeological Site of Pelusium. Archaeol. Prospect. 2013, 2, 109–116. [Google Scholar] [CrossRef]
- Unesco Report. Available online: http://whc.unesco.org/en/soc/3597 (accessed on 15 November 2017).
- Unesco Report. Available online: http://whc.unesco.org/en/soc/751 (accessed on 15 November 2017).
- Masini, N.; Capozzoli, L.; Chen, P.; Chen, F.; Romano, G.; Lu, P.; Tang, P.; Sileo, M.; Ge, Q.; Lasaponara, R. Towards an operational use of geophysics for archaeology in Henan (China): Methodological approach and results in Kaifeng. Remote Sens. 2017, 9, 809. [Google Scholar] [CrossRef]
- Themistocleous, K.; Ioannides, M.; Agapiou, A.; Hadjimitsis, D.G. The methodology of documenting cultural heritage sites using photogrammetry, UAV, and 3D printing techniques: The case study of Asinou Church in Cyprus. Proc. SPIE 2015, 953510. [Google Scholar] [CrossRef]
- Tapete, D.; Cigna, F.; Donoghue, D.N.M. Looting marks in space-borne SAR imagery: Measuring rates of archaeological looting in Apamea (Syria) with TerraSAR-X Staring Spotlight. Remote Sens. Environ. 2016, 178, 42–58. [Google Scholar] [CrossRef]
- Tapete, D.; Cigna, F. InSAR data for geohazard assessment in UNESCO World Heritage sites: State-of-the-art and perspectives in the Copernicus era. Int. J. Appl. Earth Obs. Geoinf. 2017, 63, 24–32. [Google Scholar] [CrossRef]
- Agapiou, A.; Lysandrou, V.; Hadjimitsis, D. Optical Remote Sensing Potentials for Looting Detection. Geosciences 2017, 7, 98. [Google Scholar] [CrossRef]
- Convention Concerning the Protection of the World Cultural and Natural Heritage. Available online: http://whc.unesco.org/en/conventiontext/ (accessed on 15 November 2017).
- List of World Heritage in Danger. Available online: http://whc.unesco.org/en/danger/ (accessed on 15 November 2017).
- Weeks, K.R.; Hetherington, N.J. The Valley of the Kings, Luxor, Egypt: Site Management Master Plan; Theban Mapping Project: Cairo, Egypt, 2006; p. 27. [Google Scholar]
- Lloyd, A.B. A Companion to Ancient Egypt; John Wiley & Sons: Hoboken, NJ, USA, 2010; Volume 1, p. 442. [Google Scholar]
- Wilkinson, R.H. The Complete Temples of Ancient Egypt, 1st ed.; Thames & Hudson: London, UK, 2000; p. 47. [Google Scholar]
- Murray, M.A. Egyptian Temples; Sampson Low Marston & Company: London, UK, 2005; pp. 65–105. [Google Scholar]
- Bell, C. A Timeless Culture: Egyptian Architecture & Decorative Arts. Available online: http://bellcr.com/wp-content/uploads/2006/01/Egyptian-Architecture.pdf (accessed on 21 November 2017).
- Cust, L.H. Luxor and Its Temples; Billing and Sons, Ltd.: Guildford, UK; Eshek, UK, 1923; pp. 58–59. [Google Scholar]
- Harbison, R. Travels in the History of Architecture; MPG Books Ltd.: Bodmin, Cornwall, UK, 2009; pp. 26–27. [Google Scholar]
- Bell, L. Luxor Temple and the Cult of the Royal Ka. J. Near East. Stud. 1985, 44, 251–294. [Google Scholar] [CrossRef]
- Nelson, H.H.; Holscher, U. Buried History, Publications of the Oriental Institute of the University of Chicago. Available online: https://oi.uchicago.edu/sites/oi.uchicago.edu/files/uploads/shared/docs/ar/28-59/1934_BuriedHistory.pdf (accessed on 22 November 2017).
- Nelson, H.H. The Egyptian Temple: The Theban temples of the empire period. (Boston, United States). In The Biblical Archaeologist; American Schools of Oriental Research: Boston, MA, USA, 1944; Volume 7, pp. 44–53. [Google Scholar]
- Lesko, B.S. Royal Mortuary Suites of the Egyptian New Kingdom. Am. J. Archaeol. 1969, 73, 453–458. [Google Scholar] [CrossRef]
- Holden, L. The virtual Egyptian temple. In EdMedia: World Conference on Educational Media and Technology; Association for the Advancement of Computing in Education (AACE): Waynesville, NC, USA, 2006; pp. 3–4. [Google Scholar]
- Szafrański, Z.E. Temple of Hatshepsut at Deir El-Bahari, SEASON 2006/2007. Pol. Archaeol. Mediterr. 2007, 19, 250–268. [Google Scholar]
- Cuezva, S.; Garcia-Guinea, J.; Fernandez-Cortes, A.; Benavente, D.; Ivars, J.; Galan, J.M.; Sanchez, M. Composition, uses, provenance and stability of rocks and ancient mortars in a Theban Tomb in Luxor (Egypt). Mater. Struct. 2016, 49, 941–960. [Google Scholar] [CrossRef]
- Luxor Current Weather Report. Available online: https://www.worldweatheronline.com/luxor-weather/qina/eg.aspx (accessed on 15 November 2017).
- Campos, E. A groundwater flow model for water related damages on historic monuments-Case study West Luxor Egypt. Vatten 2009, 65, 247–254. [Google Scholar]
- Fitzner, B.; Heinrichs, K.; La Bouchardiere, D. Weathering damage on Pharaonic sandstone monuments in Luxor-Egypt. Build. Environ. 2003, 38, 1089–1103. [Google Scholar] [CrossRef]
- Selim, S.A.; Khedr, E.S.; Falasteen, A.W.; Kamel, E.R. Reasons of local rise in groundwater level at Luxor city area, upper Physical Setting Climate Geomorphology. In Proceedings of the 5th International Conference on the Geology of the Arab World, Giza, Egypt, 21–24 February 2000; pp. 901–910. [Google Scholar]
- Mclane, J.; Wust, R. Flood Hazards and Protection Measures in the Valley of the Kings. Cult. Resour. Manag. 2000, 23, 35–38. [Google Scholar]
- Ahmed, A.A.; Fogg, G.E. The impact of groundwater and agricultural expansion on the archaeological sites at Luxor, Egypt. J. Afr. Earth Sci. 2014, 95, 93–104. [Google Scholar] [CrossRef]
- Roehrig, C.H.; Dreyfus, R.; Keller, C.A. Hatshepsut from Queen to Pharaoh; The Metropolitan Museum of Art: New York, NY, USA, 2006; pp. 181–182. [Google Scholar]
- Moreira, E.P.; Valeriano, M.d.M.; Sanches, I.D.A.; Formaggio, A.R. Topographic Effect on Spectral Vegetation Indices From Landsat Tm Data: Is Topographic Correction Necessary? Bol. Ciências Geodésicas 2016, 22, 95–107. [Google Scholar] [CrossRef]
- Gitelson, A.A.; Kaufman, Y.J.; Stark, R.; Rundquist, D. Novel algorithms for remote estimation of vegetation fraction. Remote Sens. Environ. 2002, 80, 76–87. [Google Scholar] [CrossRef]
- Chandra, P. Performance evaluation of vegetation indices using remotely sensed data. Int. J. Geomat. Geosci. 2011, 2, 231–240. [Google Scholar]
- Fu, A. Urban Growth and LULC Change Dynamics Using Landsat. Available online: https://uwspace.uwaterloo.ca/bitstream/handle/10012/8271/Fu_Anqi.pdf;sequence=3 (accessed on 22 November 2017).
- Li, S.; Chen, X. A new bare-soil index for rapid mapping developing areas using landsat 8 data. Int. Arch. Photogramm. Remote Sens. Spatial Inf. Sci. 2014, 40, 139–144. [Google Scholar] [CrossRef]
- Waqar, M.M.; Mirza, J.F.; Mumtaz, R.; Hussain, E. Development of New Indices for Extraction of Built-Up Area & Bare Soil. Open Access Sci. Rep. 2012, 1, 1–4. [Google Scholar]
- Hashemimanesh, M.M.; Matinfar, H.R.; Alavipanah, S.K.; Zehtabian, G. Landsat thermal band efficiency on characterizing mulched soil surface. Int. Agrophys. J. 2012, 26, 249–257. [Google Scholar] [CrossRef]
- Konda, A.; Hongo, D.; Ichikawa, H.; Koji Kajiwara, H.Y.; Honda, Y. The Study on Vegetation Structure Index using BRF Property with Satellite Sensors. Image 2002, 12, 8–11. [Google Scholar]
- Senseman, G.M.; Bagley, C.F.; Tweddale, S.A. Accuracy Assessment of the Discrete Classification of Remotely-Sensed Digital Data for Land cover Mapping. Available online: http://www.dtic.mil/docs/citations/ADA296212 (accessed on 21 November 2017).
- Ahmed, A.A.; Fogg, G.E.; Gameh, M.A. Water use at Luxor, Egypt: Consumption analysis and future demand forecasting. Environ. Earth Sci. 2014, 72, 1041–1053. [Google Scholar] [CrossRef]
- US Agency for International Development (USAID). Scoping Statement For CITY OF LUXOR Groundwater Lowering of Antiquities Sites on the West Bank; National Organization for Potable Water and Sanitary Drainage (NOPWASD): Cairo, Egypt, 2007; pp. 1–64.
- AbouelFadl, S.; El-lithy, K. Impact Assessment of Global Warming on Egypt. 2014, pp. 352–360. Available online: https://www.academia.edu/10487070/Impact_Assessment_of_Global_warming_on_Egypt (accessed on 15 November 2017).
- Tully, G.; Hanna, M. One Landscape, Many Tenants: Uncovering Multiple Claims, Visions and Meanings on the Theban Necropolis. Archaeologies 2013, 9, 362–397. [Google Scholar] [CrossRef]
- Graham, A.; Kristian, S.; Morag, D.H.; Sarah, J.; Aurélia, M.; Marie, M.; Benjamin, P. Reconstructing Landscapes and Waterscapes in Thebes, Egypt. eTopoi J. Anc. Stud. 2012, 3, 135–142. [Google Scholar]
- Graham, A.; Strutt, K.D.; Hunter, M.A.; Pennington, B.T.; Toonen, W.H.J.; Barker, D.S. Theban Harbours and waterscapes survey. J. Egypt. Archaeol. 2014, 100, 35–47. [Google Scholar]
- El-Asmar, H.M.; Ahmed, M.H.; Taha, M.M.N.; Assal, E.M. Human Impacts on Geological and Cultural Heritage in the Coastal Zone West of Alexandria to Al-Alamein, Egypt. Geoheritage 2012, 4, 263–274. [Google Scholar] [CrossRef]
- Elwaseif, M.; Ismail, A.; Abdalla, M.; Abdel-Rahman, M.; Hafez, M.A. Geophysical and hydrological investigations at the west bank of Nile River (Luxor, Egypt). Environ. Earth Sci. 2012, 67, 911–921. [Google Scholar] [CrossRef]
- Kobashi, T. Greenland Temperature, Climate Change, and Human Society during the Last 11,600 years. Ph.D. Thesis, University of California, San Diego, CA, USA, 2007. [Google Scholar]
- Agrawala, S.; Moehner, A.; El Raey, M.; Conway, D.; Aalst, M.V.; Hagenstad, M.; Smith, J. Development and Climate Change in Egypt: Focus on Coastal Resources and the Nile; Organisation for Economic Co-operation and Development: Paris, France, 2004; pp. 1–68. [Google Scholar]
- Hassan, K.E. Impacts of Future Climate Change on Egyptian Population, International Union for the Scientific Study of Population (IUSSP). In Proceedings of the XXVII IUSSP International Population Conference, Busan, Korea, 31 August 2013; pp. 1–15. [Google Scholar]
- Clarke, J.; Brooks, N.; Banning, E.B.; Bar-Matthews, M.; Campbell, S.; Clare, L.; Cremaschi, M.; di Lernia, S.; Drake, N.; Gallinaro, M.; et al. Climatic changes and social transformations in the Near East and North Africa during the ‘long’ 4th millennium BC: A comparative study of environmental and archaeological evidence. Quat. Sci. Rev. 2015, 136, 96–121. [Google Scholar] [CrossRef]
- Stubbs, J.H.; McKee, K.L.R. Applications of Remote Sensing to the Understanding and Management of Cultural Heritage Sites. In Remote Sensing in Archaeology; Interdisciplinary Contributions to Archaeology; Springer: New York, NY, USA, 2007; pp. 515–540. [Google Scholar]
- Lasaponara, R.; Elfadaly, A.; Attia, W. Using remote sensing and GIS techniques for monitoring the environmental status the problems and the solutions around Esna temple at luxor, Egypt. In Proceedings of the International Conference of Advanced in Remote Sensing for Cultural Heritage, Frascati, Italy, 12–13 November 2015. [Google Scholar]
- Lasaponara, R.; Elfadaly, A.; Attia, W. Low Cost Space Technologies for Operational Change Detection Monitoring Around the Archaeological Area of Esna-Egypt. In Proceedings of the International Conference on Computational Science and Its Applications, Beijing, China, 4–7 July 2016; Springer: Beijing, China, 2016; pp. 611–621. [Google Scholar]
- Lasaponara, R.; Murgante, B.; Elfadaly, A.; Qelichi, M.M.; Shahraki, S.Z.; Wafa, O.; Attia, W. Spatial Open Data for Monitoring Risks and Preserving Archaeological Areas and Landscape: Case Studies at Kom el Shoqafa, Egypt and Shush, Iran. Sustainability 2017, 9, 572. [Google Scholar] [CrossRef]
- Elfadaly, A.; Attia, W.; Lasaponara, R. Monitoring the Environmental Risks Around Medinet Habu and Ramesseum Temple at West Luxor, Egypt, Using Remote Sensing and GIS Techniques. J. Archaeol. Method Theory 2017, 24, 1–24. [Google Scholar] [CrossRef]
- Elfadaly, A.; Lasaponara, R.; Murgante, B.; Qelichi, M.M. Cultural Heritage Management Using Analysis of Satellite Images and Advanced GIS Techniques at East Luxor, Egypt and Kangavar, Iran (A Comparison Case Study). In Proceedings of the 17th International Conference Computational Science and Its Applications, Trieste, Italy, 3–6 July 2017; pp. 152–168. [Google Scholar]


| Number | Satellite | Sensor | Resolution (m) | Acquisition Date | Source |
|---|---|---|---|---|---|
| 1 | Corona | KH-4A | 1.8 m | August 1964 | USGS |
| 2 | Landsat | TM | 30 m | October 1984 | GLCF |
| 3 | Quickbird 2 | XS/P | 0.6 m | November 2005 | NARSS |
| 4 | Sentinel | 2A | 10 m | November 2016 | USGS |
| Year | Luxor Area | |
|---|---|---|
| Kappa Coefficient | Overall Accuracy | |
| 1984 | 78.5714% | 0.7306 |
| 2005 | 72.7135% | 0.6501 |
| 2016 | 97.9401% | 0.9450 |
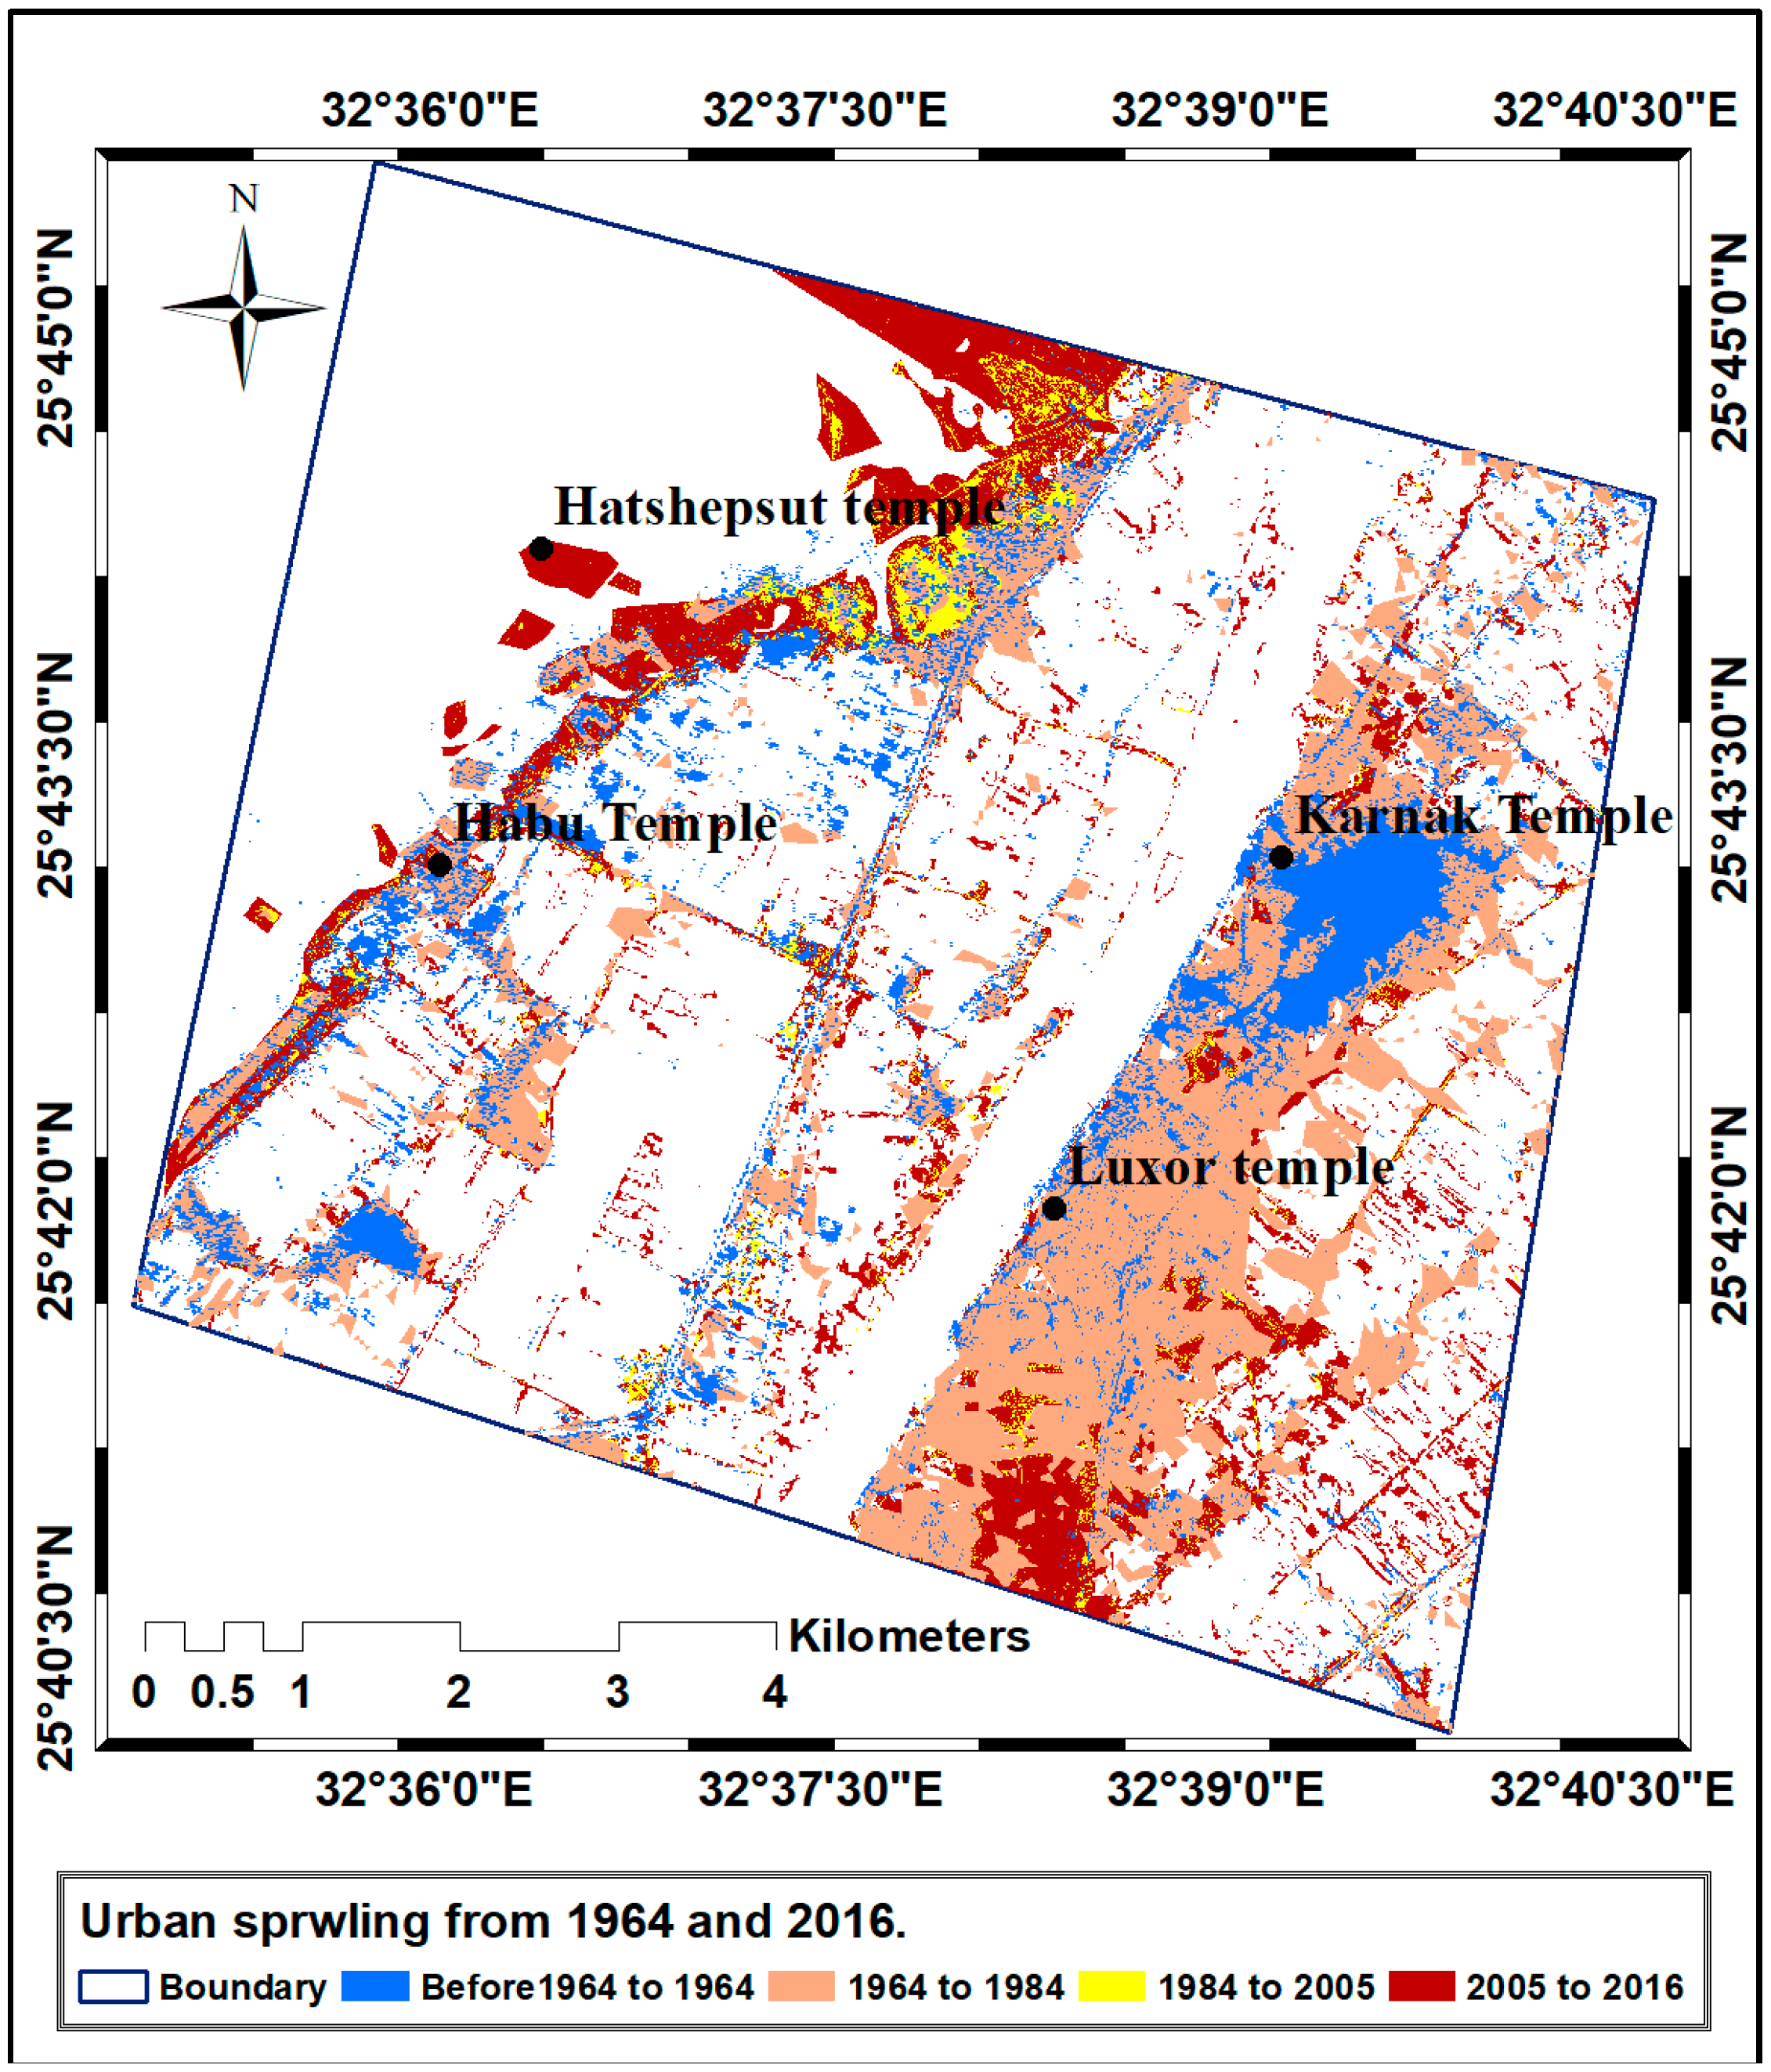
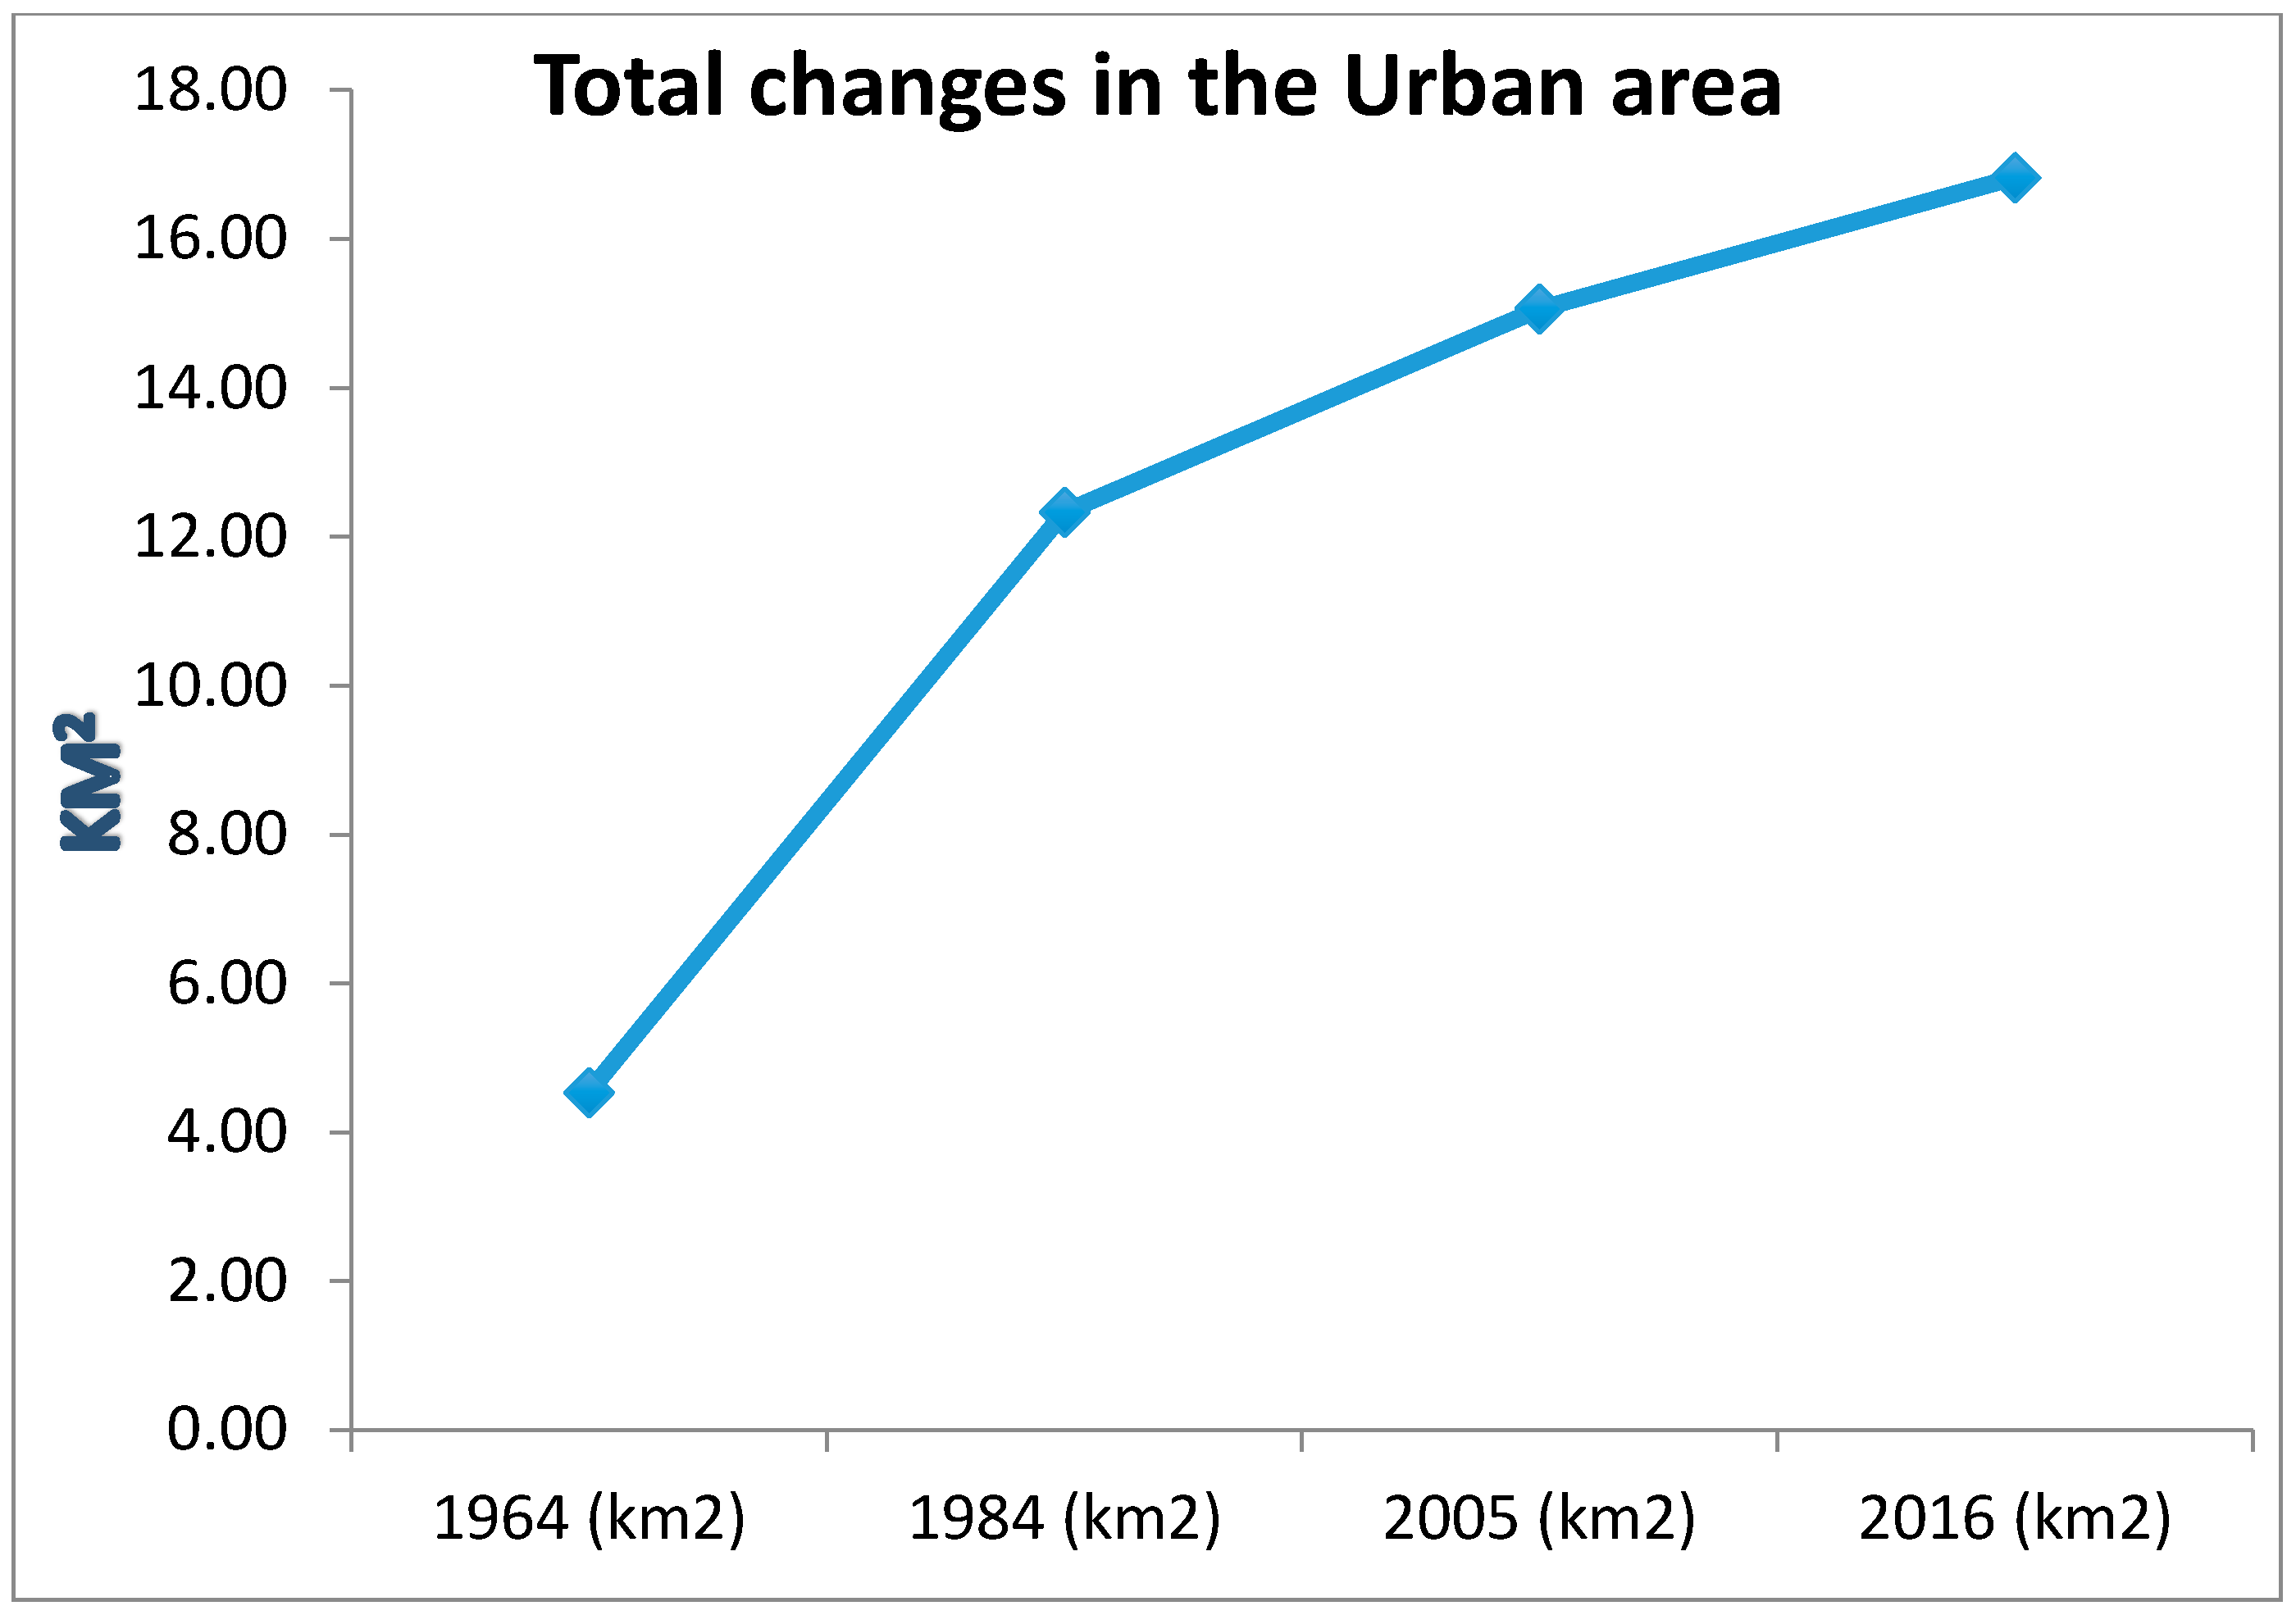
| Class | Study Area | 1964 (km2) | Change Detection ± km2 | 1984 (km2) | Change Detection ± km2 | 2005 (km2) | Change Detection ± km2 | 2016 (km2) |
|---|---|---|---|---|---|---|---|---|
| Urban | Luxor | 4.539 | 7.792 | 12.331 | 2.734 | 15.065 | 1.763 | 16.828 |
© 2017 by the authors. Licensee MDPI, Basel, Switzerland. This article is an open access article distributed under the terms and conditions of the Creative Commons Attribution (CC BY) license (http://creativecommons.org/licenses/by/4.0/).
Share and Cite
Elfadaly, A.; Wafa, O.; Abouarab, M.A.R.; Guida, A.; Spanu, P.G.; Lasaponara, R. Geo-Environmental Estimation of Land Use Changes and Its Effects on Egyptian Temples at Luxor City. ISPRS Int. J. Geo-Inf. 2017, 6, 378. https://doi.org/10.3390/ijgi6110378
Elfadaly A, Wafa O, Abouarab MAR, Guida A, Spanu PG, Lasaponara R. Geo-Environmental Estimation of Land Use Changes and Its Effects on Egyptian Temples at Luxor City. ISPRS International Journal of Geo-Information. 2017; 6(11):378. https://doi.org/10.3390/ijgi6110378
Chicago/Turabian StyleElfadaly, Abdelaziz, Osama Wafa, Mohamed A. R. Abouarab, Antonella Guida, Pier Giorgio Spanu, and Rosa Lasaponara. 2017. "Geo-Environmental Estimation of Land Use Changes and Its Effects on Egyptian Temples at Luxor City" ISPRS International Journal of Geo-Information 6, no. 11: 378. https://doi.org/10.3390/ijgi6110378
APA StyleElfadaly, A., Wafa, O., Abouarab, M. A. R., Guida, A., Spanu, P. G., & Lasaponara, R. (2017). Geo-Environmental Estimation of Land Use Changes and Its Effects on Egyptian Temples at Luxor City. ISPRS International Journal of Geo-Information, 6(11), 378. https://doi.org/10.3390/ijgi6110378