Article

A Sparse Voxel Octree-Based Framework for Computing Solar Radiation Using 3D City Models

1
State Key Laboratory of Remote Sensing Science, Institute of Remote Sensing and Digital Earth, Chinese Academy of Sciences, Beijing 100101, China
2
School of Life Sciences, Arizona State University, Tempe 85287, AZ, USA
3
Zhejiang-CAS Application Center for Geoinformatics, Jiashan 314100, China
*
Authors to whom correspondence should be addressed.
ISPRS Int. J. Geo-Inf. 2017, 6(4), 106; https://doi.org/10.3390/ijgi6040106
Submission received: 19 February 2017 / Revised: 17 March 2017 / Accepted: 29 March 2017 / Published: 31 March 2017

Abstract

:
An effective three-dimensional (3D) data representation is required to assess the spatial distribution of the photovoltaic potential over urban building roofs and facades using 3D city models. Voxels have long been used as a spatial data representation, but practical applications of the voxel representation have been limited compared with rasters in traditional two-dimensional (2D) geographic information systems (GIS). We propose to use sparse voxel octree (SVO) as a data representation to extend the GRASS GIS r.sun solar radiation model from 2D to 3D. The GRASS GIS r.sun model is nested in an SVO-based computing framework. The presented 3D solar radiation computing framework was applied to 3D building groups of different geometric complexities to demonstrate its efficiency and scalability. We presented a method to explicitly compute diffuse shading losses in r.sun, and found that diffuse shading losses can reduce up to 10% of the annual global radiation under clear sky conditions. Hence, diffuse shading losses are of significant importance especially in complex urban environments.

1. Introduction

As photovoltaic solar energy is becoming an increasingly important source of renewable energy for sustainable urban development [1,2], new methods and tools are required to assess photovoltaic potential in complex urban environments. The Solar Analyst (SA) module of ESRI ArcGIS [3] and the r.sun module of GRASS GIS [4] are two of the most widely used insolation modeling tools with proven capability to accurately capture both temporal and spatial variability [5,6]. Traditional GIS-based solar radiation models provide rapid insolation estimations over large geographic areas with fairly high accuracy using a digital elevation model (DEM) [4]. A high-resolution digital surface model (DSM) reconstructed from Airborne Altimetric LiDAR can also be fit directly into existing 2D models to assess urban insolation over the ground and building roofs. The use of a LiDAR-based DSM to study solar potential on building surfaces has attracted widespread attention from the GIS community. Agugiaro et al. [7] employed r.sun to estimate solar radiation on building roofs in mountainous areas through a combination of a high-resolution DSM and a vector cadastral map that describes building footprints. Brito et al. [8] performed a simple first-approximation estimation of the photovoltaic potential of a Lisbon urban area using SA on a one-meter DSM. Lukač and Žalik [9] leveraged state-of-the-art graphics processing unit (GPU)-based techniques to accelerate the computation of the solar potential of roofs using LiDAR data. However, such applications do not take into account building facades because the facade pixels correspond to vertical discontinuities in the DSM [10].
Carneiro [11] used a combination of a DSM and vectorial building footprints to obtain the solar energy distribution on vertical surfaces. Redweik et al. [10] proposed to calculate the solar irradiation at every point on roofs, the ground and facades. Overall, these methods [10,11] were simply dedicated to 2.5D models without accommodating full 3D urban buildings; they also required separate consideration of terrain, roofs and facades. Therefore, further research is warranted to develop a general-purpose 3D method that builds upon a unified data representation of all types of surfaces within an urban landscape.

2. Related Work

Erdélyi et al. [12] combined an accurate ray-tracing algorithm with the adjusted Perez et al. [13] model to calculate the direct radiation and the aggregated diffuse radiation over a large number (typically thousands) of uniformly-spaced sky sections. The three-dimensional solar radiation model [12] has been validated and shown to generally outperform the Perez et al. [13] model.
Tooke et al. [14] proposed a point obstruction stacking (POSt) approach to model the solar irradiation on building walls. With POSt, the computational cost of ray-casting depends on the spacing of sample points on the building walls, indicating a conflict between computational efficiency and accuracy.
The surface mapping-based 3D solar radiation modeling method (SURFSUN3D) of Liang et al. [15] transforms a 3D surface into 2D raster maps to facilitate the incorporation of the r.sun model. The irradiation results of SURFSUN3D are present in the form of 2D floating-point raster surfaces that can be shaded into RGB-colored textures for GPU-based texture mapping. SURFSUN3D implements a GPU-accelerated ray-casting method that is further improved by visibility culling techniques. Although this ray-casting method scales well to large 3D cities consisting of thousands of polygon-extruded simple buildings, tracing a ray through a scene of more complex 3D models is very likely to be much less efficient.
Hofierka and Zlocha [16] developed a combined vector–voxel 3D solar radiation model (v.sun) in the framework of GRASS GIS as an extension to the 2D r.sun [4]. v.sun benefits from a shadow-casting algorithm that is not very sensitive to geometry complexity because of the use of a regularly-partitioned voxel structure. However, an urban landscape is not a continuous volume but consists of many discrete surfaces; thus, it is necessary to search for a more compact voxel representation. Moreover, new computer graphics techniques need to be incorporated to accelerate shadow-casting and to interactively visualize large-scale voxel datasets.
In a 3D solar radiation model, calculation of the shading effect is usually the most time-consuming process. The r.sun-based 3D models of Hofierka and Zlocha [16] and Liang et al. [15] did not explicitly account for the sky obstruction-caused diffuse shading losses, which may significantly reduce the diffuse component in 3D urban environments. Hence, we attempt to derive an explicit solution for the sky viewshed computation using 3D models. Ray-tracing is known to be highly sensitive to geometric complexity, and a large number of finely detailed 3D buildings and tree models can be time consuming. At the municipal scale, computation efficiency may become an issue for solar radiation analysis over building roofs and facades in a complex 3D scene. Therefore, an efficient ray-tracing scheme that scales well with geometric complexity warrants further investigation.
The efficient sparse voxel octrees (ESVO) of [17], which has proved to be insensitive to geometric complexity. Unlike the conventional triangle-texture representation for 3D models, the ESVO stores geometric information in the form of voxels within the hierarchical nodes of an octree to accelerate ray-casting on the GPU. A sparse voxel octree (SVO) can also effectively reduce the data volume to a small fraction of that of a regular voxel structure [18]. Additionally, the ESVO employs a NVDIA Compute Unified Device Architecture (CUDA)-based ray caster to facilitate interactive visualization, eliminating the need to resort to the conventional triangle-based rendering pipeline.
Our primary objective is to develop an SVO-based computing framework to efficiently handle highly detailed building models with an aim to achieve geometric complexity-scalable solar radiation computations.

3. Methods

To compute solar radiation directly on building roofs and facades using detailed 3D city models, we propose a new framework (SVOSUN3D) to extend GRASS r.sun from 2D to 3D. The sky obstruction-caused diffuse losses may significantly reduce the diffuse component in 3D urban environments. In GRASS GIS r.sun, the sky view factor (SVF) is approximated simply as a function of the slope angle, which could differ significantly from the theoretical value in complex urban environments. Calculation of the shading effect and SVF on 3D city models is computationally intensive. SVOSUN3D aims not only to accelerate 3D solar radiation computation, but also to explicitly account for the diffuse shading losses in complex urban environments. ESVO has been demonstrated to scale well with geometric complexity. Hence, SVOSUN3D uses an ESVO to discretize an urban scene of arbitrary 3D building models into a highly compact hierarchy of voxels and encapsulate the GRASS GIS r.sun to calculate the direct and diffuse solar irradiation on a voxel-by-voxel basis.

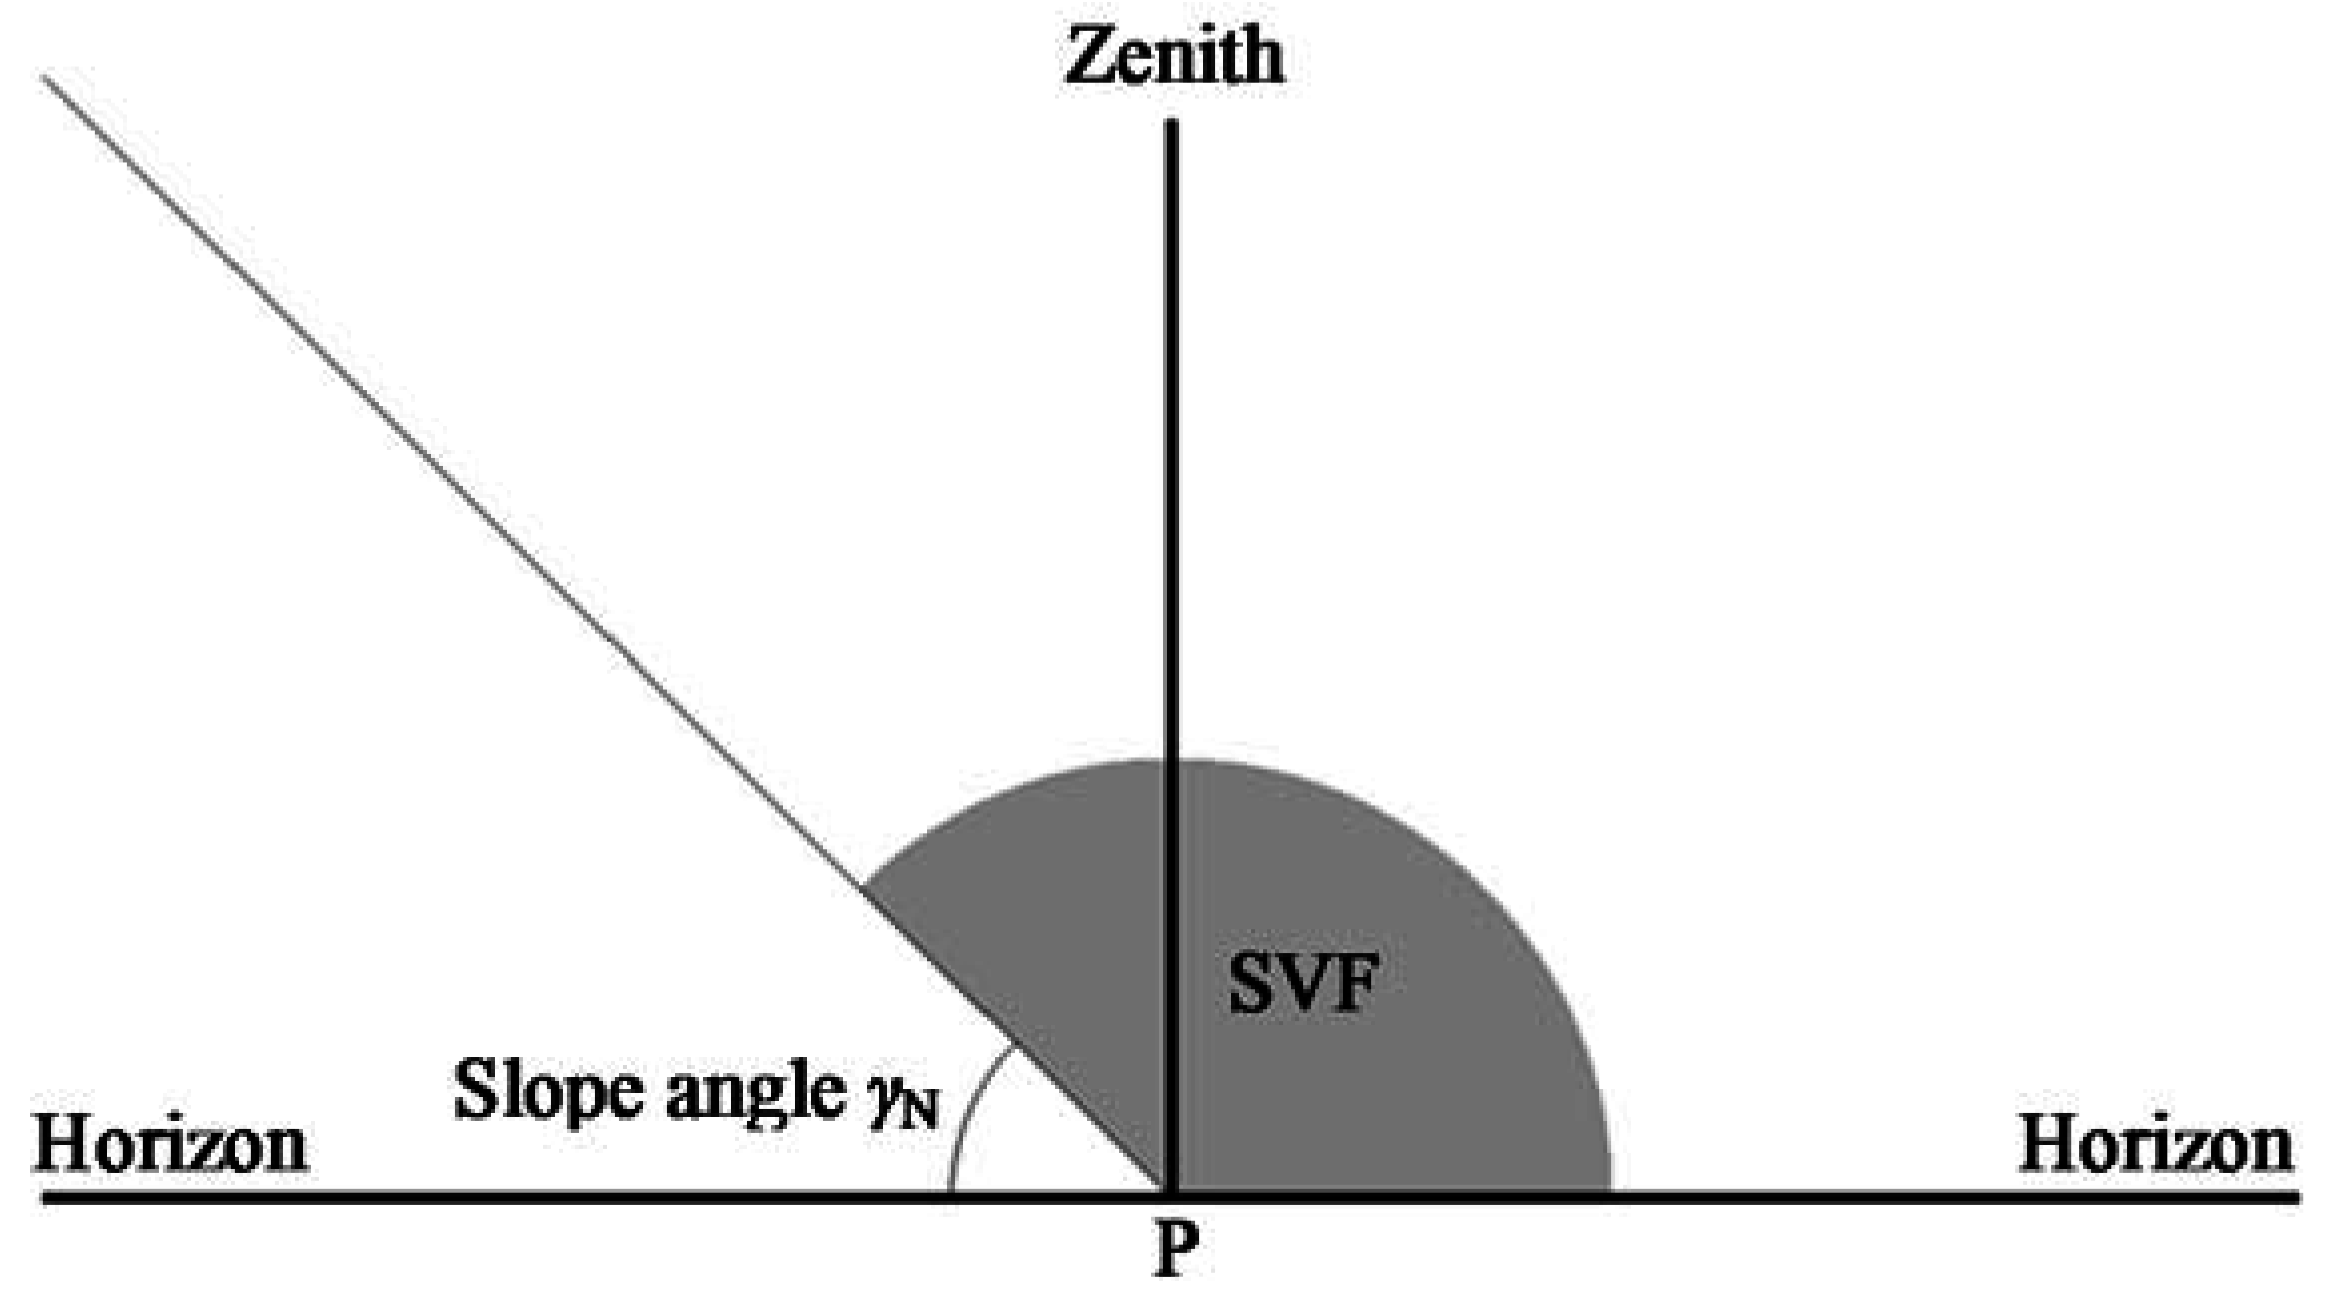
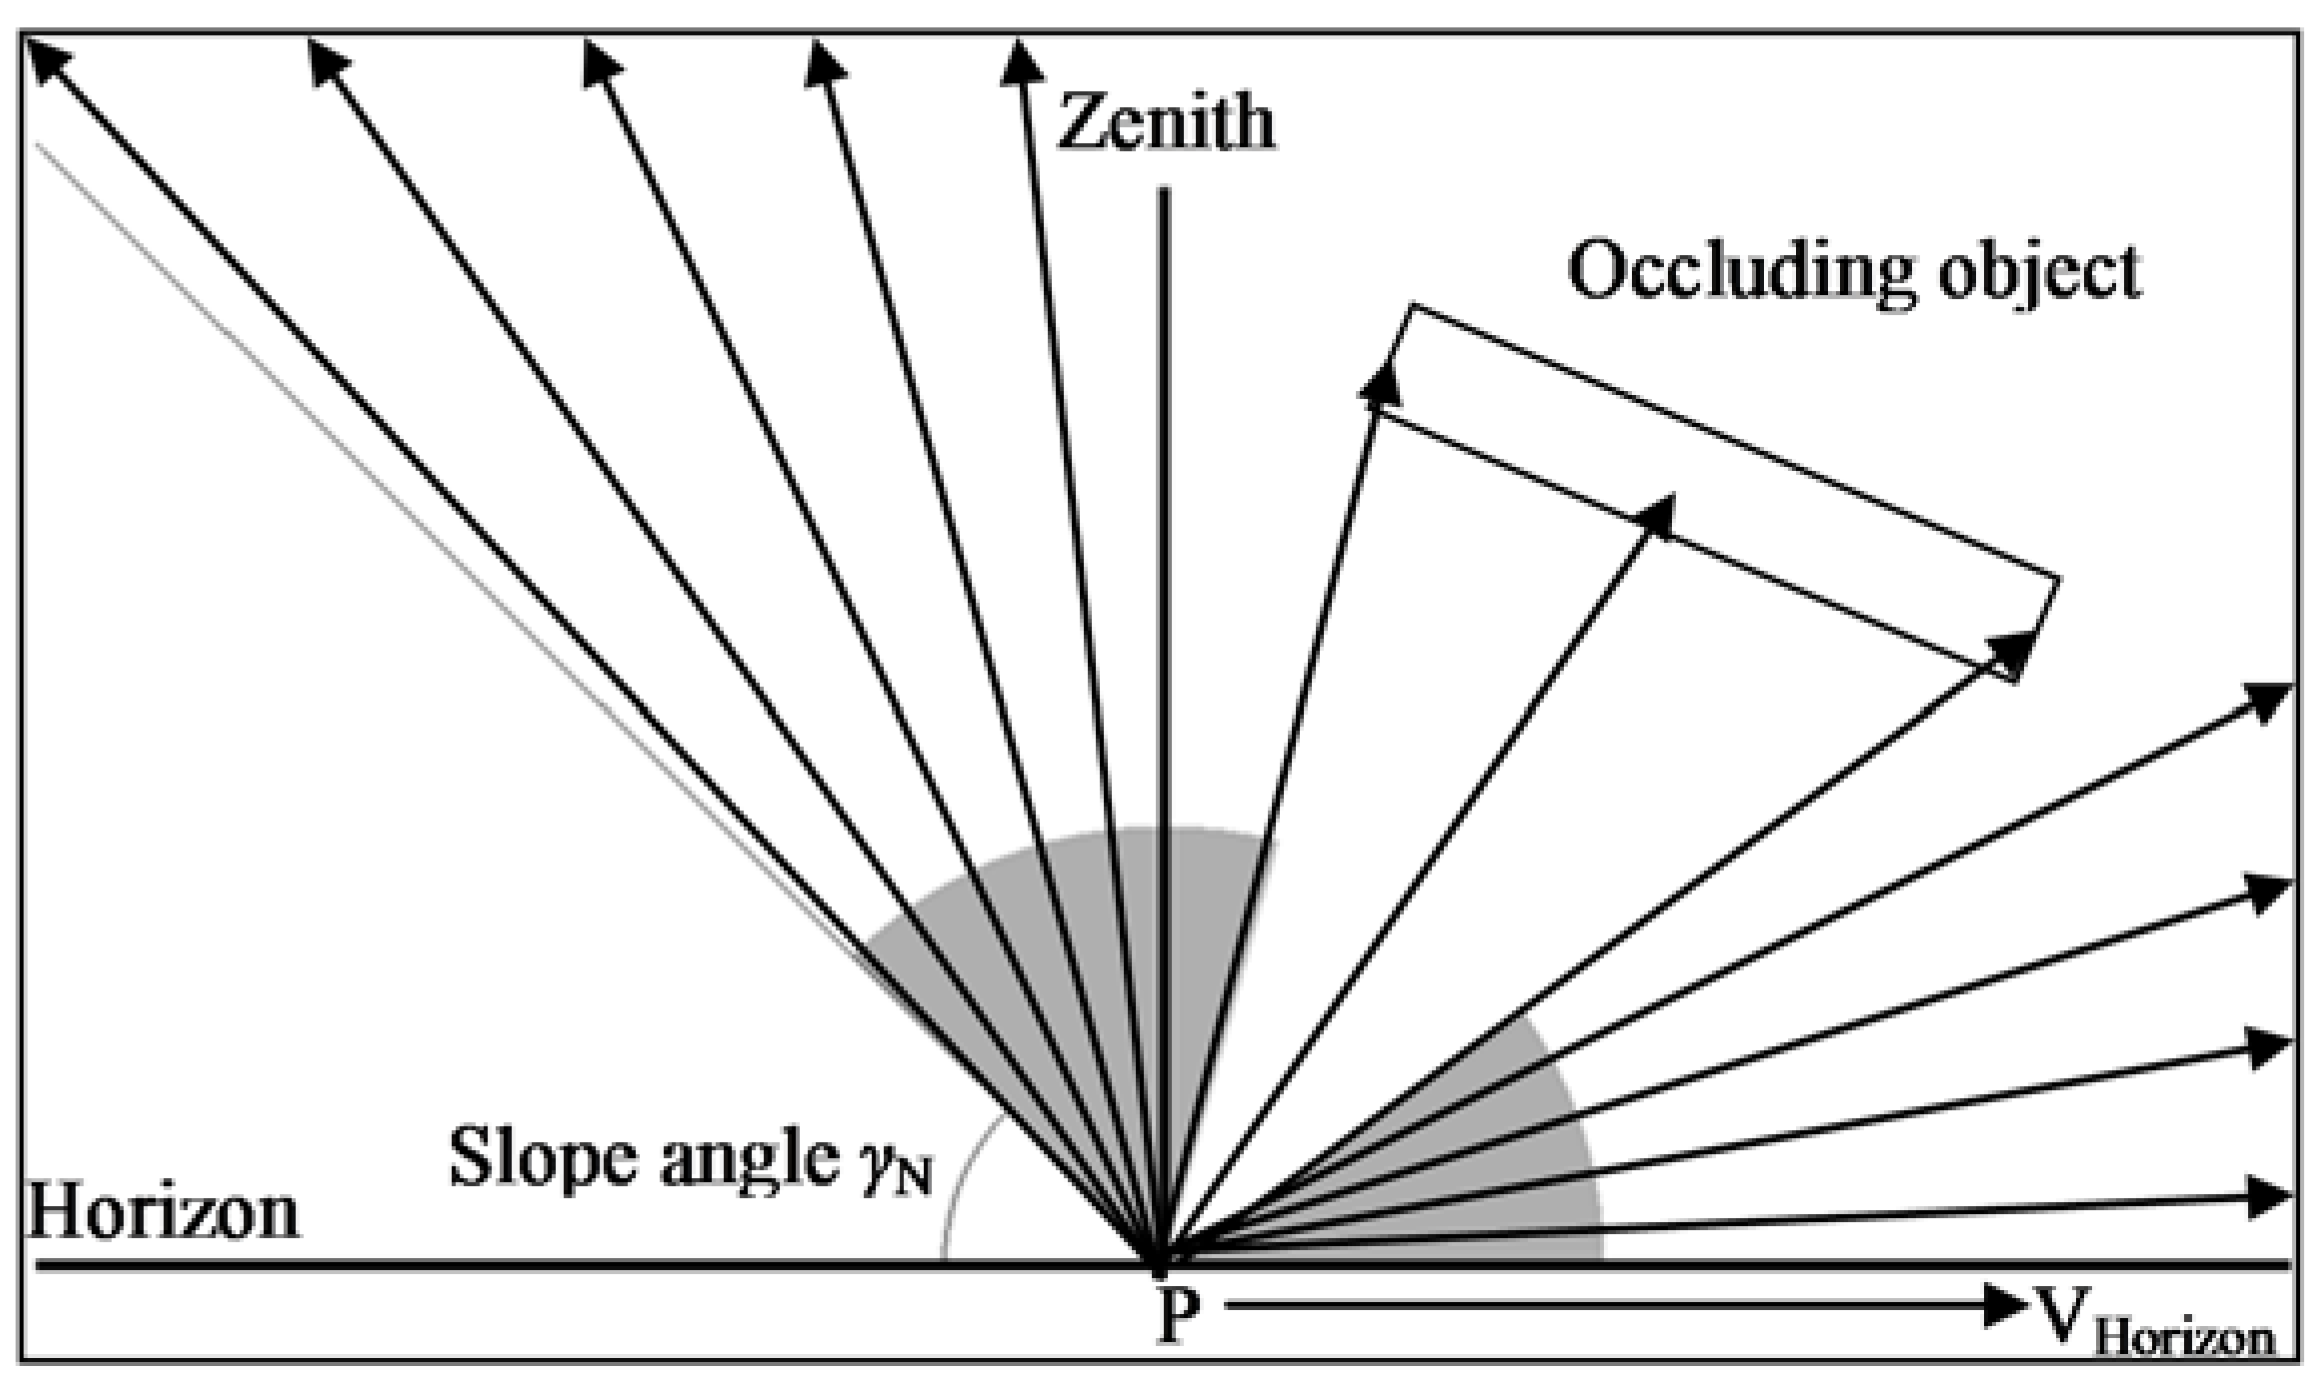
3.1. The r.sun Solar Radiation Model and Its Extension

Sun–Earth geometry, topography, atmospheric characteristics and overcast conditions should be taken into account in a well-designed solar radiation model [19]. The r.sun model was developed and integrated into GRASS GIS by Hofierka and Suri [4] based on the European Solar Radiation Atlas (ESRA) [20].
According to the r.sun model, the total amount of radiation incident at Earth’s surface is known as the global solar radiation, which is equal to the sum of the following three components: the beam (direct) radiation, the diffuse radiation and the reflective radiation. However, only the beam and the diffuse component will be accounted for in the present study because they usually comprise the majority of the contributions. The clear sky beam irradiance on a horizontal surface Bhc (W·m−2) is calculated by the following equation:
B h c = G 0 exp { 0.8662 T L K m δ R ( m ) } sin h 0
where TLK is the air mass Linke turbidity factor, G0 is the extraterrestrial irradiance normal to the solar beam, and h0 is the solar altitude. The parameter m is the relative optical air mass, and δR(m) is the Rayleigh optical thickness. Detailed calculations for acquiring the parameters of G0, m and δR(m) are provided by Hofierka and Suri [4]. Taking into account the shadowing effect, the clear sky beam irradiance on an inclined surface Bic (W·m−2) is calculated by the following equation:
B i c = { 0 , if   M s h a d o w ( V s u n ) = 1 B h c sin δ exp / sin h 0 , if   M s h a d o w ( V s u n ) = 0
where Mshadow denotes the shadow mask function depending on the solar vector Vsun, which is described by the solar azimuth angle and the solar altitude angle. δexp is the solar incidence angle measured between the sun and an inclined surface. Mshadow returns 0 when it is being shadowed or otherwise returns 1. In practice, a ray oriented in the direction of the solar vector is cast to traverse the SVO for possible intersections. The clear sky diffuse irradiance on a horizontal surface Dhc (W·m−2) is a function of G0, TLK, and the solar altitude h0 as given below:
D h c = G 0 T n ( T L K ) F d ( h 0 )
where Tn and Fd are the transmission function and solar altitude function respectively [4]. Taking into account the shading effect, the clear sky diffuse irradiance on an inclined surface Dic (W·m−2) is modeled as follows:
D i c = { D h c F ( γ n ) , if   M s h a d o w ( V s u n ) = 1 D h c { F ( γ n ) ( 1 K b ) + K b sin δ exp / sin h 0 } ,   else   if   h 0 > = 0.1 D h c { F ( γ n ) ( 1 K b ) + K b γ n cos A L N / ( 0.1 0.008 h 0 ) } ,   else   if   h 0 < 0.1
where γn is the slope angle (in radians). F(γn) is a function of γn as follows:
F ( γ n ) = r i ( γ n ) + ( sin γ n γ n cos γ n π sin 2 ( γ n / 2 ) ) N
where Kb is a measure of the amount of beam irradiance available, and the detailed calculations for deriving the term N are provided by Hofierka and Suri [4]. One of most important terms in Equation (5) is ri(γn), which represents the fraction of the sky that is visible from the present geographic location and is analogous to the definition of SVF (it ranges between 0 and 1). In the r.sun model, the SVF is simply approximated as a function of the slope angle:
S V F r i ( γ n ) = ( 1 + cos γ n ) / 2
As can be inferred from Figure 1, the sky is fully visible with an SVF of 1 when the slope is nearly horizontal (γn approaching 0); only half of the sky is visible with a minimum SVF of 0.5 when the slope is nearly vertical (γn approaching 1.57; equivalent to 90 degrees).
Actually, ri(γN) is an approximation of the SVF by ignoring ambient occlusion. Although such a simplification is acceptable for DEMs, the occlusion by 3D objects is too complicated to be completely ignored. For instance, a significant fraction of the sky is occluded by a 3D object as shown in Figure 2.
Assuming all surfaces are opaque media that are impenetrable by light, the SVF can be obtained by integrating the shadow mask function over the upper hemisphere as presented in the equation below:
S V F = 1 2 π π π 2 π 0 π 2 ( 1 M s h a d o w ( V ( θ , ω ) ) ) d θ d ω
where V(θ, ω) denotes the ray direction described by the azimuth angle θ and the zenith angle ω in the horizontal coordinate system centered at P. The integral is normalized to [0,1] as an approximation of the SVF. To obtain an accurate SVF, the azimuth step and the zenith step must be sufficiently small; this means that more rays need to be cast toward the sky. Because r.sun assumes an isotropic sky, the SVF is considered invariant and can be precomputed to save runtime costs.
Surface inclination and orientation are key factors in determining irradiance [21] and are the basic parameters of the r.sun model. Both the inclination and the orientation at P can be derived from the associated surface normal vector [15].

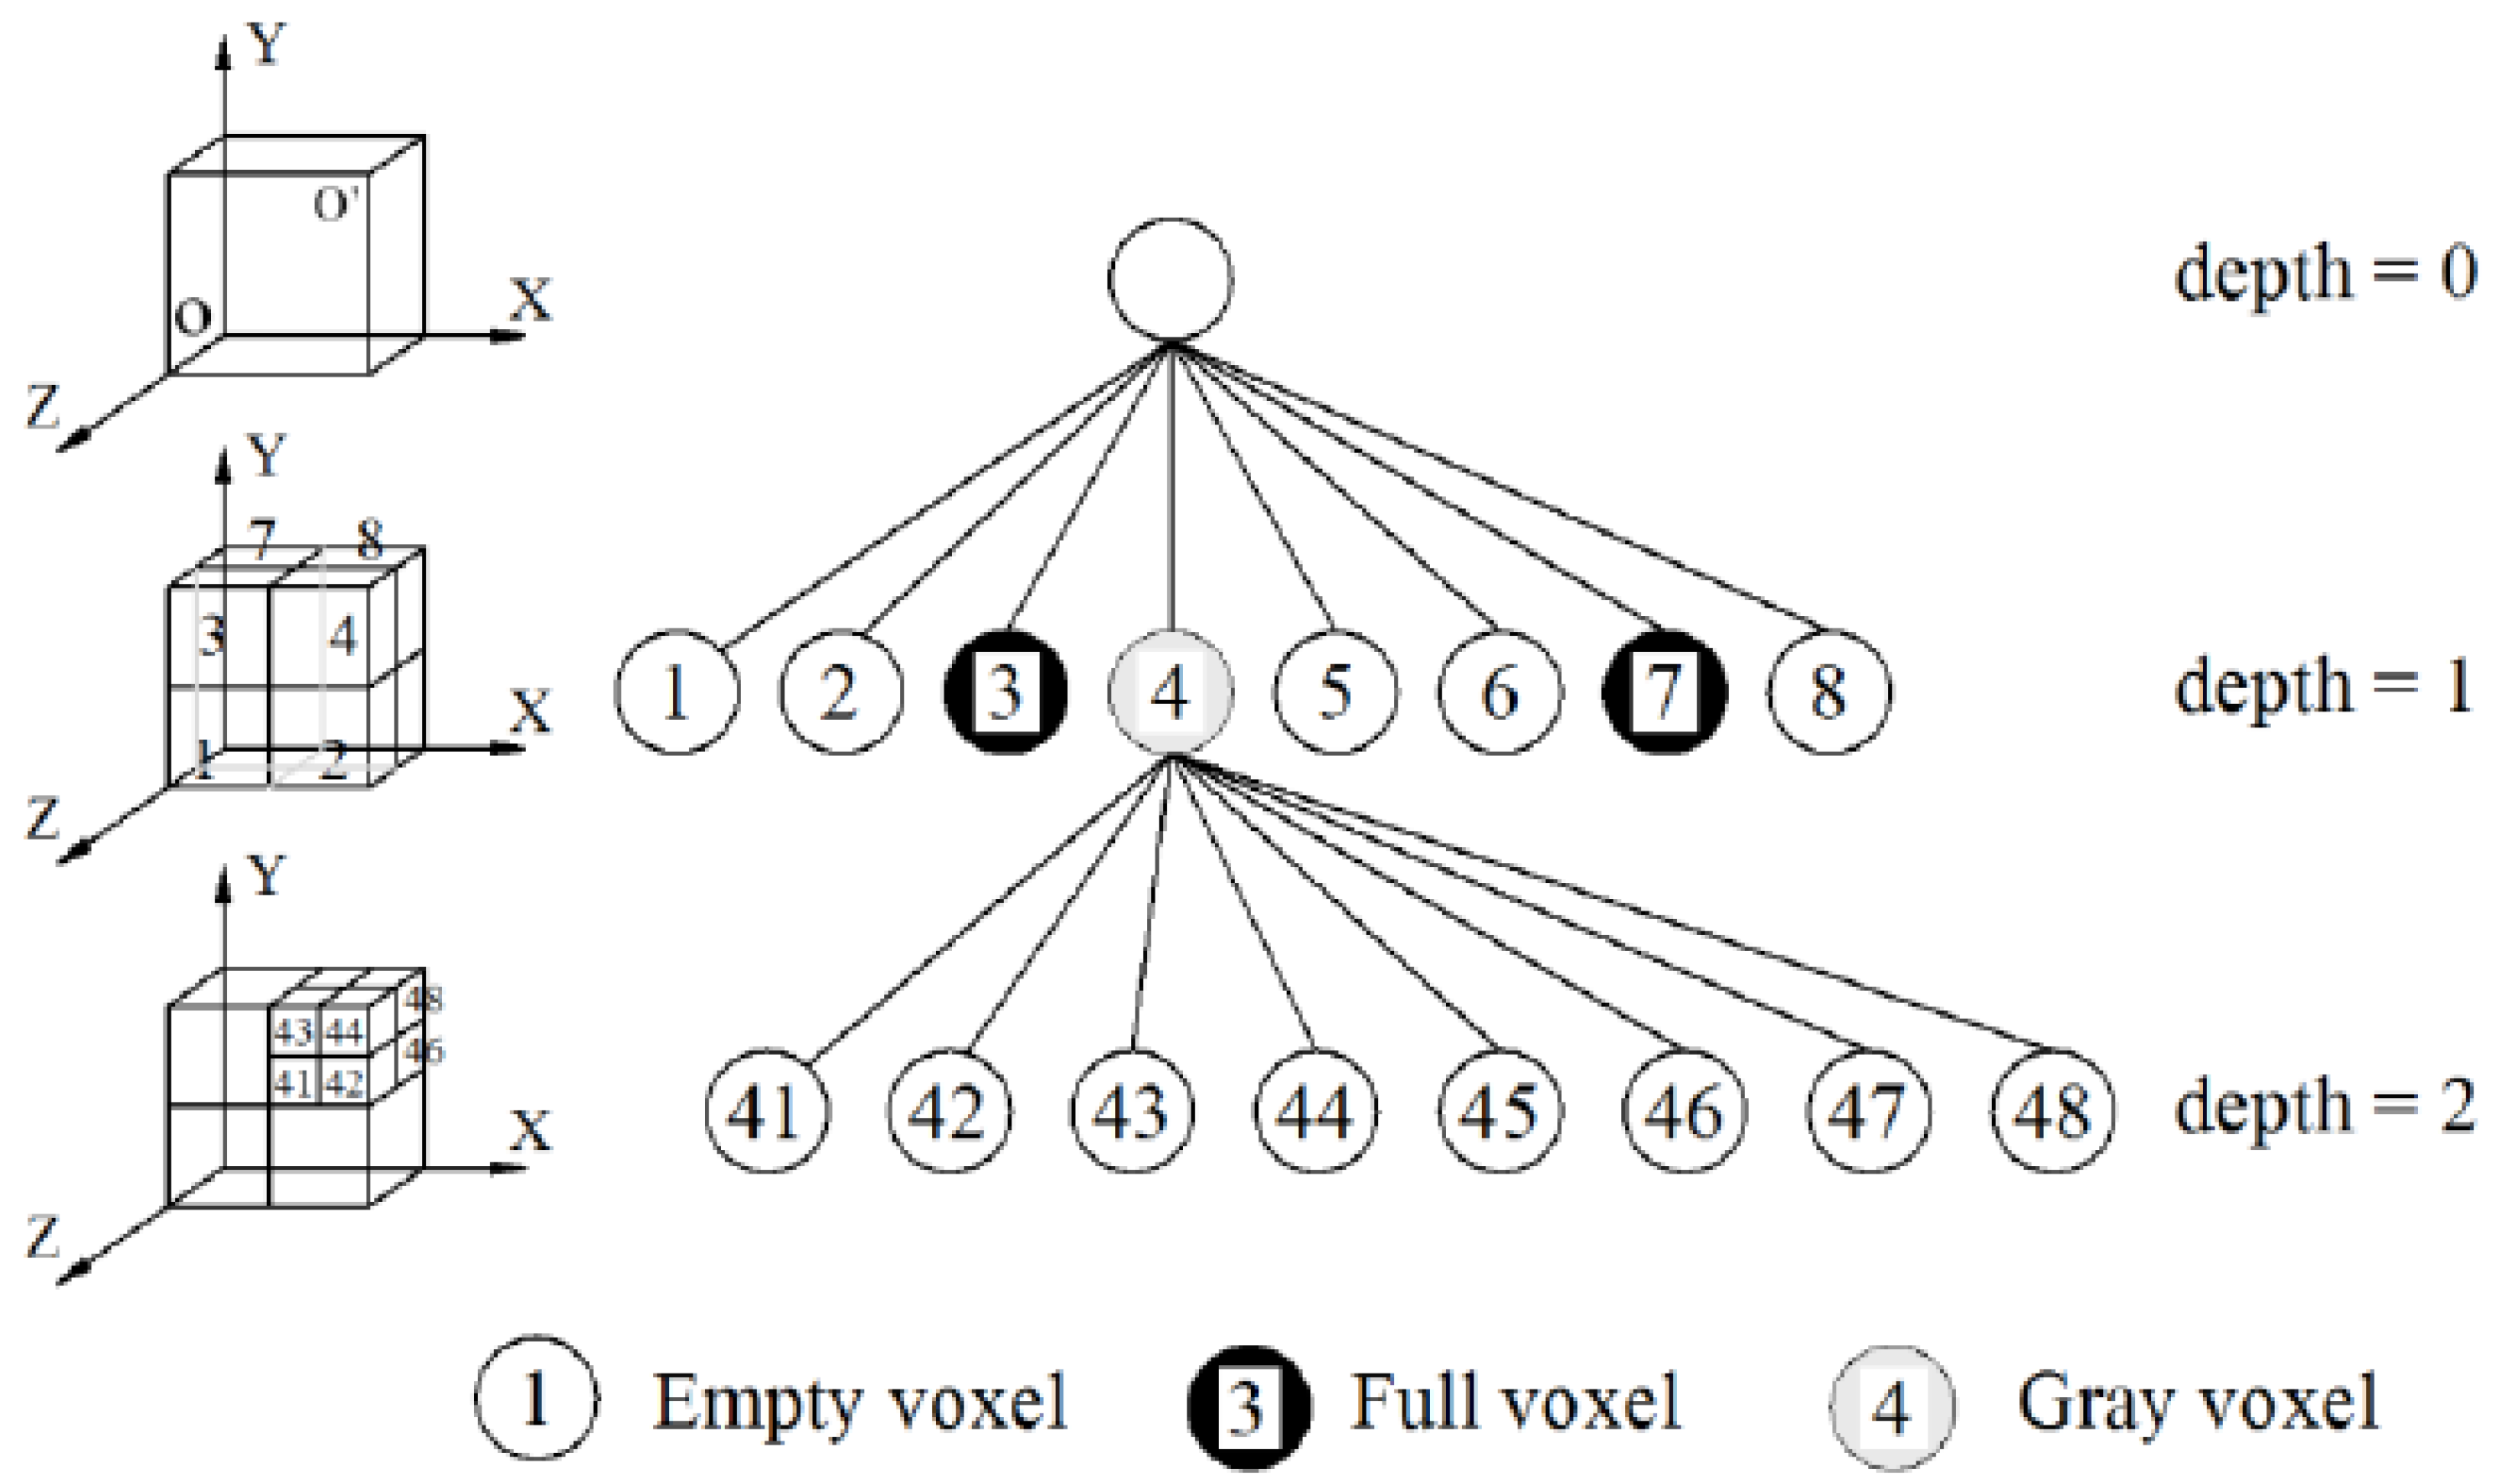
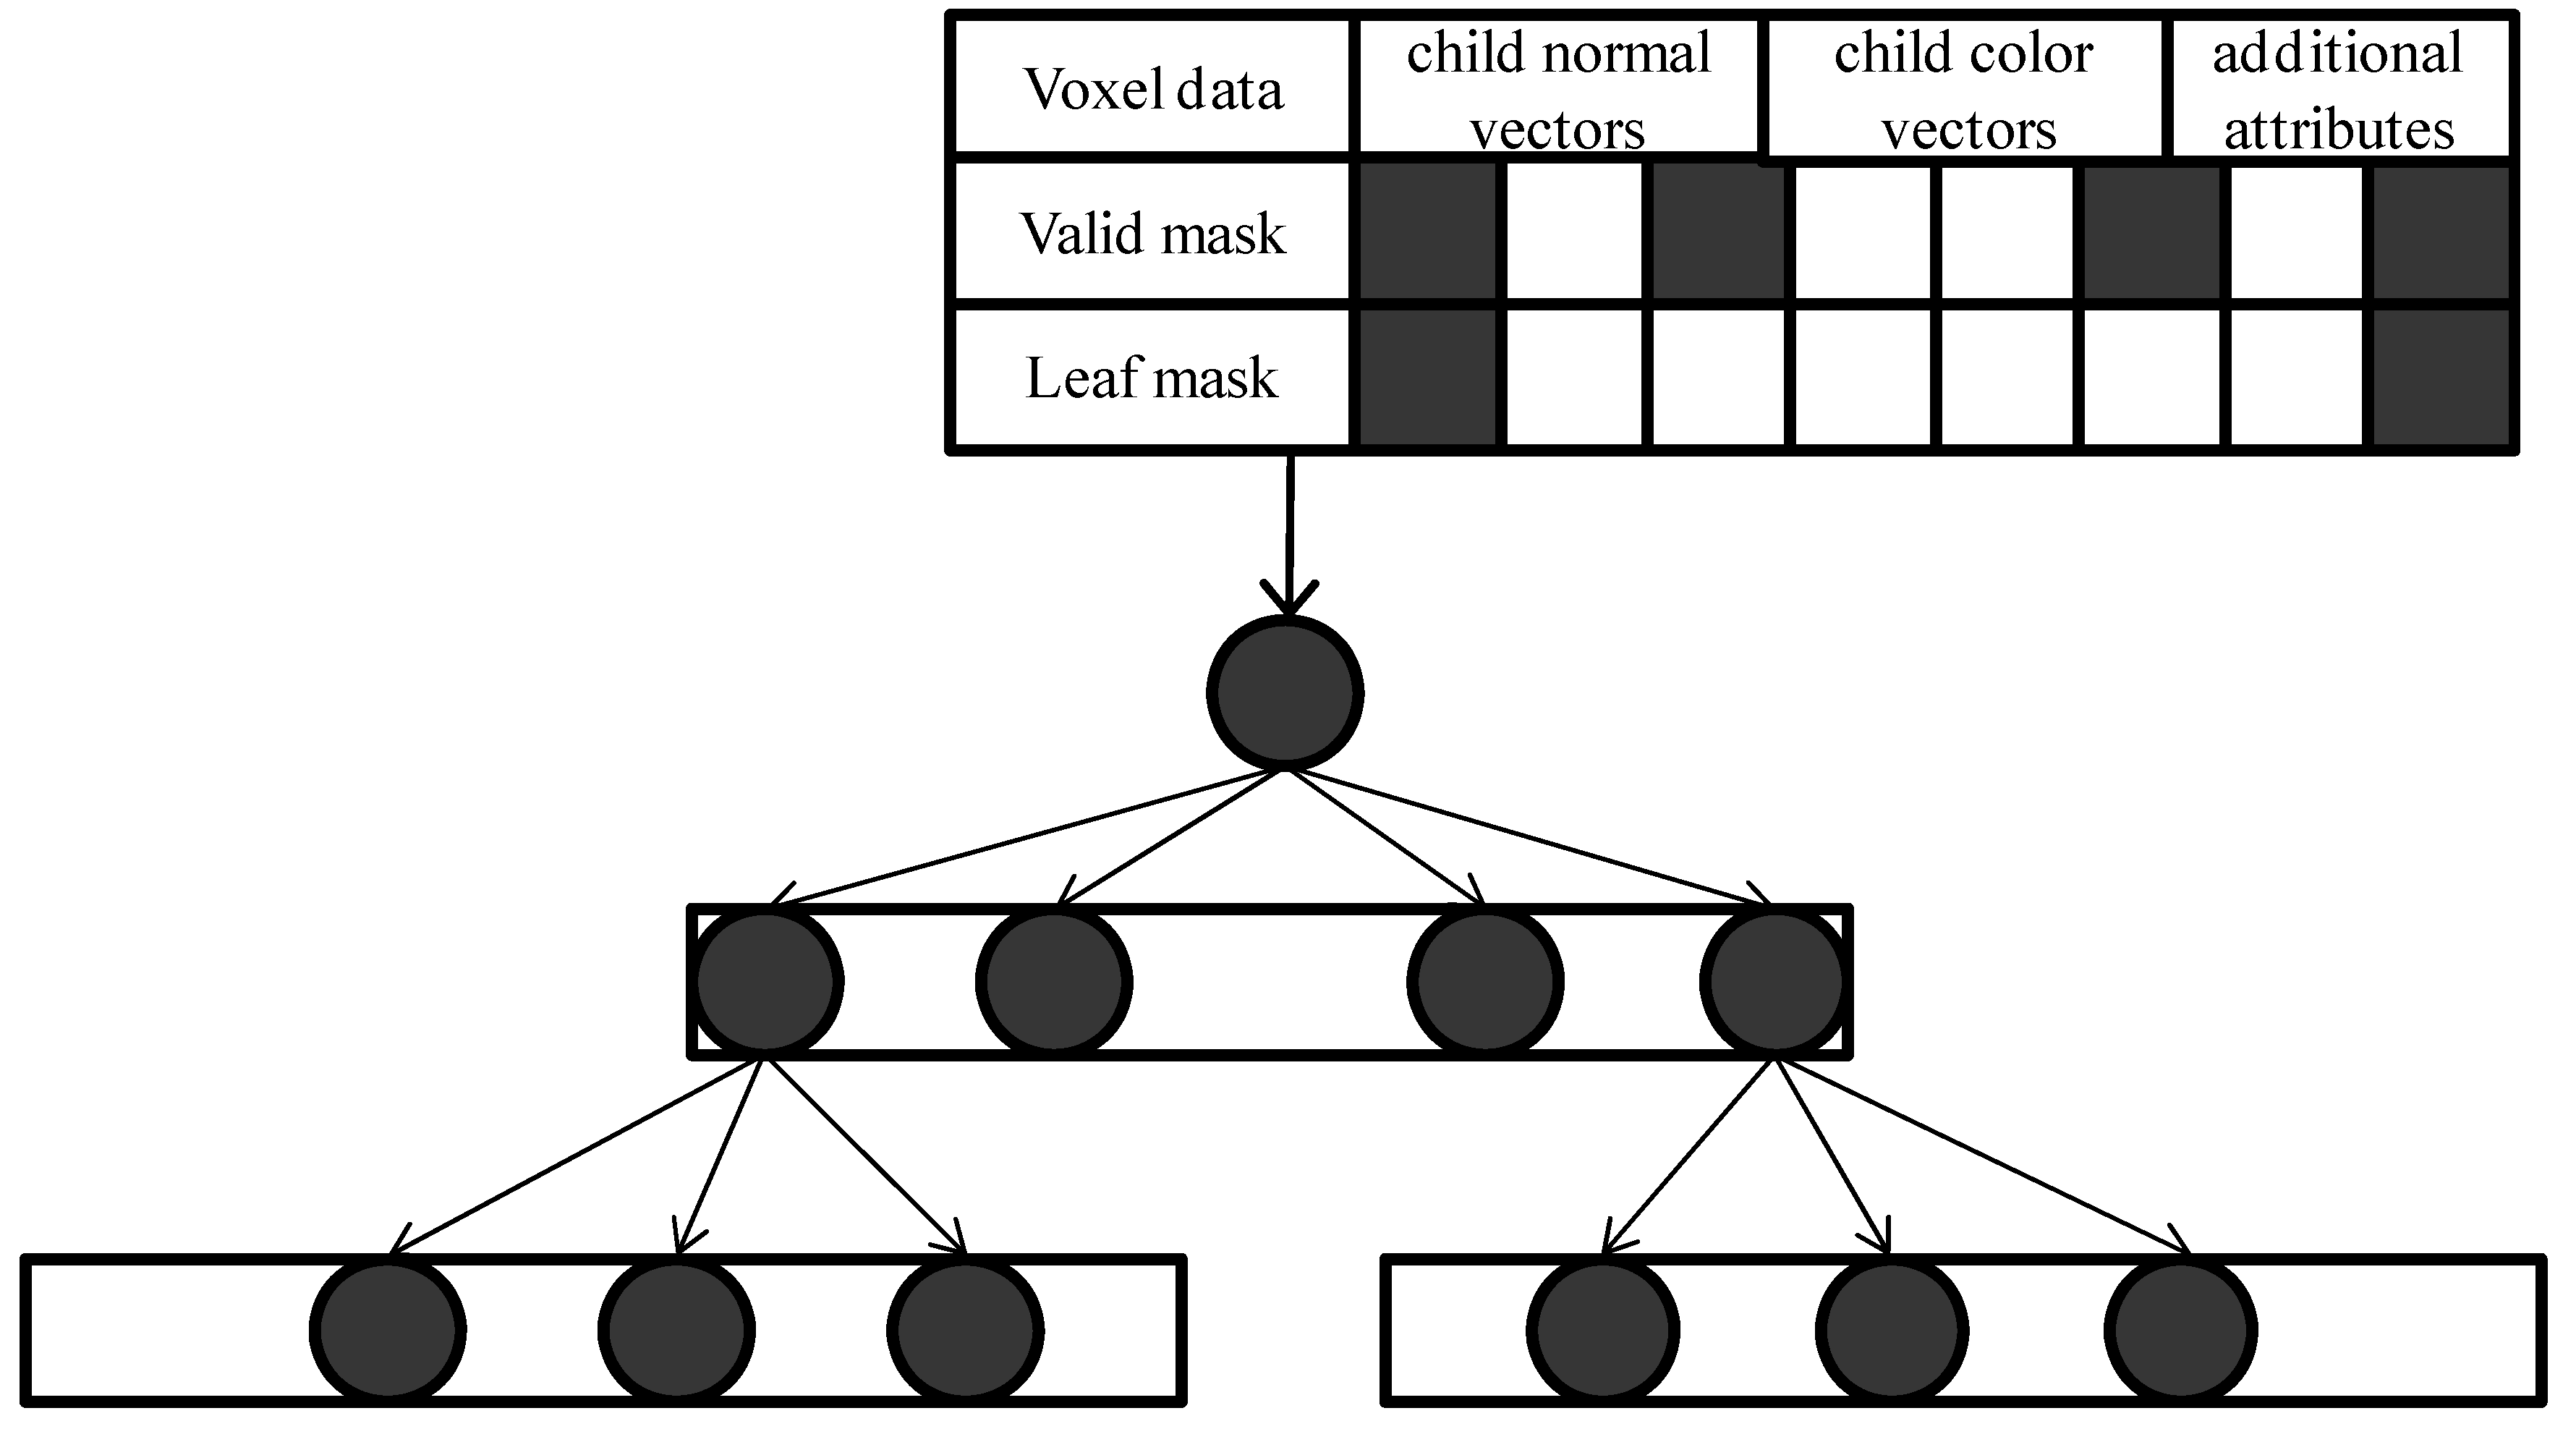
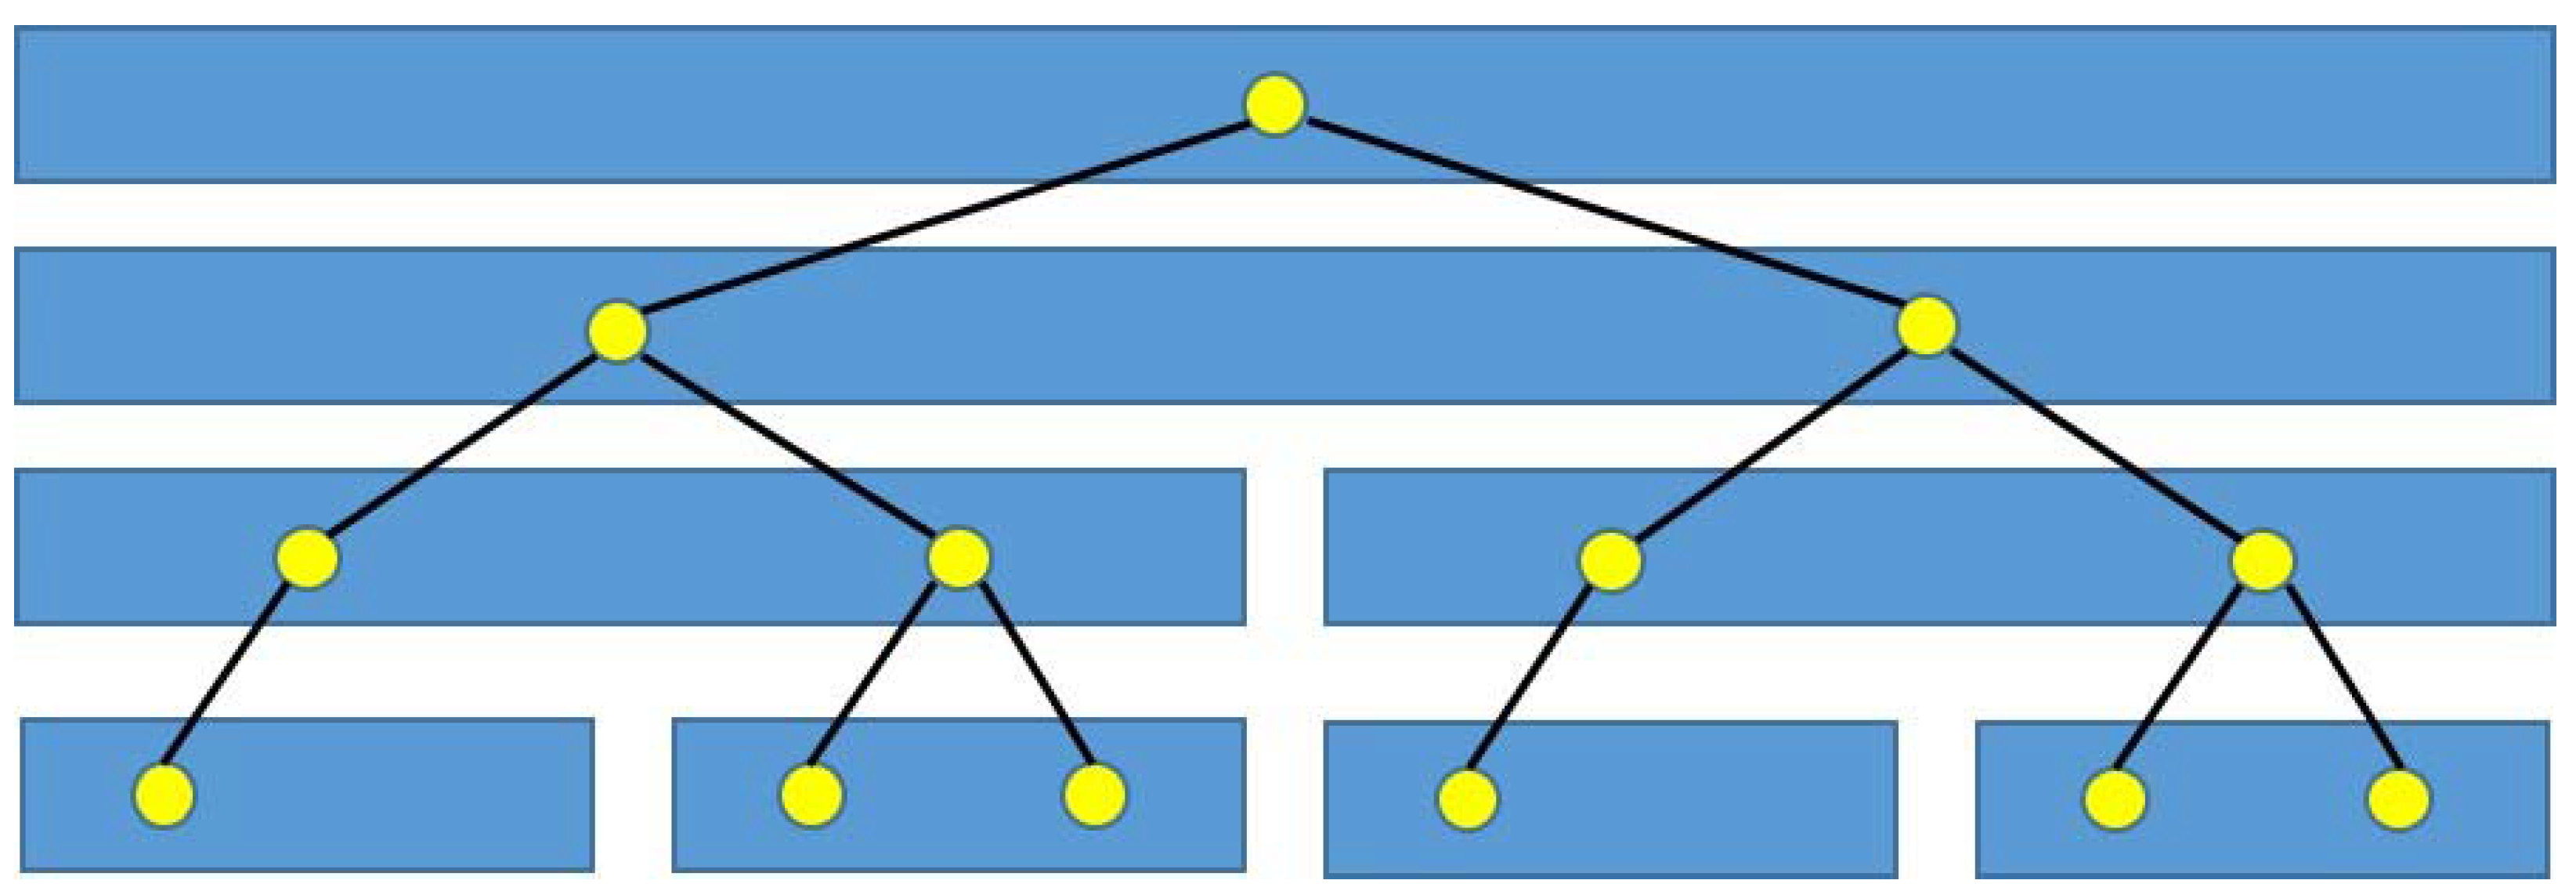
3.2. SVO Data Representation
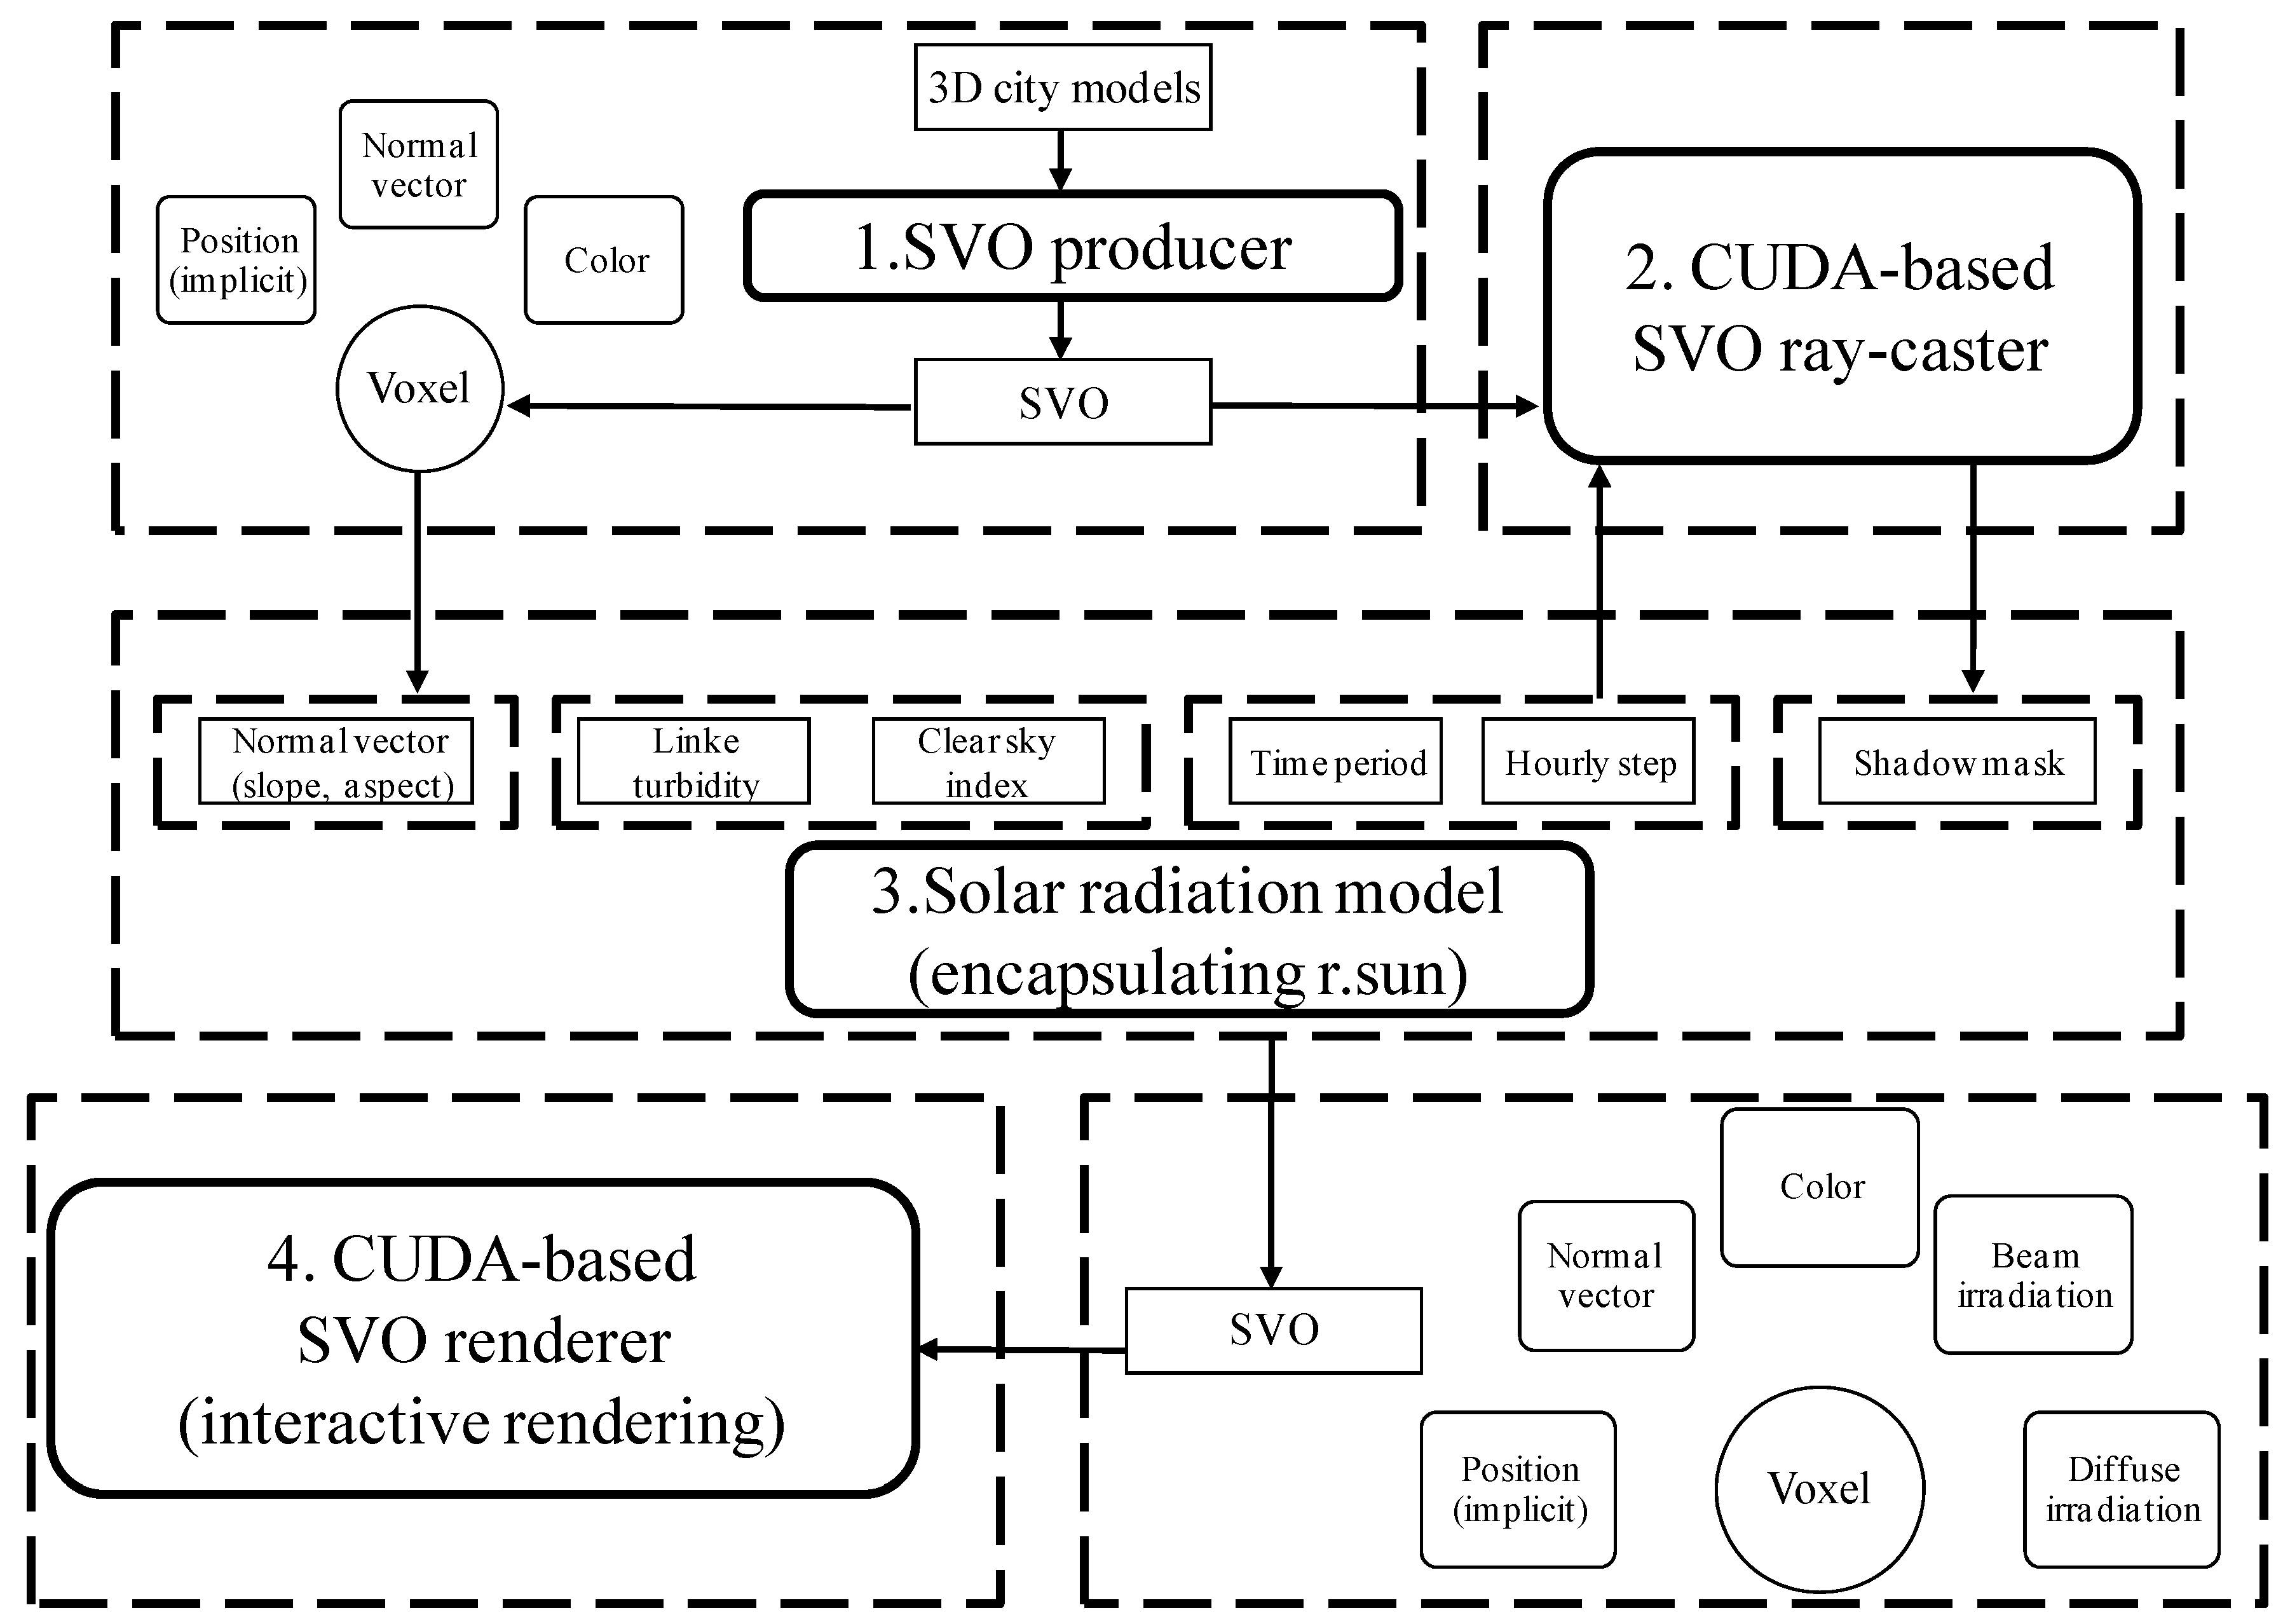
In terms of data representation, a voxel in 3D space is analogous to a raster cell in 2D space. Voxels are more commonly used to represent continuous volume data or 3D scalar fields (e.g., simulated tropical cyclones or fluids) to facilitate interactive volumetric visualization. However, voxels can also be employed to store and visualize 3D triangular meshes or other surface-based geometric data.
An octree is a data tree structure in which each internal node has exactly eight children. Octrees are most often used to partition a 3D space by recursively subdividing it into eight octants. Octrees are the 3D analog of quadtrees (Figure 3). Unlike a regularly partitioned octree, each node of an SVO has a variable number of children ranging from 1 to 8 or has no children at all if it is a leaf node. With an SVO, the empty spaces inside or outside a 3D building model can be marked as leaf nodes where no further partitioning is necessary, leading to a highly compact sparse data structure.
With the ESVO, distinctions must be made between a node and a voxel. A voxel refers to the data structure that stores the normal vector, the color and additional attributes of an octree node. However, the voxel information of up to 8 child nodes are compressed together and attached to their parent nodes to make the data structure as compact as possible. In practice, the normal or color vectors of two consecutive parent nodes are compressed into a single block using the DXT1 algorithm [23]. In addition to the child voxel data, a parent node also contains a topological descriptor of each child node. The child descriptor contains two 8-bit bitmasks that each store one bit per child slot. The valid mask determines whether each of the child slots actually contains a voxel, while the leaf mask further specifies whether each of these voxels is a leaf. A graphical illustration of the ESVO data structure is presented in Figure 4. The ESVOs are implemented on both CPU and CUDA, which allows a ray caster to traverse the tree by following the bitmasks. Detailed implementations of octree traversal on CUDA can be found in the work of Laine and Karr [17] with source codes available online.
As the tree depth increases, the amount of voxel data for a single level may finally exceed the capacity of the system or the video memory. To facilitate out-of-core data streaming, the nodes at each octree level are partitioned such that each sub-space contains a number of nodes that do not exceed a specified threshold. The nodes within such a sub-space are stored on disk together, known as a slice (Figure 5), which can be loaded separately at runtime. With a distance-based data streaming strategy, an octree can be subdivided dynamically so that the memory consumption is limited to a reasonable range.
A top-down voxelization strategy is employed to recursively intersect the triangles of a 3D scene with the voxels of each node level until a desired resolution is reached. The size of the root node is equal to the longest side length of the bounding box encompassing the 3D scene. Therefore, the voxel size of the child nodes can be inferred from a given tree level. Assuming that the tree level is n and the root node size is L, then the voxel size can be calculated by the following equation:
V o x e l s i z e = L 2 n
The 8 children of each parent node are intersected with the triangles to determine the valid and leaf bitmasks for the parent node. If a child exists, further box-triangle intersections are performed for its 8 children. If the desired voxel resolution is achieved in the voxelization process, the current node is marked true in the leaf mask and will not be subdivided further. The ESVO employs a unified texture-geometry generalization strategy, which means that each voxel is assigned a single normal vector and a diffuse color that is an aggregation over all the intersected triangles.

3.3. Implementation

The SVO-based solar radiation computing framework encompasses four major components: namely an SVO producer, an SVO-based ray caster, a 3D solar radiation model and an SVO interactive render (Figure 6).
(1) SVO producer
The first step is to employ the SVO producer from the ESVO framework to voxelize the 3D city models intended for computation and visualization. The OpenSceneGraph library was incorporated to parse and import 3D models of various formats, including .obj, .3ds, .osg, and .ive, into the voxelization pipeline. Because the voxel resolution determines the accuracy of the geometric representation, a sufficiently deep SVO must be obtained to provide fine-scale voxels for high-quality visualization. Figure 7 shows a comparison between the mesh representation and the SVO representations of a building with a root node size of 70 m. The SVO representations are progressively refined from a depth of 5 to a depth of 9 (Figure 7).
(2) Solar radiation model
Unlike SURSUN3D [15], which adopts a rasterized computational domain, the present method considers a voxel as the basic computational element.
First, the computational granularity should be determined according to Equation (8). For instance, if the scene size given is 1000 m and we need a voxel resolution of approximately 1 m, the corresponding octree level should be 10 because the voxel resolution for level 10 is closest to 1 m.
Having determined an octree level n that is representative of the computational granularity, solar irradiation values are computed for all of the voxels from level 1 to n (including n). It should be noted that computation for the levels above n would not be necessary if interactive visualization was not considered. However, because the interactive voxel renderer requires a consistent tree structure for traversal and voxel sampling, we have to forcibly include the more coarsely-scaled voxels in the computation. An alternative approach is to reconstruct level 1 through n-1 by downsampling level n so that extra computation can be avoided. However, the extra computational cost does not amount to a significant burden because the number of voxels above level n are theoretically only 1/8 of those on level n.
(3) Interactive visualization
The direct, diffuse and global irradiation values for each level are stored in the form of voxel associated attributes. During the visualization stage, only the attribute of interest is loaded into the GPU memory for interactive rendering. The per-voxel irradiation values are shaded into RGB colors in real-time using a color ramp or a color transfer function.

4. Analyses and Discussion

The tests described above and in this section were run on a machine with a 2.90-GHz quad-core Intel Core i52310 CPU and 4 GB of RAM. The graphics card is an NVIDIA GeForce GTS 450 with 1.0 GB RAM. The proposed computational and visualization framework was implemented using C++, CUDA and OpenSceneGraph.

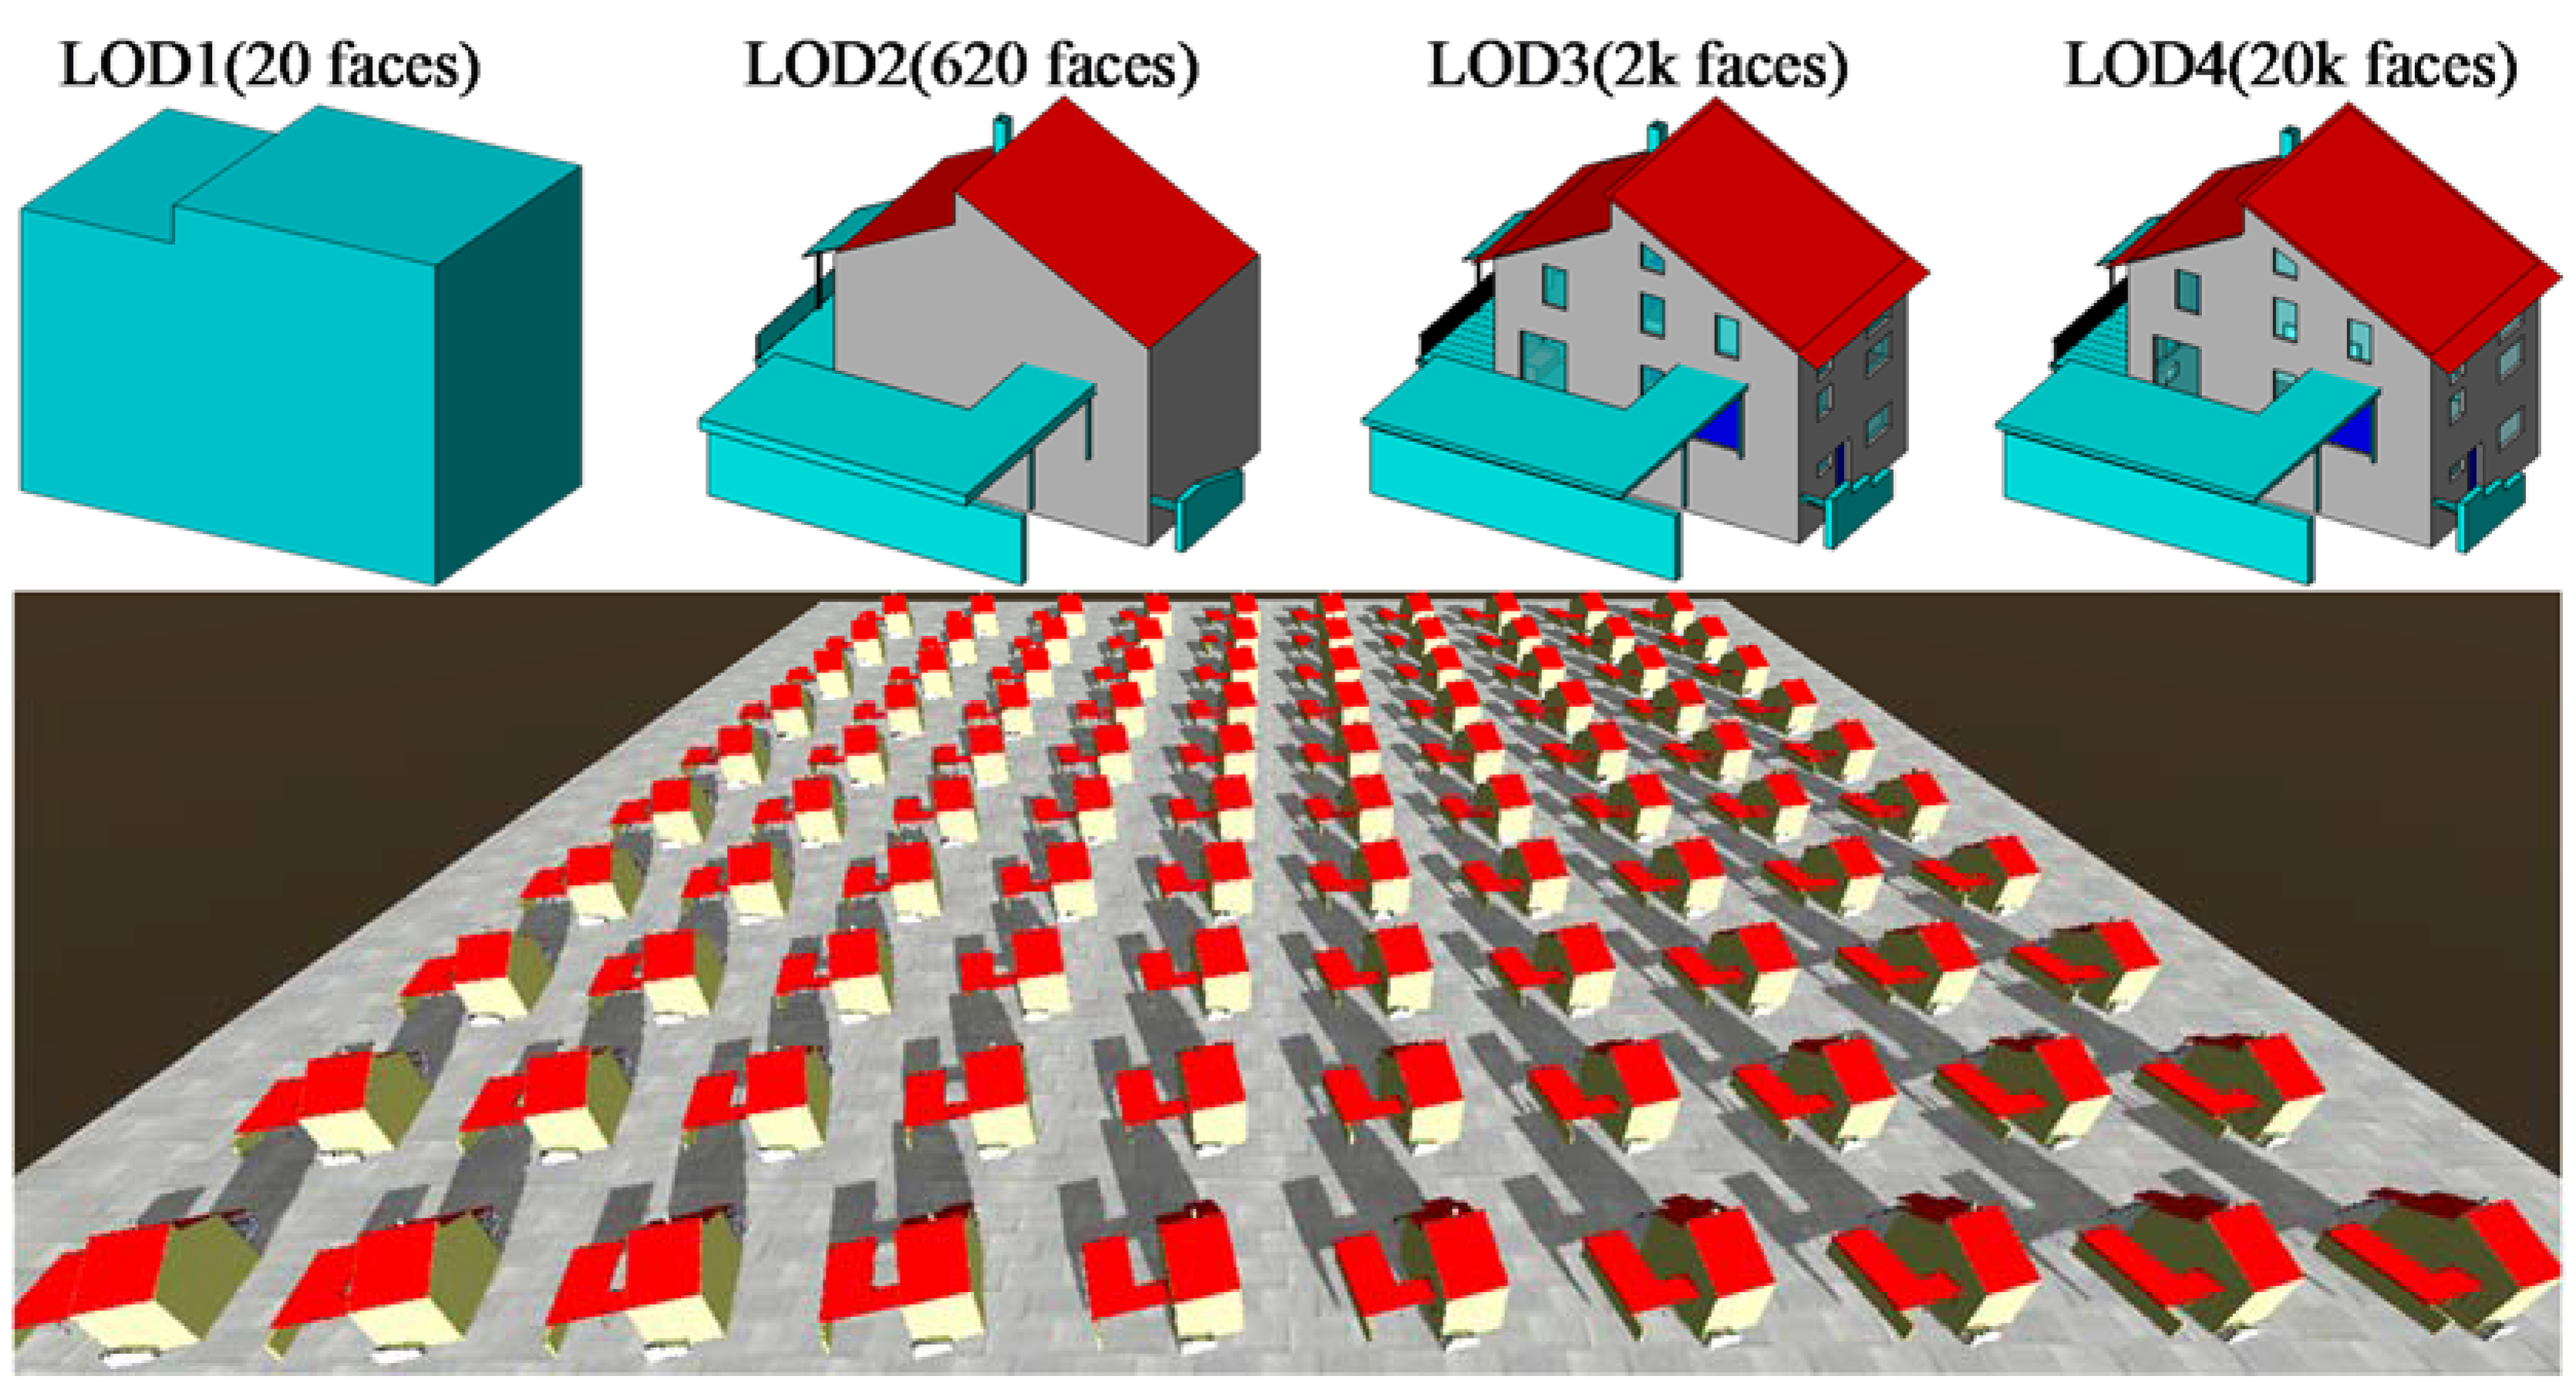
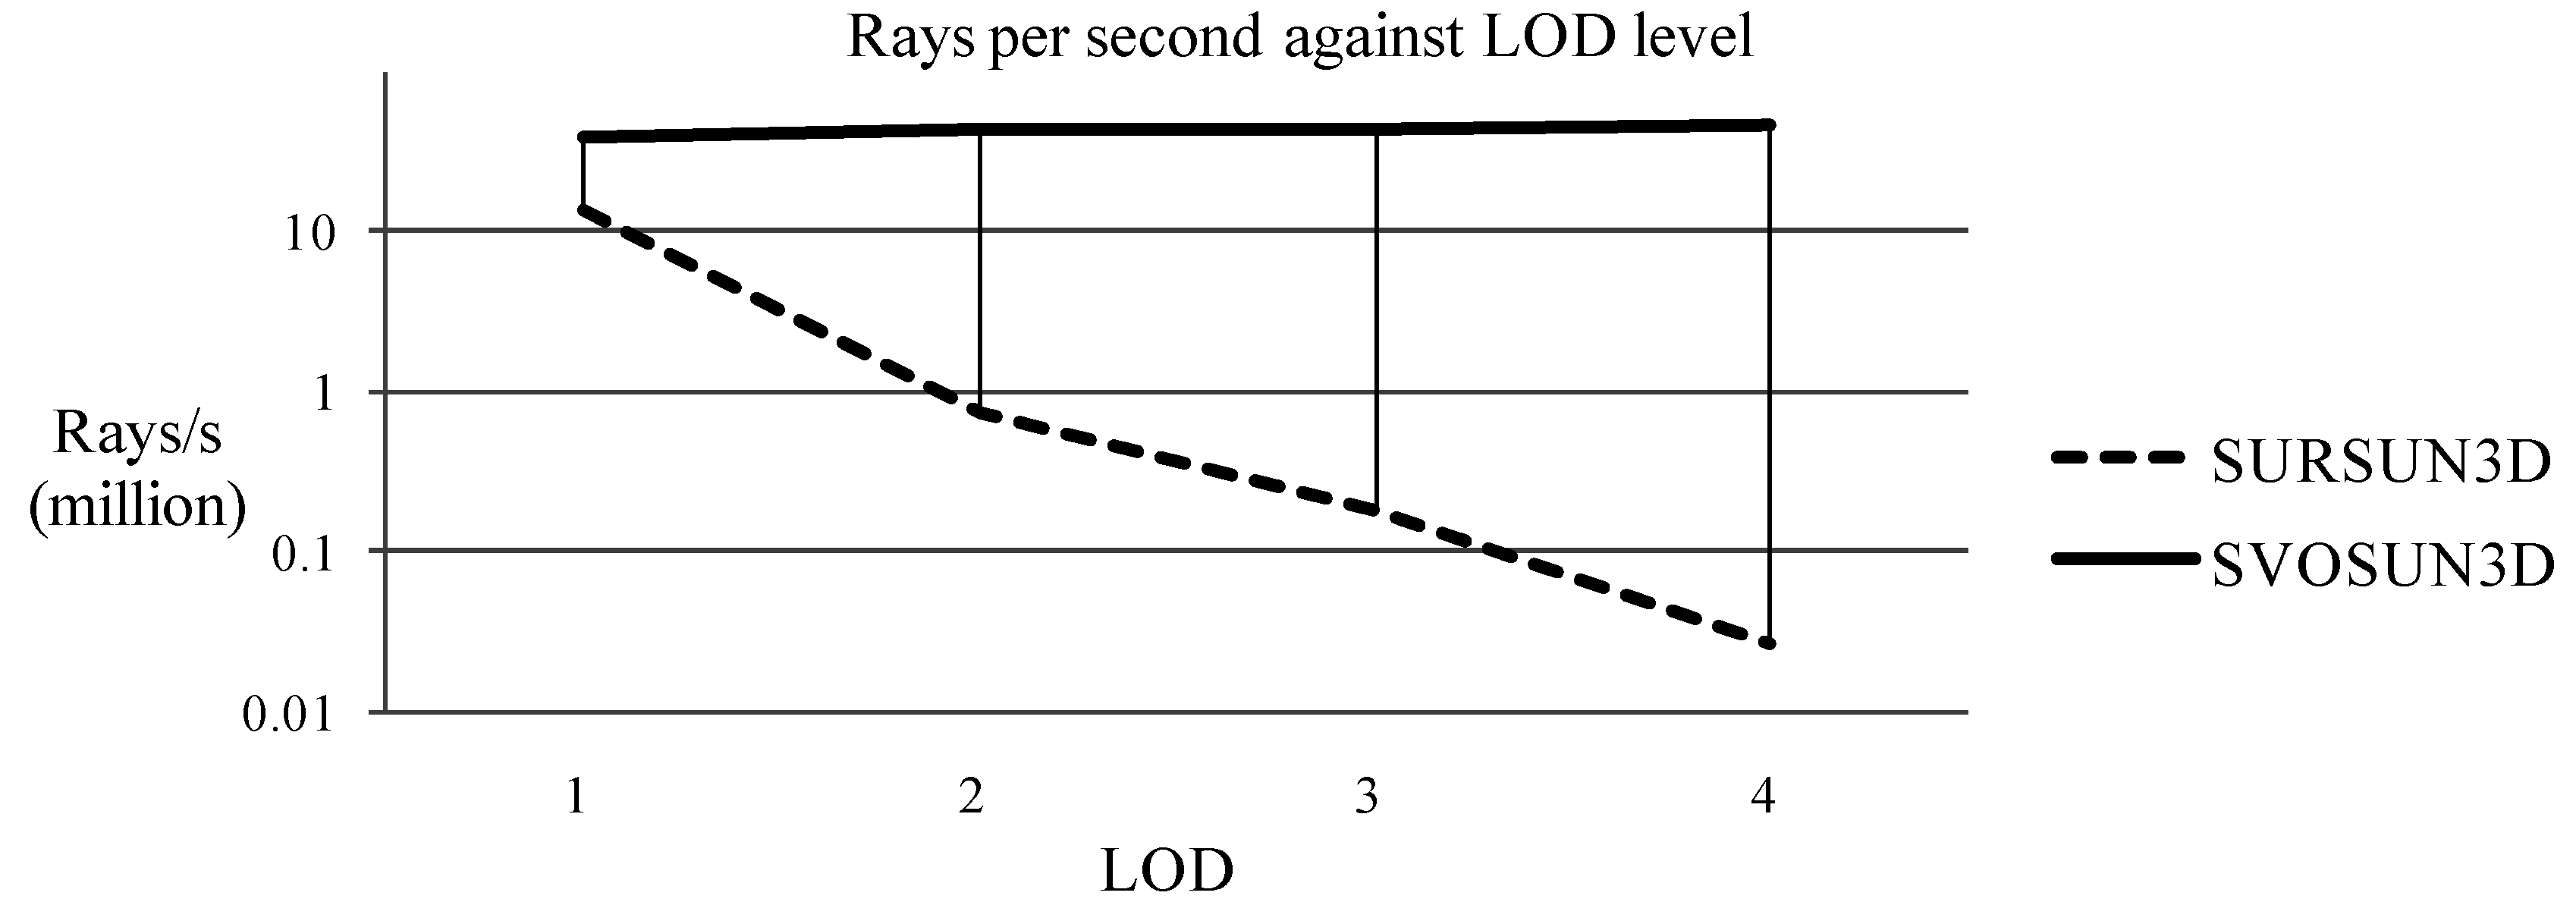
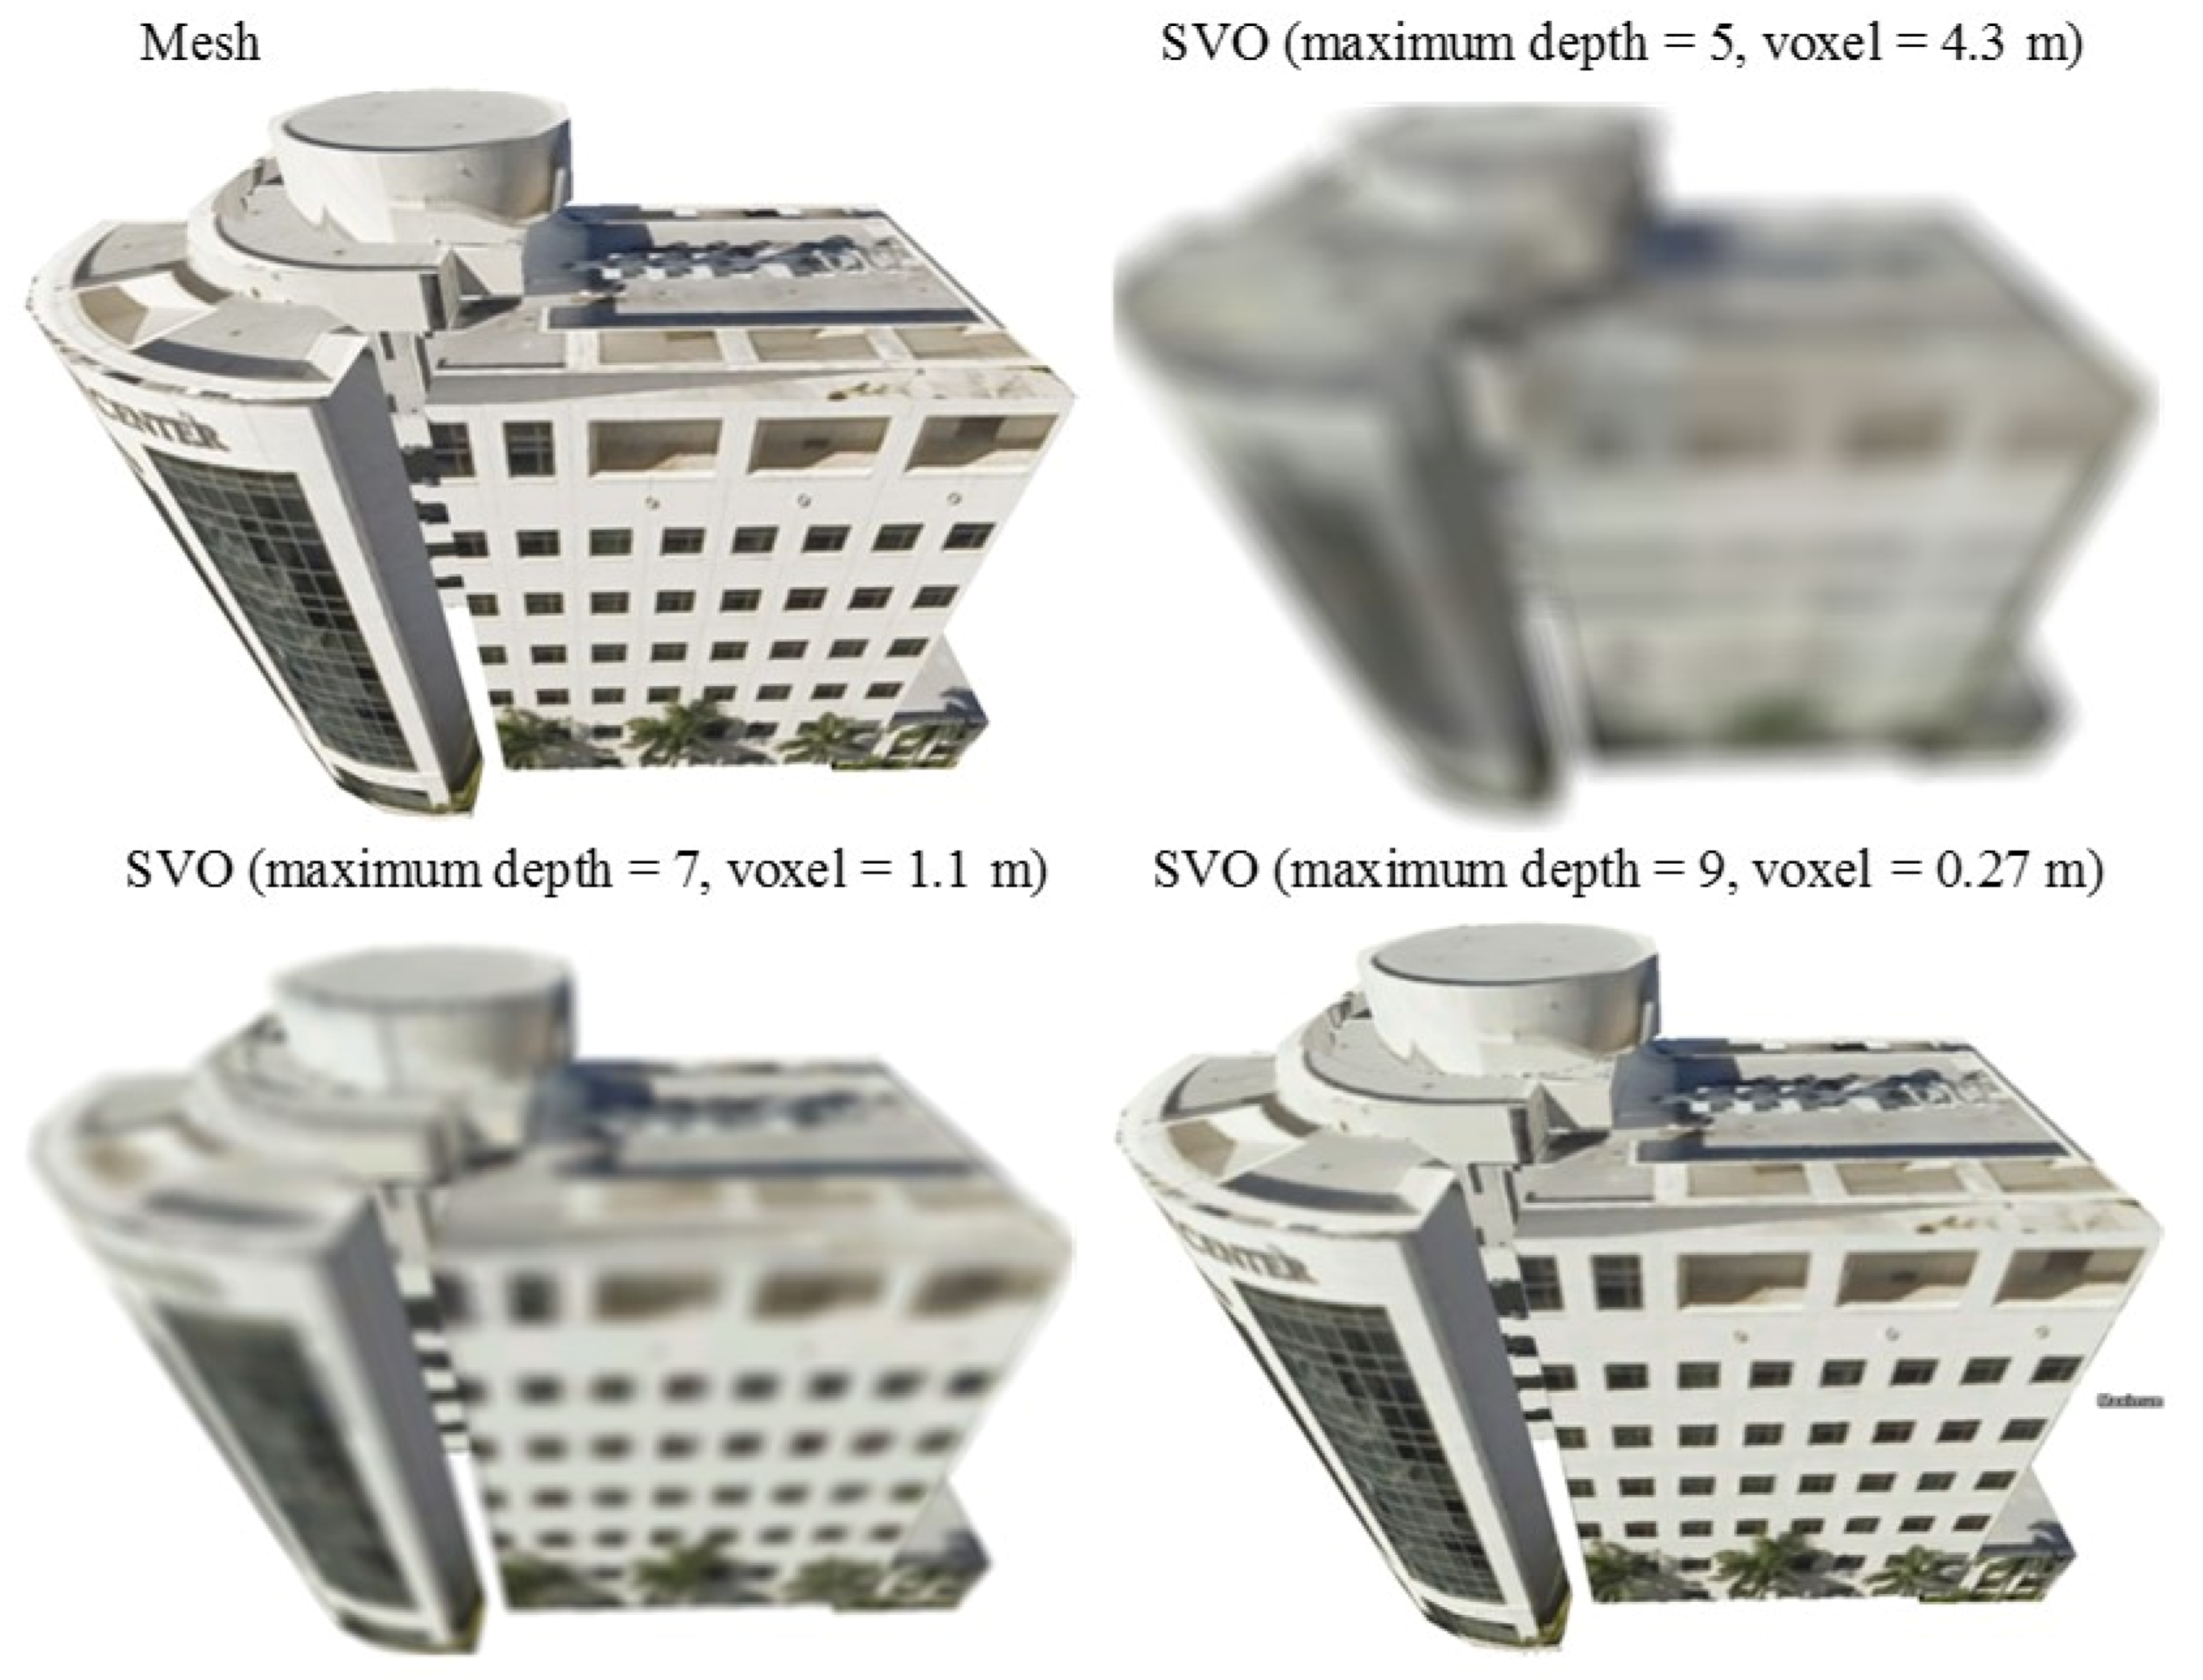
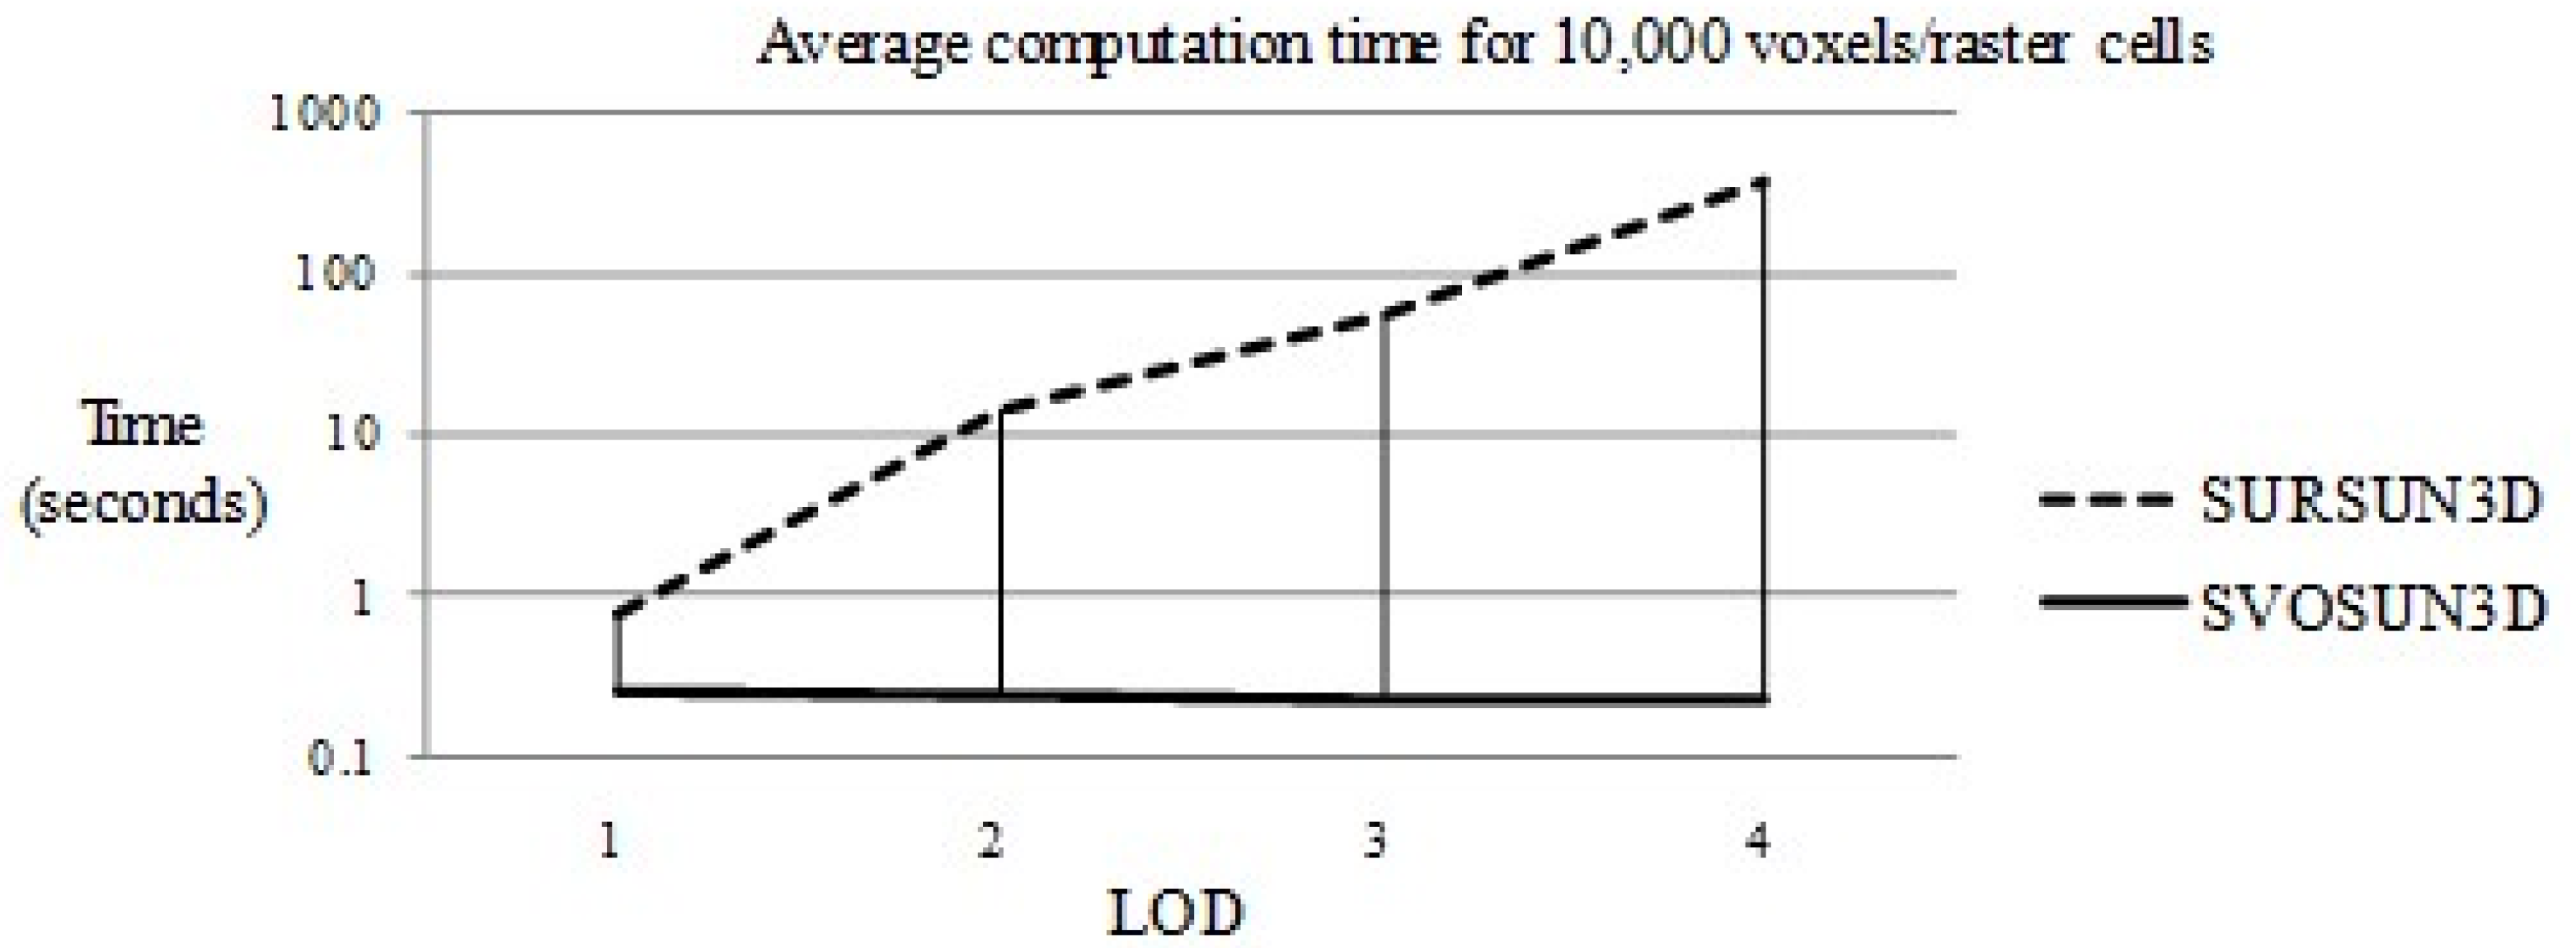
4.1. Scalability to Geometric Complexity and Comparisons

A CityGML building model consisting of four LOD levels from LOD1 to LOD4 (Figure 8) was downloaded from the website of the Karlsruhe Institute of Technology (KIT) at http://www.iai.fzk.de/www-extern-kit/index.php?id=2196. Each LOD level was replicated 10-by-10 times to create a separate 3D scene, for example, a scene created from LOD2 is shown in the lower half of Figure 8.
The clear sky solar radiation was calculated using SVOSUN3D and SURFSUN3D with an approximate one-meter resolution for a single day. The overall computation time, including ray-tracing and irradiation calculation, was averaged over the scene and plotted against the LOD level in Figure 9.
For SURFSUN3D, which adopts a triangle-based representation, the results indicate a significant correlation between the computational cost and the LOD level. For the present model (SVOSUN3D), the computation time is almost constant regardless of the LOD level; thus, it can be inferred that the method scales well to geometric complexity.
SURFSUN3D [15] also implements a CUDA-accelerated ray-tracing method that claims to achieve a speedup factor of eight over pure CPU implementation. Comparisons were made for the ray-casting efficiency between the two methods as presented below.
Figure 10 indicates that the SVOSUN3D is faster than the SURFSUN3D ray caster by one order of magnitude, and the difference tends to enlarge with increased geometric complexity. The acceleration achieved by the SVOSUN3D over the SURFSUN3D ray caster is largely attributable to the octree structure rather than GPU alone.
The comparisons (Figure 9 and Figure 10) show that ESVO scales much better to complex model scenes than the mesh representation. ESVO is a regularly spaced structure with a built-in spatial index that can accelerate ray-casting. Moreover, ray-triangle intersection in a mesh structure requires much more calculation time compared with ray-voxel intersection in an ESVO.

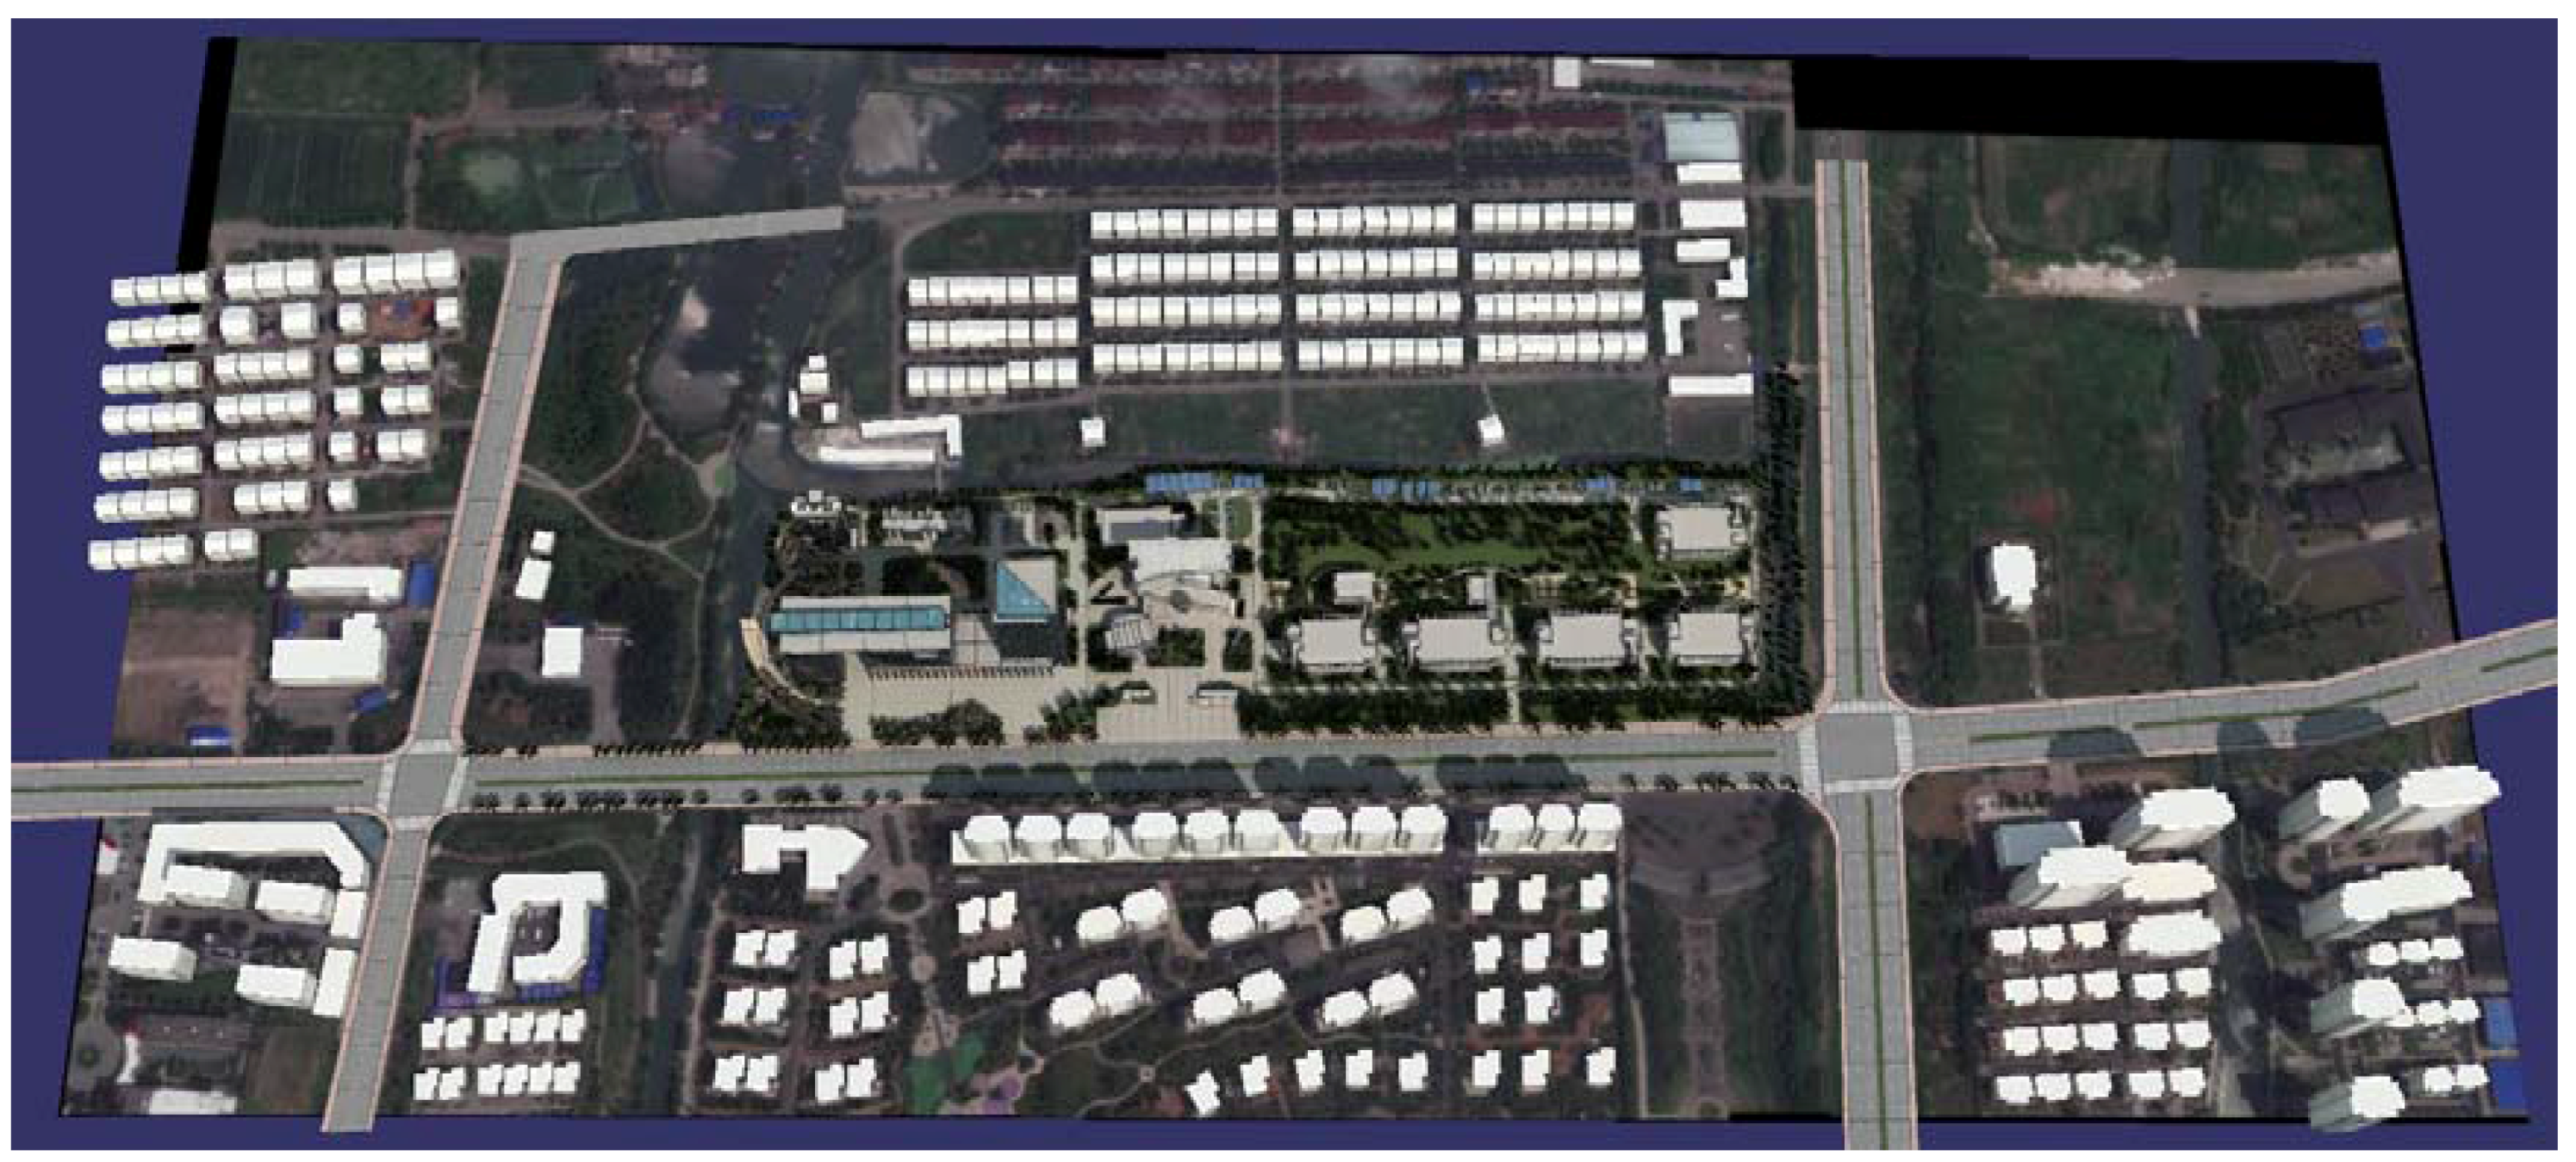
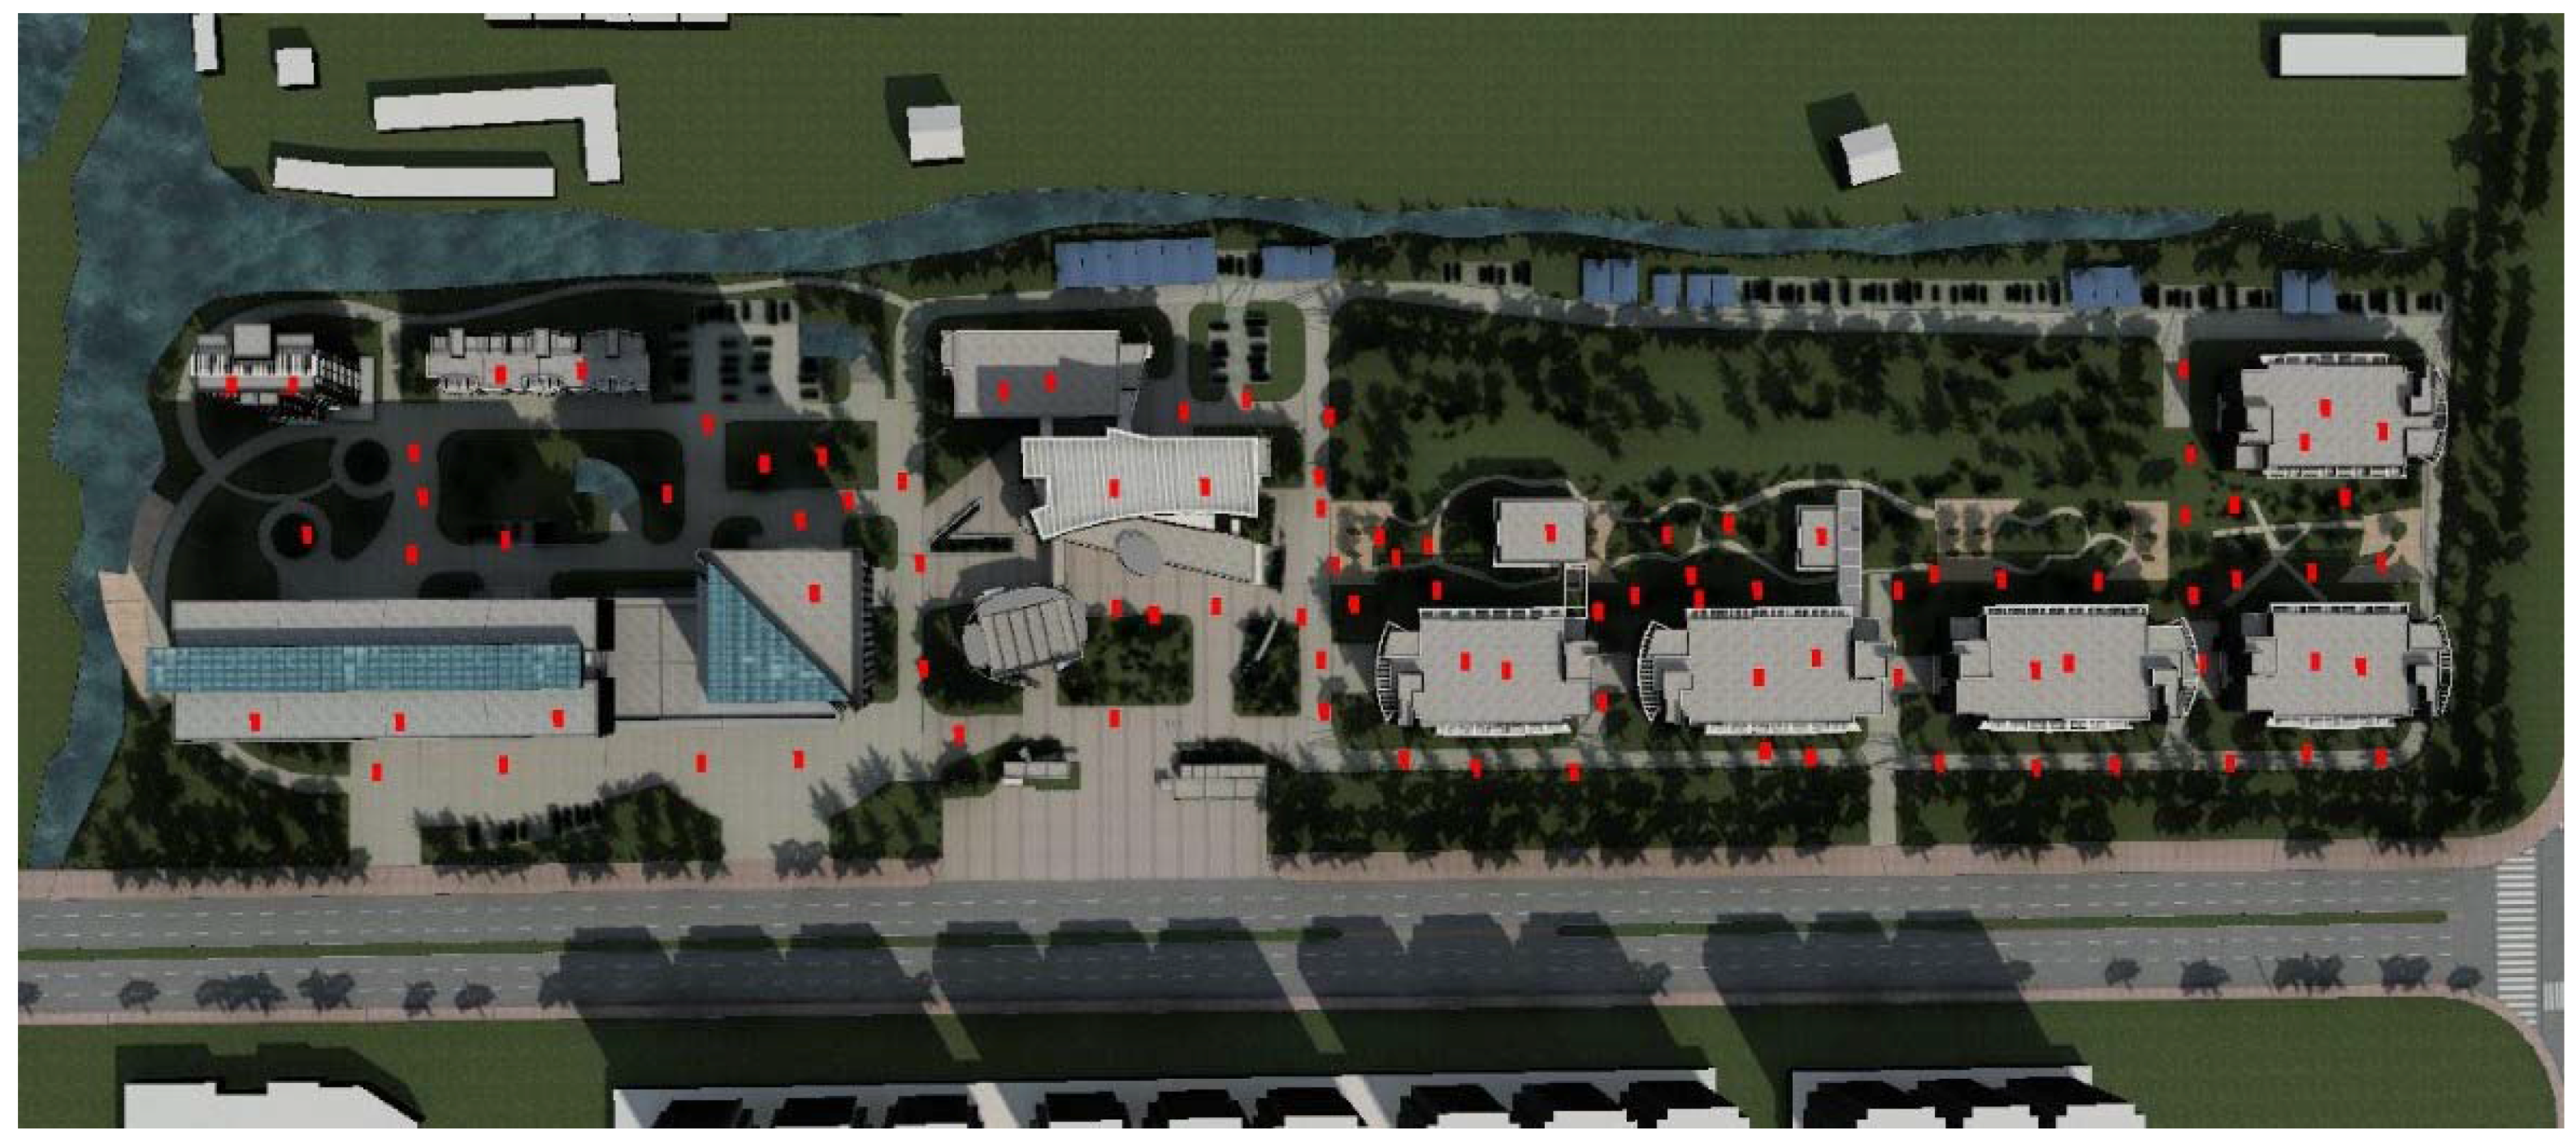
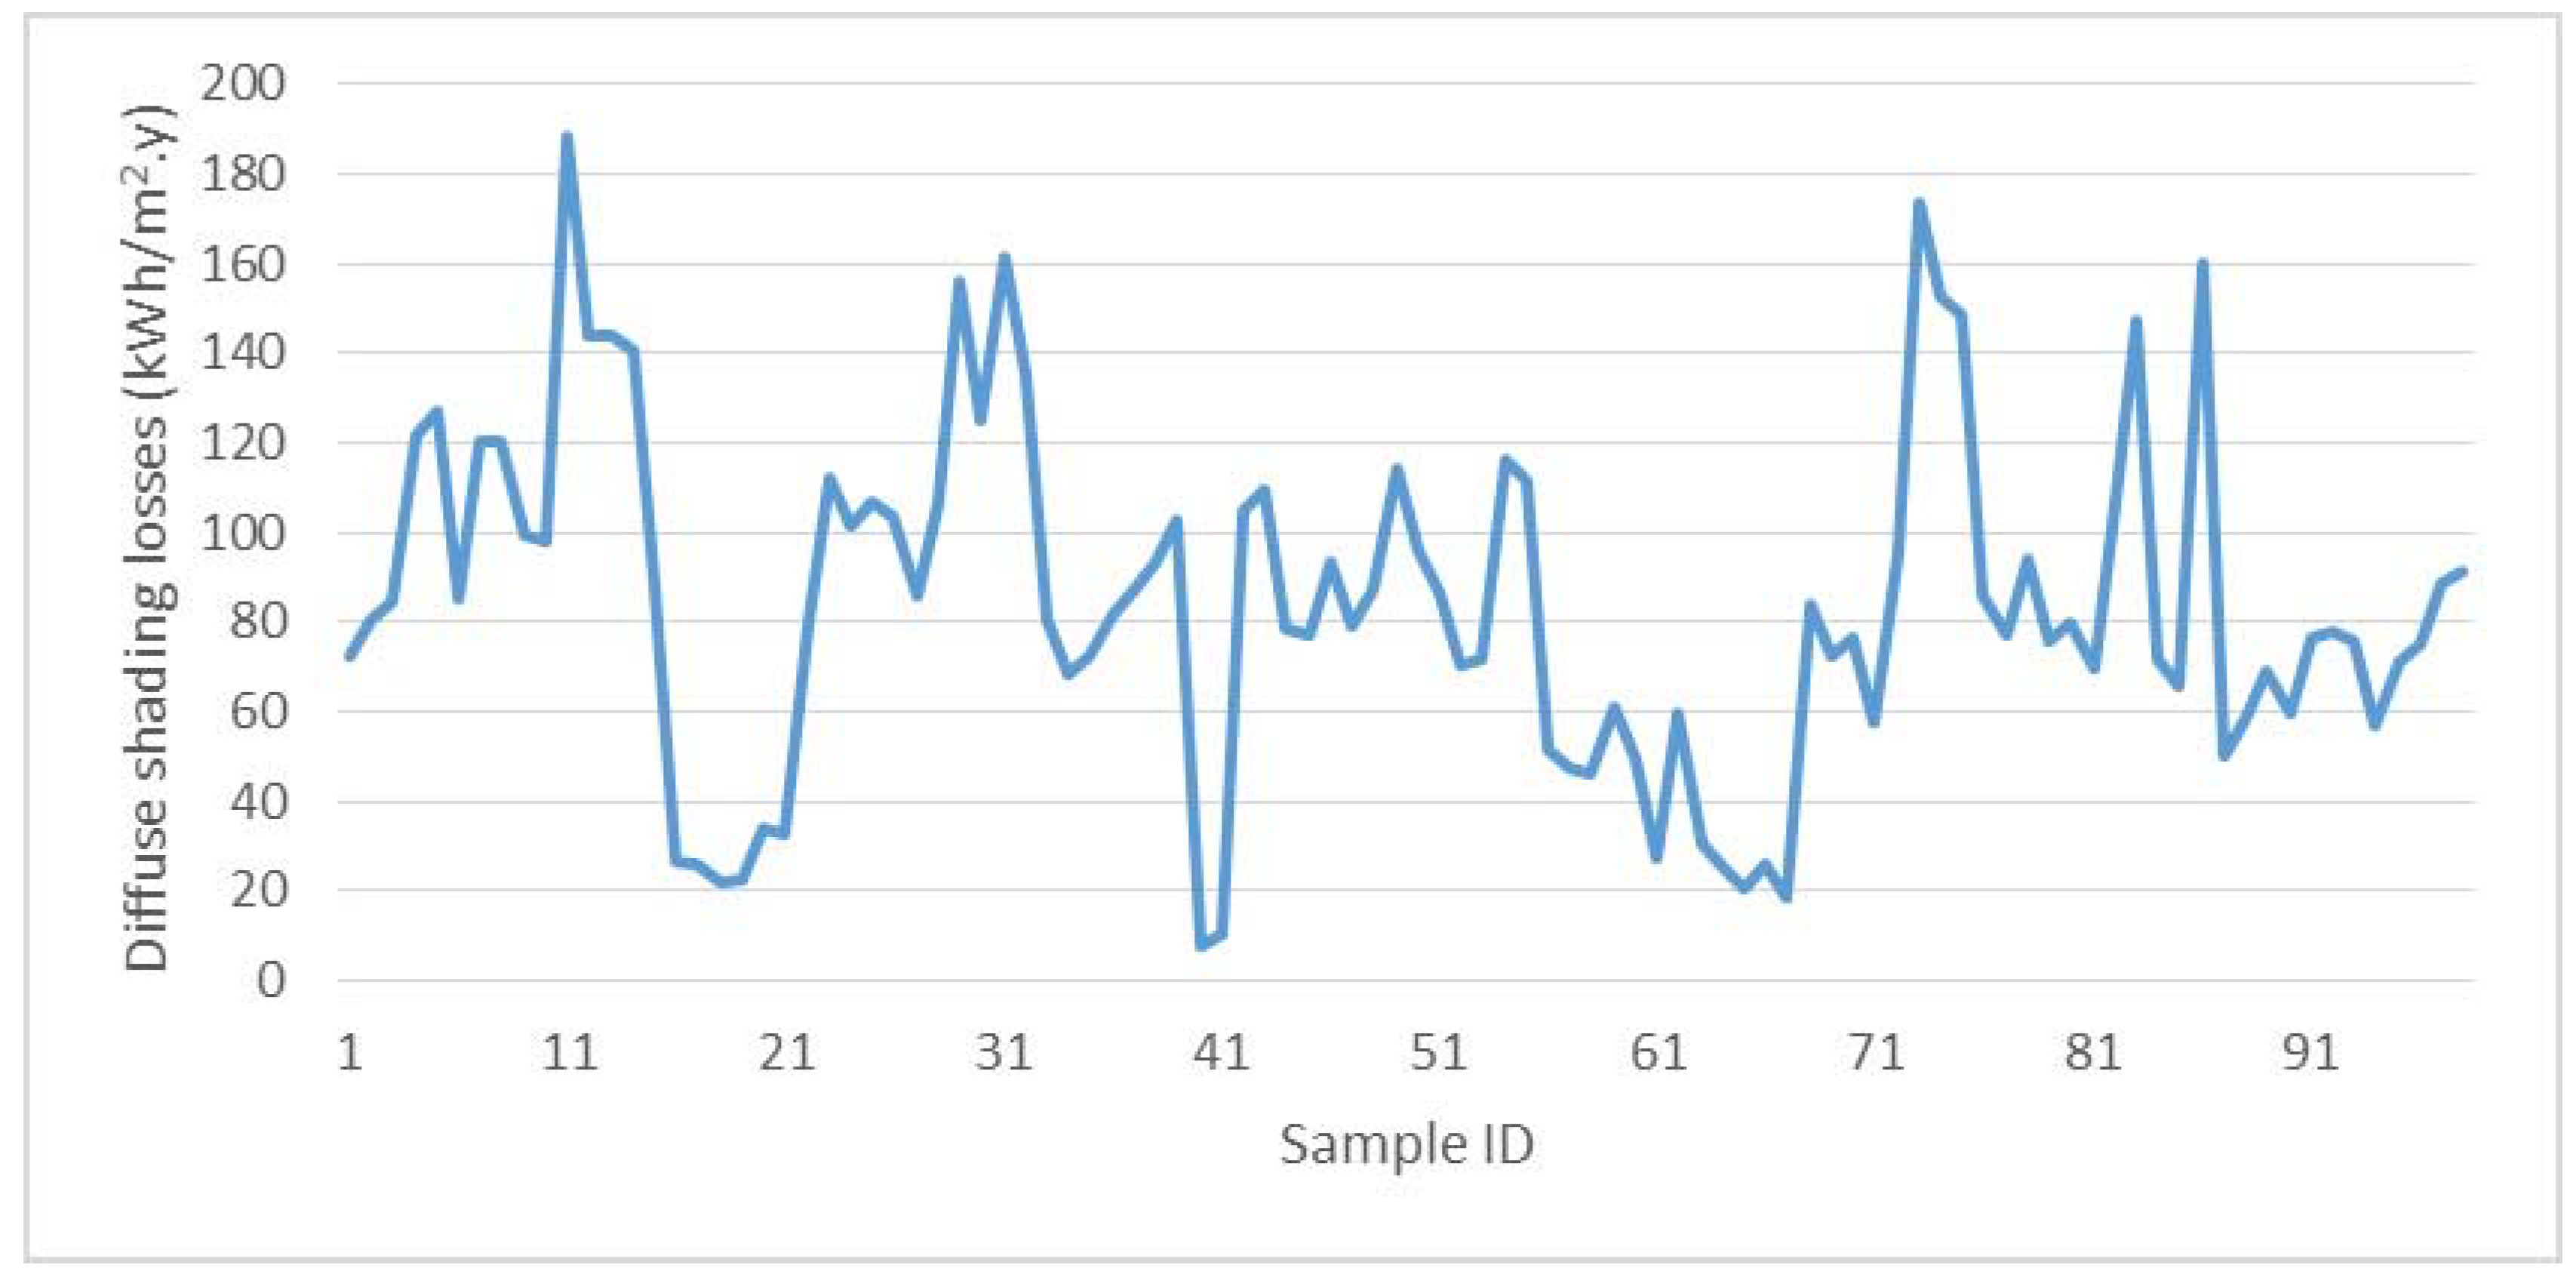
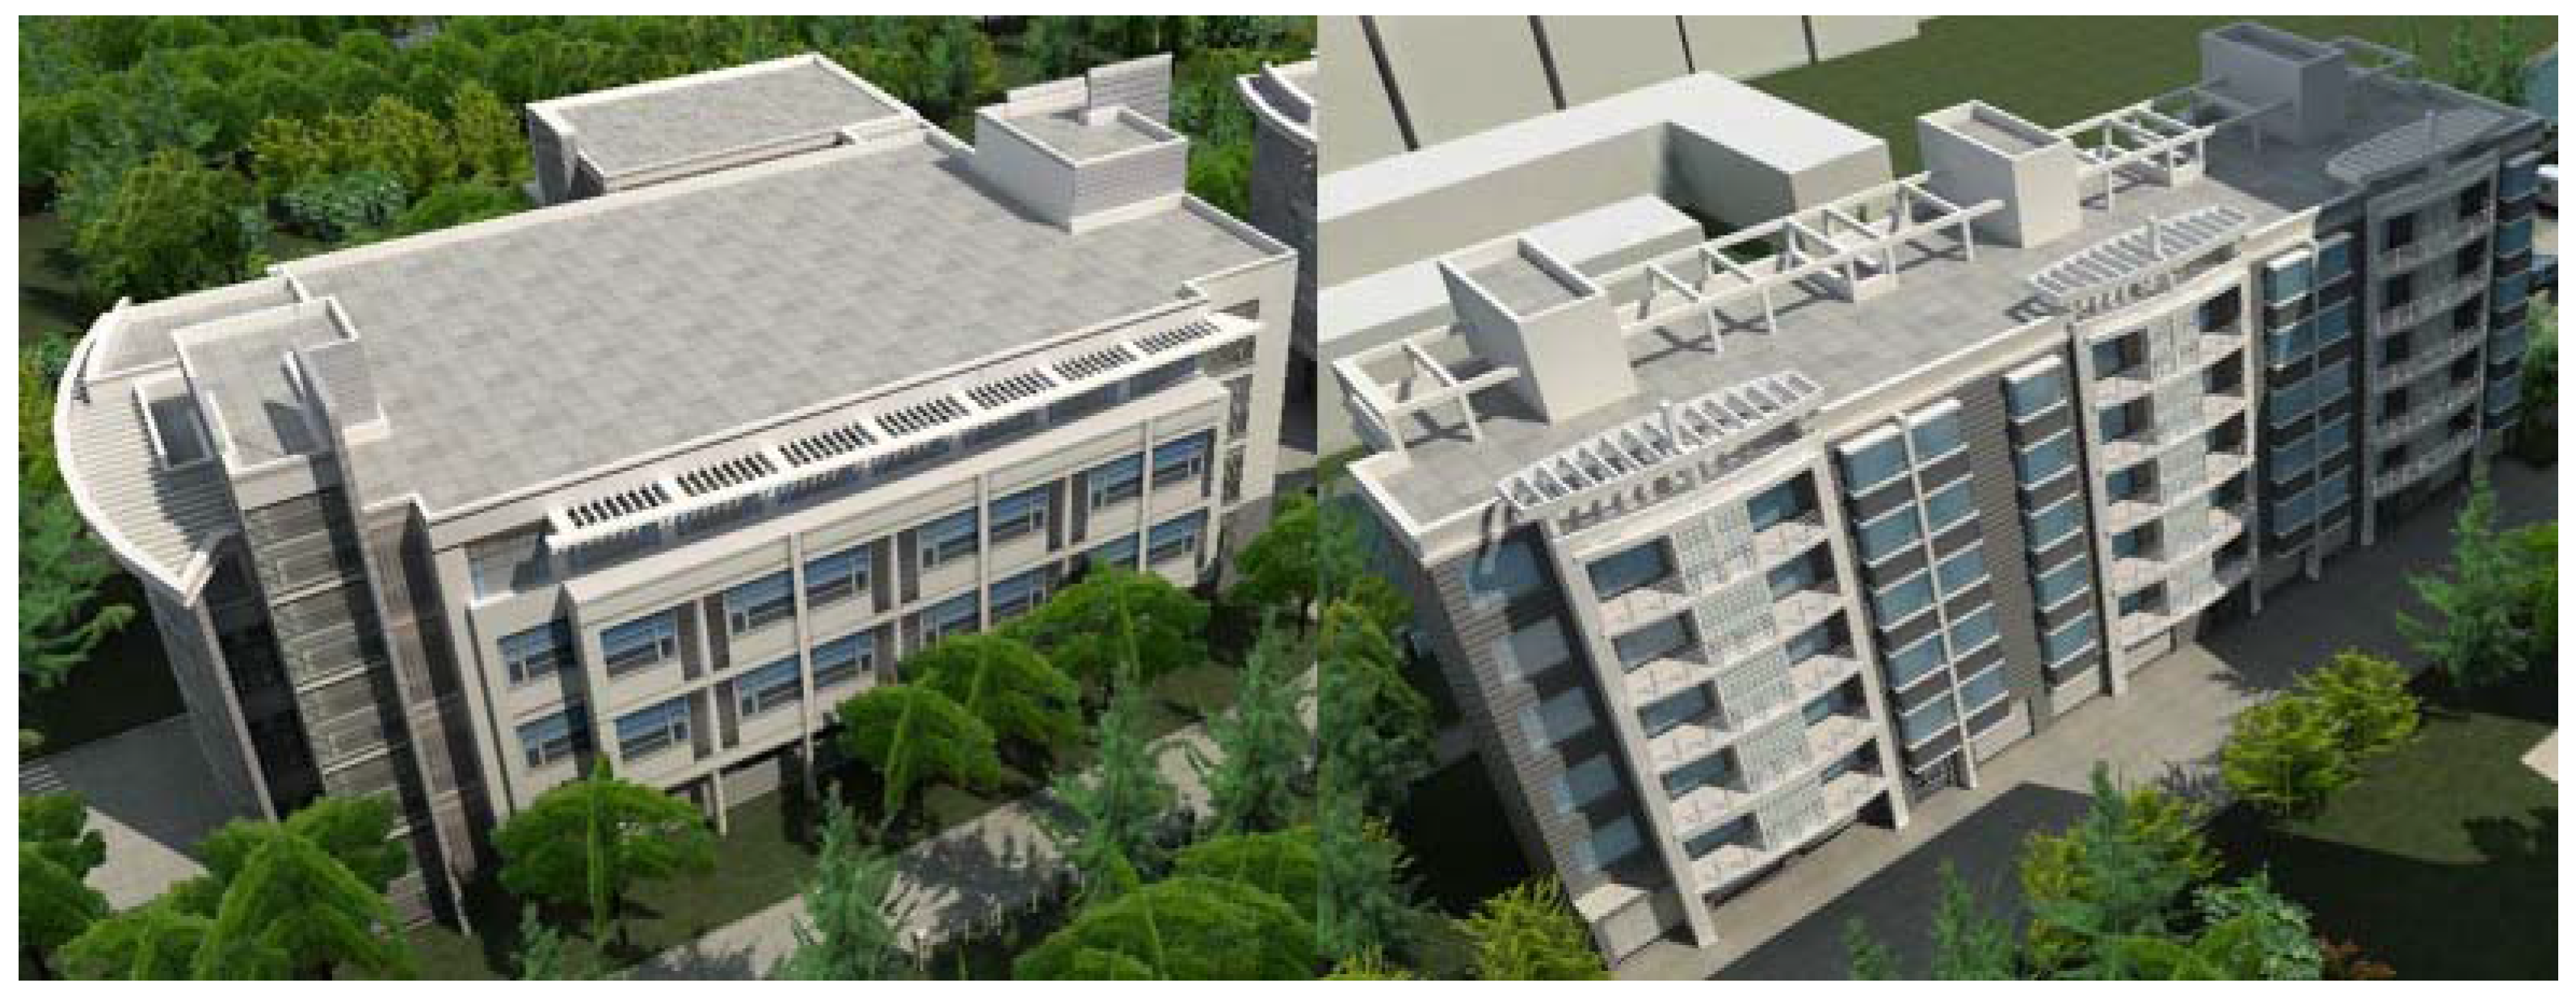
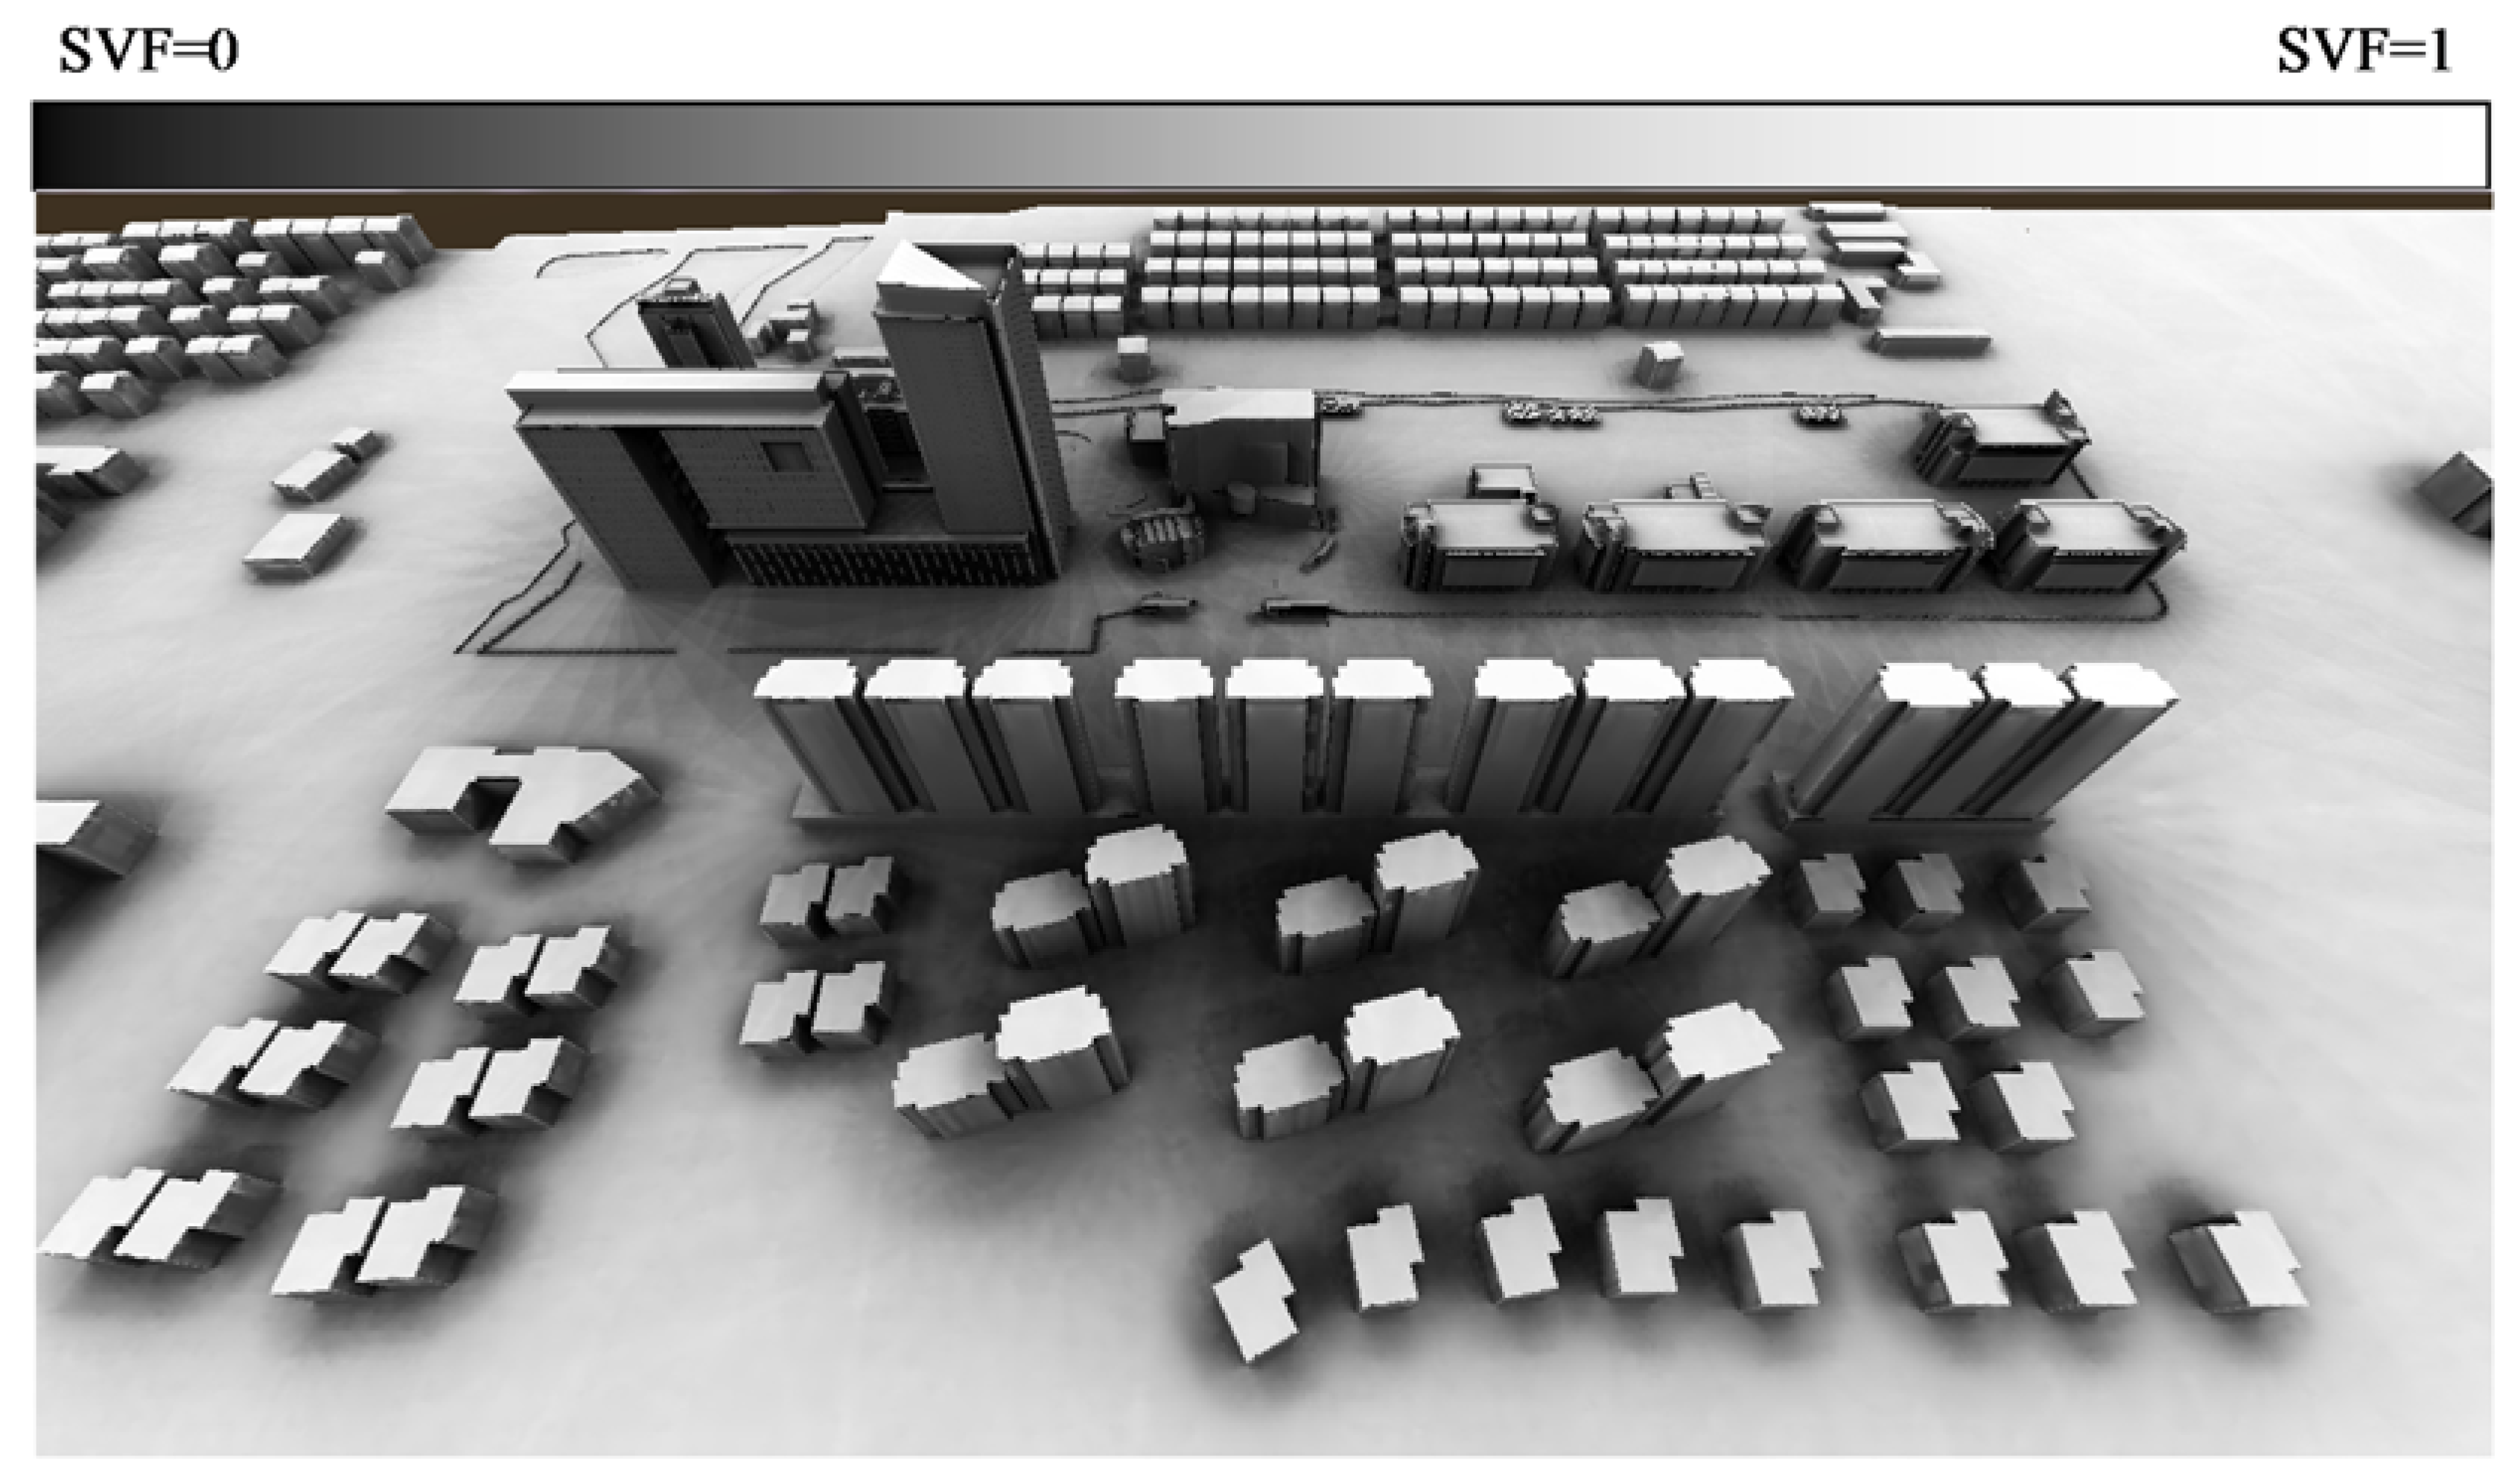
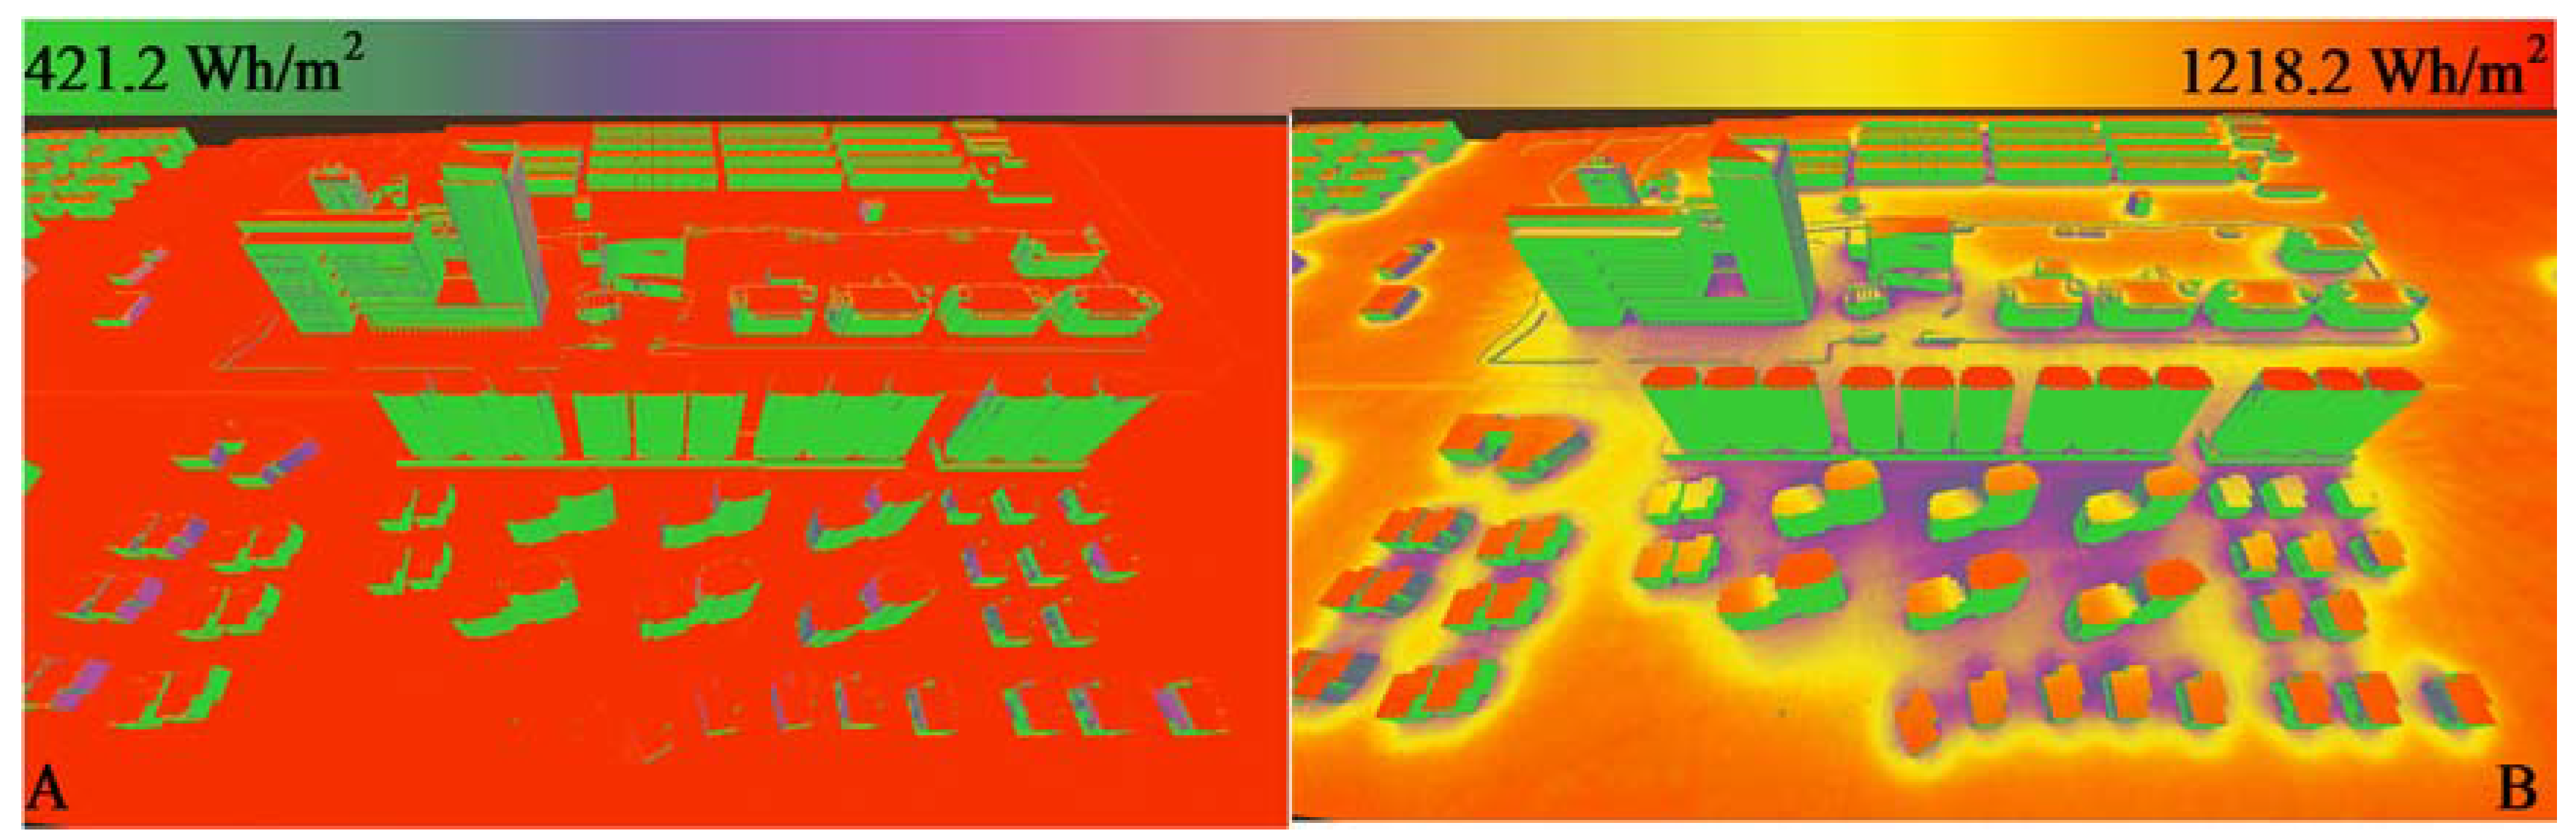
4.2. Potential Application to Urban Planning

Figure 11 shows a high-tech development neighborhood in the city of Jiashan in southern China. Around the center are ten established buildings hosting high-tech companies and related institutions. These buildings were finely modeled (Figure 12) based on architectural designs. Because of the rich geometric details, ray-tracing may consume the majority of the computation time using a triangle-based approach.
In the periphery, the whitish buildings are planned to be constructed in the near future. These buildings are relatively simple so that changes can be made to the architectural designs. For each voxel, an SVF was obtained by casting rays toward 32 × 16 (azimuth, zenith) sky directions (Figure 13). Clear sky radiation was computed for 23 July (Figure 14 and Figure 15) with a 0.5 m voxel resolution and a Linke turbidity factor of 3.0 to assess the daily clear sky solar radiation on all surfaces.
Based on Figure 13 and Figure 14B, it can be inferred that the buildings have a strong attenuation effect on the diffuse radiation of the surrounding ground, and taller buildings exhibit a larger radius of influence. The spatial distribution of diffuse irradiation was relatively uniform before applying the SVF (Figure 10A) because the amount of diffuse irradiation depends mainly on the tilt angle. Having been scaled down by the SVF (Figure 14B), it is obvious that sky obstruction significantly changed the diffuse irradiation patterns. Figure 15 shows the complicated irradiation patterns which are largely attributable to the combined effect of shading, surface tilt angle and orientation.
We collected 100 sample locations on roofs and the ground for further analysis (Figure 16). Annual total radiation at these locations were calculated using both SURFSUN3D and SVOSUN3D for comparison. The annual global radiation was obtained by integrating the daily global radiation over the 365 days of the year. The comparison (Figure 17) shows the total radiation estimates by SVOSUN3D closely match those by SURFSUN3D. Linear regression yielded an R-squared of 0.94. This implies SVOSUN3D can provide reasonably reliable solar radiation estimates. The minor discrepancies could have been caused by the difference in data representation. The voxel representation is essentially an approximation of the mesh representation, and thus it could lead to inaccuracies in geometric calculations. Annual diffuse radiation was calculated with and without accounting for the SVF at the same 100 locations to assess diffuse shading loesses. The difference between the diffuse radiation calculated with the SVF and that without the SVF is considered the diffuse shading losses. Figure 18 shows the diffuse shading losses typically range from 20–200 kWh/m2 annually. This implies diffuse shading losses can reduce the annual global radiation by up to 10% even under clear sky conditions.

5. Discussion and Conclusions

We have presented a new computing framework to assess the spatial distribution of solar radiation potential in urban environments using 3D city models. We have demonstrated that the proposed framework scales well with geometric complexity and can shorten the computing time required for shading calculation. Although the GRASS GIS r.sun model was specifically chosen to compute per-voxel clear sky irradiation, other solar radiation models can also leverage the presented high-performance computing framework to achieve efficient data representation and computation. The SVF is simply approximated by r.sun as a function of the slope angle without accounting for the shading effect of surrounding objects. To explicitly account for the diffuse shading losses, we presented a method to compute the SVF based on 3D urban models. We found that diffuse shading losses can reduce up to 10% of the annual global radiation. Hence, diffuse shading losses are of significant importance especially in complex urban environments.
The proposed approach is subject to a number of limitations. The biggest challenge is how to efficiently voxelize a massive 3D city model into an ESVO. The built-in voxelization pipeline can efficiently transform a small amount of 3D models into an ESVO, however, it is memory inefficient and the memory usage increases proportionally with the scene size. This means more memory efficient voxelization approaches [24,25] are needed to accommodate massive 3D city models. Management of ESVO data can also be challenging, because a 3D city model will lose its spatial relations and semantics after being voxelized. The ESVO data model needs to be adapted to meet spatial data management needs. Assuming an isotropic sky, it is unclear how much the diffuse radiation of r.sun may improve using the derived SVF; this should be quantitatively ascertained in the future. If an anisotropic sky-based model, such as SORAM, is integrated into our computing framework, potential improvement of modeling accuracy may be expected at the urban scale. However, benchmark experiments under clear sky conditions are needed to quantitatively compare an isotropic sky-based model against an anisotropic sky-based model. Compared to traditional 2D solar radiation models, the recent 3D solar radiation models can not only better capture the shading from trees and surrounding buildings, but also accommodate calculation and visualization on building facades. However, 3D solar radiation models requires much more computational resources and computing time. In the meantime, 2D solar radiation models have been well-adapted to support most routine tasks including urban rooftop solar potential assessment. Users should carefully weigh the costs and benefits before deciding to use a 3D solar radiation model. Additionally, future work will be needed to fully understand the modeling accuracy and uncertainties before the proposed method can be put into engineering practice.

Acknowledgments

This research was supported by the National Natural Science Foundation of China (41371387) and the Science and Technology Program of Guangzhou (201604020117) (UAU-based high-resolution estimation method for urban building carbon emissions).

Author Contributions

Jianming Liang and Jianhua Gong conceived and designed the methods; Jianming Liang implemented the method; all the authors reviewed and edited the manuscript.

Conflicts of Interest

The authors declare no conflict of interest.

References

  1. Fong, K.F.; Lee, C.K. Towards net zero energy design for low-rise residential buildings in subtropical Hong Kong. Appl. Energy 2012, 93, 686–694. [Google Scholar] [CrossRef]
  2. Hachem, C.; Athienitis, A.; Fazio, P. Energy performance enhancement in multistory residential buildings. Appl. Energy 2014, 116, 9–19. [Google Scholar] [CrossRef]
  3. Fu, P.; Rich, P. The Solar Analyst 1.0 User Manual; Helios Environmental Modeling Institute: Lawrence, KS, USA, 2000. [Google Scholar]
  4. Hofierka, J.; Suri, M.; Šúri, M. The solar radiation model for Open source GIS: Implementation and applications. In Proceedings of the Open Source GIS-GRASS Users Conference, Trento, Italy, 11–13 September 2002; pp. 11–13. [Google Scholar]
  5. Kryza, M.; Szymanowski, M.; Migała, K.; Pietras, M. Spatial information on total solar radiation: Application and evaluation of the r.sun model for the Wedel Jarlsberg Land, Svalbard. Pol. Polar Res. 2010, 31, 17–32. [Google Scholar] [CrossRef]
  6. Nguyen, H.T.; Pearce, J.M. Estimating potential photovoltaic yield with r.sun and the open source geographical resources analysis support system. Sol. Energy 2010, 84, 831–843. [Google Scholar] [CrossRef]
  7. Agugiaro, G.; Remondino, F.; Stevanato, G.; De Filippi, R.; Furlanello, C. Estimation of solar radiation on building roofs in mountainous areas. ISPRS Int. Arch. Photogramm. Remote Sens. Spat. Inf. Sci. 2011, 38, 155–160. [Google Scholar] [CrossRef]
  8. Brito, M.C.; Gomes, N.; Santos, T.; Tenedório, J.A. Photovoltaic potential in a Lisbon suburb using LiDAR data. Sol. Energy 2012, 86, 283–288. [Google Scholar] [CrossRef]
  9. Lukač, N.; Žalik, B. GPU-based roofs’ solar potential estimation using LiDAR data. Comput. Geosci. 2013, 52, 34–41. [Google Scholar] [CrossRef]
  10. Redweik, P.; Catita, C.; Brito, M.C. 3D local scale solar radiation model based on urban LIDAR data. ISPRS Int. Arch. Photogramm. Remote Sens. Spat. Inf. Sci. 2011, 38, 265–270. [Google Scholar] [CrossRef]
  11. Carneiro, C.M. Extraction of Urban Environmental Quality Indicators using LIDAR-Based Digital Surface Models. Ph.D. Thesis, École Polytechnique Fédérale de Lausanne, Lausanne, Switzerland, June 2011. [Google Scholar]
  12. Erdélyi, R.; Wang, Y.; Guo, W.; Hanna, E.; Colantuono, G. Three-dimensional SOlar RAdiation Model (SORAM) and its application to 3-D urban planning. Sol. Energy 2014, 101, 63–73. [Google Scholar] [CrossRef]
  13. Perez, R.; Ineichen, P.; Seals, R.; Michalsky, J.; Stewart, R. Modeling daylight availability and irradiance components from direct and global irradiance. Sol. Energy 1990, 44, 271–289. [Google Scholar] [CrossRef]
  14. Tooke, T.R.; Coops, N.C.; Christen, A. A point obstruction stacking (POSt) approach to wall irradiance modeling across urban environments. Build. Environ. 2013, 60, 234–242. [Google Scholar] [CrossRef]
  15. Liang, J.; Gong, J.; Li, W.; Ibrahim, A.N. A visualization-oriented 3D method for efficient computation of urban solar radiation based on 3D-2D surface mapping. Int. J. Geogr. Inf. Sci. 2014, 28, 780–798. [Google Scholar] [CrossRef]
  16. Hofierka, J.; Zlocha, M. A new 3-D solar radiation model for 3-D city models. Trans. GIS 2012, 16, 681–690. [Google Scholar] [CrossRef]
  17. Laine, S.; Karras, T. Efficient sparse voxel octrees. IEEE Trans. Vis. Comput. Graph. 2011, 17, 1048–1059. [Google Scholar] [CrossRef] [PubMed]
  18. Benson, D.; Davis, J. Octree textures. ACM Trans. Graph. 2002, 21, 785–790. [Google Scholar] [CrossRef]
  19. Liu, M.; Bárdossy, A.; Li, J.; Jiang, Y. GIS-based modelling of topography-induced solar radiation variability in complex terrain for data sparse region. Int. J. Geogr. Inf. Sci. 2012, 26, 1281–1308. [Google Scholar] [CrossRef]
  20. Rigollier, C.; Bauer, O.; Wald, L. On the clear sky model of the ESRA—European Solar Radiation Atlas—With respect to the heliosat method. Sol. Energy 2000, 68, 33–48. [Google Scholar] [CrossRef]
  21. Kumar, L.; Skidmore, A.K.; Knowles, E. Modelling topographic variation in solar radiation in a GIS environment. Int. J. Geogr. Inf. Sci. 1997, 11, 475–497. [Google Scholar] [CrossRef]
  22. Truong-Hong, L.; Laefer, D.F. Octree-based, automatic building facade generation from LiDAR data. CAD Comput. Aided Des. 2014, 53, 46–61. [Google Scholar] [CrossRef]
  23. Holub, P.; Šrom, M.; Pulec, M.; Matela, J.; Jirman, M. GPU-accelerated DXT and JPEG compression schemes for low-latency network transmissions of HD, 2K, and 4K video. Future Gener. Comput. Syst. 2013, 29, 1991–2006. [Google Scholar] [CrossRef]
  24. Pätzold, M.; Kolb, A. Grid-free out-of-core voxelization to sparse voxel octrees on GPU. In Proceedings of the 7th Conference on High-Performance Graphics (HPG’ 15), Los Angeles, CA, USA, 7–9 August 2015. [Google Scholar]
  25. Baert, J.; Lagae, A.; Dutré, P. Out-of-core construction of sparse voxel octrees. Comput. Graph. Forum 2014, 33, 220–227. [Google Scholar] [CrossRef]
Figure 1. Approximation of the sky view factor (SVF) at P in the r.sun model.
Ijgi 06 00106 g001
Figure 2. Illustration of the SVF and obstructing features at P.
Ijgi 06 00106 g002
Figure 3. Illustration of the structure and construction of a sparse voxel octree (reprinted from Truong-Hong and Laefer [22] with permission from Elsevier).
Ijgi 06 00106 g003
Figure 4. Illustration of the efficient sparse voxel octrees (ESVO) data structure (voxel data and topological descriptors).
Ijgi 06 00106 g004
Figure 5. Subdivision of ESVO nodes on each level for storage on disk.
Ijgi 06 00106 g005
Figure 6. Proposed framework for SVO-based 3D solar radiation modeling.
Ijgi 06 00106 g006
Figure 7. Comparison of the triangular mesh representation and SVO representation at various depths.
Ijgi 06 00106 g007
Figure 8. Level of details of a CityGML building model.
Ijgi 06 00106 g008
Figure 9. Overall computation efficiency for surface mapping-based 3D solar radiation modeling method (SURFSUN3D) and present model (SVOSUN3D).
Ijgi 06 00106 g009
Figure 10. Ray-casting efficiency for SURFSUN3D and SVOSUN3D.
Ijgi 06 00106 g010
Figure 11. Layout of the Jiashan high-tech park.
Ijgi 06 00106 g011
Figure 12. Two highly detailed 3D building models in the high-tech park.
Ijgi 06 00106 g012
Figure 13. Spatial distribution of SVF over the high-tech park.
Ijgi 06 00106 g013
Figure 14. Spatial distribution of diffuse irradiation before (A) and after (B) SVF scaling.
Ijgi 06 00106 g014
Figure 15. Daily clear sky global irradiation for 23 July.
Ijgi 06 00106 g015
Figure 16. Sample locations used for comparison of annual global radiation with SURFSUN3D.
Ijgi 06 00106 g016
Figure 17. Comparison of annual global radiation with SURFSUN3D at the sample locations.
Ijgi 06 00106 g017
Figure 18. Diffuse shading losses assessed at the sample locations.
Ijgi 06 00106 g018

