Mapping Lithologic Components of Ophiolitic Mélanges Based on ASTER Spectral Analysis: A Case Study from the Bangong-Nujiang Suture Zone (Tibet, China)


Abstract
:1. Introduction
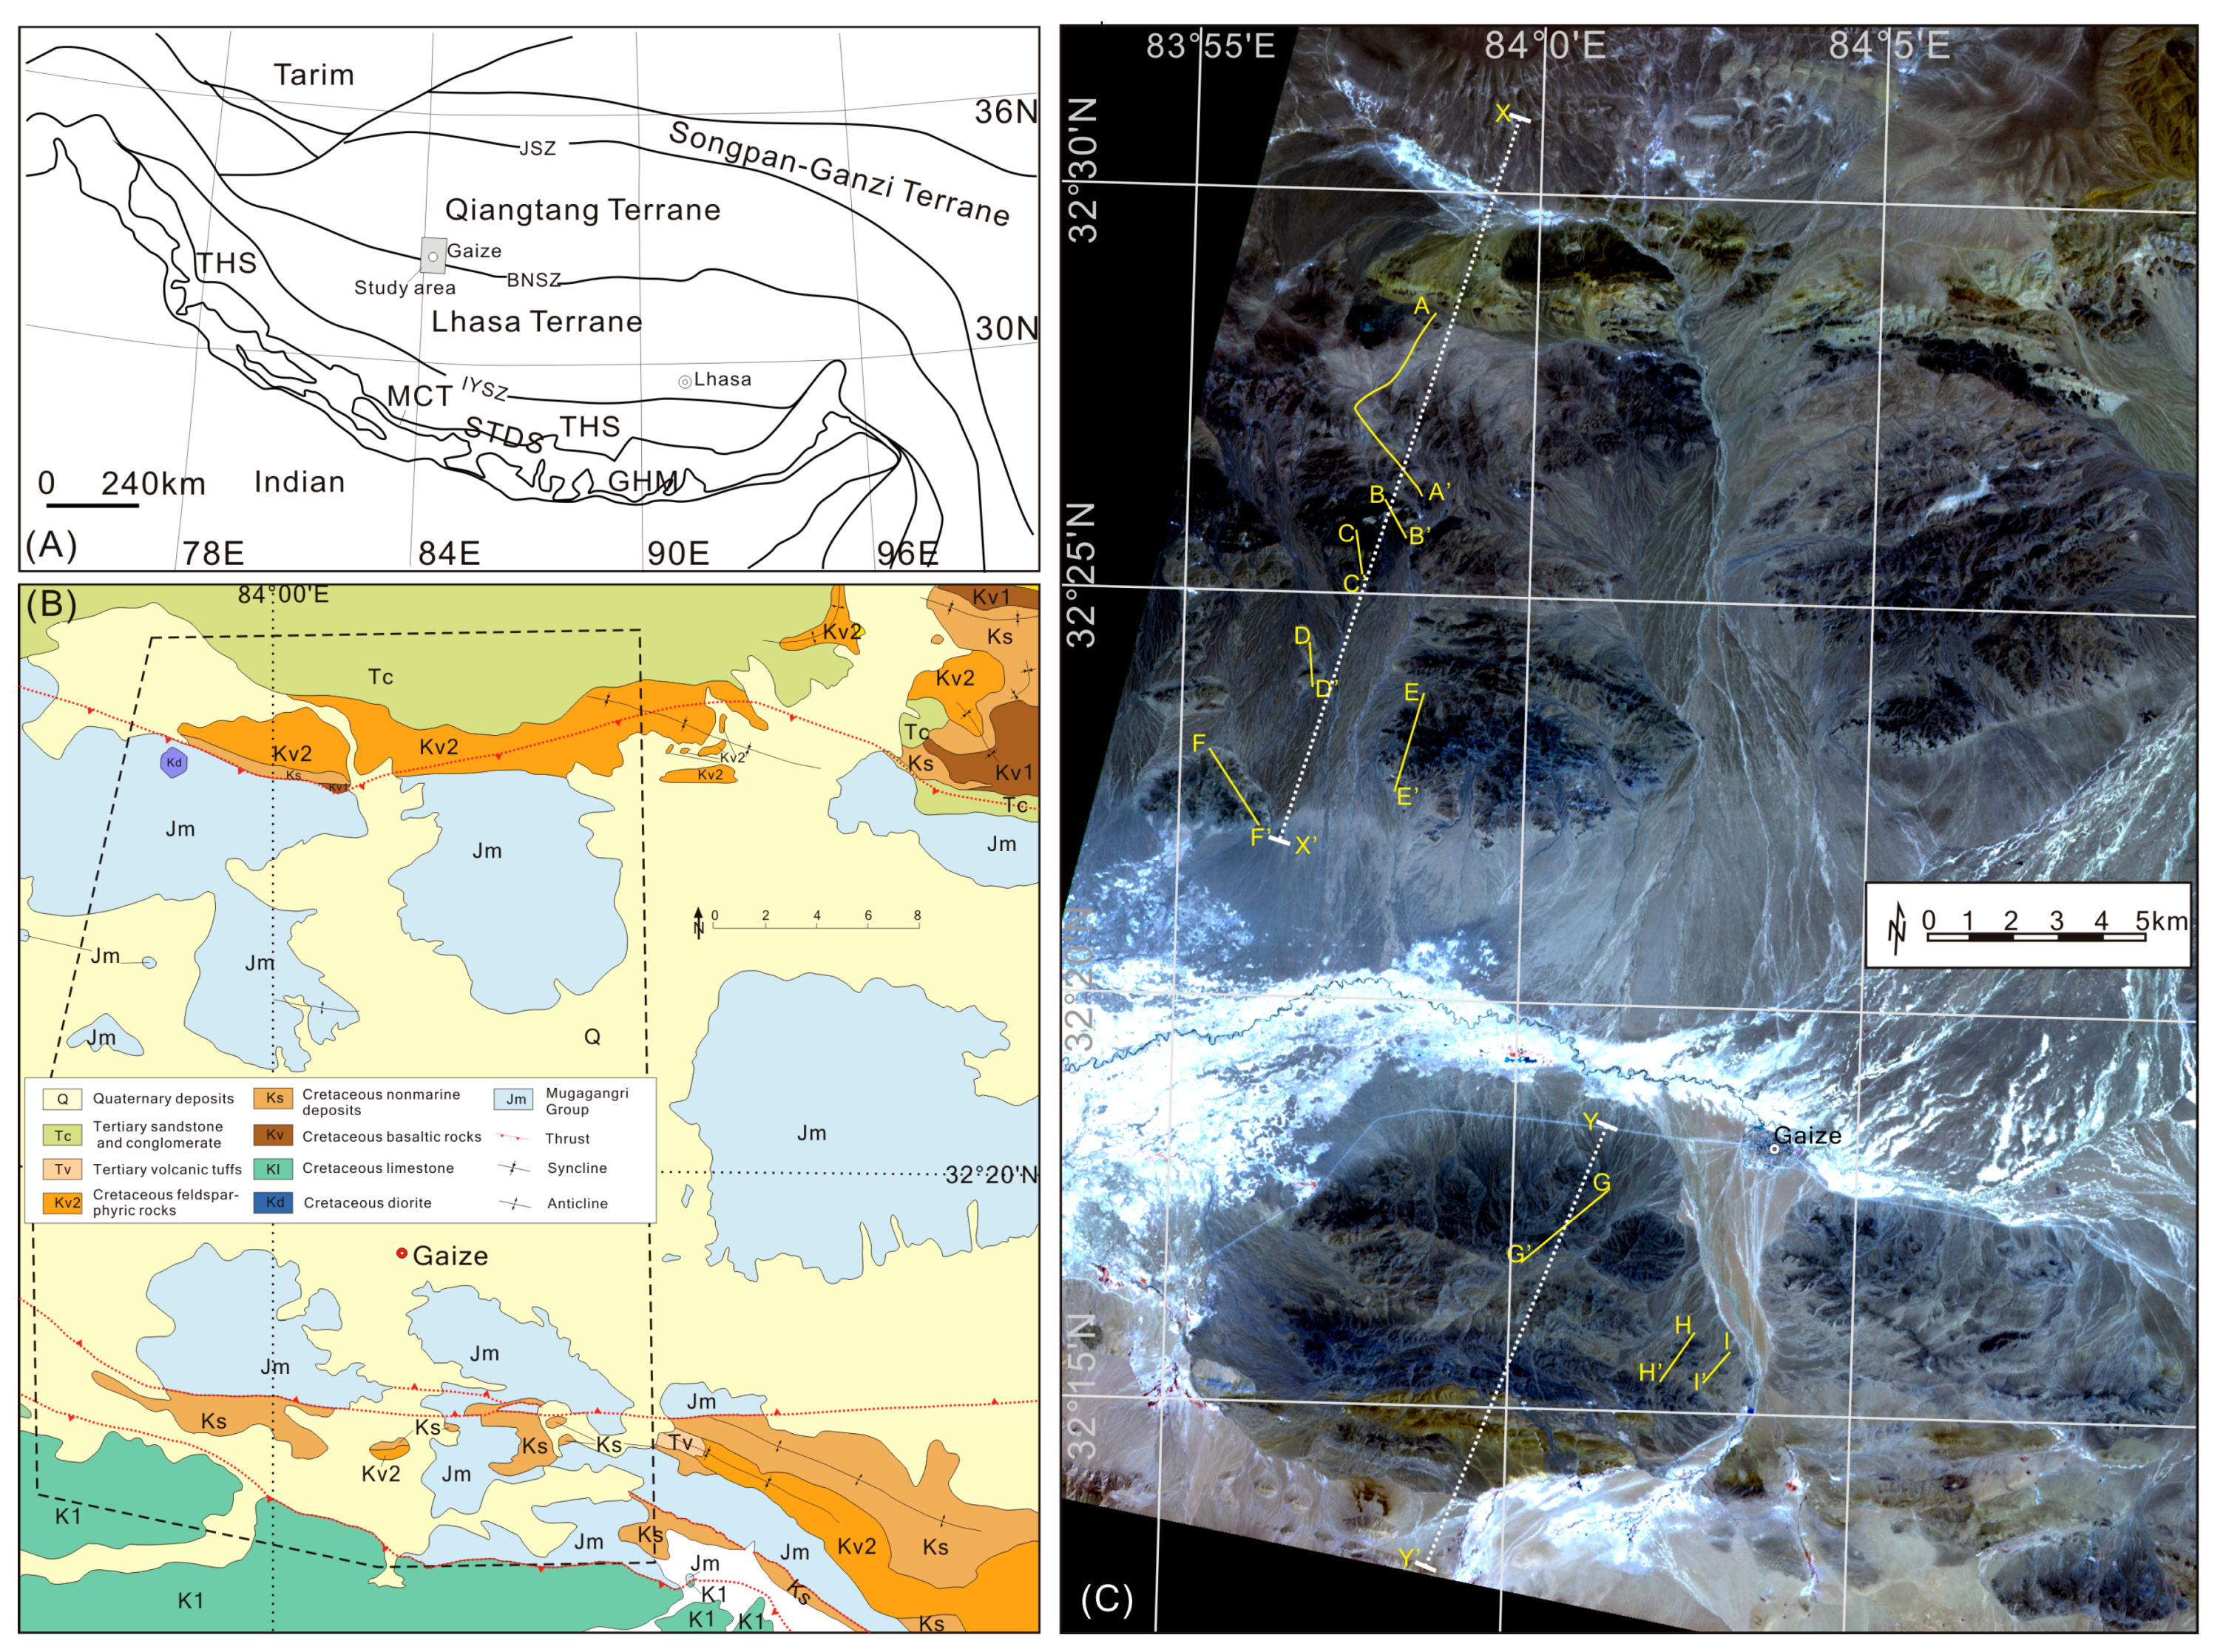
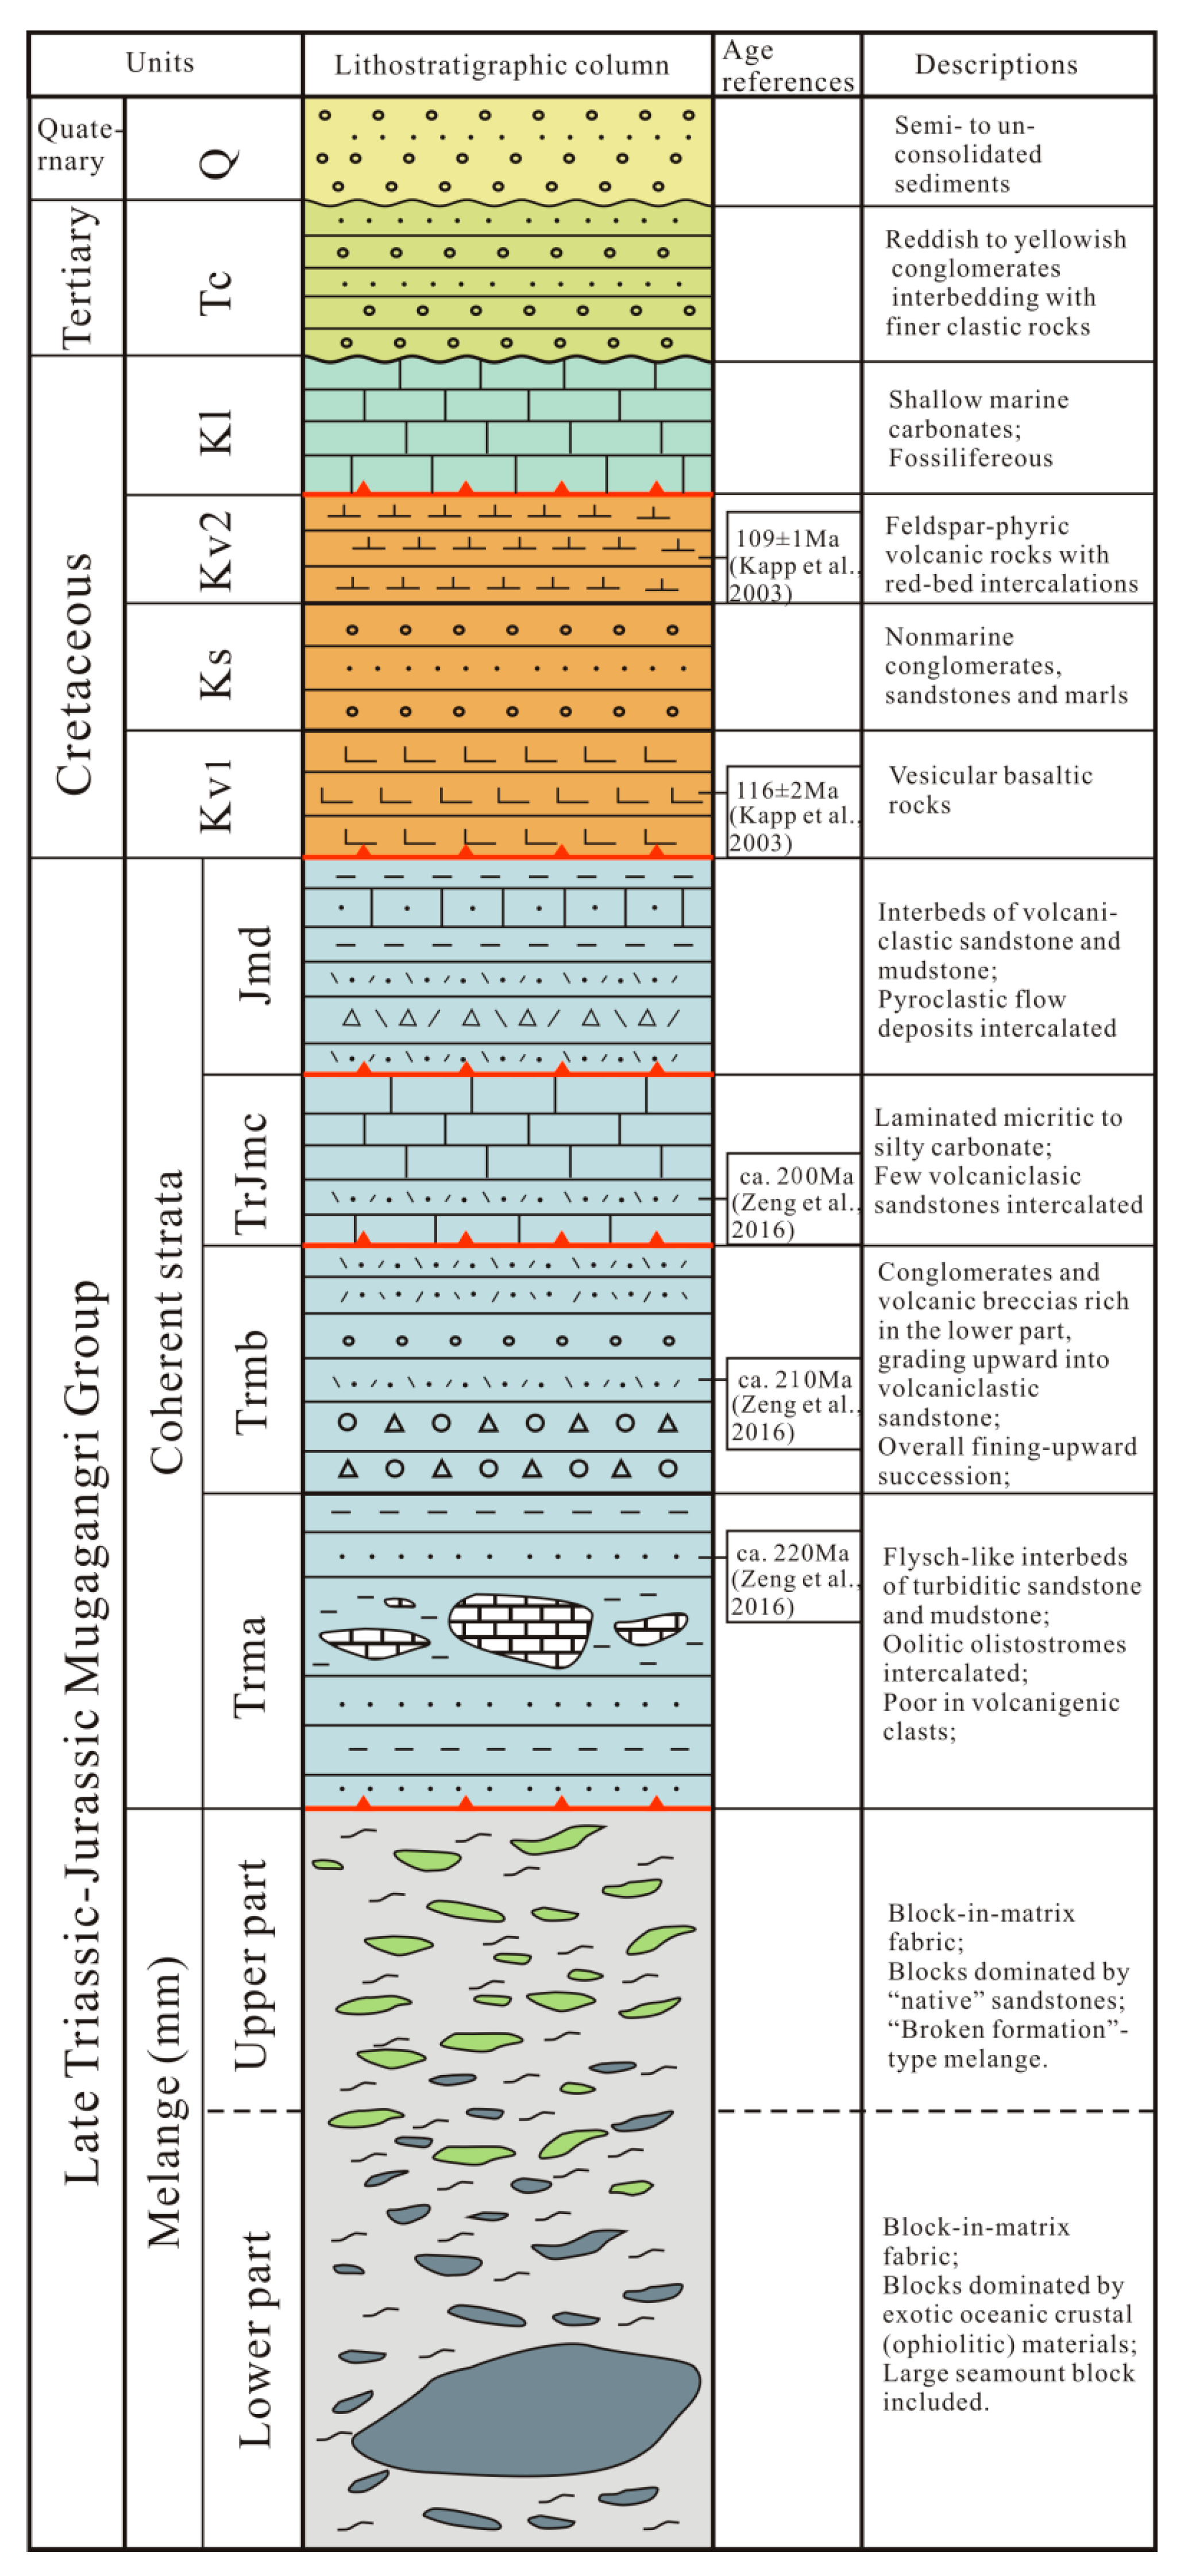
2. Geologic Background
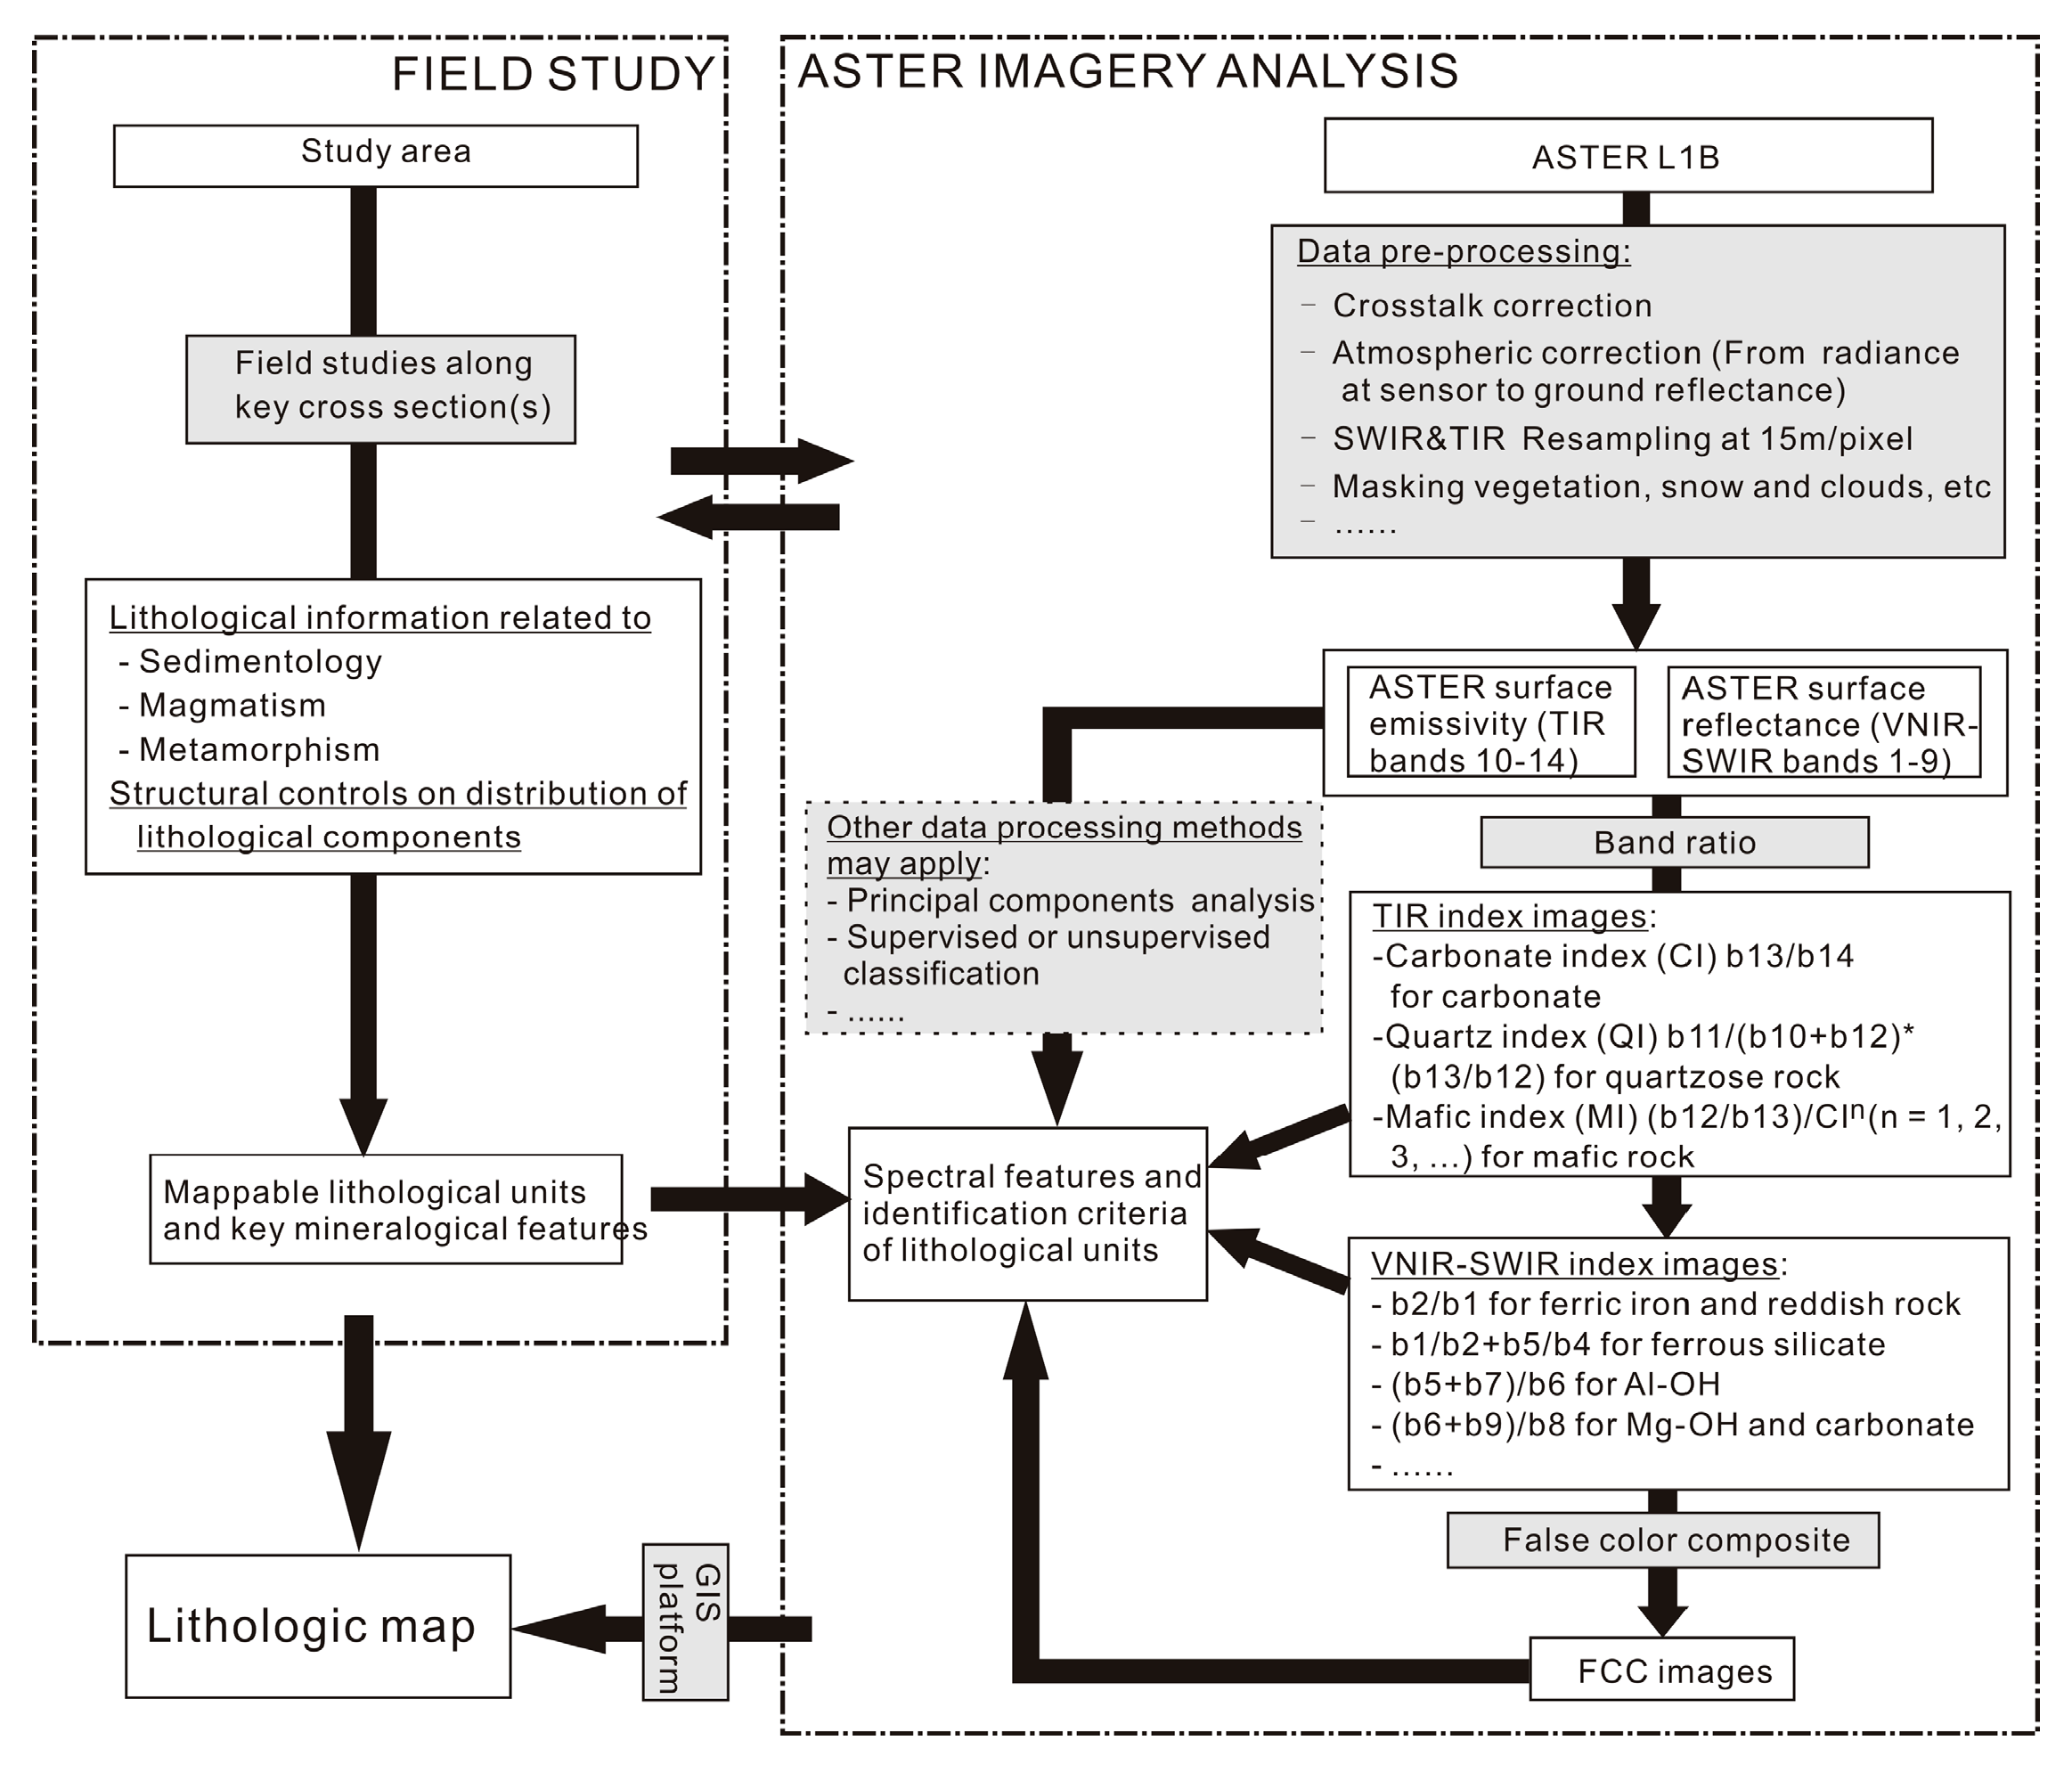
3. Materials and Methods
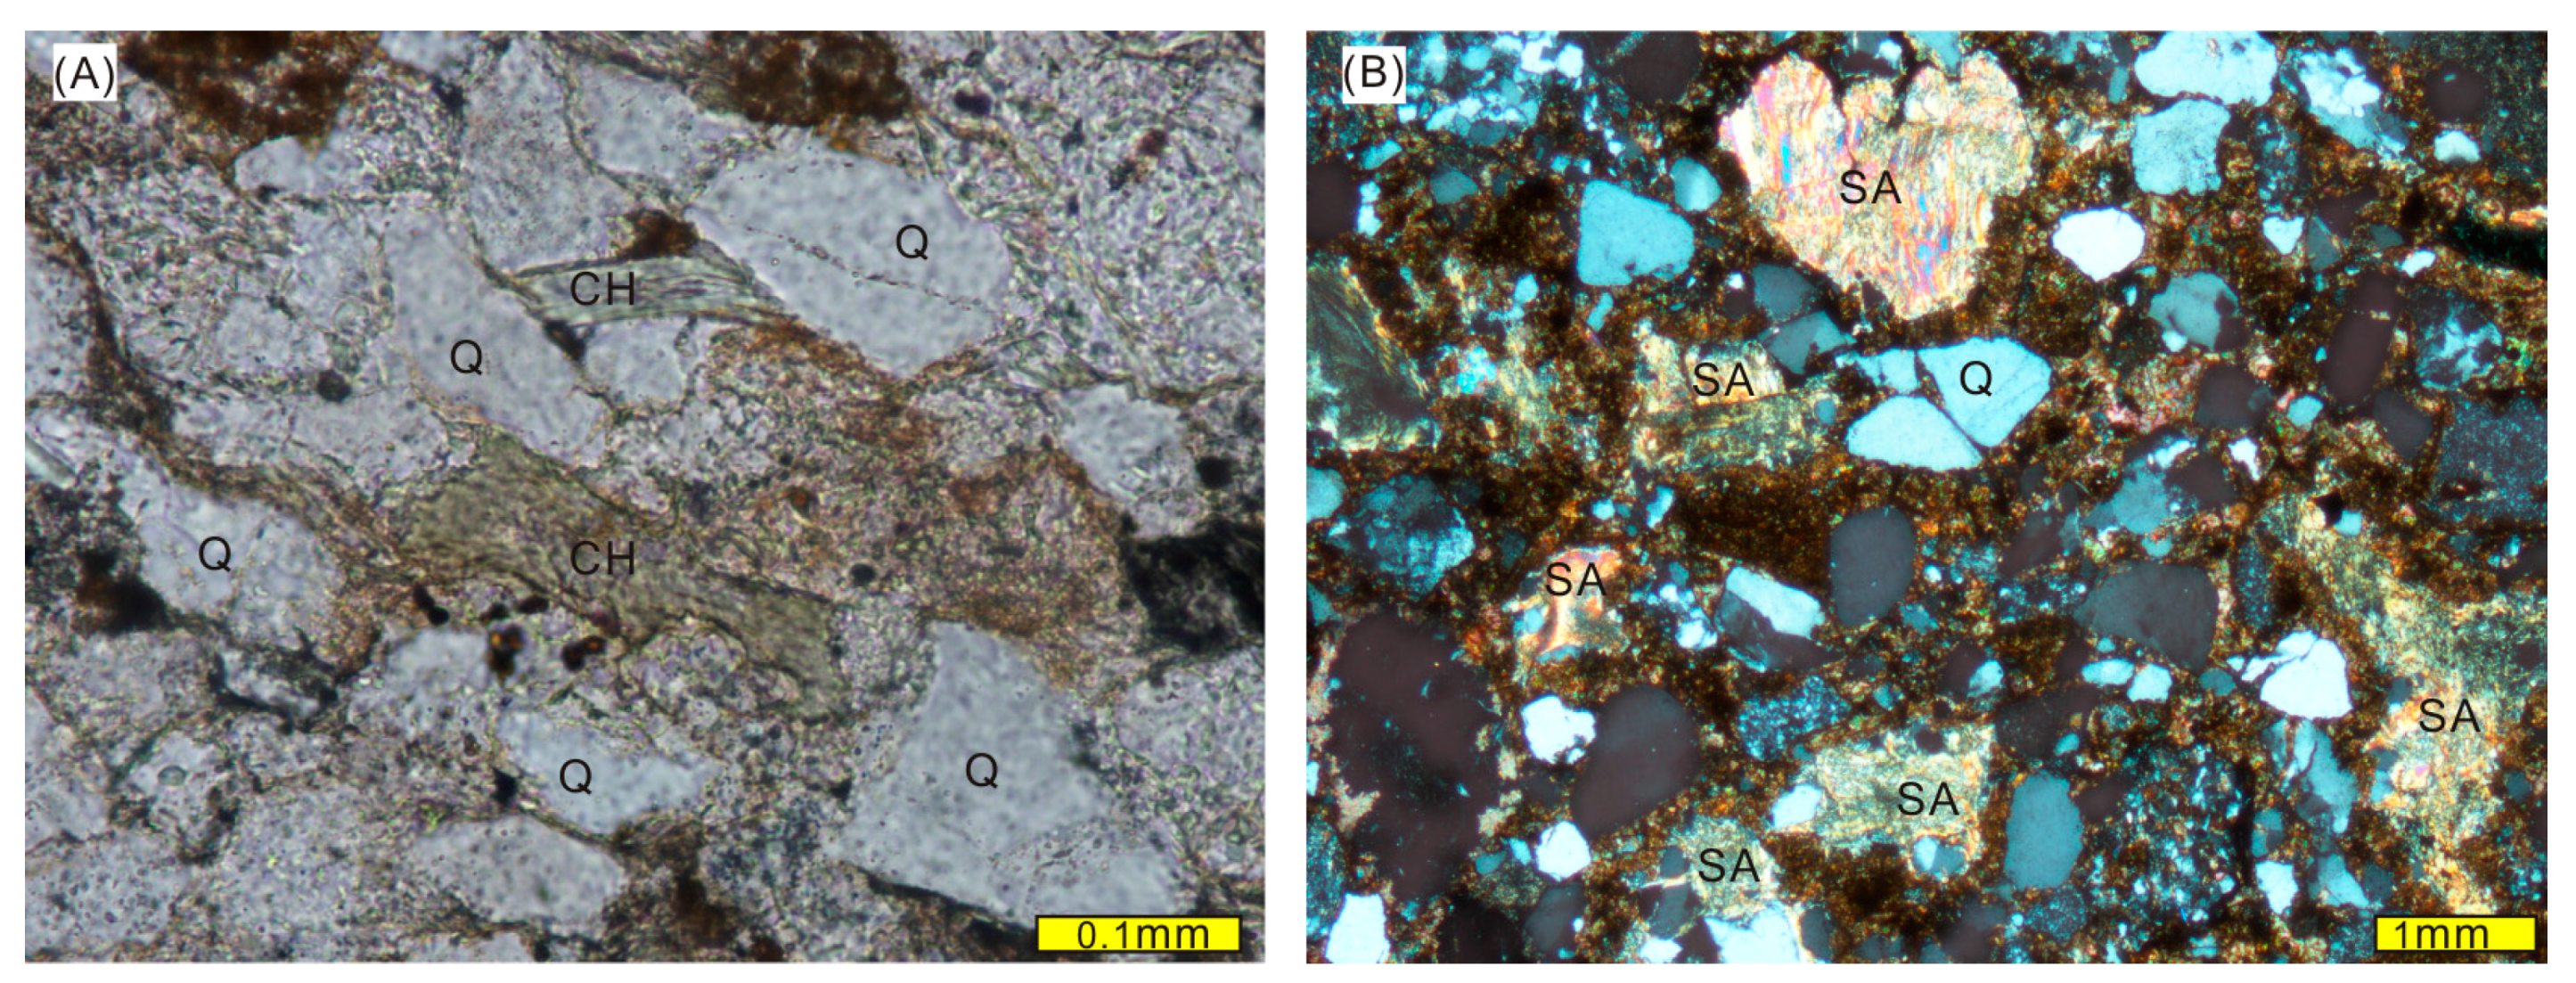
3.1. Field Data Collecting
3.2. ASTER Data Pre-Processing
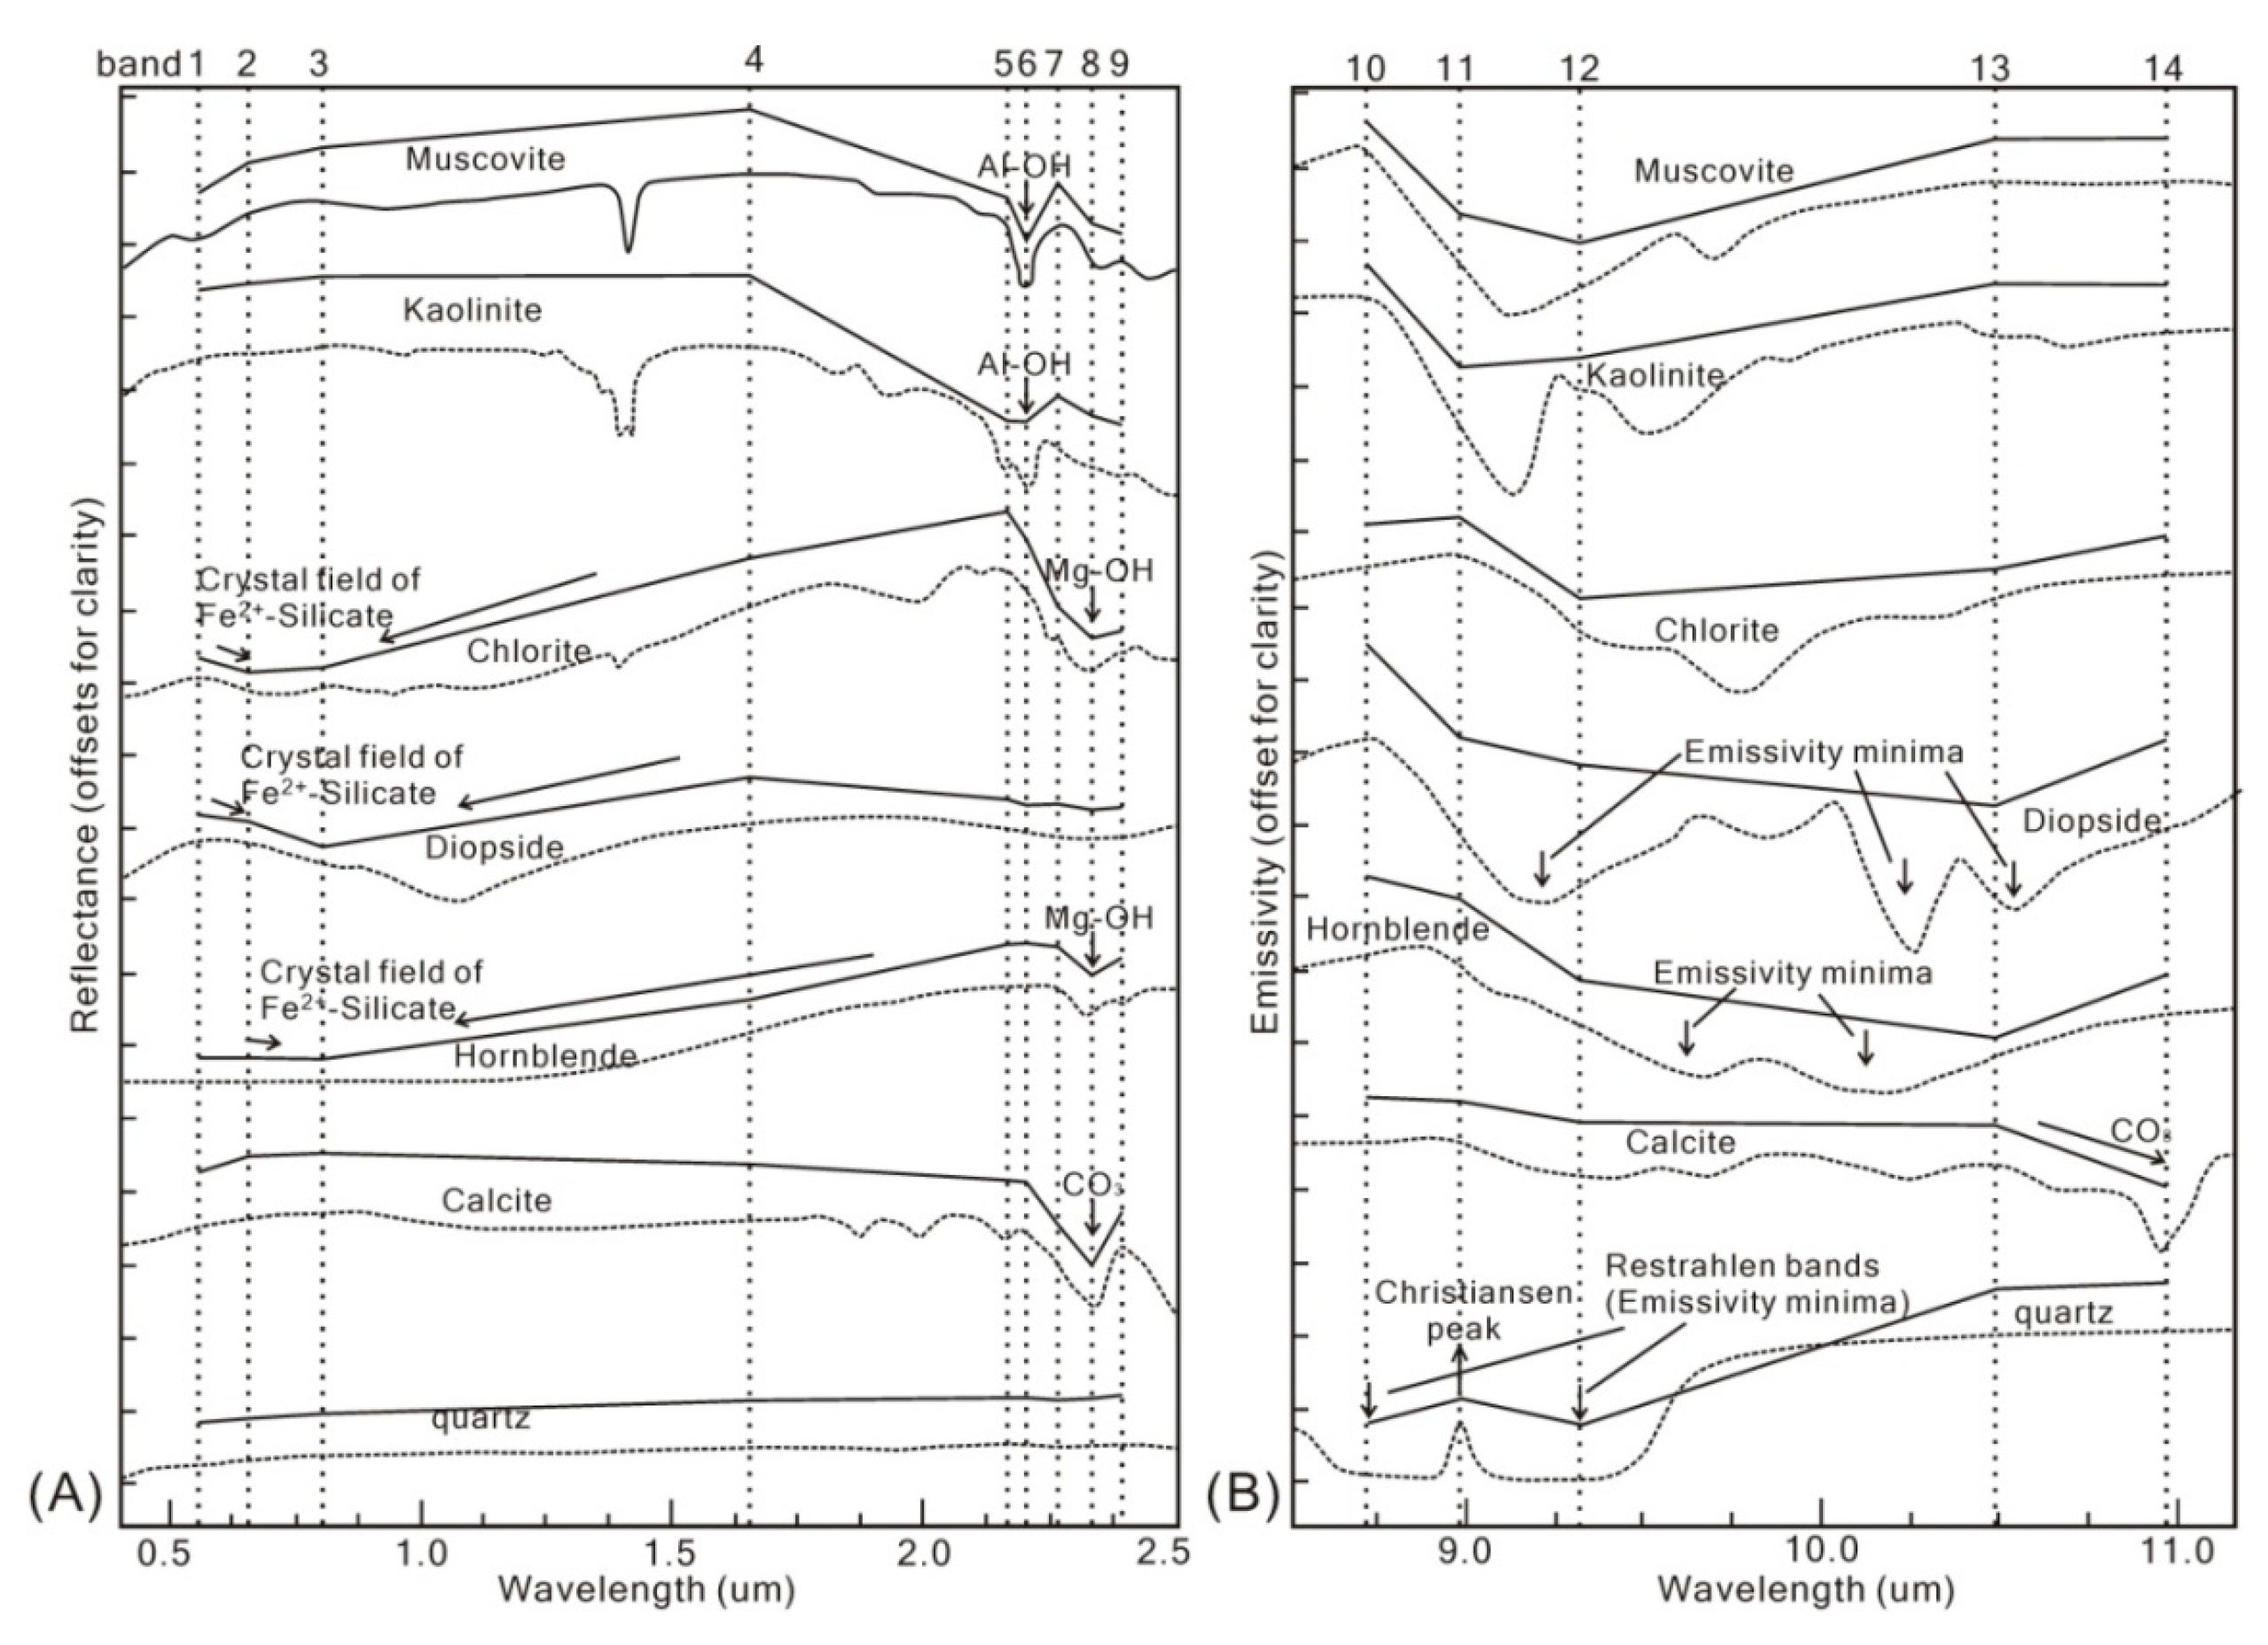
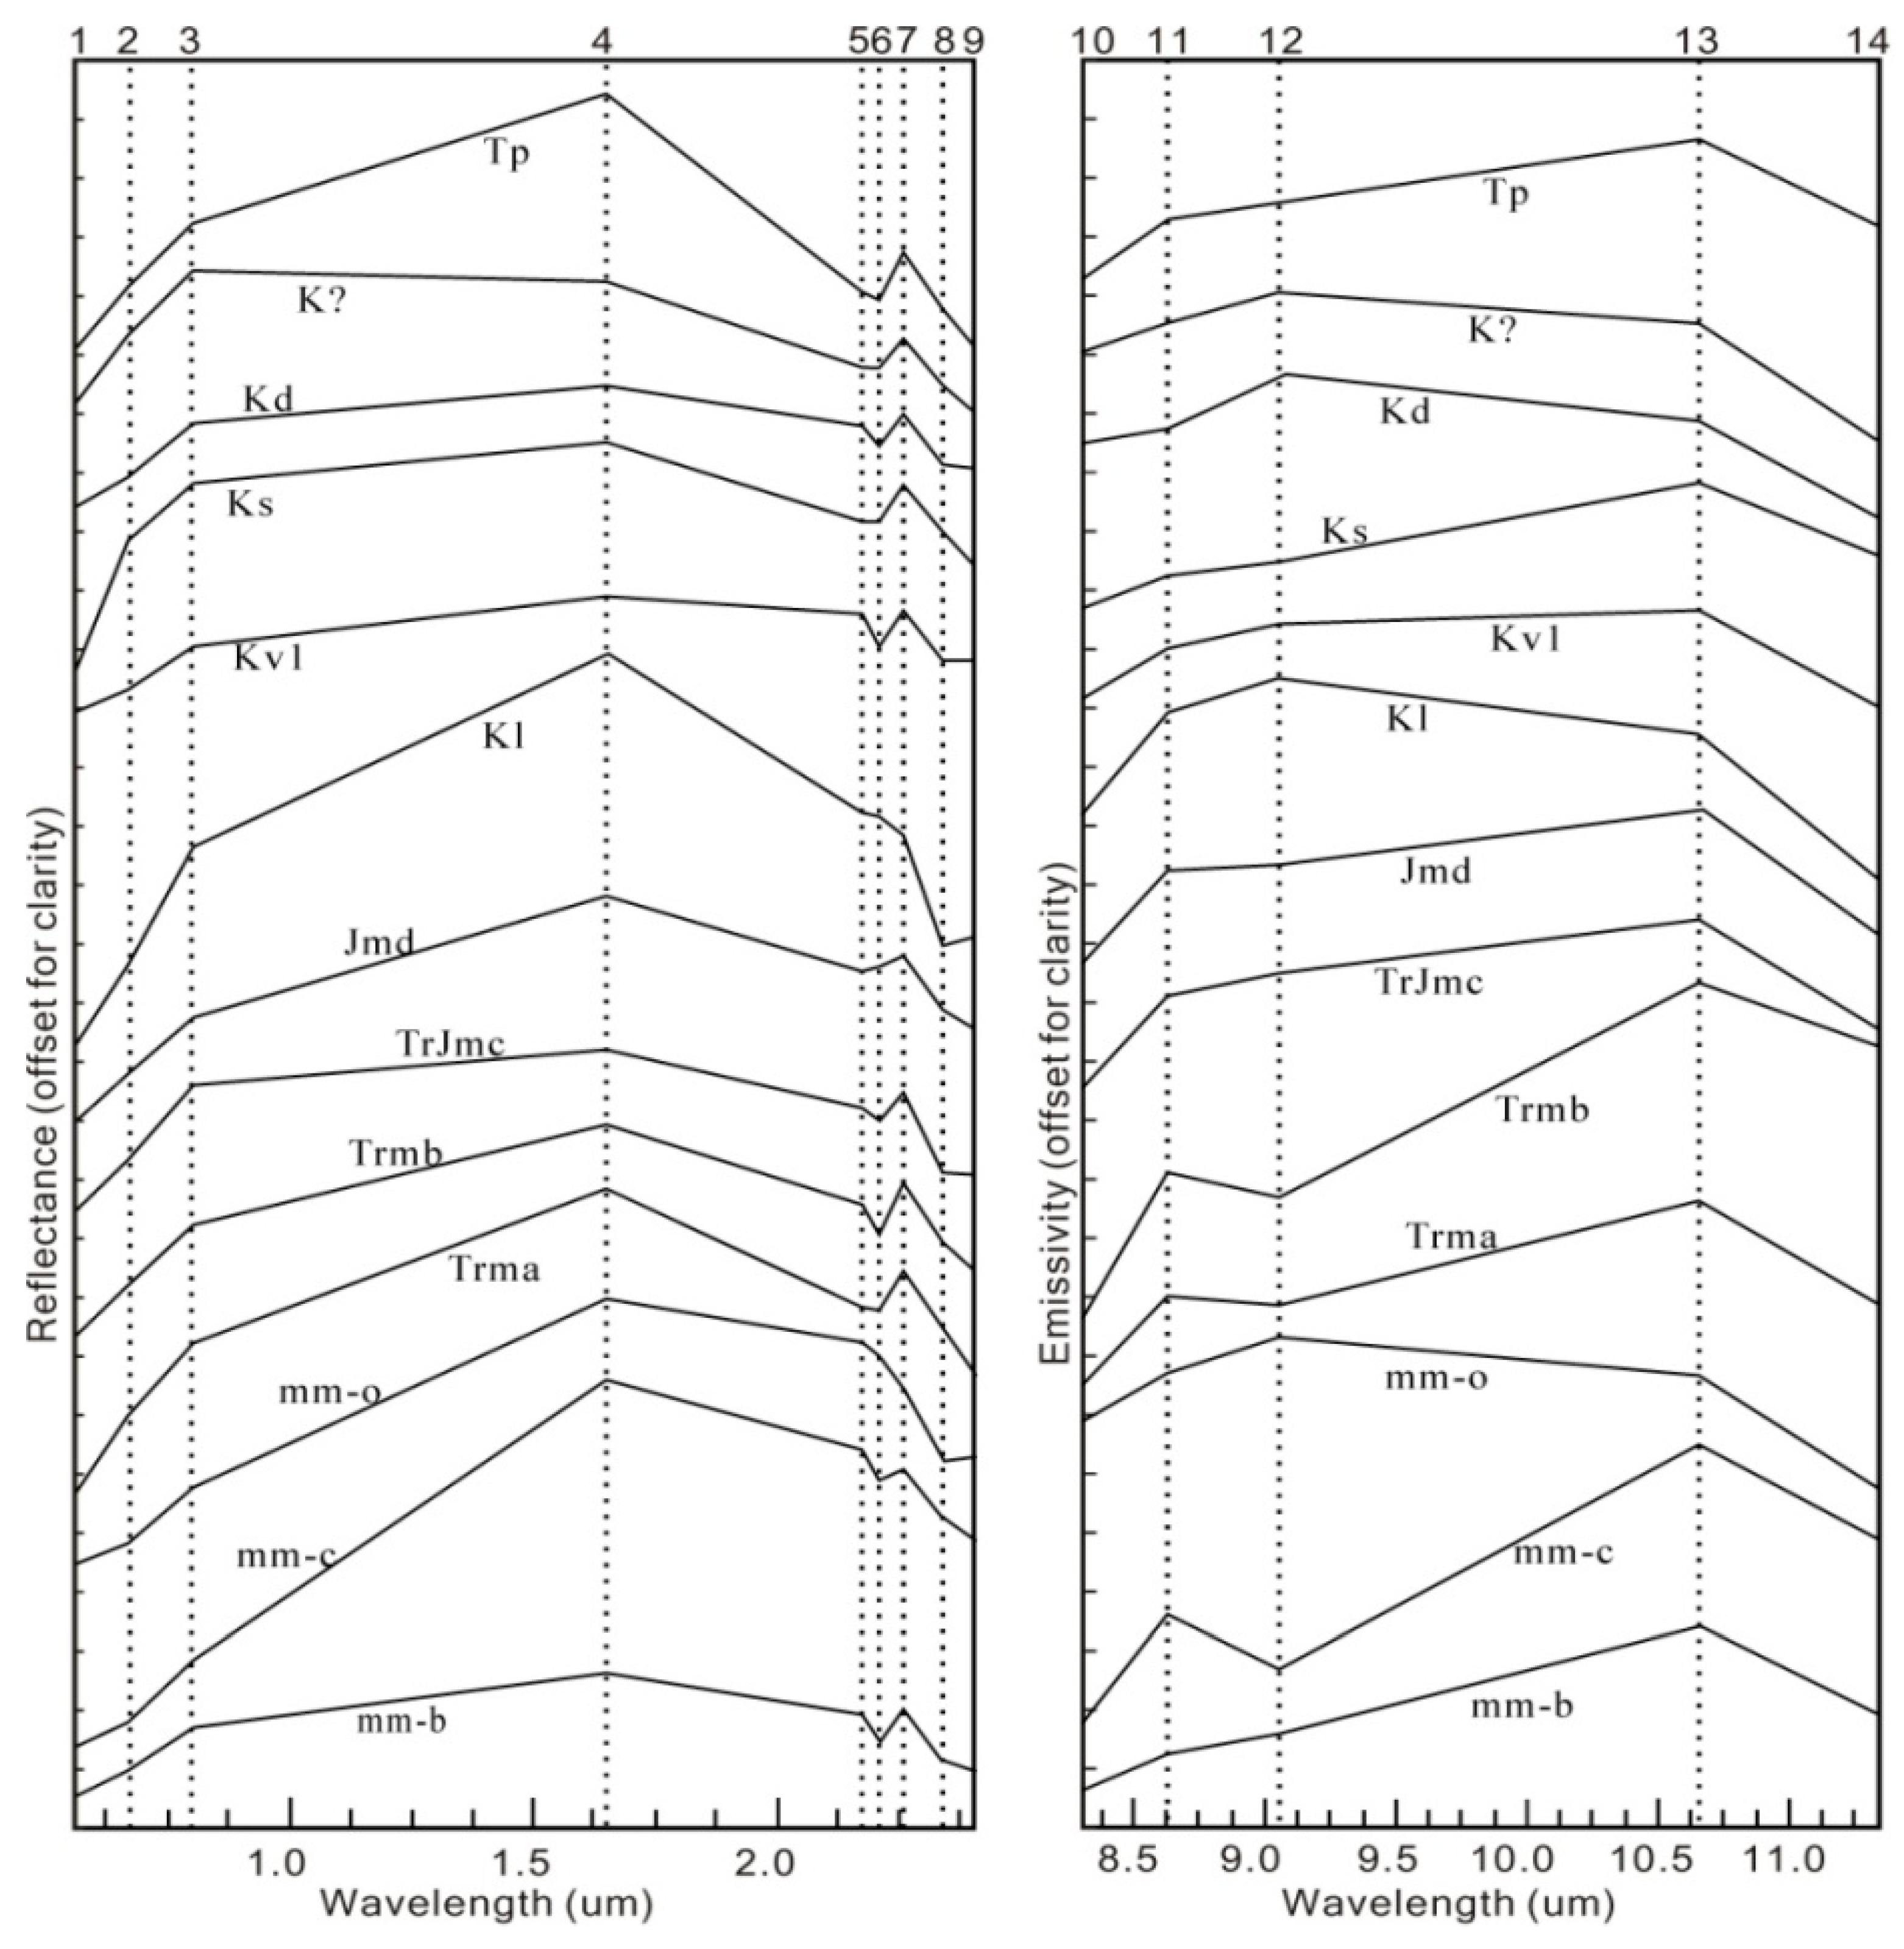
3.3. ASTER Spectral Signatures
4. Results
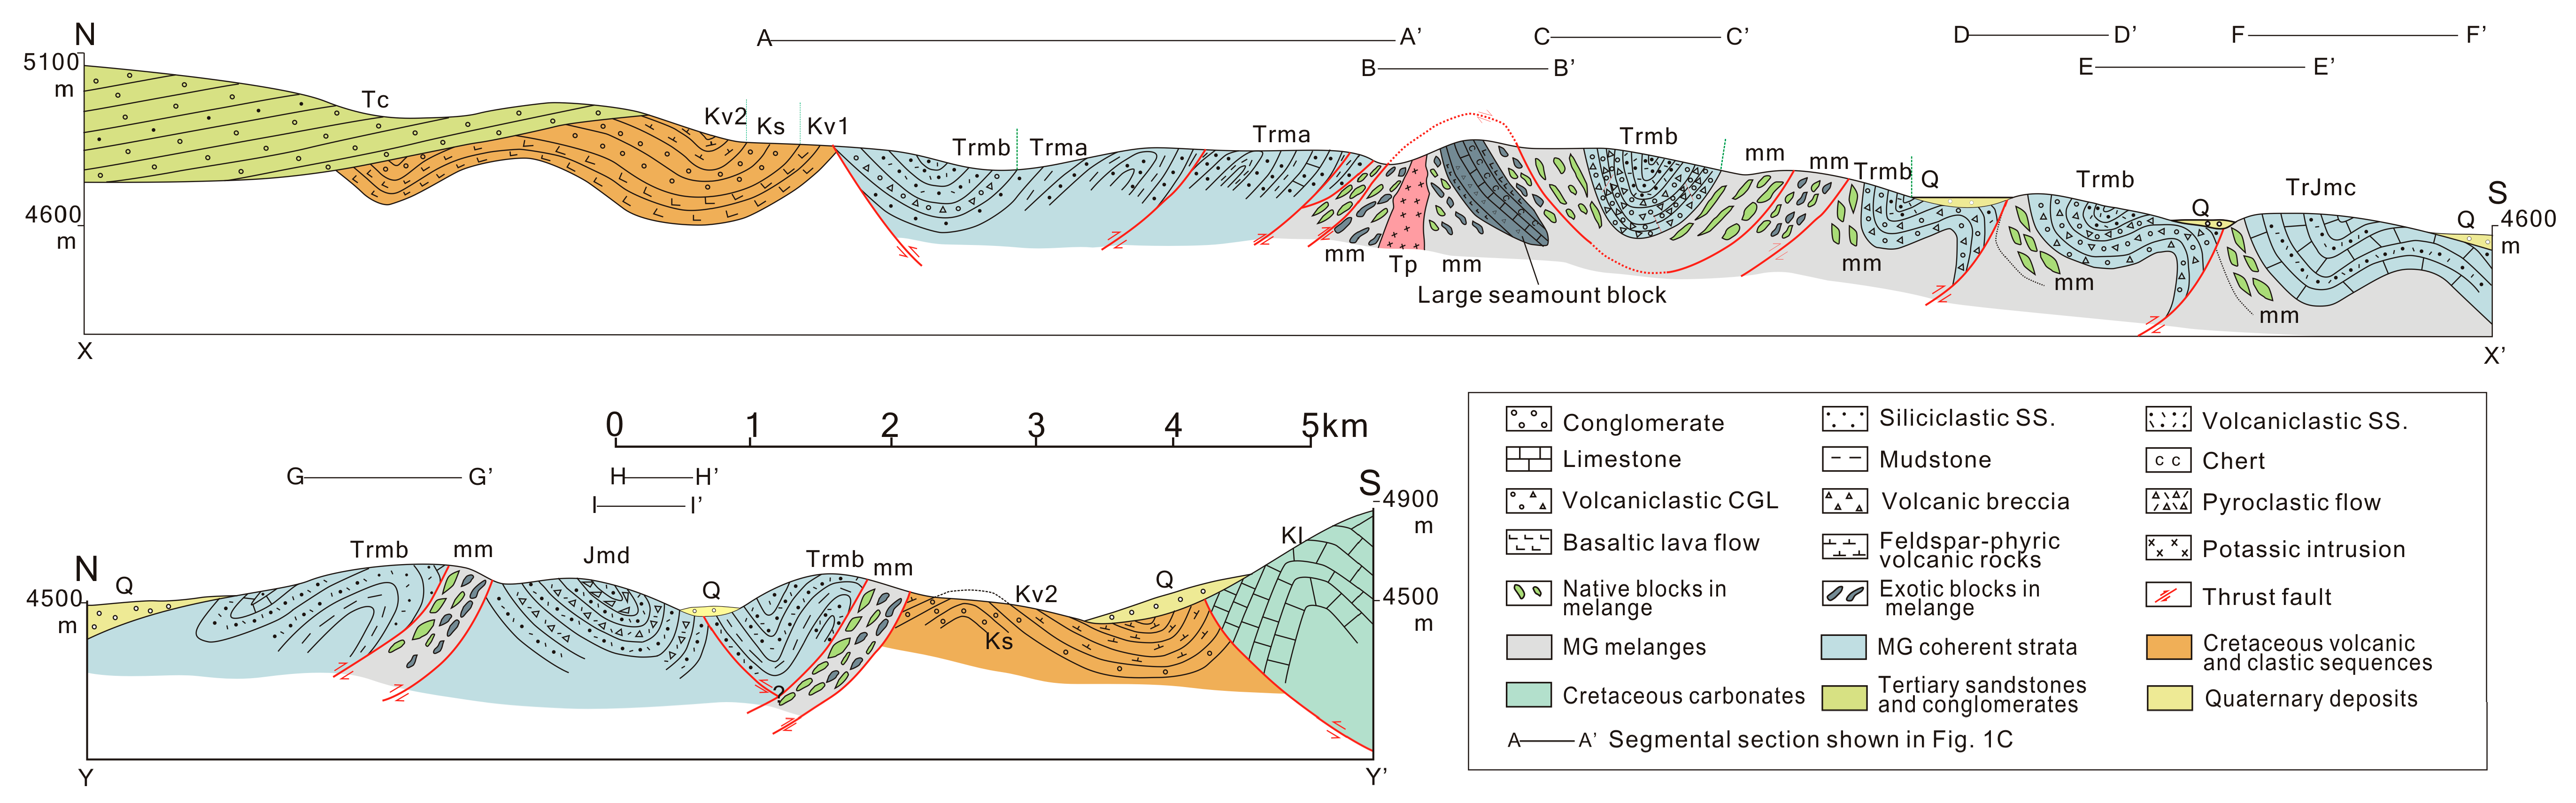
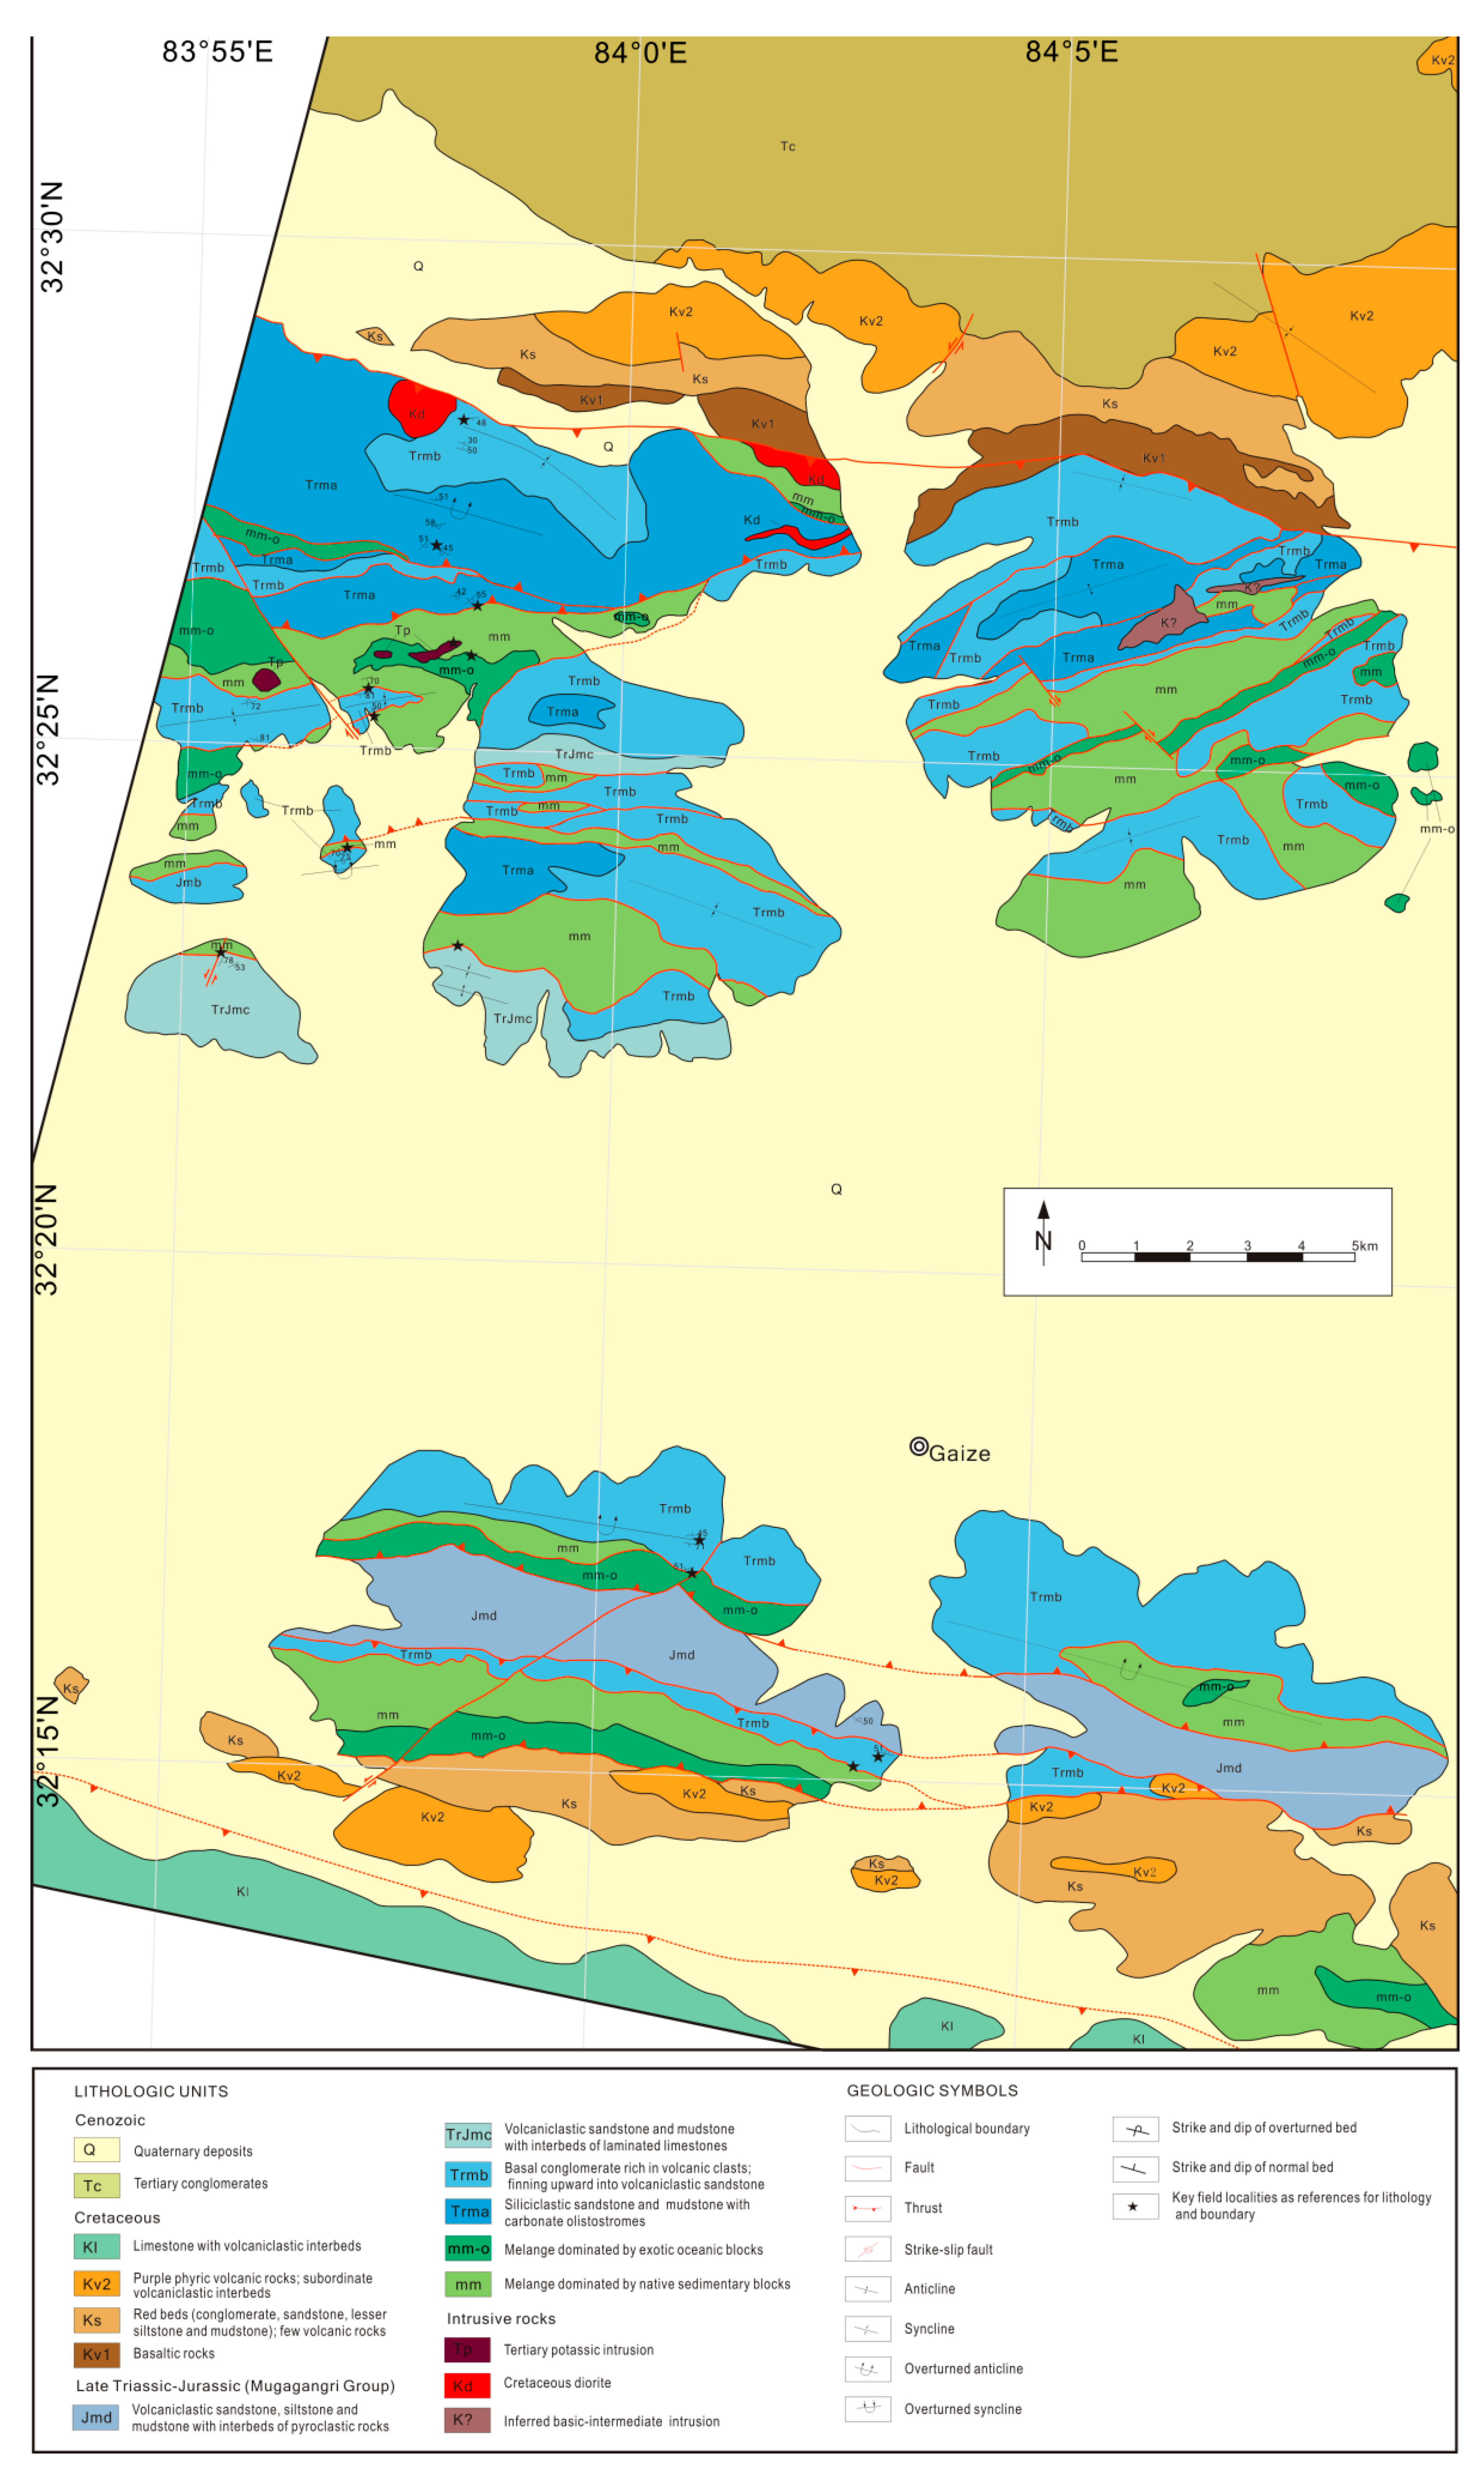
4.1. Mapping Units
4.1.1. Mugagangri Group (MG)
4.1.2. Cretaceous and Younger Units
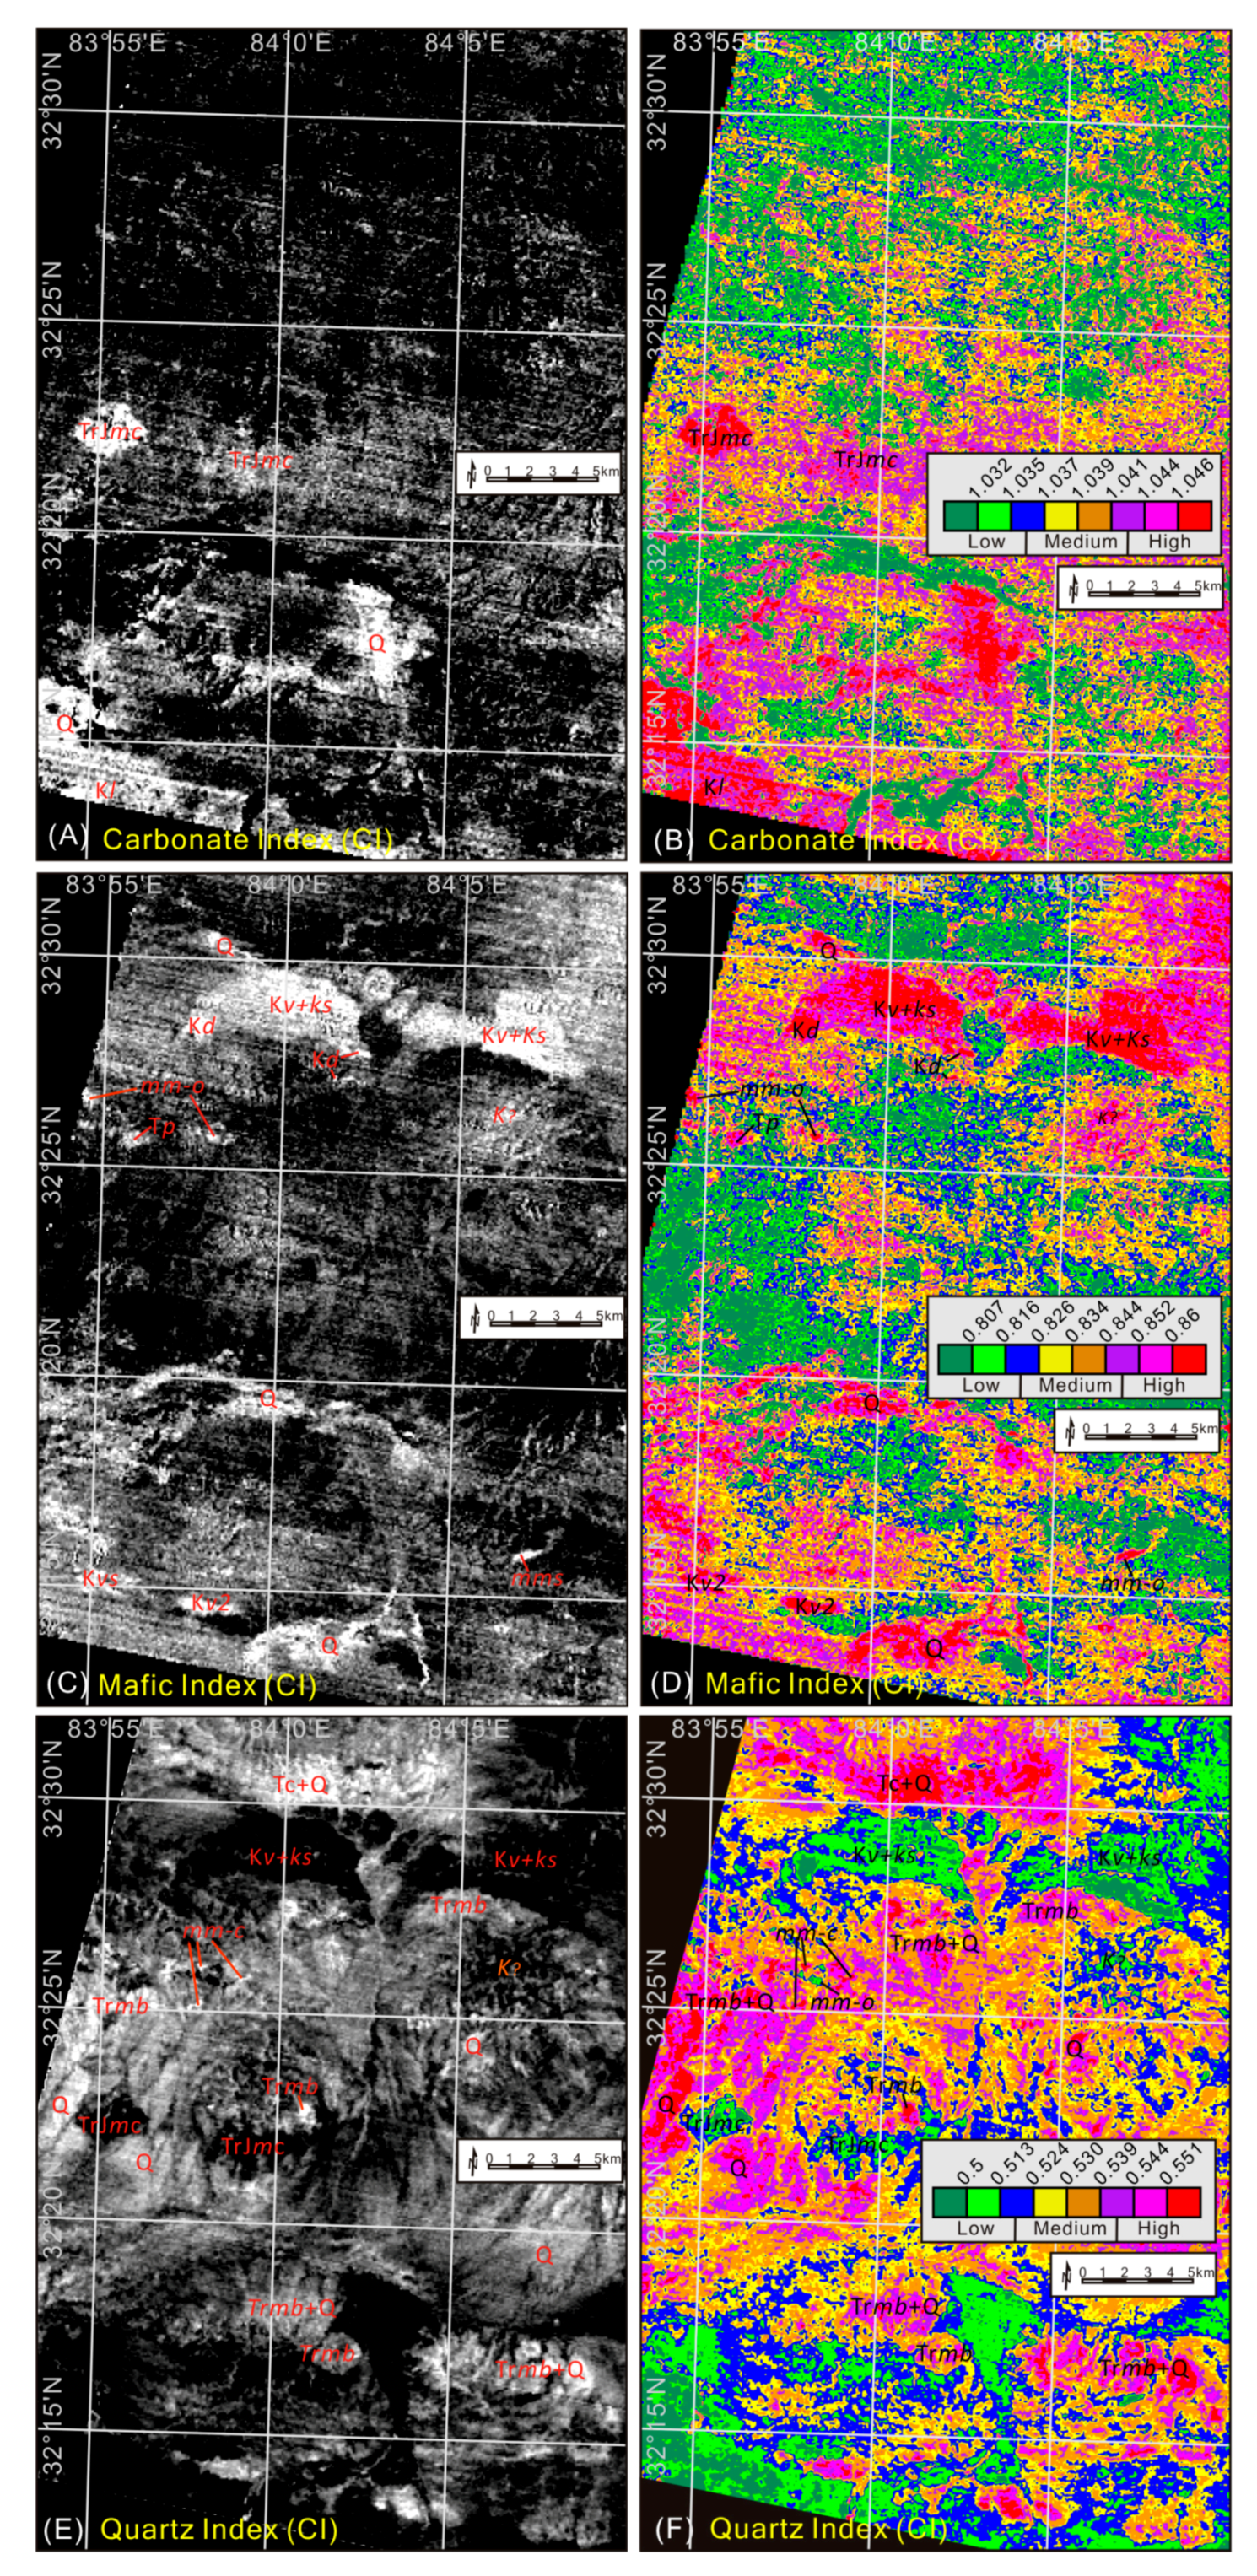
4.2. ASTER Spectral Analysis and Mapping
4.2.1. ASTER TIR Data Analysis
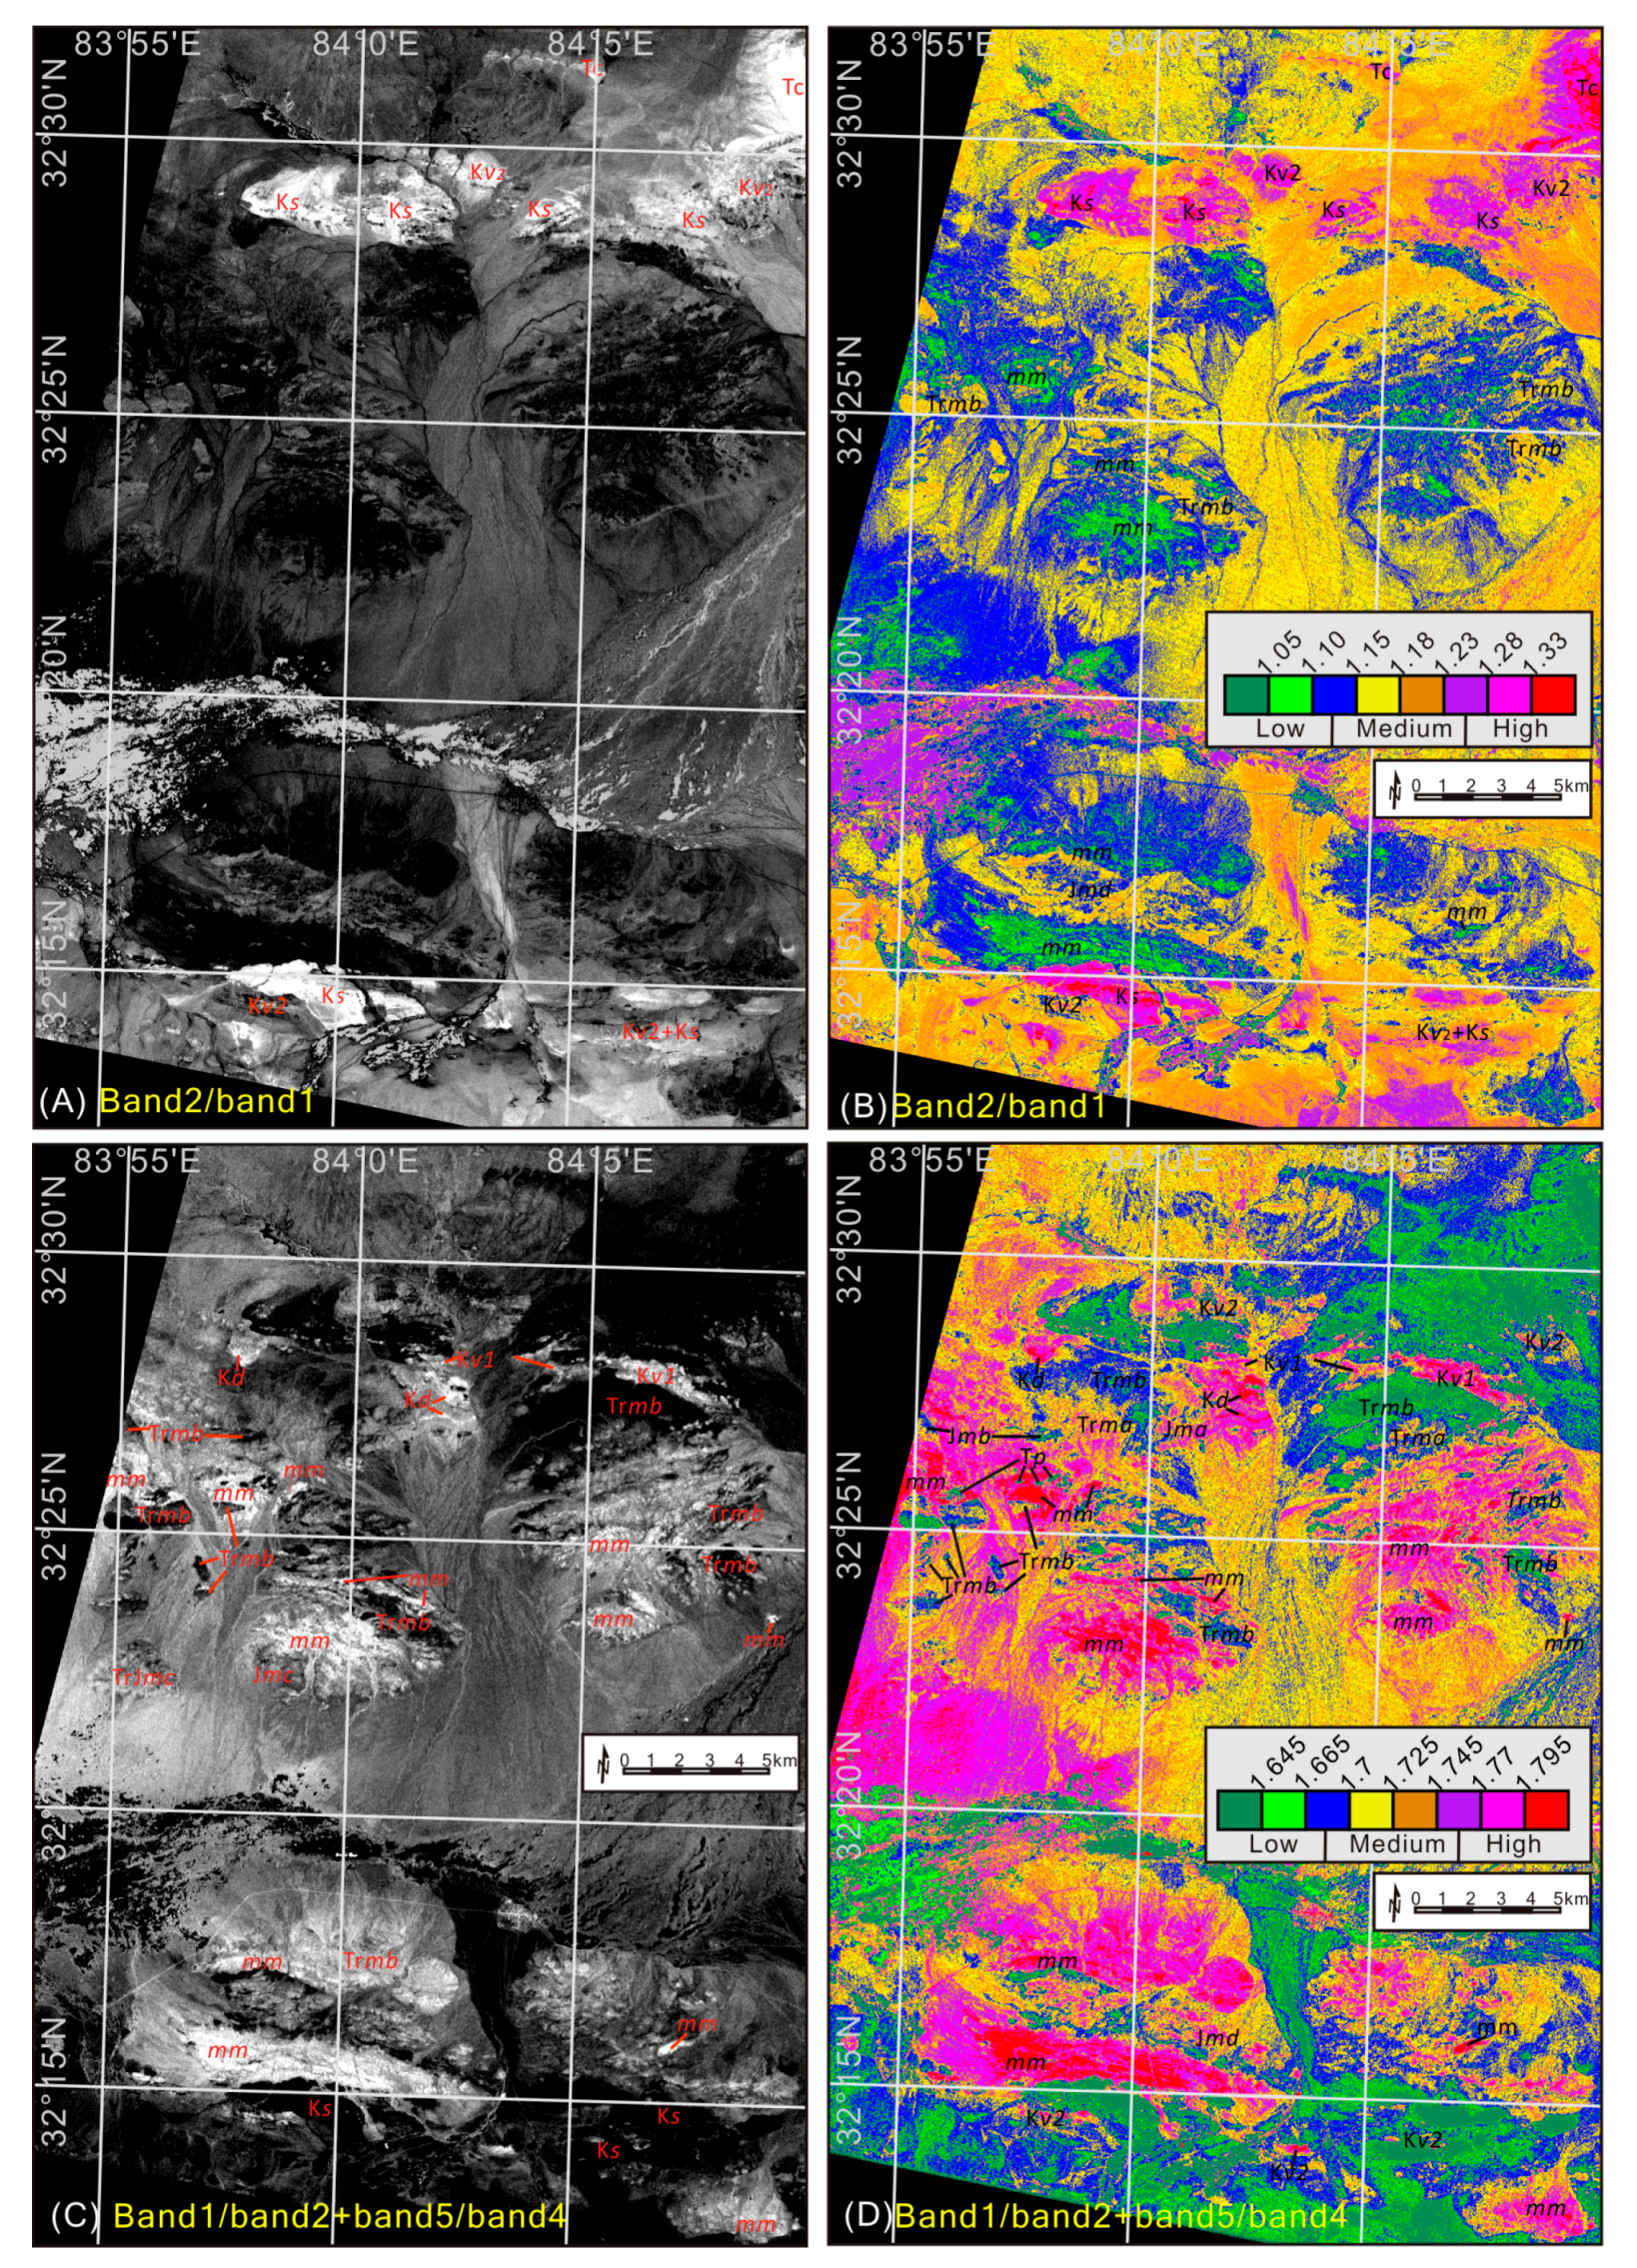
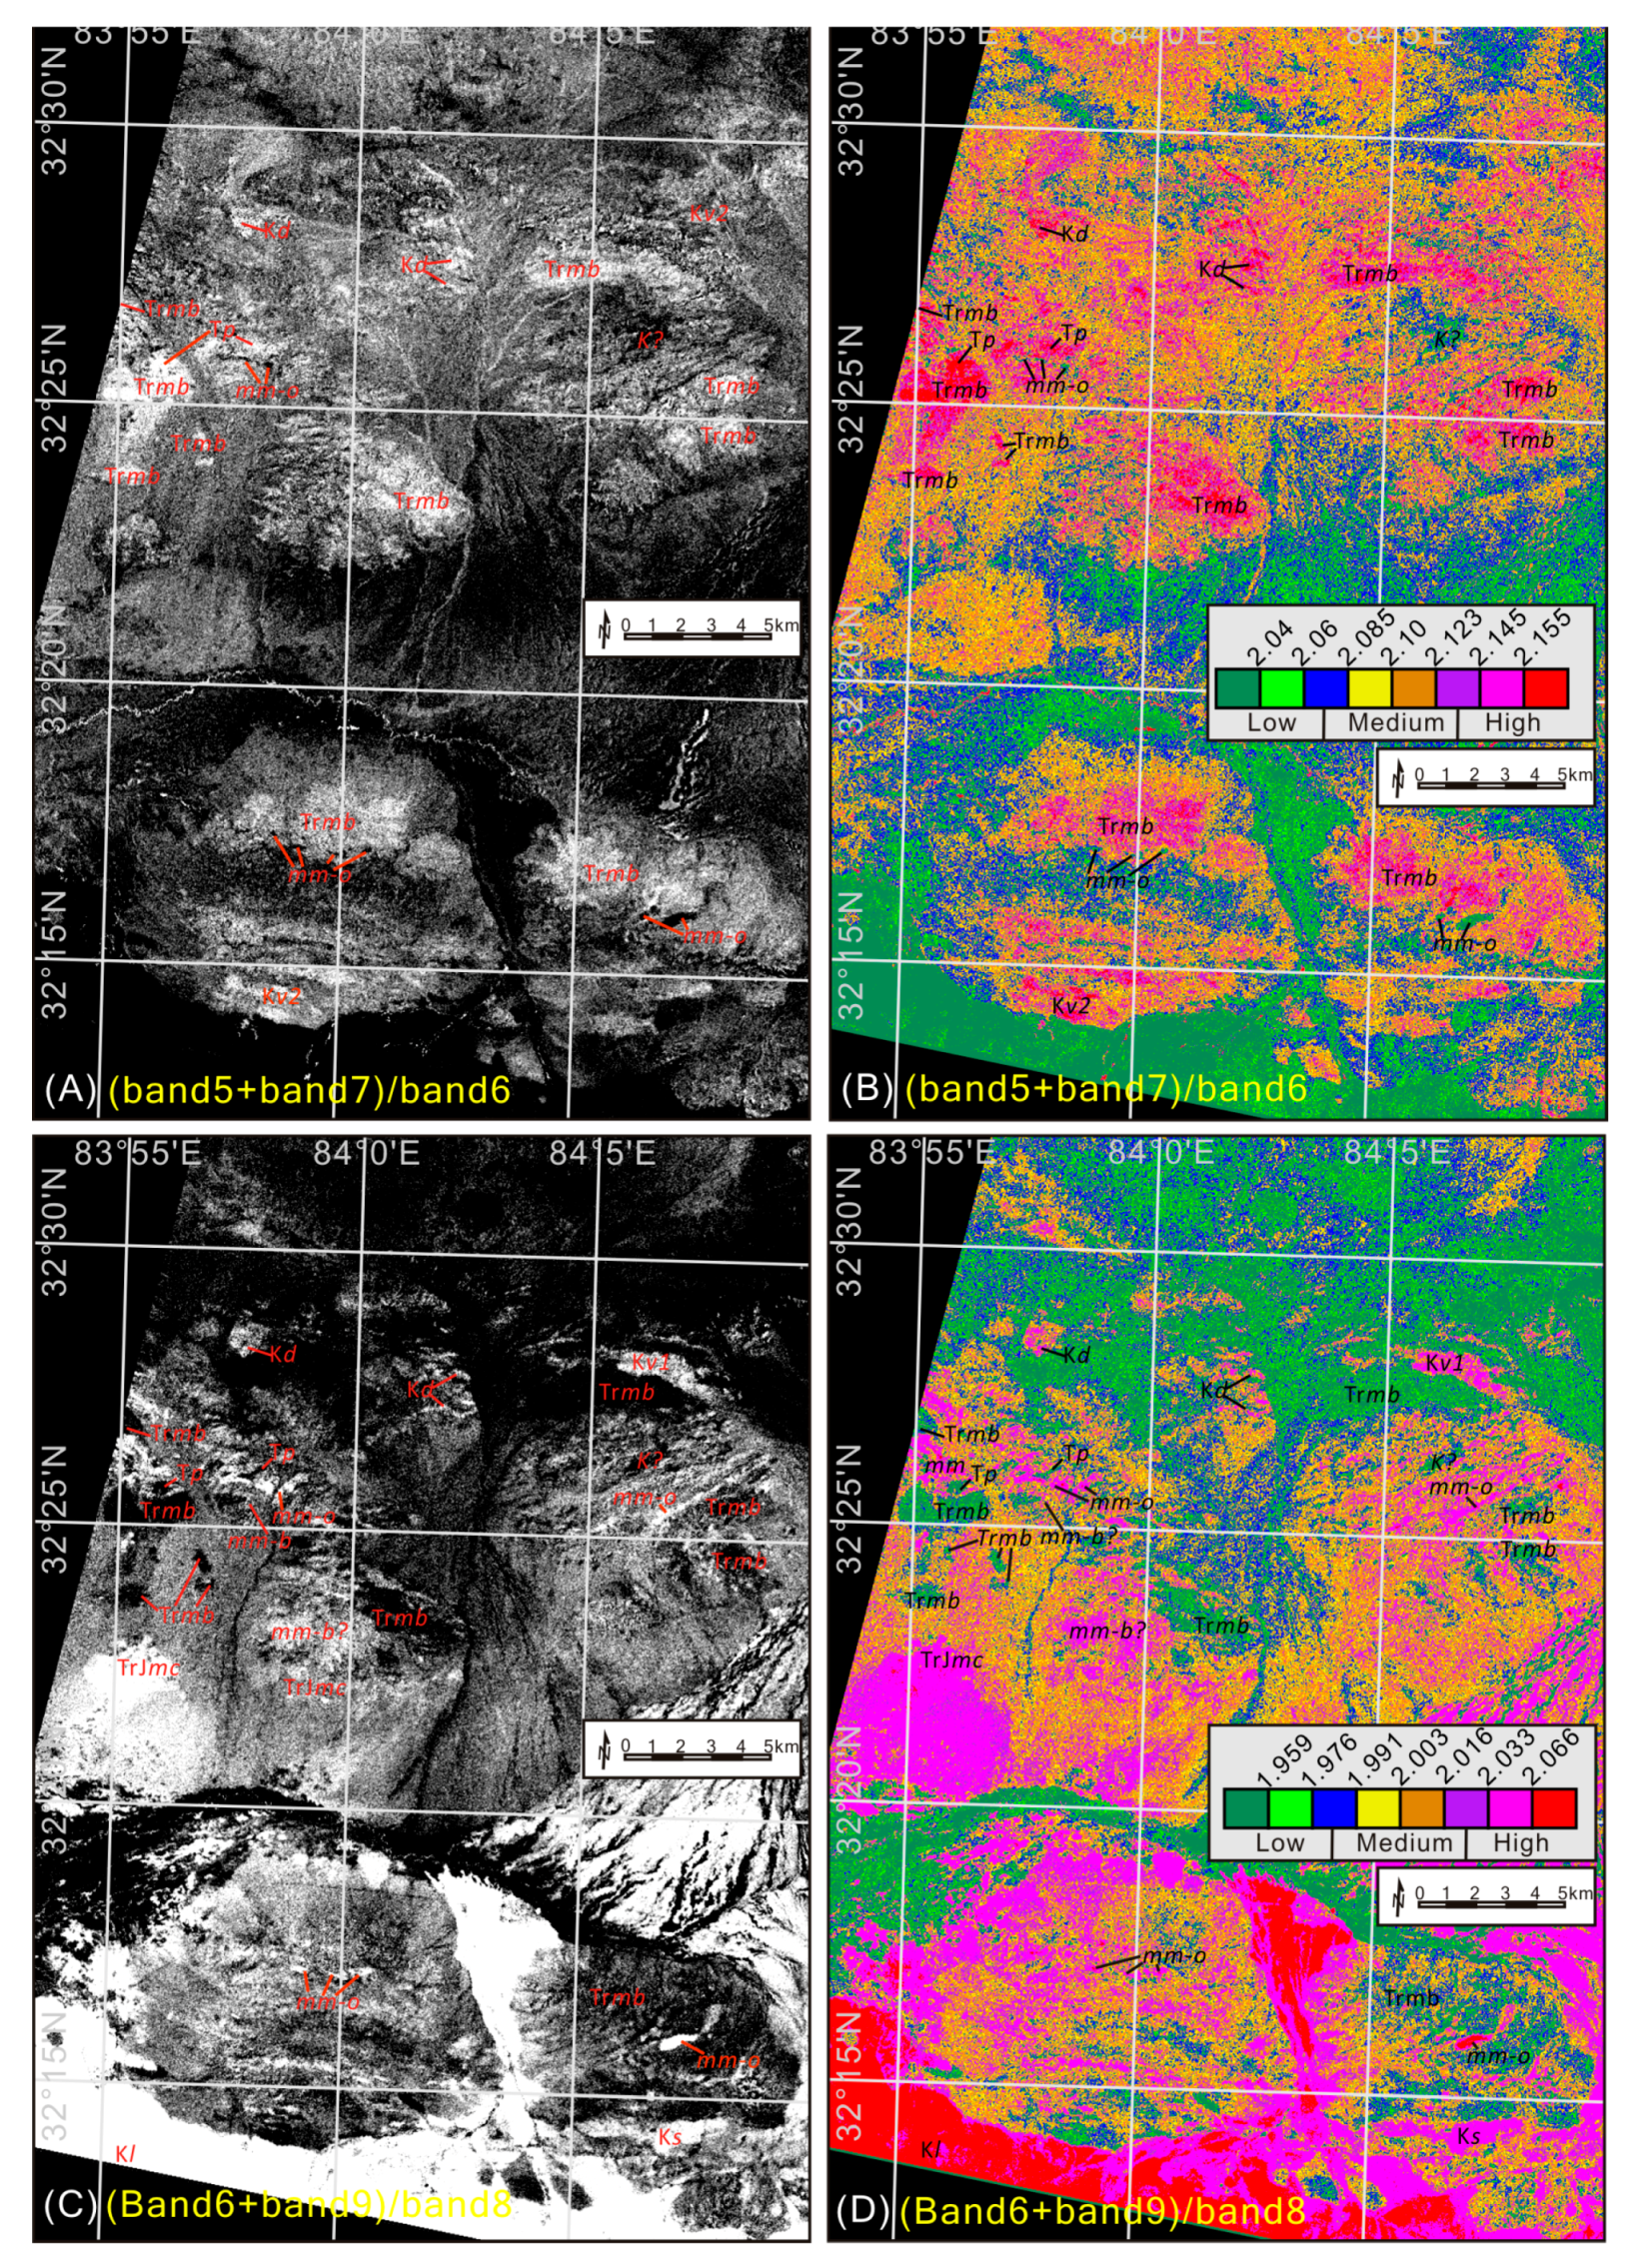
4.2.2. ASTER VNIR-SWIR Data Analysis
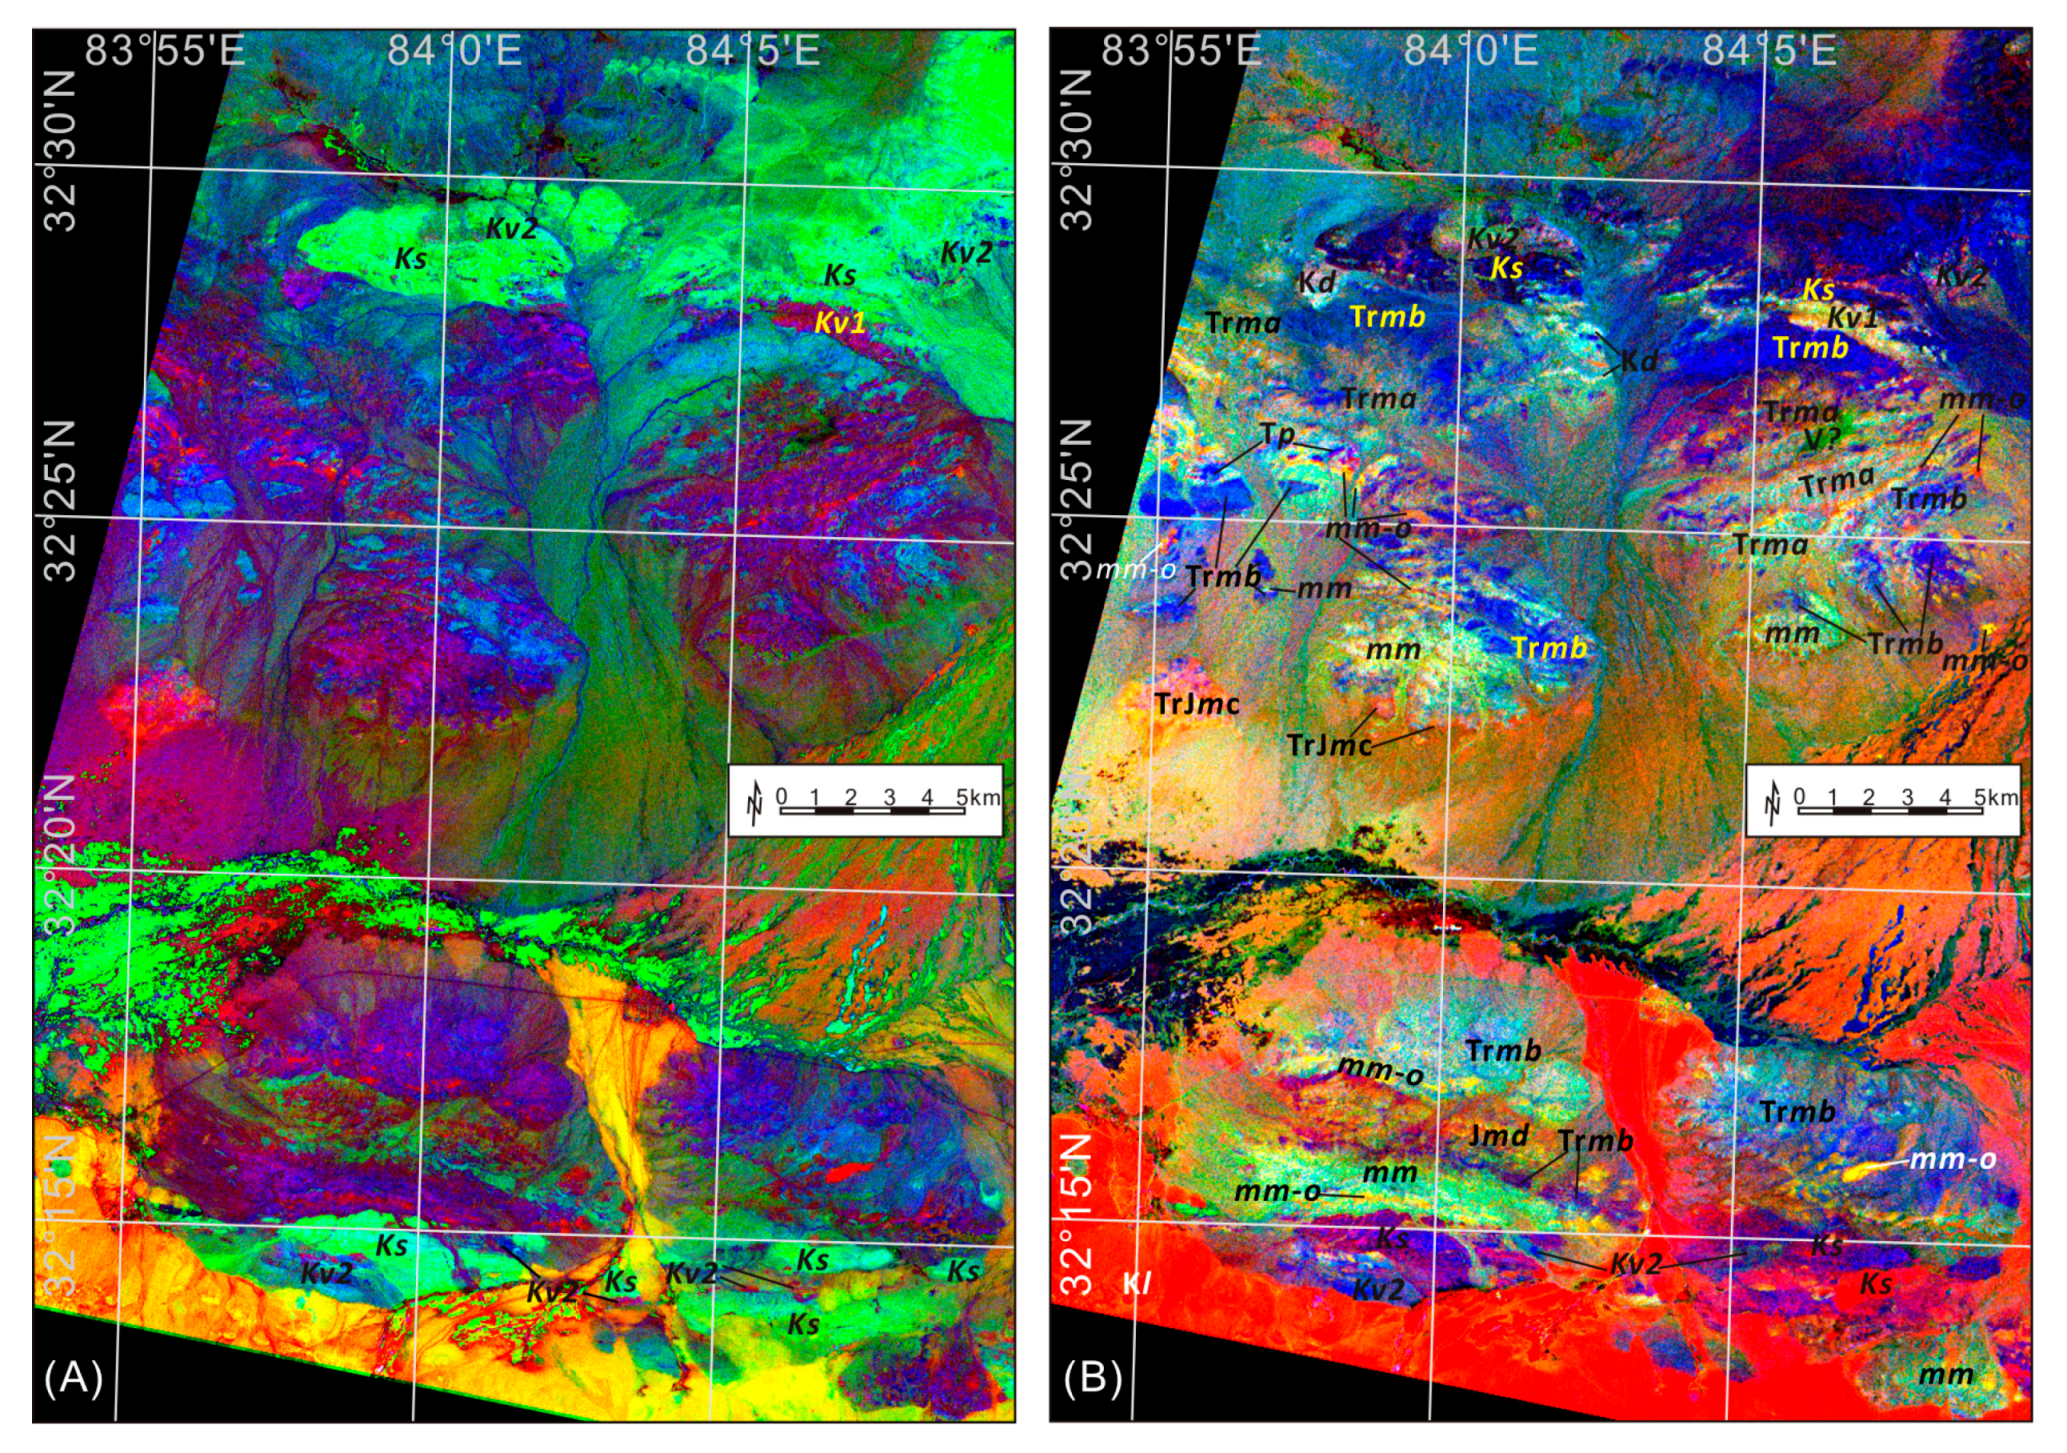
4.2.3. False Color Images
4.2.4. Lithologic Mapping and Interpretation
5. Discussion
5.1. Mappable Features of the MG and Tectonic Implications
5.2. Generalized Lithologic Mapping Methodology
6. Conclusions
Acknowledgments
Author Contributions
Conflicts of Interest
Abbreviations
| ASTER | Advanced Spaceborne Thermal Emission and Reflection |
| BNSZ | Bangong-Nujiang suture zone |
| BNO | Bangong-NujiangTethyan ocean |
| MG | Mugagangri Group |
| FCC | False color composite |
References
- Van der Meer, F.D.; van der Werff, H.; van Ruitenbeek, F.J.; Hecker, C.A.; Bakker, W.H.; Noomen, M.F.; van der Meijde, M.; Carranza, E.J.M.; Smeth, J.; Woldai, T. Multi-and hyperspectral geologic remote sensing: A review. Int. J. Appl. Earth Obs. 2012, 14, 112–128. [Google Scholar] [CrossRef]
- Ninomiya, Y.; Fu, B.; Cudahy, T.J. Detecting lithology with Advanced Spaceborne Thermal Emission and Reflection Radiometer (ASTER) multispectral thermal infrared “radiance-at-sensor” data. Remote Sens. Environ. 2005, 99, 127–139. [Google Scholar] [CrossRef]
- Rowan, L.C.; Mars, J.C.; Simpson, C.J. Lithologic mapping of the Mordor, NT, Australia ultramafic complex by using the Advanced Spaceborne Thermal Emission and Reflection Radiometer (ASTER). Remote Sens. Environ. 2005, 99, 105–126. [Google Scholar] [CrossRef]
- Watts, D.R.; Harris, N.B. Mapping granite and gneiss in domes along the North Himalayan antiform with ASTER SWIR band ratios. Geol. Soc. Am. Bull. 2005, 117, 879–886. [Google Scholar] [CrossRef]
- Mars, J.C.; Rowan, L.C. ASTER spectral analysis and lithologic mapping of the Khanneshin carbonatite volcano, Afghanistan. Geosphere 2011, 7, 276–289. [Google Scholar] [CrossRef]
- Emam, A.; Zoheir, B.; Johnson, P. ASTER-based mapping of ophiolitic rocks: Examples from the Allaqi–Heiani suture, SE Egypt. Int. Geol. Rev. 2015, 58, 525–539. [Google Scholar] [CrossRef]
- Yin, A.; Harrison, T.M. Geologic evolution of the Himalayan-Tibetan orogen. Annu. Rev. Earth Planet. Sci. 2000, 28, 211–280. [Google Scholar] [CrossRef]
- Zhang, K.; Xia, B.; Wang, G.; Li, Y.; Ye, H. Early Cretaceous stratigraphy, depositional environments, sandstone provenance, and tectonic setting of central Tibet, western China. Geol. Soc. Am. Bull. 2004, 116, 1202–1222. [Google Scholar] [CrossRef]
- Zhang, K.J.; Zhang, Y.X.; Tang, X.C.; Xia, B. Late Mesozoic tectonic evolution and growth of the Tibetan plateau prior to the Indo-Asian collision. Earth Sci. Rev. 2012, 114, 236–249. [Google Scholar] [CrossRef]
- Kapp, P.; Murphy, M.A.; Yin, A.; Harrison, T.M.; Ding, L.; Guo, J. Mesozoic and Cenozoic tectonic evolution of the Shiquanhe area of western Tibet. Tectonics 2003, 22, 1029. [Google Scholar] [CrossRef]
- Kapp, P.; Yin, A.; Harrison, T.M.; Ding, L. Cretaceous-Tertiary shortening, basin development, and volcanism in central Tibet. Geol. Soc. Am. Bull. 2005, 117, 865–878. [Google Scholar] [CrossRef]
- Guynn, J.H.; Kapp, P.; Pullen, A.; Heizler, M.; Gehrels, G.; Ding, L. Tibetan basement rocks near Amdo reveal “missing” Mesozoic tectonism along the Bangong suture, central Tibet. Geology 2006, 34, 505–508. [Google Scholar] [CrossRef]
- Guynn, J.; Tropper, P.; Kapp, P.; Gehrels, G.E. Metamorphism of the Amdo metamorphic complex, Tibet: Implications for the Jurassic tectonic evolution of the Bangong suture zone. J. Metamorph. Geol. 2013, 31, 705–727. [Google Scholar] [CrossRef]
- Pan, G.; Wang, L.; Li, R.; Yuan, S.; Ji, W.; Yin, F.; Zhang, W.; Wang, B. Tectonic evolution of the Qinghai-Tibet plateau. J. Asian Earth Sci. 2012, 53, 3–14. [Google Scholar] [CrossRef]
- Zhu, D.; Zhao, Z.; Niu, Y.; Dilek, Y.; Hou, Z.; Mo, X. The origin and pre-Cenozoic evolution of the Tibetan Plateau. Gondwana Res. 2013, 23, 1429–1454. [Google Scholar] [CrossRef]
- Zeng, Q.G.; Mai, G.Z.; Chen, G.R. 1:250,000 Geological Map of Gaize Region with Report; Bureau of Geology and Mineral Resources of Xizang Autonomous Region: Lhasa, China, 2006.
- Zeng, M.; Zhang, X.; Cao, H.; Ettensohn, F.R.; Cheng, W.; Lang, X. Late Triassic initial subduction of the Bangong-Nujiang Ocean beneath Qiangtang revealed: Stratigraphic and geochronological evidence from Gaize, Tibet. Basin Res. 2016, 28, 147–157. [Google Scholar] [CrossRef]
- Baxter, A.T.; Aitchison, J.C.; Zyabrev, S.V. Radiolarian age constraints on Mesotethyan ocean evolution, and their implications for development of the Bangong–Nujiang suture, Tibet. J. Geol. Soc. Lond. 2009, 166, 689–694. [Google Scholar] [CrossRef]
- Shi, R.; Yang, J.; Xu, Z.; Qi, X. The Bangong Lake ophiolite (NW Tibet) and its bearing on the tectonic evolution of the Bangong–Nujiang suture zone. J. Asian Earth Sci. 2008, 32, 438–457. [Google Scholar] [CrossRef]
- Wang, W.; Aitchison, J.C.; Lo, C.; Zeng, Q. Geochemistry and geochronology of the amphibolite blocks in ophiolitic melanges along Bangong-Nujiang suture, central Tibet. J. Asian Earth Sci. 2008, 33, 122–138. [Google Scholar] [CrossRef]
- Zhang, Y. Tectonic Evolution of the Middle-Western Bangong-Nujiang Suture, Tibet. Ph.D. Thesis, Guangzhou Institute of Geochemistry, Chinese Academy of Sciences, Guangzhou, China, 2007. [Google Scholar]
- Liu, W.; Xia, B.; Zhong, Y.; Cai, J.; Li, J.; Liu, H.; Cai, Z.; Sun, Z. Age and composition of the Rebang Co and Julu ophiolites, central Tibet: Implications for the evolution of the Bangong Meso-Tethys. Int. Geol. Rev. 2014, 56, 430–447. [Google Scholar] [CrossRef]
- Xu, M.; Li, C.; Zhang, X.; Wu, Y. Nature and evolution of the Neo-Tethys in central Tibet: Synthesis of ophiolitic petrology, geochemistry, and geochronology. Int. Geol. Rev. 2014, 56, 1072–1096. [Google Scholar] [CrossRef]
- Li, G.; Li, J.; Qin, K.; Duo, J.; Zhang, T.; Xiao, B.; Zhao, J. Geology and Hydrothermal Alteration of the Duobuza Gold-Rich Porphyry Copper District in the Bangongco Metallogenetic Belt, Northwestern Tibet. Resour. Geol. 2012, 62, 99–118. [Google Scholar] [CrossRef]
- Chen, Y.L.; Zhang, K.Z.; Gou, Y.D.; Wen, J.H. 1:250,000 Geological Map of Wuma Region with Report; Geological Survey of Sichuan Province: Chengdu, China, 2006.
- Metcalfe, I. Gondwana dispersion and Asian accretion: Tectonic and palaeogeographic evolution of eastern Tethys. J. Asian Earth Sci. 2013, 66, 1–33. [Google Scholar] [CrossRef]
- Wen, S. New materials of biostratigraphy in the northern Qiangtang Plateau. Acta Strat. Sin. 1979, 3, 150–156. [Google Scholar]
- Cao, S.; Xiao, X.; Ouyang, K. Renew Establishment of the Jurassic Mugagangri Groups and Its Geological Significance on the Western Side of the Bangong Co-Nujiang Junction Zone. Acta Sedimentol. Sin. 2008, 4, 559–564. [Google Scholar]
- Fujisada, H. Design and performance of ASTER instrument. Proc. SPIE Int. Soc. Opt. Eng. 1995, 2583, 16–25. [Google Scholar]
- Iwasaki, A.; Fujisada, H.; Akao, H.; Shindou, O.; Akagi, S. Enhancement of spectral separation performance for ASTER/SWIR. Proc. Soc. Photo-Opt. Instrum. Eng. 2002, 4486, 42–50. [Google Scholar]
- Cooley, T.; Anderson, G.P.; Felde, G.W.; Hoke, M.L.; Ratkowski, A.J.; Chetwynd, J.H.; Gardner, J.A.; Adler-Golden, S.M.; Matthew, M.W.; Berk, A.; et al. FLAASH, a MODTRAN4-based atmospheric correction algorithm, its application and validation. Geosci. Remote Sens. Symp. IGARSS 2002, 2, 1414–1418. [Google Scholar]
- Scheidt, S.; Ramsey, M.; Lancaster, N. Radiometric normalization and image mosaic generation of ASTER thermal infrared data: An application to extensive sand sheets and dune fields. Remote Sens. Environ. 2008, 112, 920–933. [Google Scholar] [CrossRef]
- Bertoldi, L.; Massironi, M.; Vison A, D.; Carosi, R.; Montomoli, C.; Gubert, F.; Naletto, G.; Pelizzo, M.G. Mapping the Buraburi granite in the Himalaya of Western Nepal: Remote sensing analysis in a collisional belt with vegetation cover and extreme variation of topography. Remote Sens. Environ. 2011, 115, 1129–1144. [Google Scholar] [CrossRef]
- Hewson, R.D.; Cudahy, T.J.; Mizuhiko, S.; Ueda, K.; Mauger, A.J. Seamless geological map generation using ASTER in the Broken Hill-Curnamona province of Australia. Remote Sens. Environ. 2005, 99, 159–172. [Google Scholar] [CrossRef]
- Clark, R.N. Spectroscopy of Rocks and Minerals, and Principles of Spectroscopy. Manual Remote Sens. Remote Sens. Earth Sci. 1999, 3, 3–58. [Google Scholar]
- Rowan, L.C.; Mars, J.C. Lithologic mapping in the Mountain Pass, California area using advanced spaceborne thermal emission and reflection radiometer (ASTER) data. Remote Sens. Environ. 2003, 84, 350–366. [Google Scholar] [CrossRef]
- Rockwell, B.W.; Hofstra, A.H. Identification of quartz and carbonate minerals across northern Nevada using ASTER thermal infrared emissivity data—Implications for geologic mapping and mineral resource investigations in well-studied and frontier areas. Geosphere 2008, 4, 218–246. [Google Scholar] [CrossRef]
- Schneider, W.; Mattern, F.; Wang, P.; Li, C. Tectonic and sedimentary basin evolution of the eastern Bangong–Nujiang zone (Tibet): A Reading cycle. Int. J. Earth Sci. 2003, 92, 228–254. [Google Scholar]
- Dickinson, W.R.; Suczek, C.A. Plate tectonics and sandstone compositions. AAPG Bull. 1979, 63, 2164–2182. [Google Scholar]
- Wilson, J.L. Microfacies and sedimentary structures in “deeper water” lime mudstones. Depos. Environ. Carbonate Rocks Soc. Econ. Paleontol. Mineral. Spec. Publ. 1969, 14, 4–19. [Google Scholar]
- Watkins, R. Carbonate bank sedimentation in a volcaniclastic arc setting; Lower Carboniferous limestones of the eastern Klamath Terrane, California. J. Sediment. Res. 1993, 63, 966–973. [Google Scholar]
- Soja, C.M. Island-arc carbonates: Characterization and recognition in the ancient geologic record. Earth-Sci. Rev. 1996, 41, 31–65. [Google Scholar] [CrossRef]
- Cousineau, P.A. Subaqueous pyroclastic deposits in an Ordovician fore-arc basin; an example from the Saint-Victor Formation, Quebec Appalachians, Canada. J. Sediment. Res. 1994, 64, 867–880. [Google Scholar]
- Wakita, K. Mappable features of mélanges derived from Ocean Plate Stratigraphy in the Jurassic accretionary complexes of Mino and Chichibu terranes in Southwest Japan. Tectonophysics 2012, 568, 74–85. [Google Scholar] [CrossRef]
- Watts, A.B.; Koppers, A.A.; Robinson, D.P. Seamount subduction and earthquakes. Oceanography 2010, 23, 166–173. [Google Scholar] [CrossRef]
- Wang, Z.; Wang, Y.; Xie, Y.; Sun, Z.G.; Lu, Z.L.; Qu, Y.G.; Li, C.Z.; Jiang, X.F. The Tarenben oceanic-island basalts in the middle part of the Bangong-Nujiang suture zone, Xizang and their geological implications. Sediment. Geol. Tethyan Geol. 2005, 25, 155–162. [Google Scholar]
- Fan, J.; Li, C.; Xu, J.; Wang, M. Petrology, geochemistry, and geological significance of the Nadong ocean island, Banggongco--Nujiang suture, Tibetan plateau. Int. Geol. Rev. 2014, 56, 915–928. [Google Scholar] [CrossRef]
- Ding, L.; Kapp, P.; Zhong, D.; Deng, W. Cenozoic volcanism in Tibet: Evidence for a transition from oceanic to continental subduction. J. Petrol. 2003, 44, 1833–1865. [Google Scholar] [CrossRef]
- Xia, L.; Li, X.; Ma, Z.; Xu, X.; Xia, Z. Cenozoic volcanism and tectonic evolution of the Tibetan plateau. Gondwana Res. 2011, 19, 850–866. [Google Scholar] [CrossRef]
- DeCelles, P.G.; Kapp, P.; Ding, L.; Gehrels, G.E. Late Cretaceous to middle Tertiary basin evolution in the central Tibetan Plateau: Changing environments in response to tectonic partitioning, aridification, and regional elevation gain. Geol. Soc. Am. Bull. 2007, 119, 654–680. [Google Scholar] [CrossRef]
- Taylor, M.; Yin, A.; Ryerson, F.J.; Kapp, P.; Ding, L. Conjugate strike-slip faulting along the Bangong-Nujiang suture zone accommodates coeval east-west extension and north-south shortening in the interior of the Tibetan Plateau. Tectonics 2003, 22, 1044. [Google Scholar] [CrossRef]
- Brown, D.; Spadea, P. Processes of forearc and accretionary complex formation during arc-continent collision in the southern Ural Mountains. Geology 1999, 27, 649–652. [Google Scholar] [CrossRef]
- Hajná, J.; Jiří, Ž.; Václav, K. Growth of accretionary wedges and pulsed ophiolitic mélange formation by successive subduction of trench-parallel volcanic elevations. Terra Nova 2014, 26, 322–329. [Google Scholar] [CrossRef]
- Massironi, M.; Bertoldi, L.; Calafa, P.; Vison A, D.; Bistacchi, A.; Giardino, C.; Schiavo, A. Interpretation and processing of ASTER data for geological mapping and granitoids detection in the Saghro massif (eastern Anti-Atlas, Morocco). Geosphere 2008, 4, 736–759. [Google Scholar] [CrossRef]
- Mars, J.C.; Rowan, L.C. Spectral assessment of new ASTER SWIR surface reflectance data products for spectroscopic mapping of rocks and minerals. Remote Sens. Environ. 2010, 114, 2011–2025. [Google Scholar] [CrossRef]
- Son, Y.; Kang, M.; Yoon, W. Lithological and mineralogical survey of the Oyu Tolgoi region, Southeastern Gobi, Mongolia using ASTER reflectance and emissivity data. Int. J. Appl. Earth Obs. 2014, 26, 205–216. [Google Scholar] [CrossRef]


| Subsystem | Band | Spectral Range (μm) | Spatial Resolution (m) |
|---|---|---|---|
| VNIR | 1 | 0.52–0.60 | 15 |
| 2 | 0.63–0.69 | 15 | |
| 3 | 0.76–0.86 | 15 | |
| SWIR | 4 | 1.60–1.70 | 30 |
| 5 | 2.145–2.185 | 30 | |
| 6 | 2.185–2.225 | 30 | |
| 7 | 2.235–2.285 | 30 | |
| 8 | 2.295–2.365 | 30 | |
| 9 | 2.36–2.43 | 30 | |
| TIR | 10 | 8.125–8.475 | 90 |
| 11 | 8.475–8.825 | 90 | |
| 12 | 8.925–9.275 | 90 | |
| 13 | 10.25–10.95 | 90 | |
| 14 | 10.95–11.65 | 90 |
| QI | CI | MI4 | B2/B1 | B1/B2 + B5/B4 | (B5 + B7)/B6 | (B6 + B9)/B8 | |
|---|---|---|---|---|---|---|---|
| Tc | M-H | H(1.3–1.41) | L | ||||
| Tp | L | L | M | L-M | L | H(2.20–2.28) | L |
| K? | L | L | H | L | M | L-M | L |
| Kd | L | L | H(0.856–0.893) | L | M-H | H(2.09–2.20) | M |
| Kv2 | L | L | H | Interbedded H (1.2–1.29) | M-H | Interbedded H | L-M |
| Ks | L | Partially H | H(1.29–1.40) | L | L | Partially H | |
| Kv1 | L | L | H(0.866–0.885) | L | H(1.72–1.85) | L | H(1.90–1.98) |
| Kl | L | H(1.047–1.051) | M | L | L | H(2.21–2.40) | |
| Jmd | L | M | M | L-M | Interbedded M | L | Interbedded M-H |
| TrJmc | L | H(1.046–1.049) | L | M | M | H(2.02–2.12) | |
| Trmb | M-H | M | L-M | H(2.14–2.22) | L | ||
| Trma | M-H | M | L-M | M | L-M | Locally M | |
| mm | L | L | H(1.80–1.87) | L-M | M-H | ||
| mm-o | Blocky H (0.548–0.558) | Blocky H | Blocky H (0.851–0.883) | L | H(1.81–1.93) | L–M | Blocky H (2.06–2.14) |
© 2018 by the authors. Licensee MDPI, Basel, Switzerland. This article is an open access article distributed under the terms and conditions of the Creative Commons Attribution (CC BY) license (http://creativecommons.org/licenses/by/4.0/).
Share and Cite
Zhang, R.; Zeng, M. Mapping Lithologic Components of Ophiolitic Mélanges Based on ASTER Spectral Analysis: A Case Study from the Bangong-Nujiang Suture Zone (Tibet, China). ISPRS Int. J. Geo-Inf. 2018, 7, 34. https://doi.org/10.3390/ijgi7010034
Zhang R, Zeng M. Mapping Lithologic Components of Ophiolitic Mélanges Based on ASTER Spectral Analysis: A Case Study from the Bangong-Nujiang Suture Zone (Tibet, China). ISPRS International Journal of Geo-Information. 2018; 7(1):34. https://doi.org/10.3390/ijgi7010034
Chicago/Turabian StyleZhang, Ruisi, and Min Zeng. 2018. "Mapping Lithologic Components of Ophiolitic Mélanges Based on ASTER Spectral Analysis: A Case Study from the Bangong-Nujiang Suture Zone (Tibet, China)" ISPRS International Journal of Geo-Information 7, no. 1: 34. https://doi.org/10.3390/ijgi7010034