Next Issue
Volume 7, February
Previous Issue
Volume 6, December


ISPRS Int. J. Geo-Inf., Volume 7, Issue 1 (January 2018) – 37 articles

Cover Story (view full-size image): 
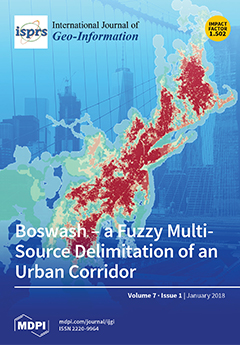
Are we in Boswash yet? The extent of urban areas is commonly defined through administrative boundaries. The actual built-up area, urban catchment or economic linkage is, however, not adequately represented through artificial, fixed boundaries. In order to spatially delimit a very large urban area—the Boston to Washington (Boswash) urban corridor—we use multi-source geodata based on a grid and not on administrative units. Using thresholds on the input data, we construct Boswash as varying connected territorial spaces, thus overcoming a dichotomous classification in favor of a probability-based differentiation. The approach can be modified (e.g., through different input layers or weighting) without changing the underlying idea, i.e., the probability of an area being part of a region such as Boswash is flexible. View this paper
  • Issues are regarded as officially published after their release is announced to the table of contents alert mailing list.
  • You may sign up for e-mail alerts to receive table of contents of newly released issues.
  • PDF is the official format for papers published in both, html and pdf forms. To view the papers in pdf format, click on the "PDF Full-text" link, and use the free Adobe Reader to open them.
Order results
Result details
Select all
Export citation of selected articles as:
14 pages, 4617 KiB  
Article
Traffic Command Gesture Recognition for Virtual Urban Scenes Based on a Spatiotemporal Convolution Neural Network
by Chunyong Ma, Yu Zhang, Anni Wang, Yuan Wang and Ge Chen
ISPRS Int. J. Geo-Inf. 2018, 7(1), 37; https://doi.org/10.3390/ijgi7010037 - 22 Jan 2018
Cited by 30 | Viewed by 5824
Abstract
Intelligent recognition of traffic police command gestures increases authenticity and interactivity in virtual urban scenes. To actualize real-time traffic gesture recognition, a novel spatiotemporal convolution neural network (ST-CNN) model is presented. We utilized Kinect 2.0 to construct a traffic police command gesture skeleton [...] Read more.
Intelligent recognition of traffic police command gestures increases authenticity and interactivity in virtual urban scenes. To actualize real-time traffic gesture recognition, a novel spatiotemporal convolution neural network (ST-CNN) model is presented. We utilized Kinect 2.0 to construct a traffic police command gesture skeleton (TPCGS) dataset collected from 10 volunteers. Subsequently, convolution operations on the locational change of each skeletal point were performed to extract temporal features, analyze the relative positions of skeletal points, and extract spatial features. After temporal and spatial features based on the three-dimensional positional information of traffic police skeleton points were extracted, the ST-CNN model classified positional information into eight types of Chinese traffic police gestures. The test accuracy of the ST-CNN model was 96.67%. In addition, a virtual urban traffic scene in which real-time command tests were carried out was set up, and a real-time test accuracy rate of 93.0% was achieved. The proposed ST-CNN model ensured a high level of accuracy and robustness. The ST-CNN model recognized traffic command gestures, and such recognition was found to control vehicles in virtual traffic environments, which enriches the interactive mode of the virtual city scene. Traffic command gesture recognition contributes to smart city construction. Full article
Show Figures

Figure 1

18 pages, 3473 KiB  
Article
Framework for Virtual Cognitive Experiment in Virtual Geographic Environments
by Fan Zhang, Mingyuan Hu, Weitao Che, Hui Lin and Chaoyang Fang
ISPRS Int. J. Geo-Inf. 2018, 7(1), 36; https://doi.org/10.3390/ijgi7010036 - 22 Jan 2018
Cited by 31 | Viewed by 6262
Abstract
Virtual Geographic Environment Cognition is the attempt to understand the human cognition of surface features, geographic processes, and human behaviour, as well as their relationships in the real world. From the perspective of human cognition behaviour analysis and simulation, previous work in Virtual [...] Read more.
Virtual Geographic Environment Cognition is the attempt to understand the human cognition of surface features, geographic processes, and human behaviour, as well as their relationships in the real world. From the perspective of human cognition behaviour analysis and simulation, previous work in Virtual Geographic Environments (VGEs) has focused mostly on representing and simulating the real world to create an ‘interpretive’ virtual world and improve an individual’s active cognition. In terms of reactive cognition, building a user ‘evaluative’ environment in a complex virtual experiment is a necessary yet challenging task. This paper discusses the outlook of VGEs and proposes a framework for virtual cognitive experiments. The framework not only employs immersive virtual environment technology to create a realistic virtual world but also involves a responsive mechanism to record the user’s cognitive activities during the experiment. Based on the framework, this paper presents two potential implementation methods: first, training a deep learning model with several hundred thousand street view images scored by online volunteers, with further analysis of which visual factors produce a sense of safety for the individual, and second, creating an immersive virtual environment and Electroencephalogram (EEG)-based experimental paradigm to both record and analyse the brain activity of a user and explore what type of virtual environment is more suitable and comfortable. Finally, we present some preliminary findings based on the first method. Full article
Show Figures

Figure 1

19 pages, 6352 KiB  
Article
Short-Range Prediction of the Zone of Moving Vehicles in Arterial Networks
by Rouzbeh Forouzandeh Jonaghani, Sepehr Honarparvar and Navid Khademi
ISPRS Int. J. Geo-Inf. 2018, 7(1), 35; https://doi.org/10.3390/ijgi7010035 - 22 Jan 2018
Viewed by 3695
Abstract
In many moving object databases, future locations of vehicles in arterial networks are predicted. While most of studies apply the frequent behavior of historical trajectories or vehicles’ recent kinematics as the basis of predictions, consideration of the dynamics of the intersections is mostly [...] Read more.
In many moving object databases, future locations of vehicles in arterial networks are predicted. While most of studies apply the frequent behavior of historical trajectories or vehicles’ recent kinematics as the basis of predictions, consideration of the dynamics of the intersections is mostly neglected. Signalized intersections make vehicles experience different delays, which vary from zero to some minutes based on the traffic state at intersections. In the absence of traffic signal information (red and green times of traffic signal phases, the queue lengths, approaching traffic volume, turning volumes to each intersection leg, etc.), the experienced delays in traffic signals are random variables. In this paper, we model the probability distribution function (PDF) and cumulative distribution function (CDF) of the delay for any point in the arterial networks based on a spatiotemporal model of the queue at the intersection. The probability of the presence of a vehicle in a zone is determined based on the modeled probability function of the delay. A comparison between the results of the proposed method and a well-known kinematic-based method indicates a significant improvement in the precisions of the predictions. Full article
Show Figures

Figure 1

26 pages, 39834 KiB  
Article
Mapping Lithologic Components of Ophiolitic Mélanges Based on ASTER Spectral Analysis: A Case Study from the Bangong-Nujiang Suture Zone (Tibet, China)
by Ruisi Zhang and Min Zeng
ISPRS Int. J. Geo-Inf. 2018, 7(1), 34; https://doi.org/10.3390/ijgi7010034 - 22 Jan 2018
Cited by 11 | Viewed by 4544
Abstract
ASTER (Advanced Spaceborne Thermal Emission and Reflection) satellite imagery is useful in assisting lithologic mapping and, however, its effectiveness is yet to be evaluated for lithologic complex such as tectonic mélange. The Mugagangri Group (MG), the signature unit of the Bangong-Nujiang suture zone [...] Read more.
ASTER (Advanced Spaceborne Thermal Emission and Reflection) satellite imagery is useful in assisting lithologic mapping and, however, its effectiveness is yet to be evaluated for lithologic complex such as tectonic mélange. The Mugagangri Group (MG), the signature unit of the Bangong-Nujiang suture zone (BNSZ), Tibet and consisting of ophiolitic mélanges, was previously mapped as a single unit due to its poorly-described internal structures and an informative map with refined lithologic subdivision is needed for future petrologic and tectonic studies. In this paper, based on a combination of field work and ASTER data analysis, the MG is mapped as five subunits according to our newly-proposed lithologic subdivision scheme. In particular, we apply a data-processing sequence to first analyze the TIR band ratios to reveal approximate distribution of carbonates and silicate-dominated lithologies and then the VNIR/SWIR band ratios and false color images to differentiate the lithologic units and delineate their boundaries. The generalized procedures of ASTER data processing and lithologic mapping are applicable for future studies in not only the BNSZ but also other Tibetan ranges. Moreover, the mapping result is consistent with that the MG represents an accretionary complex accreted to the south Qiangtang margin as a result of northward-subduction of the Bangong-Nujiang oceanic crust. Full article
Show Figures

Figure 1

17 pages, 5532 KiB  
Article
Real-Time Location-Based Rendering of Urban Underground Pipelines
by Wei Li, Yong Han, Yu Liu, Chenrong Zhu, Yibin Ren, Yanjie Wang and Ge Chen
ISPRS Int. J. Geo-Inf. 2018, 7(1), 32; https://doi.org/10.3390/ijgi7010032 - 21 Jan 2018
Cited by 20 | Viewed by 6169
Abstract
The concealment and complex spatial relationships of urban underground pipelines present challenges in managing them. Recently, augmented reality (AR) has been a hot topic around the world, because it can enhance our perception of reality by overlaying information about the environment and its [...] Read more.
The concealment and complex spatial relationships of urban underground pipelines present challenges in managing them. Recently, augmented reality (AR) has been a hot topic around the world, because it can enhance our perception of reality by overlaying information about the environment and its objects onto the real world. Using AR, underground pipelines can be displayed accurately, intuitively, and in real time. We analyzed the characteristics of AR and their application in underground pipeline management. We mainly focused on the AR pipeline rendering procedure based on the BeiDou Navigation Satellite System (BDS) and simultaneous localization and mapping (SLAM) technology. First, in aiming to improve the spatial accuracy of pipeline rendering, we used differential corrections received from the Ground-Based Augmentation System to compute the precise coordinates of users in real time, which helped us accurately retrieve and draw pipelines near the users, and by scene recognition the accuracy can be further improved. Second, in terms of pipeline rendering, we used Visual-Inertial Odometry (VIO) to track the rendered objects and made some improvements to visual effects, which can provide steady dynamic tracking of pipelines even in relatively markerless environments and outdoors. Finally, we used the occlusion method based on real-time 3D reconstruction to realistically express the immersion effect of underground pipelines. We compared our methods to the existing methods and concluded that the method proposed in this research improves the spatial accuracy of pipeline rendering and the portability of the equipment. Moreover, the updating of our rendering procedure corresponded with the moving of the user’s location, thus we achieved a dynamic rendering of pipelines in the real environment. Full article
Show Figures

Figure 1

20 pages, 5663 KiB  
Article
Uncertainty in Upscaling In Situ Soil Moisture Observations to Multiscale Pixel Estimations with Kriging at the Field Level
by Xiaohu Zhang, Wenjun Zuo, Shengli Zhao, Li Jiang, Linhai Chen and Yan Zhu
ISPRS Int. J. Geo-Inf. 2018, 7(1), 33; https://doi.org/10.3390/ijgi7010033 - 20 Jan 2018
Cited by 10 | Viewed by 4356
Abstract
Upscaling in situ soil moisture observations (ISMO) to multiscale pixel estimations with kriging is a key step in the comprehensive usage of ISMO and remote sensing (RS) soil moisture data. Scale effects occur and introduce uncertainties during upscaling processes because of spatial heterogeneity [...] Read more.
Upscaling in situ soil moisture observations (ISMO) to multiscale pixel estimations with kriging is a key step in the comprehensive usage of ISMO and remote sensing (RS) soil moisture data. Scale effects occur and introduce uncertainties during upscaling processes because of spatial heterogeneity and the kriging method. A nested hierarchical scale series was established at the field level, and upscaled estimations at each scale were obtained by block kriging (BK) to illustrate multiscale ISMO upscaling processes. Those uncertainties were described with the results of comparison analysis against RS data, statistical analysis, and spatial trend surface analysis on multiscale estimations and were explained from the spatial heterogeneity perspective with a semivariogram analysis on ISMO. The results show that uncertainties exist and vary in multiscale upscaling processes, and the range of the empirical semivariogram could indicate scale effects. When the target scale is shorter than the range, BK maintains similar scale effects and global trends during upscaling processes, and the direct pixel estimation by BK is relatively close to the average of nested pixel estimations. This has great implications for understanding the kriging method in similar works. Full article
Show Figures

Figure 1

18 pages, 4812 KiB  
Article
A Hybrid Approach Combining the Multi-Temporal Scale Spatio-Temporal Network with the Continuous Triangular Model for Exploring Dynamic Interactions in Movement Data: A Case Study of Football
by Pengdong Zhang, Jasper Beernaerts and Nico Van de Weghe
ISPRS Int. J. Geo-Inf. 2018, 7(1), 31; https://doi.org/10.3390/ijgi7010031 - 20 Jan 2018
Cited by 6 | Viewed by 4746
Abstract
Benefiting from recent advantages in location-aware technologies, movement data are becoming ubiquitous. Hence, numerous research topics with respect to movement data have been undertaken. Yet, the research of dynamic interactions in movement data is still in its infancy. In this paper, we propose [...] Read more.
Benefiting from recent advantages in location-aware technologies, movement data are becoming ubiquitous. Hence, numerous research topics with respect to movement data have been undertaken. Yet, the research of dynamic interactions in movement data is still in its infancy. In this paper, we propose a hybrid approach combining the multi-temporal scale spatio-temporal network (MTSSTN) and the continuous triangular model (CTM) for exploring dynamic interactions in movement data. The approach mainly includes four steps: first, the relative trajectory calculus (RTC) is used to derive three types of interaction patterns; second, for each interaction pattern, a corresponding MTSSTN is generated; third, for each MTSSTN, the interaction intensity measures and three centrality measures (i.e., degree, betweenness and closeness) are calculated; finally, the results are visualized at multiple temporal scales using the CTM and analyzed based on the generated CTM diagrams. Based on the proposed approach, three distinctive aims can be achieved for each interaction pattern at multiple temporal scales: (1) exploring the interaction intensities between any two individuals; (2) exploring the interaction intensities among multiple individuals, and (3) exploring the importance of each individual and identifying the most important individuals. The movement data obtained from a real football match are used as a case study to validate the effectiveness of the proposed approach. The results demonstrate that the proposed approach is useful in exploring dynamic interactions in football movement data and discovering insightful information. Full article
Show Figures

Figure 1

16 pages, 3934 KiB  
Article
Comparison of Split Window Algorithms for Retrieving Measurements of Sea Surface Temperature from MODIS Data in Near-Land Coastal Waters
by Rosa Maria Cavalli
ISPRS Int. J. Geo-Inf. 2018, 7(1), 30; https://doi.org/10.3390/ijgi7010030 - 18 Jan 2018
Cited by 11 | Viewed by 4401
Abstract
Split window (SW) methods, which have been successfully used to retrieve measurements of land surface temperature (LST) and sea surface temperature (SST) from MODIS images, were exploited to evaluate the SST data of three sections of Italian coastal waters. For this purpose, sea [...] Read more.
Split window (SW) methods, which have been successfully used to retrieve measurements of land surface temperature (LST) and sea surface temperature (SST) from MODIS images, were exploited to evaluate the SST data of three sections of Italian coastal waters. For this purpose, sea surface emissivity (SSE) values were estimated by adding the effects of salinity and total suspended particulate matter (SPM) concentrations, sea surface wind speed, and zenith observation angle. The total column atmospheric water vapor contents were retrieved from MODIS data. SST data retrieved from MODIS images using these algorithms were compared with SSTskin measurements evaluated from in situ data. The comparison showed that the algorithms for retrieving LST measurements minimized the error in SST data in near-land coastal waters with respect to the algorithms for retrieving SST measurements: a method for retrieving LST measurements highlighted the smallest root-mean-square deviation (RMSD) value (0.48 K) and values of maximum bias and standard deviation (σ) equal to −3.45 K and 0.41 K; the current operation algorithm for retrieving LST data highlighted the smallest values of maximum bias and σ (−1.37 K and 0.35 K) and an RMSD value of 0.66 K; and the current operation algorithm for retrieving global measurements of SST showed values of RMSD, maximum bias, and σ equal to 0.68 K, −1.90 K, and 0.40 K, respectively. Full article
Show Figures

Graphical abstract

18 pages, 3483 KiB  
Article
Assessment of Tangible Direct Flood Damage Using a Spatial Analysis Approach under the Effects of Climate Change: Case Study in an Urban Watershed in Hanoi, Vietnam
by Mohamed Kefi, Binaya Kumar Mishra, Pankaj Kumar, Yoshifumi Masago and Kensuke Fukushi
ISPRS Int. J. Geo-Inf. 2018, 7(1), 29; https://doi.org/10.3390/ijgi7010029 - 16 Jan 2018
Cited by 32 | Viewed by 8069
Abstract
Due to climate change, the frequency and intensity of Hydro-Meteorological disasters, such as floods, are increasing. Therefore, the main purpose of this work is to assess tangible future flood damage in the urban watershed of the To Lich River in Hanoi, Vietnam. An [...] Read more.
Due to climate change, the frequency and intensity of Hydro-Meteorological disasters, such as floods, are increasing. Therefore, the main purpose of this work is to assess tangible future flood damage in the urban watershed of the To Lich River in Hanoi, Vietnam. An approach based on spatial analysis, which requires the integration of several types of data related to flood characteristics that include depth, in particular, land-use classes, property values, and damage rates, is applied for the analysis. To simulate the future scenarios of flooding, the effects of climate change and land-use changes are estimated for 2030. Additionally, two scenarios based on the implementation of flood control measures are analyzed to demonstrate the effect of adaptation strategies. The findings show that climate change combined with the expansion of built-up areas increases the vulnerability of urban areas to flooding and economic damage. The results also reveal that the impacts of climate change will increase the total damage from floods by 26%. However, appropriate flood mitigation will be helpful in reducing the impacts of losses from floods by approximately 8% with the restoration of lakes and by approximately 29% with the implementation of water-sensitive urban design (WSUD). This study will be useful in helping to identify and map flood-prone areas at local and regional scales, which can lead to the detection and prioritization of exposed areas for appropriate countermeasures in a timely manner. In addition, the quantification of flood damage can be an important indicator to enhance the awareness of local decision-makers on improving the efficiency of regional flood risk reduction strategies. Full article
Show Figures

Figure 1

27 pages, 7756 KiB  
Article
A Knowledge Base for Automatic Feature Recognition from Point Clouds in an Urban Scene
by Xu-Feng Xing, Mir-Abolfazl Mostafavi and Seyed Hossein Chavoshi
ISPRS Int. J. Geo-Inf. 2018, 7(1), 28; https://doi.org/10.3390/ijgi7010028 - 16 Jan 2018
Cited by 12 | Viewed by 5295
Abstract
LiDAR technology can provide very detailed and highly accurate geospatial information on an urban scene for the creation of Virtual Geographic Environments (VGEs) for different applications. However, automatic 3D modeling and feature recognition from LiDAR point clouds are very complex tasks. This becomes [...] Read more.
LiDAR technology can provide very detailed and highly accurate geospatial information on an urban scene for the creation of Virtual Geographic Environments (VGEs) for different applications. However, automatic 3D modeling and feature recognition from LiDAR point clouds are very complex tasks. This becomes even more complex when the data is incomplete (occlusion problem) or uncertain. In this paper, we propose to build a knowledge base comprising of ontology and semantic rules aiming at automatic feature recognition from point clouds in support of 3D modeling. First, several modules for ontology are defined from different perspectives to describe an urban scene. For instance, the spatial relations module allows the formalized representation of possible topological relations extracted from point clouds. Then, a knowledge base is proposed that contains different concepts, their properties and their relations, together with constraints and semantic rules. Then, instances and their specific relations form an urban scene and are added to the knowledge base as facts. Based on the knowledge and semantic rules, a reasoning process is carried out to extract semantic features of the objects and their components in the urban scene. Finally, several experiments are presented to show the validity of our approach to recognize different semantic features of buildings from LiDAR point clouds. Full article
Show Figures

Figure 1

22 pages, 4661 KiB  
Article
Developing an Agent-Based Simulation System for Post-Earthquake Operations in Uncertainty Conditions: A Proposed Method for Collaboration among Agents
by Navid Hooshangi and Ali Asghar Alesheikh
ISPRS Int. J. Geo-Inf. 2018, 7(1), 27; https://doi.org/10.3390/ijgi7010027 - 15 Jan 2018
Cited by 29 | Viewed by 5556
Abstract
Agent-based modeling is a promising approach for developing simulation tools for natural hazards in different areas, such as during urban search and rescue (USAR) operations. The present study aimed to develop a dynamic agent-based simulation model in post-earthquake USAR operations using geospatial information [...] Read more.
Agent-based modeling is a promising approach for developing simulation tools for natural hazards in different areas, such as during urban search and rescue (USAR) operations. The present study aimed to develop a dynamic agent-based simulation model in post-earthquake USAR operations using geospatial information system and multi agent systems (GIS and MASs, respectively). We also propose an approach for dynamic task allocation and establishing collaboration among agents based on contract net protocol (CNP) and interval-based Technique for Order of Preference by Similarity to Ideal Solution (TOPSIS) methods, which consider uncertainty in natural hazards information during agents’ decision-making. The decision-making weights were calculated by analytic hierarchy process (AHP). In order to implement the system, earthquake environment was simulated and the damage of the buildings and a number of injuries were calculated in Tehran’s District 3: 23%, 37%, 24% and 16% of buildings were in slight, moderate, extensive and completely vulnerable classes, respectively. The number of injured persons was calculated to be 17,238. Numerical results in 27 scenarios showed that the proposed method is more accurate than the CNP method in the terms of USAR operational time (at least 13% decrease) and the number of human fatalities (at least 9% decrease). In interval uncertainty analysis of our proposed simulated system, the lower and upper bounds of uncertain responses are evaluated. The overall results showed that considering uncertainty in task allocation can be a highly advantageous in the disaster environment. Such systems can be used to manage and prepare for natural hazards. Full article
Show Figures

Figure 1

20 pages, 7870 KiB  
Article
Approach to Accelerating Dissolved Vector Buffer Generation in Distributed In-Memory Cluster Architecture
by Jinxin Shen, Luo Chen, Ye Wu and Ning Jing
ISPRS Int. J. Geo-Inf. 2018, 7(1), 26; https://doi.org/10.3390/ijgi7010026 - 15 Jan 2018
Cited by 11 | Viewed by 4660
Abstract
The buffer generation algorithm is a fundamental function in GIS, identifying areas of a given distance surrounding geographic features. Past research largely focused on buffer generation algorithms generated in a stand-alone environment. Moreover, dissolved buffer generation is data- and computing-intensive. In this scenario, [...] Read more.
The buffer generation algorithm is a fundamental function in GIS, identifying areas of a given distance surrounding geographic features. Past research largely focused on buffer generation algorithms generated in a stand-alone environment. Moreover, dissolved buffer generation is data- and computing-intensive. In this scenario, the improvement in the stand-alone environment is limited when considering large-scale mass vector data. Nevertheless, recent parallel dissolved vector buffer algorithms suffer from scalability problems, leaving room for further optimization. At present, the prevailing in-memory cluster-computing framework—Spark—provides promising efficiency for computing-intensive analysis; however, it has seldom been researched for buffer analysis. On this basis, we propose a cluster-computing-oriented parallel dissolved vector buffer generating algorithm, called the HPBM, that contains a Hilbert-space-filling-curve-based data partition method, a data skew and cross-boundary objects processing strategy, and a depth-given tree-like merging method. Experiments are conducted in both stand-alone and cluster environments using real-world vector data that include points and roads. Compared with some existing parallel buffer algorithms, as well as various popular GIS software, the HPBM achieves a performance gain of more than 50%. Full article
(This article belongs to the Special Issue Geospatial Big Data and Urban Studies)
Show Figures

Figure 1

20 pages, 8346 KiB  
Article
Detecting Anomalous Trajectories and Behavior Patterns Using Hierarchical Clustering from Taxi GPS Data
by Yulong Wang, Kun Qin, Yixiang Chen and Pengxiang Zhao
ISPRS Int. J. Geo-Inf. 2018, 7(1), 25; https://doi.org/10.3390/ijgi7010025 - 12 Jan 2018
Cited by 87 | Viewed by 7242
Abstract
Anomalous taxi trajectories are those chosen by a small number of drivers that are different from the regular choices of other drivers. These anomalous driving trajectories provide us an opportunity to extract driver or passenger behaviors and monitor adverse urban traffic events. Because [...] Read more.
Anomalous taxi trajectories are those chosen by a small number of drivers that are different from the regular choices of other drivers. These anomalous driving trajectories provide us an opportunity to extract driver or passenger behaviors and monitor adverse urban traffic events. Because various trajectory clustering methods have previously proven to be an effective means to analyze similarities and anomalies within taxi GPS trajectory data, we focus on the problem of detecting anomalous taxi trajectories, and we develop our trajectory clustering method based on the edit distance and hierarchical clustering. To achieve this objective, first, we obtain all the taxi trajectories crossing the same source–destination pairs from taxi trajectories and take these trajectories as clustering objects. Second, an edit distance algorithm is modified to measure the similarity of the trajectories. Then, we distinguish regular trajectories and anomalous trajectories by applying adaptive hierarchical clustering based on an optimal number of clusters. Moreover, we further analyze these anomalous trajectories and discover four anomalous behavior patterns to speculate on the cause of an anomaly based on statistical indicators of time and length. The experimental results show that the proposed method can effectively detect anomalous trajectories and can be used to infer clearly fraudulent driving routes and the occurrence of adverse traffic events. Full article
Show Figures

Figure 1

14 pages, 250 KiB  
Editorial
Acknowledgement to Reviewers of IJGI in 2017
by IJGI Editorial Office
ISPRS Int. J. Geo-Inf. 2018, 7(1), 24; https://doi.org/10.3390/ijgi7010024 - 12 Jan 2018
Cited by 1 | Viewed by 3278
Abstract
Peer review is an essential part in the publication process, ensuring that IJGI maintains high quality standards for its published papers. In 2017, a total of 403 papers were published in the journal.[...] Full article
17 pages, 2953 KiB  
Article
Spatial Analysis of Clustering of Foreclosures in the Poorest-Quality Housing Urban Areas: Evidence from Catalan Cities
by Aaron Gutiérrez and Josep-Maria Arauzo-Carod
ISPRS Int. J. Geo-Inf. 2018, 7(1), 23; https://doi.org/10.3390/ijgi7010023 - 12 Jan 2018
Cited by 16 | Viewed by 4437
Abstract
This paper uses data on housing stock owned by financial entities as a result of foreclosures to analyze (1) the spatial logic of Spain’s mortgage crisis in urban areas, and (2) the characteristics of the types of housing most affected by this phenomenon. [...] Read more.
This paper uses data on housing stock owned by financial entities as a result of foreclosures to analyze (1) the spatial logic of Spain’s mortgage crisis in urban areas, and (2) the characteristics of the types of housing most affected by this phenomenon. Nearest-Neighbor Index and Ripley’s K function analyses were applied in two Catalan cities (Tarragona and Terrassa). The results obtained show that foreclosures tend to be concentrated in the most deprived neighborhoods. The general pattern of clustering also tends to be most intense for smaller and cheaper housing. Our findings show that home foreclosures have been concentrated in only a few neighborhoods and precisely in those containing the poorest-quality housing stock. They also provide new evidence of the characteristics and spatial patterns of the housing stock accumulated by banks in Catalonia as a result of the recent wave of evictions associated with foreclosures. Full article
Show Figures

Figure 1

27 pages, 6466 KiB  
Article
Inverse Parametrization of a Regional Groundwater Flow Model with the Aid of Modelling and GIS: Test and Application of Different Approaches
by Muhammad Usman, Thomas Reimann, Rudolf Liedl, Azhar Abbas, Christopher Conrad and Shoaib Saleem
ISPRS Int. J. Geo-Inf. 2018, 7(1), 22; https://doi.org/10.3390/ijgi7010022 - 12 Jan 2018
Cited by 10 | Viewed by 5421
Abstract
The use of inverse methods allow efficient model calibration. This study employs PEST to calibrate a large catchment scale transient flow model. Results are demonstrated by comparing manually calibrated approaches with the automated approach. An advanced Tikhonov regularization algorithm was employed for carrying [...] Read more.
The use of inverse methods allow efficient model calibration. This study employs PEST to calibrate a large catchment scale transient flow model. Results are demonstrated by comparing manually calibrated approaches with the automated approach. An advanced Tikhonov regularization algorithm was employed for carrying out the automated pilot point (PP) method. The results indicate that automated PP is more flexible and robust as compared to other approaches. Different statistical indicators show that this method yields reliable calibration as values of coefficient of determination (R2) range from 0.98 to 0.99, Nash Sutcliffe efficiency (ME) range from 0.964 to 0.976, and root mean square errors (RMSE) range from 1.68 m to 1.23 m, for manual and automated approaches, respectively. Validation results of automated PP show ME as 0.969 and RMSE as 1.31 m. The results of output sensitivity suggest that hydraulic conductivity is a more influential parameter. Considering the limitations of the current study, it is recommended to perform global sensitivity and linear uncertainty analysis for the better estimation of the modelling results. Full article
Show Figures

Figure 1

16 pages, 9708 KiB  
Technical Note
Application of Geospatial Techniques for Groundwater Quality and Availability Assessment: A Case Study in Jaffna Peninsula, Sri Lanka
by Kuddithamby Gunaalan, Manjula Ranagalage, M. H. J. P. Gunarathna, M. K. N. Kumari, Meththika Vithanage, Tharmalingam Srivaratharasan, Suntharalingam Saravanan and T.W.S. Warnasuriya
ISPRS Int. J. Geo-Inf. 2018, 7(1), 20; https://doi.org/10.3390/ijgi7010020 - 12 Jan 2018
Cited by 32 | Viewed by 8433
Abstract
Groundwater is one of the most important natural resources in the northern coastal belt of Sri Lanka, as there are no major water supply schemes or perennial rivers. Overexploitation, seawater intrusion and persistent pollution of this vital resource are threatening human health as [...] Read more.
Groundwater is one of the most important natural resources in the northern coastal belt of Sri Lanka, as there are no major water supply schemes or perennial rivers. Overexploitation, seawater intrusion and persistent pollution of this vital resource are threatening human health as well as ecosystems in the Jaffna Peninsula. Therefore, the main intent of the present paper is to apply geospatial techniques to assess the spatial variation of groundwater quality and availability for the sustainable management of groundwater in the coastal areas. The electrical conductivity (EC) and depth to water (DTW) of 41 wells were measured during the period from March to June 2014, which represents the dry period of the study area. Surface interpolation, gradient analysis, a local indicators of spatial autocorrelations (LISA) and statistical analysis were used to assess the quality and availability of groundwater. The results revealed that the drinking and irrigation water quality in the study area were poor and further deteriorated with the progression of the dry season. Good quality and availability of groundwater were observed in the western zone compared to other zones of the study area. A negative correlation was identified between depth to water and electrical conductivity in the western zone. Hence, relatively deep wells in the western zone of the study area can be used to utilize the groundwater for drinking, domestic and agricultural purposes. The outcomes of this study can be used to formulate policy decisions for sustainable management of groundwater resources in Jaffna Peninsula. Full article
Show Figures

Graphical abstract

10 pages, 495 KiB  
Editorial
Geo-Information Tools, Governance, and Wicked Policy Problems
by Yola Georgiadou and Diana Reckien
ISPRS Int. J. Geo-Inf. 2018, 7(1), 21; https://doi.org/10.3390/ijgi7010021 - 11 Jan 2018
Cited by 10 | Viewed by 5459
Abstract
The emblematic intergovernmental Group of Earth Observations (GEO) sees food, water and energy security, natural hazards, pandemics of infectious diseases, sustainability of key services, poverty, and climate change as societal challenges [...]
Full article
(This article belongs to the Special Issue Innovative Geo-Information Tools for Governance)
Show Figures

Figure 1

16 pages, 1593 KiB  
Article
Higher Order Support Vector Random Fields for Hyperspectral Image Classification
by Junli Yang, Zhiguo Jiang, Shuang Hao and Haopeng Zhang
ISPRS Int. J. Geo-Inf. 2018, 7(1), 19; https://doi.org/10.3390/ijgi7010019 - 11 Jan 2018
Cited by 7 | Viewed by 3690
Abstract
This paper addresses the problem of contextual hyperspectral image (HSI) classification. A novel conditional random fields (CRFs) model, known as higher order support vector random fields (HSVRFs), is proposed for HSI classification. By incorporating higher order potentials into a support vector random fields [...] Read more.
This paper addresses the problem of contextual hyperspectral image (HSI) classification. A novel conditional random fields (CRFs) model, known as higher order support vector random fields (HSVRFs), is proposed for HSI classification. By incorporating higher order potentials into a support vector random fields with a Mahalanobis distance boundary constraint (SVRFMC) model, the HSVRFs model not only takes advantage of the support vector machine (SVM) classifier and the Mahalanobis distance boundary constraint, but can also capture higher level contextual information to depict complicated details in HSI. The higher order potentials are defined on image segments, which are created by a fast unsupervised over-segmentation algorithm. The higher order potentials consider the spectral vectors of each of the segment’s constituting pixels coherently, and weight these pixels with the output probability of the support vector machine (SVM) classifier in our framework. Therefore, the higher order potentials can model higher-level contextual information, which is useful for the description of challenging complex structures and boundaries in HSI. Experimental results on two publicly available HSI datasets show that the HSVRFs model outperforms traditional and state-of-the art methods in HSI classification, especially for datasets containing complicated details. Full article
Show Figures

Figure 1

23 pages, 6808 KiB  
Article
Graph-Optimization-Based ZUPT/UWB Fusion Algorithm
by Yan Wang and Xin Li
ISPRS Int. J. Geo-Inf. 2018, 7(1), 18; https://doi.org/10.3390/ijgi7010018 - 10 Jan 2018
Cited by 13 | Viewed by 4333
Abstract
The potential of multi-sensor fusion for indoor positioning has attracted substantial attention. A ZUPT/UWB data fusion algorithm based on graph optimization is proposed in this paper and is compared with the traditional fusion algorithms, which are based on particle filtering. With a series [...] Read more.
The potential of multi-sensor fusion for indoor positioning has attracted substantial attention. A ZUPT/UWB data fusion algorithm based on graph optimization is proposed in this paper and is compared with the traditional fusion algorithms, which are based on particle filtering. With a series of observations, the proposed algorithm can achieve higher precision with acceptable computational complexity. Two methods for dynamically determining the confidence level are also presented. The first method can reduce the confidence level of ZUPT at corners, and the second method can determine the lower bound on the UWB sensor’s confidence level through the UWB optimized residual. Experimental results demonstrate the ability of the proposed method to achieve a positioning accuracy of 0.4 m, which is better than the 0.7 m achieved by the particle-filtering-based fusion method. Full article
Show Figures

Figure 1

16 pages, 2705 KiB  
Article
Geographically Weighted Regression in the Analysis of Unemployment in Poland
by Karolina Lewandowska-Gwarda
ISPRS Int. J. Geo-Inf. 2018, 7(1), 17; https://doi.org/10.3390/ijgi7010017 - 10 Jan 2018
Cited by 29 | Viewed by 6839
Abstract
The main aim of this paper is an application of Geographically Weighted Regression (which enables the identification of the variability of regression coefficients in the geographical space) in the analysis of unemployment in Poland 2015. The study is conducted using 2015 statistical data [...] Read more.
The main aim of this paper is an application of Geographically Weighted Regression (which enables the identification of the variability of regression coefficients in the geographical space) in the analysis of unemployment in Poland 2015. The study is conducted using 2015 statistical data for 380 districts (LAU 1) in Poland. The research results show that the determinants of unemployment are diverse in the geographic space and do not have a significant impact on unemployment rates in all spatial units (LAU 1). The existence of clusters of districts, characterised by the influence of the variables and a similar strength of interactions, is confirmed. Geographically Weighted Regression (GWR) proved to be an extremely effective instrument of spatial data analysis. The model had a considerably better fit with empirical data than the global model, and it enabled the drawing of detailed conclusions concerning the local determinants of unemployment in Poland. Full article
Show Figures

Figure 1

18 pages, 7207 KiB  
Article
Assessment of Sustainable Livelihood and Geographic Detection of Settlement Sites in Ethnically Contiguous Poverty-Stricken Areas in the Aba Prefecture, China
by Yanguo Liu, Chengmin Huang, Qing Wang, Junwei Luan and Mingtao Ding
ISPRS Int. J. Geo-Inf. 2018, 7(1), 16; https://doi.org/10.3390/ijgi7010016 - 05 Jan 2018
Cited by 20 | Viewed by 6061
Abstract
The Chinese government aims to deal with poverty by 2020 for people living in ethnic and rural regions, including mountainous ethnic regions with the highest concentration of poverty and chronic poverty. Based on a sustainable livelihood Framework, five capitals and 33 evaluation indices [...] Read more.
The Chinese government aims to deal with poverty by 2020 for people living in ethnic and rural regions, including mountainous ethnic regions with the highest concentration of poverty and chronic poverty. Based on a sustainable livelihood Framework, five capitals and 33 evaluation indices of livelihood were built, and 13 counties’ resources of the Aba Tibetan and Qiang Autonomous Prefecture were compared in order to calculate the degree of poverty. Topographic factors index of settlement sites (TFIS) were constructed by eight topographic factors, and diagnoses of the dominant factors of differentiation of 2699 settlements were calculated by using the geographical detector model to establish the poverty alleviation policies and models for different regions. The results showed that the livelihood capital evaluation indices were different (0.56–1.88), and natural capitals (mean value 1.56) had obvious advantages, but physical (mean value 0.56), financial (mean value 0.78), and human capital were lower (mean value 0.93), limiting the rate of transforming the ecological resources advantage into the economy. In the TFIS, the settlement points indicate topographic factors of natural breakpoint classification superposition, including elevation, slope, relief amplitude, surface incision, variance coefficient in elevation, surface roughness, distance to roads, and distance to rivers. These are within the 8–34 range, and their power determinant value to TFIS are 0.02, 0.70, 0.77, 0.76, 0.51, 0.66, 0.06, and 0.09. Livelihood capital evaluation indices and TFIS classification one (8–14) are positively correlated, and negative correlation (22–26 and 27–34) is at the 0.05 level. The county's poverty alleviation measures and development under different livelihood indices and TFIS indicate that the ecotourism industry has become the inevitable choice for promoting rapid and coordinated development of economy, society, and the environment in ethnic regions. Full article
Show Figures

Figure 1

19 pages, 3726 KiB  
Article
Are We in Boswash Yet? A Multi-Source Geodata Approach to Spatially Delimit Urban Corridors
by Isabel Georg, Thomas Blaschke and Hannes Taubenböck
ISPRS Int. J. Geo-Inf. 2018, 7(1), 15; https://doi.org/10.3390/ijgi7010015 - 04 Jan 2018
Cited by 11 | Viewed by 10058
Abstract
The delimitation of urban space is conceptually elusive and fuzzy. Commonly, urban areas are delimited through administrative boundaries. These artificial, fixed boundaries, however, do not necessarily represent the actual built-up extent, the urban catchment, or the economic linkage within and across neighboring metropolitan [...] Read more.
The delimitation of urban space is conceptually elusive and fuzzy. Commonly, urban areas are delimited through administrative boundaries. These artificial, fixed boundaries, however, do not necessarily represent the actual built-up extent, the urban catchment, or the economic linkage within and across neighboring metropolitan regions. For an approach to spatially delimit an urban corridor—a generically defined concept of a massive urban area—we use the Boston to Washington (Boswash) region as an example. This area has been consistently conceptualized in literature as bounded urban space. We develop a method to spatially delimit the urban corridor using multi-source geodata (built-up extent, infrastructure and socioeconomic data) which are based on a grid rather than on administrative units. Threshold approaches for the input data serve to construct Boswash as varying connected territorial spaces, allowing us to investigate the variability of possible spatial forms of the area, i.e., to overcome the simple dichotomous classification in favor of a probability-based differentiation. Our transparent multi-layer approach, validated through income data, can easily be modified by using different input datasets while maintaining the underlying idea that the likelihood of an area being part of an urban corridor is flexible, i.e., in our case a factor of how many input layers return positive results. Full article
Show Figures

Figure 1

21 pages, 6303 KiB  
Article
A Geometric Framework for Detection of Critical Points in a Trajectory Using Convex Hulls
by Amin Hosseinpoor Milaghardan, Rahim Ali Abbaspour and Christophe Claramunt
ISPRS Int. J. Geo-Inf. 2018, 7(1), 14; https://doi.org/10.3390/ijgi7010014 - 04 Jan 2018
Cited by 5 | Viewed by 5208
Abstract
Large volumes of trajectory-based data require development of appropriate data manipulation mechanisms that will offer efficient computational solutions. In particular, identification of meaningful geometric points of such trajectories is still an open research issue. Detection of these critical points implies to identify self-intersecting, [...] Read more.
Large volumes of trajectory-based data require development of appropriate data manipulation mechanisms that will offer efficient computational solutions. In particular, identification of meaningful geometric points of such trajectories is still an open research issue. Detection of these critical points implies to identify self-intersecting, turning and curvature points so that specific geometric characteristics that are worth identifying could be denoted. This research introduces an approach called Trajectory Critical Point detection using Convex Hull (TCP-CH) to identify a minimum number of critical points. The results can be applied to large trajectory data sets in order to reduce storage costs and complexity for further data mining and analysis. The main principles of the TCP-CH algorithm include computing: convex areas, convex hull curvatures, turning points, and intersecting points. The experimental validation applied to Geolife trajectory dataset reveals that the proposed framework can identify most of intersecting points in reasonable computing time. Finally, comparison of the proposed algorithm with other methods, such as turning function shows that our approach performs relatively well when considering the overall detection quality and computing time. Full article
Show Figures

Figure 1

20 pages, 6192 KiB  
Article
Using Monte Carlo Simulation to Improve the Performance of Semivariograms for Choosing the Remote Sensing Imagery Resolution for Natural Resource Surveys: Case Study on Three Counties in East, Central, and West China
by Juanle Wang, Junxiang Zhu and Xuehua Han
ISPRS Int. J. Geo-Inf. 2018, 7(1), 13; https://doi.org/10.3390/ijgi7010013 - 04 Jan 2018
Cited by 2 | Viewed by 5337
Abstract
Semivariograms have been widely used in research to obtain optimal resolutions for ground features. To obtain the semivariogram curve and its attributes (range and sill), parameters including sample size (SS), maximum distance (MD), and group number ( [...] Read more.
Semivariograms have been widely used in research to obtain optimal resolutions for ground features. To obtain the semivariogram curve and its attributes (range and sill), parameters including sample size (SS), maximum distance (MD), and group number (GN) have to be defined, as well as a mathematic model for fitting the curve. However, a clear guide on parameter setting and model selection is currently not available. In this study, a Monte Carlo simulation-based approach (MCS) is proposed to enhance the performance of semivariograms by optimizing the parameters, and case studies in three regions are conducted to determine the optimal resolution for natural resource surveys. Those parameters are optimized one by one through several rounds of MCS. The result shows that exponential model is better than sphere model; sample size has a positive relationship with R2, while the group number has a negative one; increasing the simulation number could improve the accuracy of estimation; and eventually the optimized parameters improved the performance of semivariogram. In case study, the average sizes for three general ground features (grassland, farmland, and forest) of three counties (Ansai, Changdu, and Taihe) in different geophysical locations of China were acquired and compared, and imagery with an appropriate resolution is recommended. The results show that the ground feature sizes acquired by means of MCS and optimized parameters in this study match well with real land cover patterns. Full article
Show Figures

Figure 1

24 pages, 8438 KiB  
Article
Multilevel Visualization of Travelogue Trajectory Data
by Yongsai Ma, Yang Wang, Guangluan Xu and Xianqing Tai
ISPRS Int. J. Geo-Inf. 2018, 7(1), 12; https://doi.org/10.3390/ijgi7010012 - 03 Jan 2018
Cited by 12 | Viewed by 4851
Abstract
User-generated travelogues can generate much geographic data, containing abundant semantic and geographic information that reflects people’s movement patterns. The tourist movement patterns in travelogues can help others when planning trips, or understanding how people travel within certain regions. The trajectory data in travelogues [...] Read more.
User-generated travelogues can generate much geographic data, containing abundant semantic and geographic information that reflects people’s movement patterns. The tourist movement patterns in travelogues can help others when planning trips, or understanding how people travel within certain regions. The trajectory data in travelogues might include tourist attractions, restaurants and other locations. In addition, all travelogues generate a trajectory, which has a large volume. The variety and volume of trajectory data make it very hard to directly find patterns contained within them. Moreover, existing work about movement patterns has only explored the simple semantic information, without considering using visualization to find hidden information. We propose a multilevel visual analytical method to help find movement patterns in travelogues. The data characteristic of a single travelogue are different from multiple travelogues. When exploring a single travelogue, the individual movement patterns comprise our main concern, like semantic information. While looking at many travelogues, we focus more on the patterns of population movement. In addition, when choosing the levels for multilevel aggregation, we apply an adaptive method. By combining the multilevel visualization in a single travelogue and multiple travelogues, we can better explore the movement patterns in travelogues. Full article
Show Figures

Figure 1

2 pages, 173 KiB  
Editorial
Space-Ruled Ecological Processes: Introduction to the Special Issue on Spatial Ecology
by Duccio Rocchini
ISPRS Int. J. Geo-Inf. 2018, 7(1), 11; https://doi.org/10.3390/ijgi7010011 - 02 Jan 2018
Viewed by 3013
Abstract
This special issue explores most of the scientific issues related to spatial ecology and its integration with geographical information at different spatial and temporal scales.[...] Full article
(This article belongs to the Special Issue Spatial Ecology)
18 pages, 3648 KiB  
Article
A New Geographical Cluster View on Passenger Vehicle Purchasing in Chinese Cities
by Daqian Liu, Wei Song, Jia Lu, Chunyan Xie and Xin Wen
ISPRS Int. J. Geo-Inf. 2018, 7(1), 9; https://doi.org/10.3390/ijgi7010009 - 01 Jan 2018
Cited by 15 | Viewed by 5097
Abstract
It is important to understand urban auto markets from a spatial perspective. Specifically, the question of how to simplify and visualize the relatedness of the complicated urban markets arises. Based on the concept of ‘product space’, this research explores the similarity between Chinese [...] Read more.
It is important to understand urban auto markets from a spatial perspective. Specifically, the question of how to simplify and visualize the relatedness of the complicated urban markets arises. Based on the concept of ‘product space’, this research explores the similarity between Chinese cities and identifies the city clusters using data of automobile sales in 2012. A city’s automobile market is shared by different manufacturers and the proximity between two cities is evaluated based on the similarity or relatedness in the structure of the two markets. The spatial structures of the ‘city clusters’ derived from the proximities of automobile markets among cities are mapped, examined, and interpreted. The analysis indicates that cities with higher proximity tend to be similar. According to the intercity proximity index, four geographical city-clusters are identified: the Southeast developed city-cluster, North China city-cluster, Northeast city-cluster, and West city-cluster. Cities in the same cluster tend to share many common characteristics while cities in different clusters exhibit obvious variances, especially in terms of economic status and dominant automakers. Full article
Show Figures

Figure 1

15 pages, 862 KiB  
Article
Cartographic Redundancy in Reducing Change Blindness in Detecting Extreme Values in Spatio-Temporal Maps
by Paweł Cybulski and Beata Medyńska-Gulij
ISPRS Int. J. Geo-Inf. 2018, 7(1), 8; https://doi.org/10.3390/ijgi7010008 - 01 Jan 2018
Cited by 17 | Viewed by 4935
Abstract
The article investigates the possibility of using cartographic redundancy to reduce the change blindness effect on spatio-temporal maps. Unlike in the case of previous research, the authors take a look at various methods of cartographic presentation and modify the visual variables in order [...] Read more.
The article investigates the possibility of using cartographic redundancy to reduce the change blindness effect on spatio-temporal maps. Unlike in the case of previous research, the authors take a look at various methods of cartographic presentation and modify the visual variables in order to see how those modifications affect the user’s perception of changes on spatio-temporal maps. The study described in the following article was the first attempt at minimizing the change blindness phenomenon by manipulating graphical parameters of cartographic visualization and using various quantitative mapping methods. Research shows that cartographic redundancy is not enough to completely resolve the problem of change blindness; however, it might help reduce it. Full article
Show Figures

Figure 1

14 pages, 2079 KiB  
Article
Exploring Spatiotemporal Dynamics of Urban Fires: A Case of Nanjing, China
by Xiaoxiang Zhang, Jing Yao and Katarzyna Sila-Nowicka
ISPRS Int. J. Geo-Inf. 2018, 7(1), 7; https://doi.org/10.3390/ijgi7010007 - 01 Jan 2018
Cited by 21 | Viewed by 4809
Abstract
Urban fire occurs within the built environment, usually involving casualties and economic losses, and affects individuals and socioeconomic activities in the surrounding neighborhoods. A good understanding of the spatiotemporal dynamics of fire incidents can offer insights into potential determinants of various fire events, [...] Read more.
Urban fire occurs within the built environment, usually involving casualties and economic losses, and affects individuals and socioeconomic activities in the surrounding neighborhoods. A good understanding of the spatiotemporal dynamics of fire incidents can offer insights into potential determinants of various fire events, therefore enabling better fire risk estimation which can assist with future allocation of prevention resources and strategic planning of mitigation programs. Using a twelve-year (2002–2013) dataset containing the urban fire events in Nanjing, China, this research explores the spatiotemporal dynamics of urban fires using a range of exploratory spatial data analysis (ESDA) approaches. Of particular interest here are the fire incidents involving residential properties and local facilities due to their relatively higher occurrence frequencies. The results indicate that the overall amount of urban fires has greatly increased in the last decade and the spatiotemporal distribution of fire events varies among different incident types. The identified spatiotemporal patterns of urban fires in Nanjing can be linked to the urban development strategies and how they have been reflected in reality in recent years. Full article
Show Figures

Figure 1

Previous Issue
Next Issue
Back to TopTop