Integrating Risk Assessment into Spatial Planning: RiskOTe Decision Support System


Abstract
:1. Introduction
2. Methods
2.1. The Modelling Framework
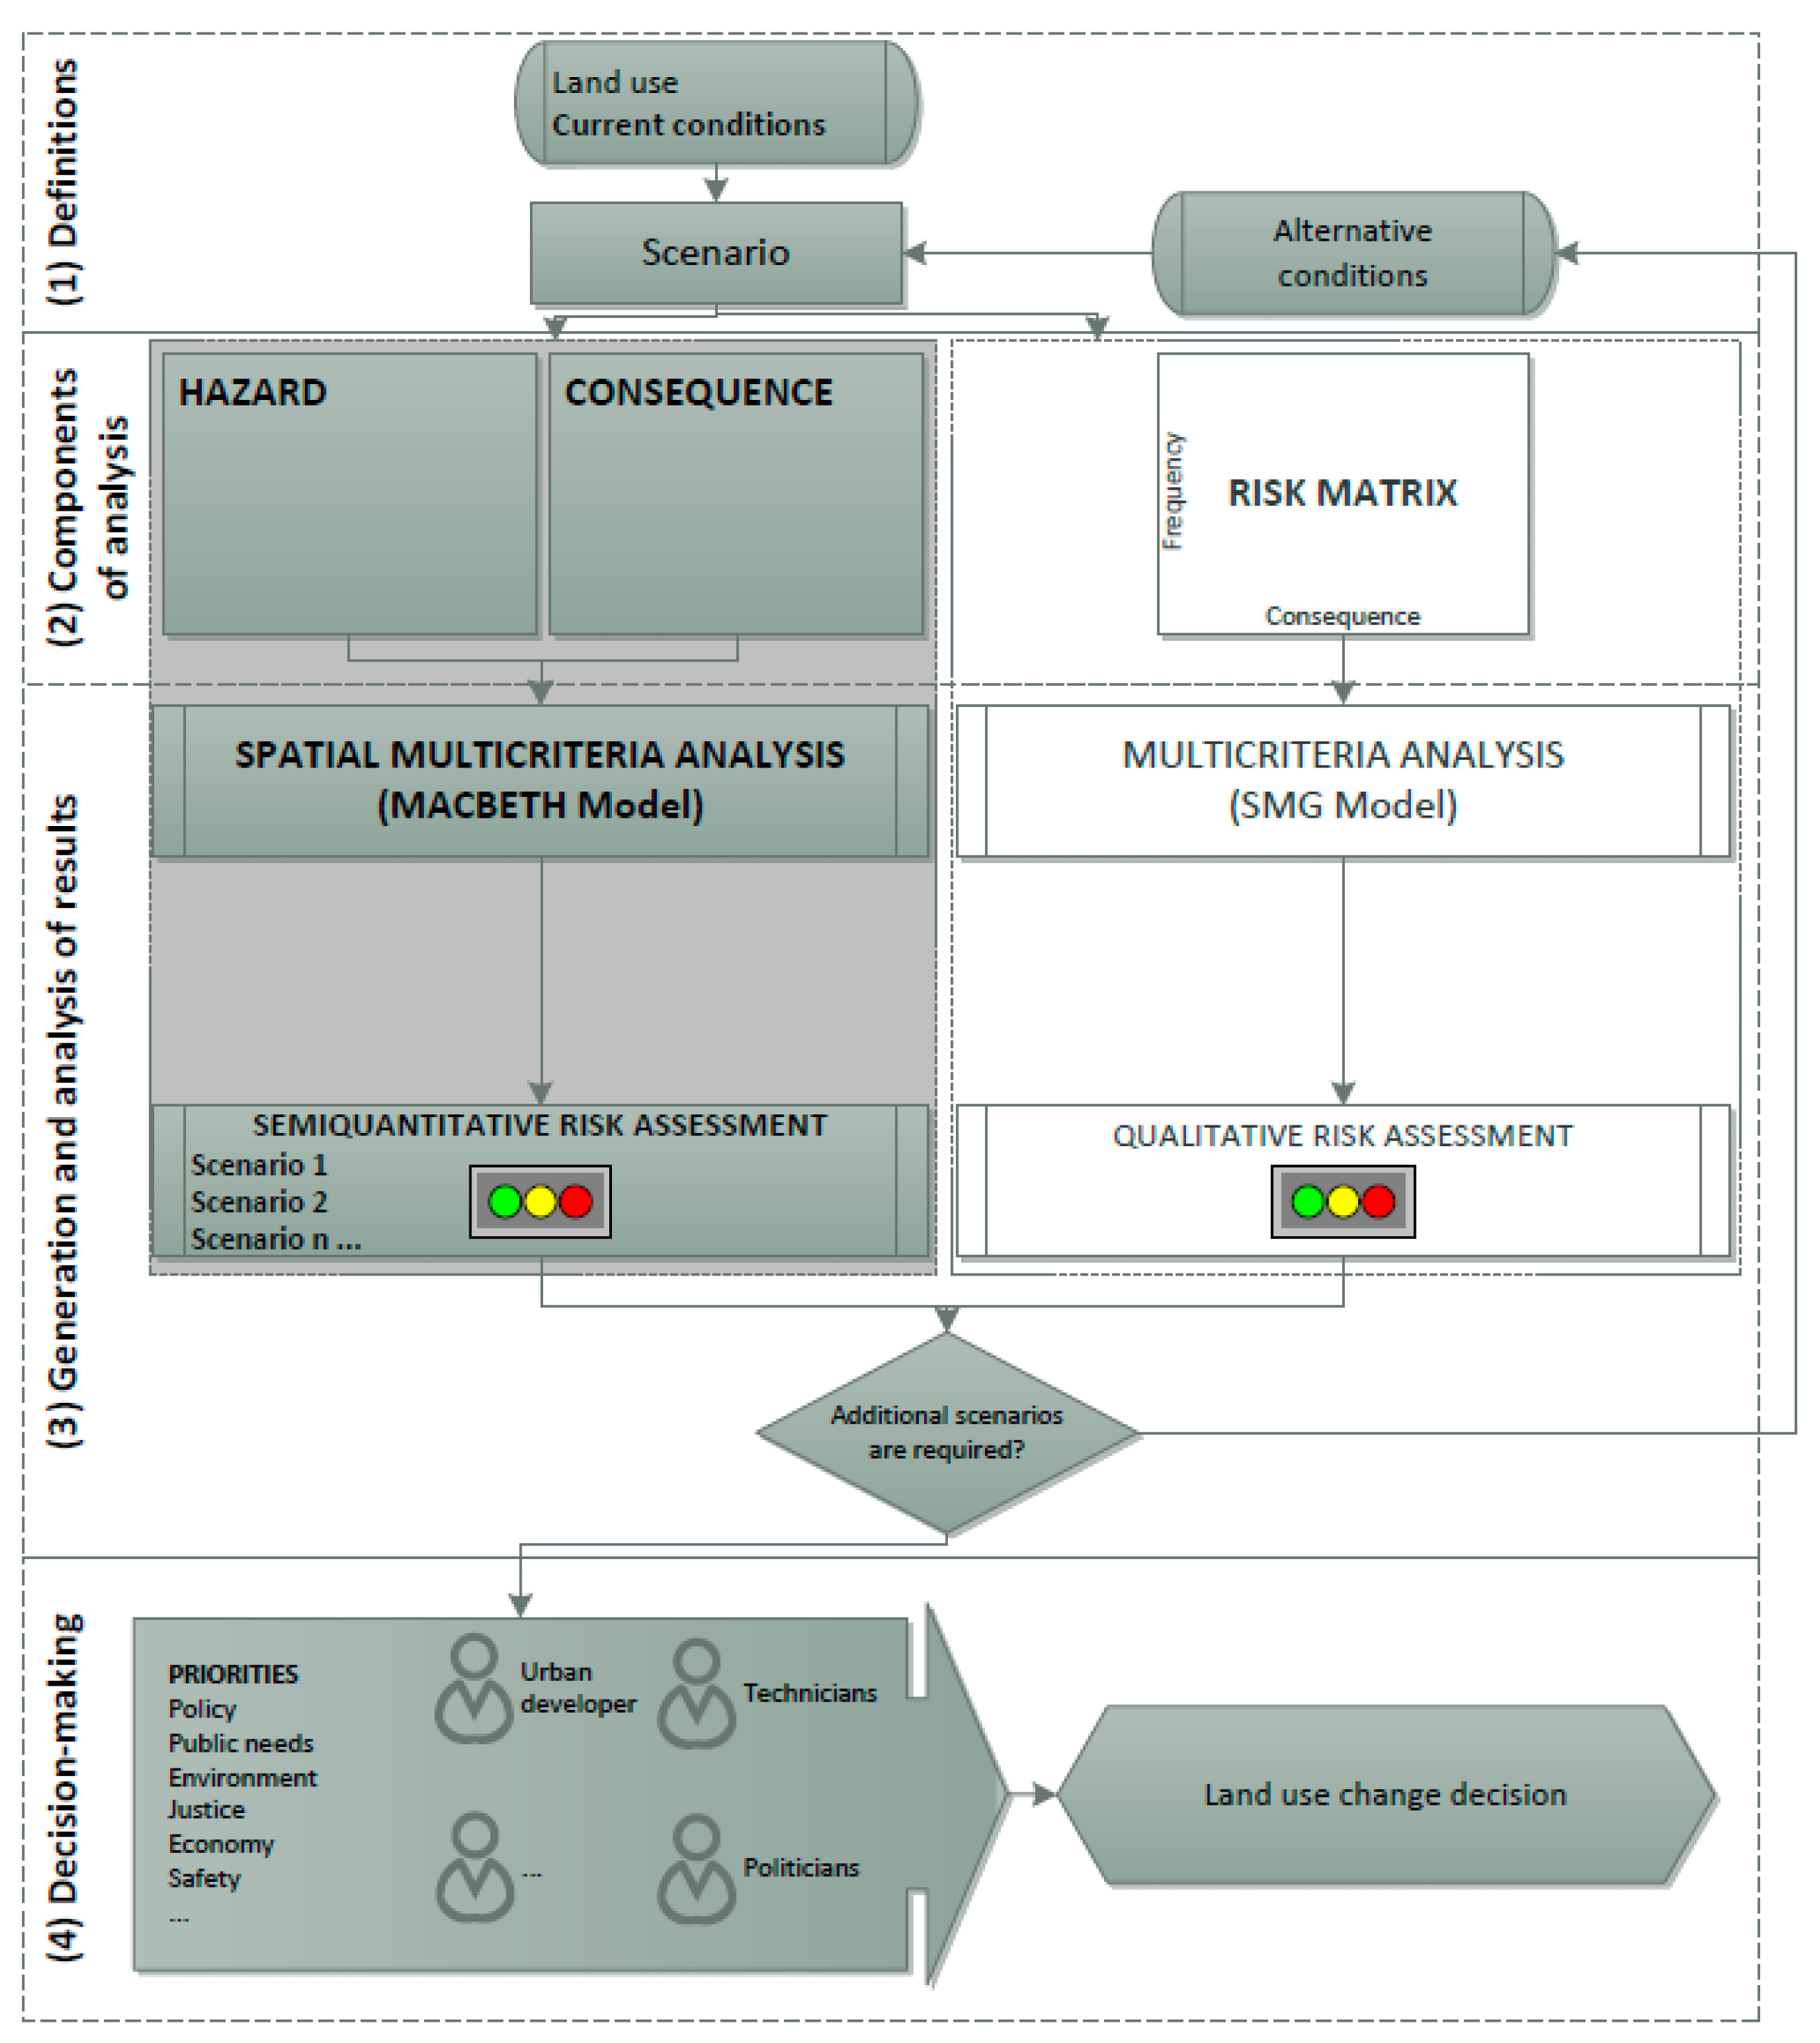
2.1.1. Conceptual Framework
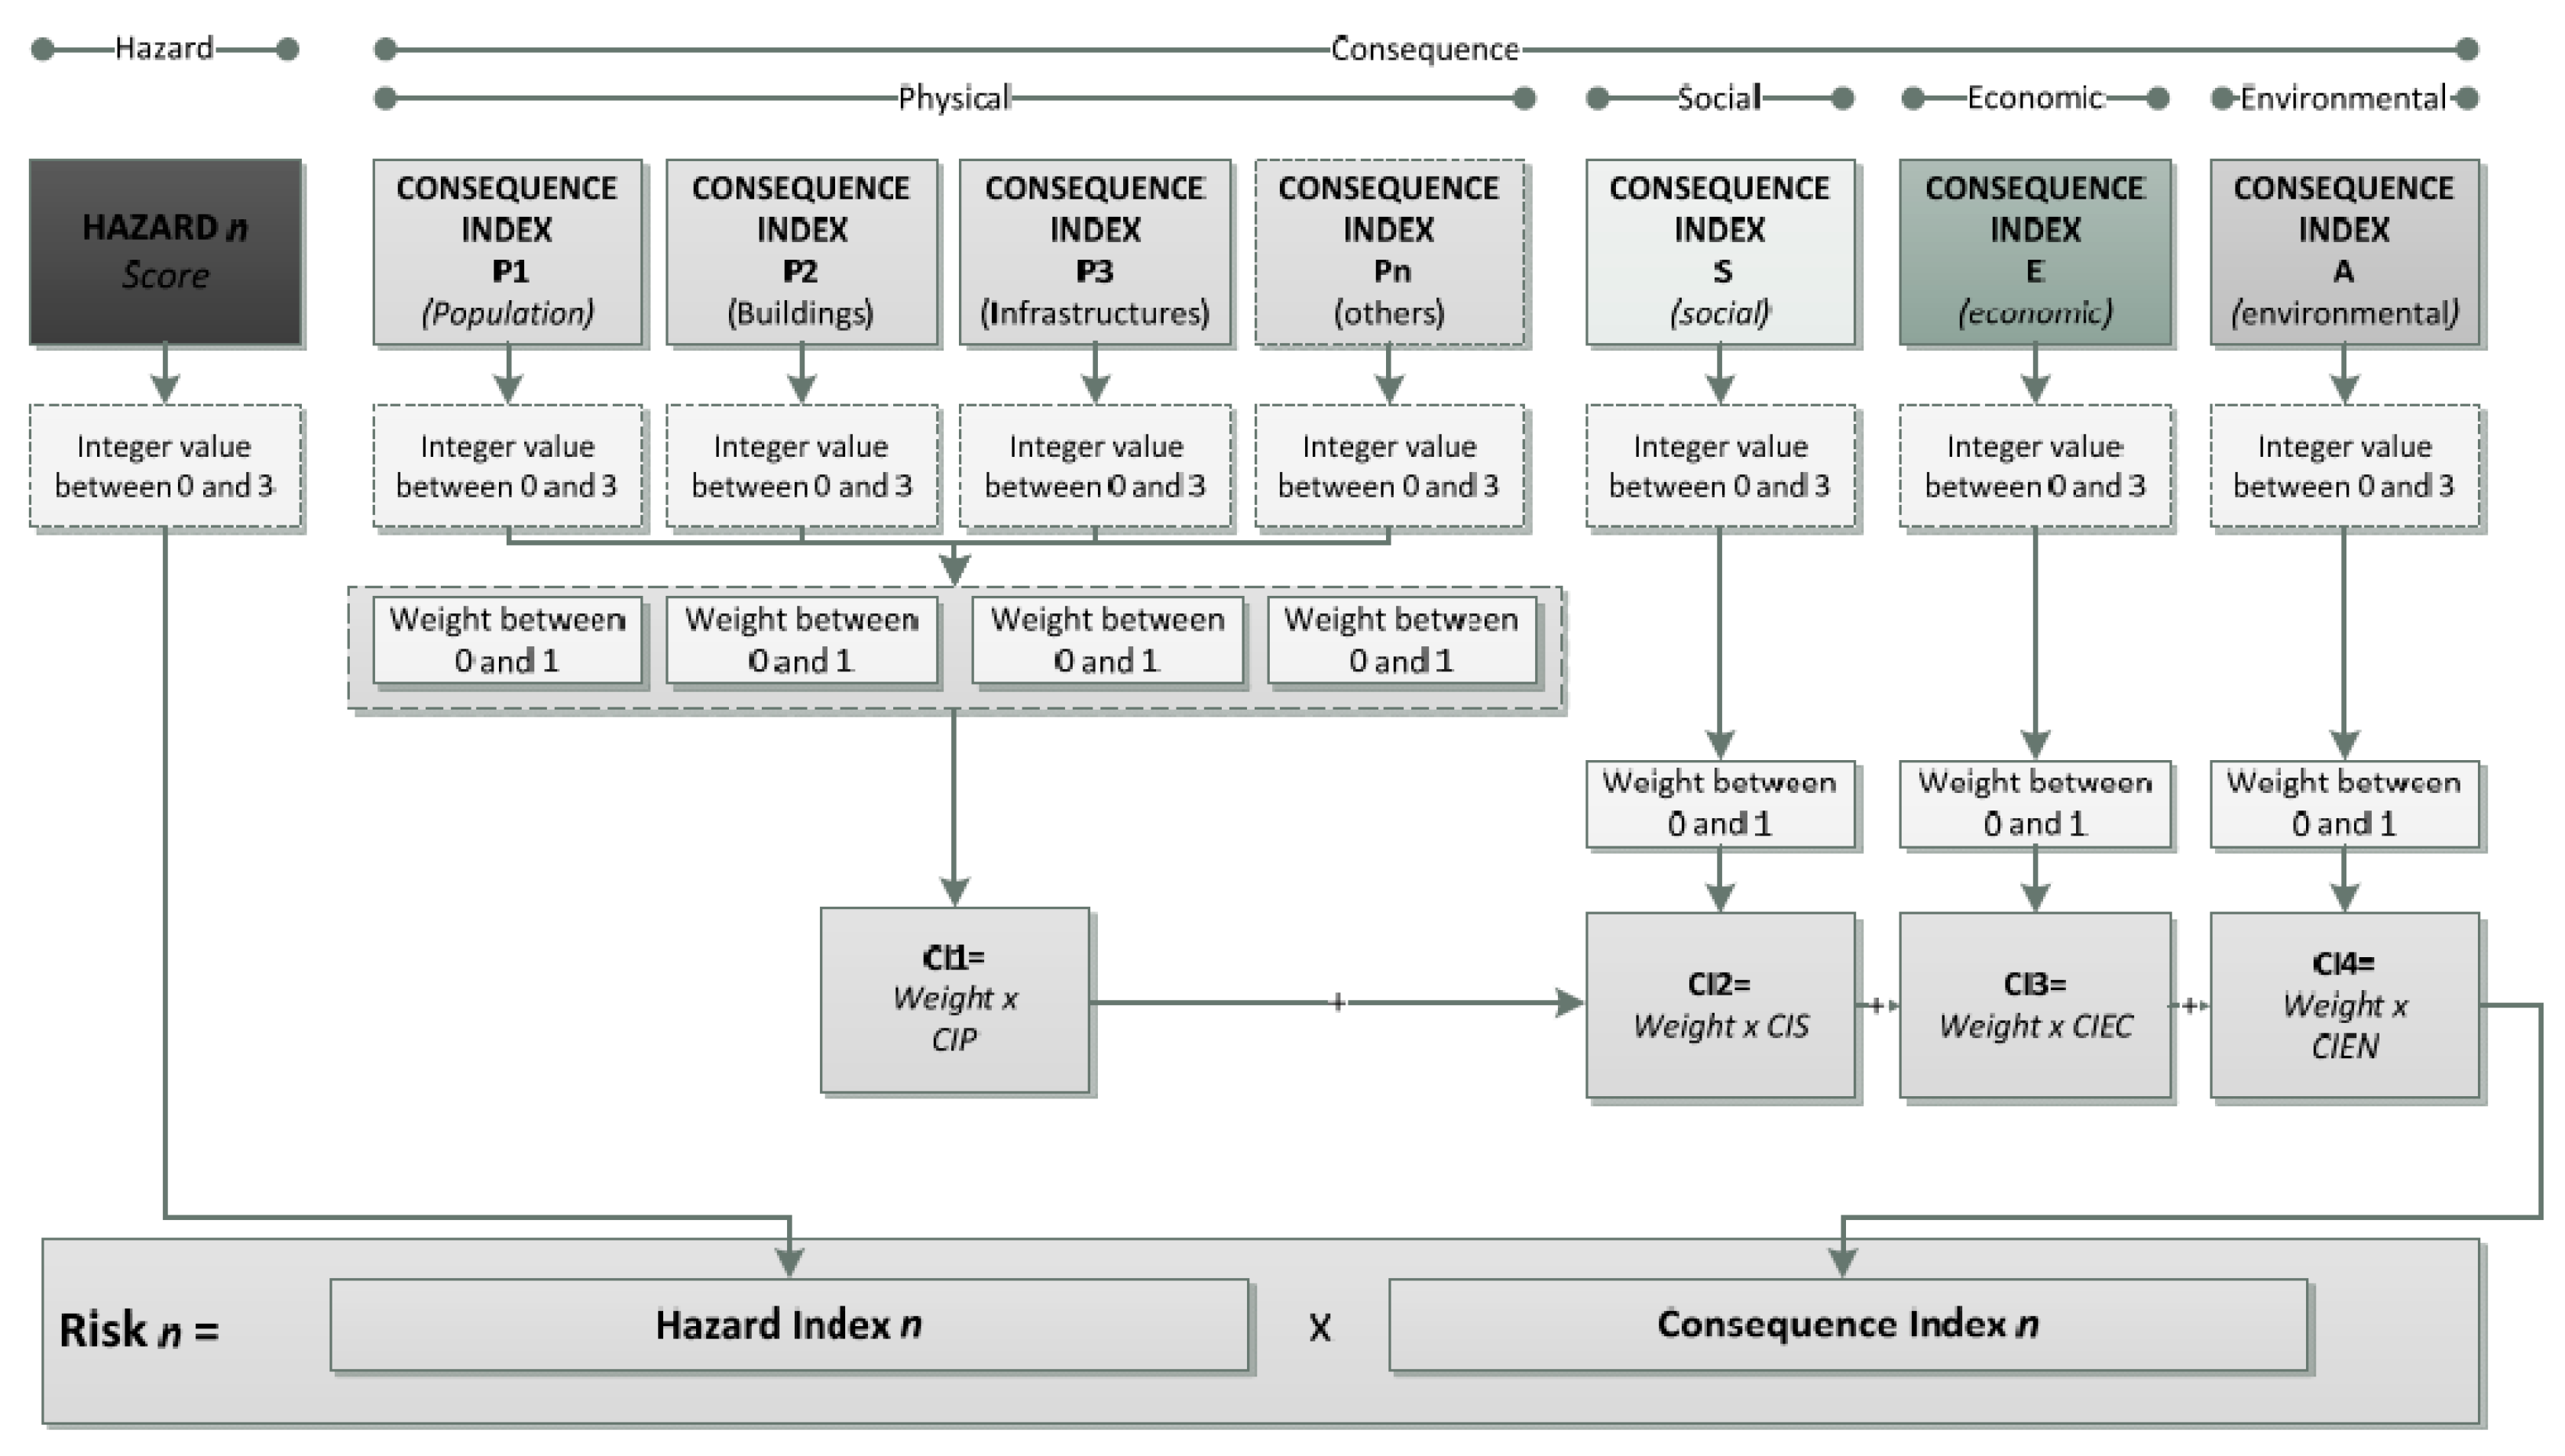
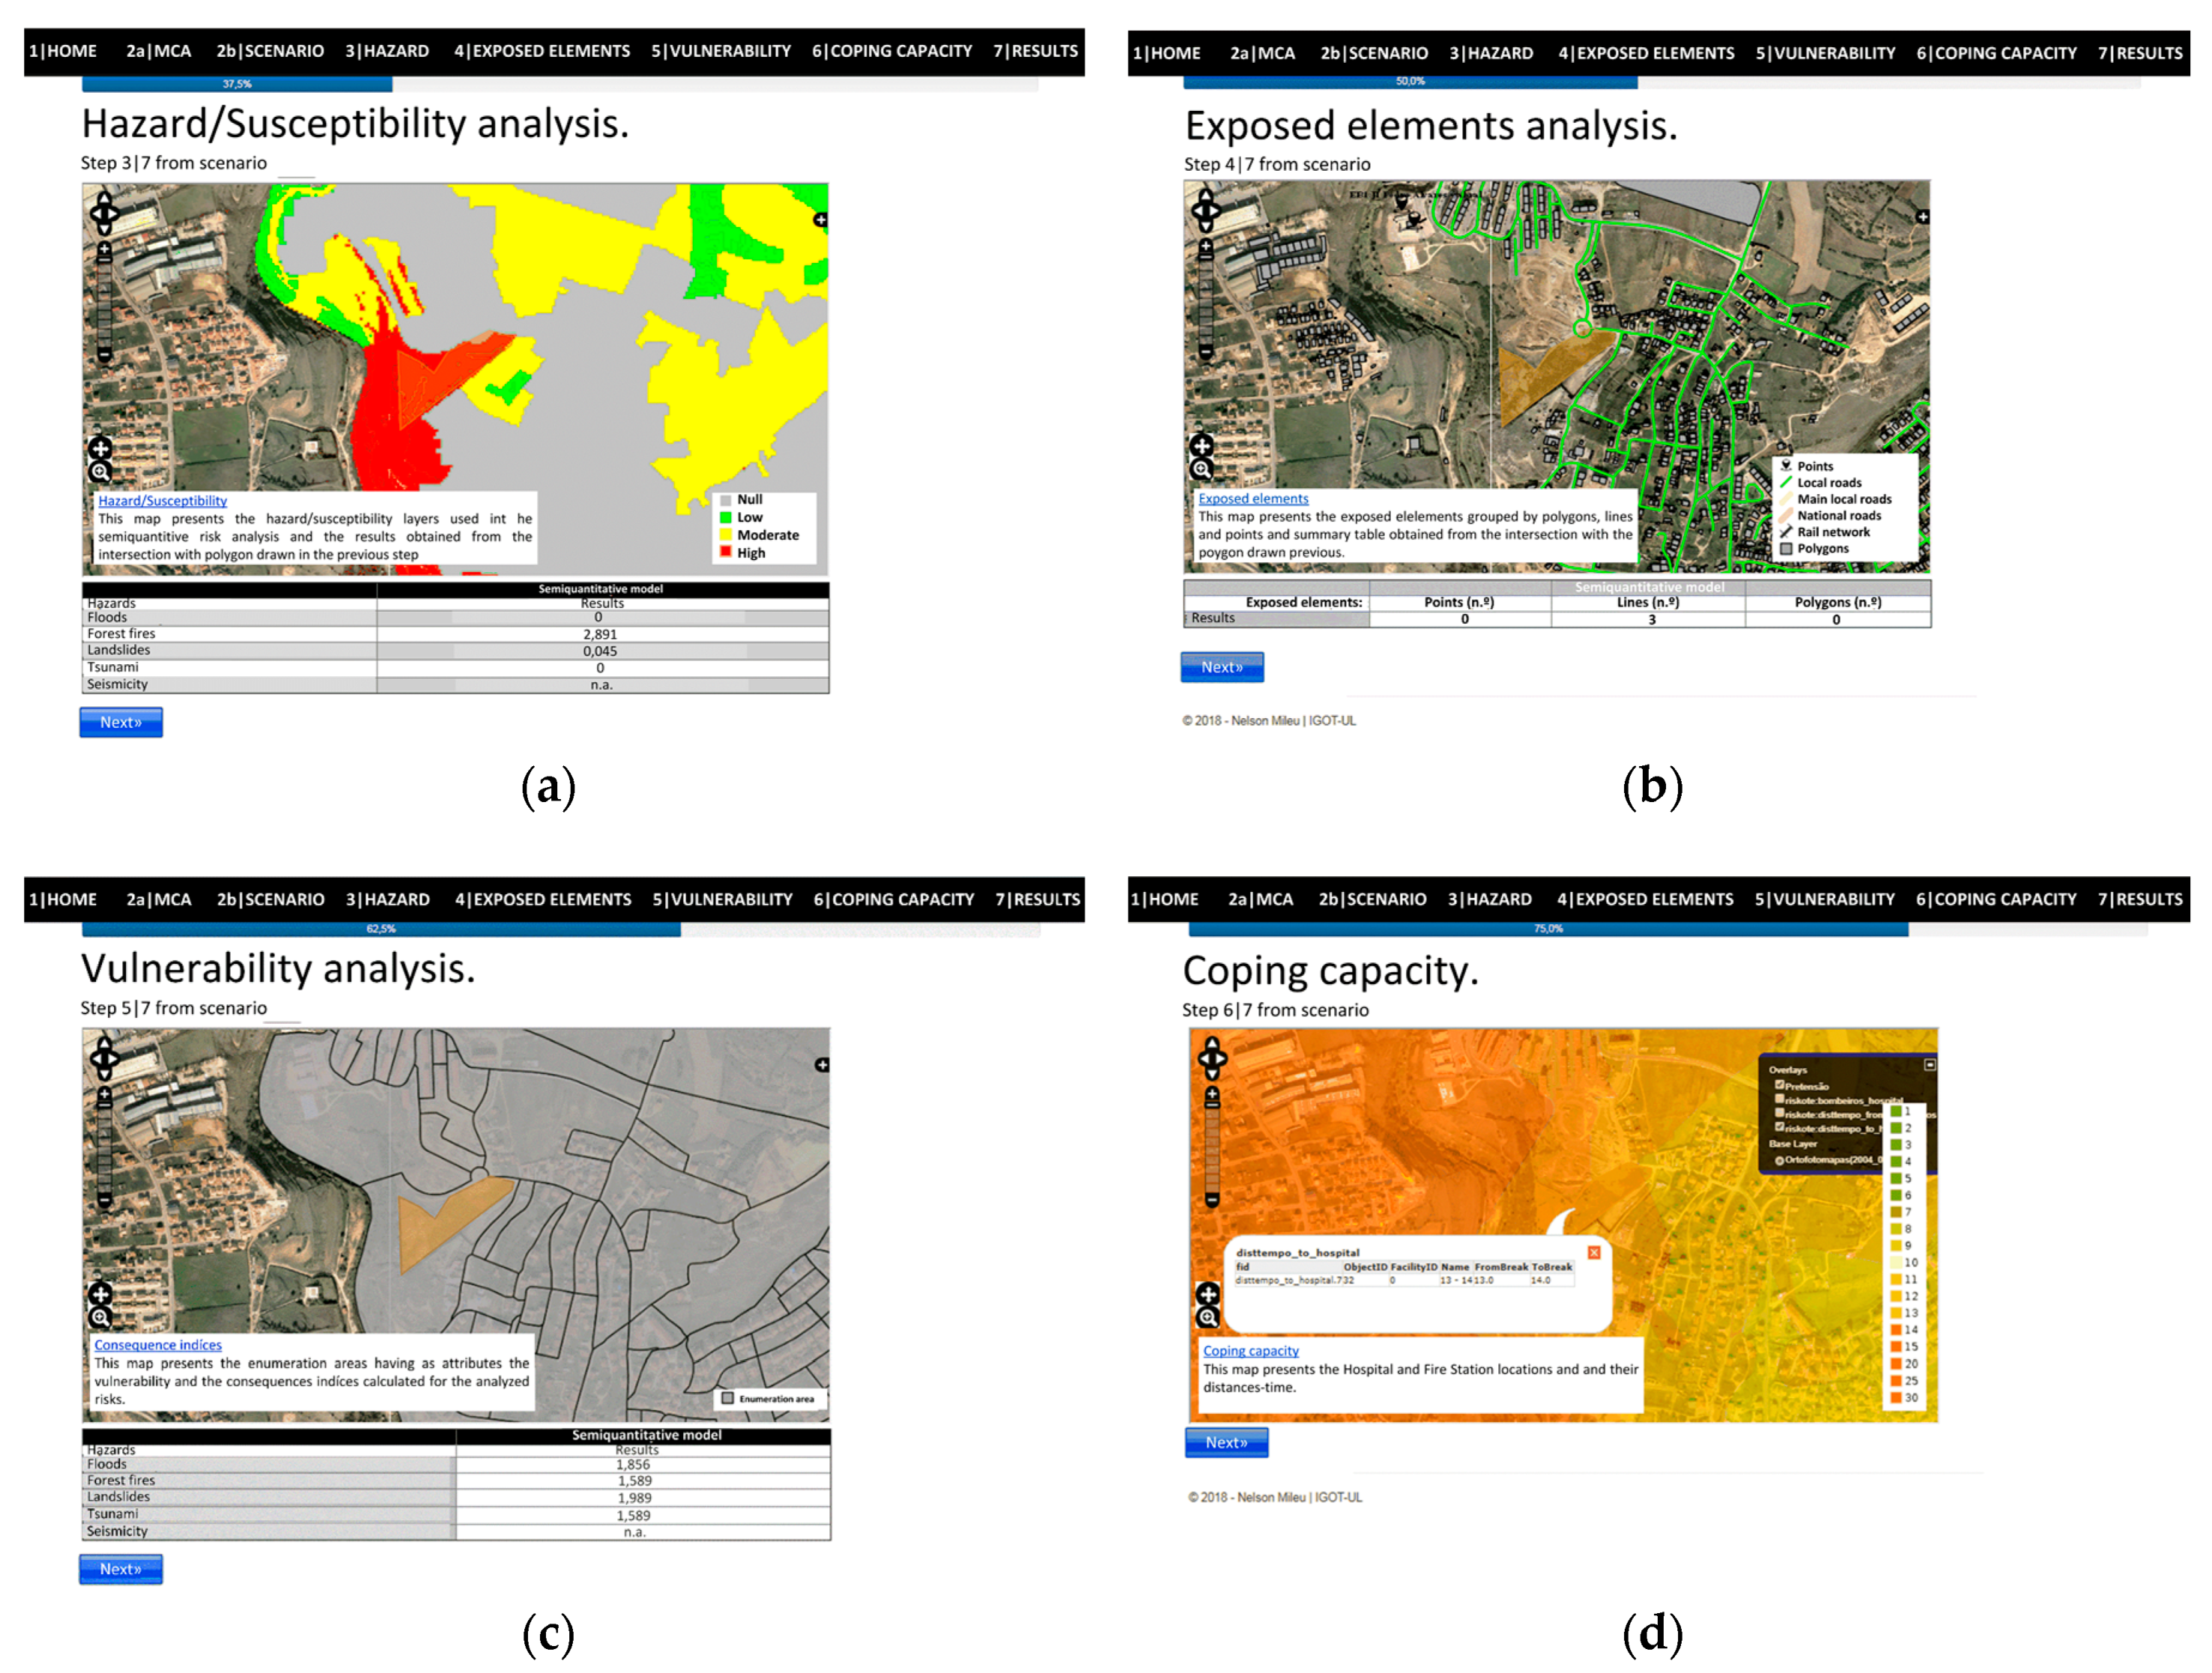
2.1.2. Semi-Quantitative Risk Assessment
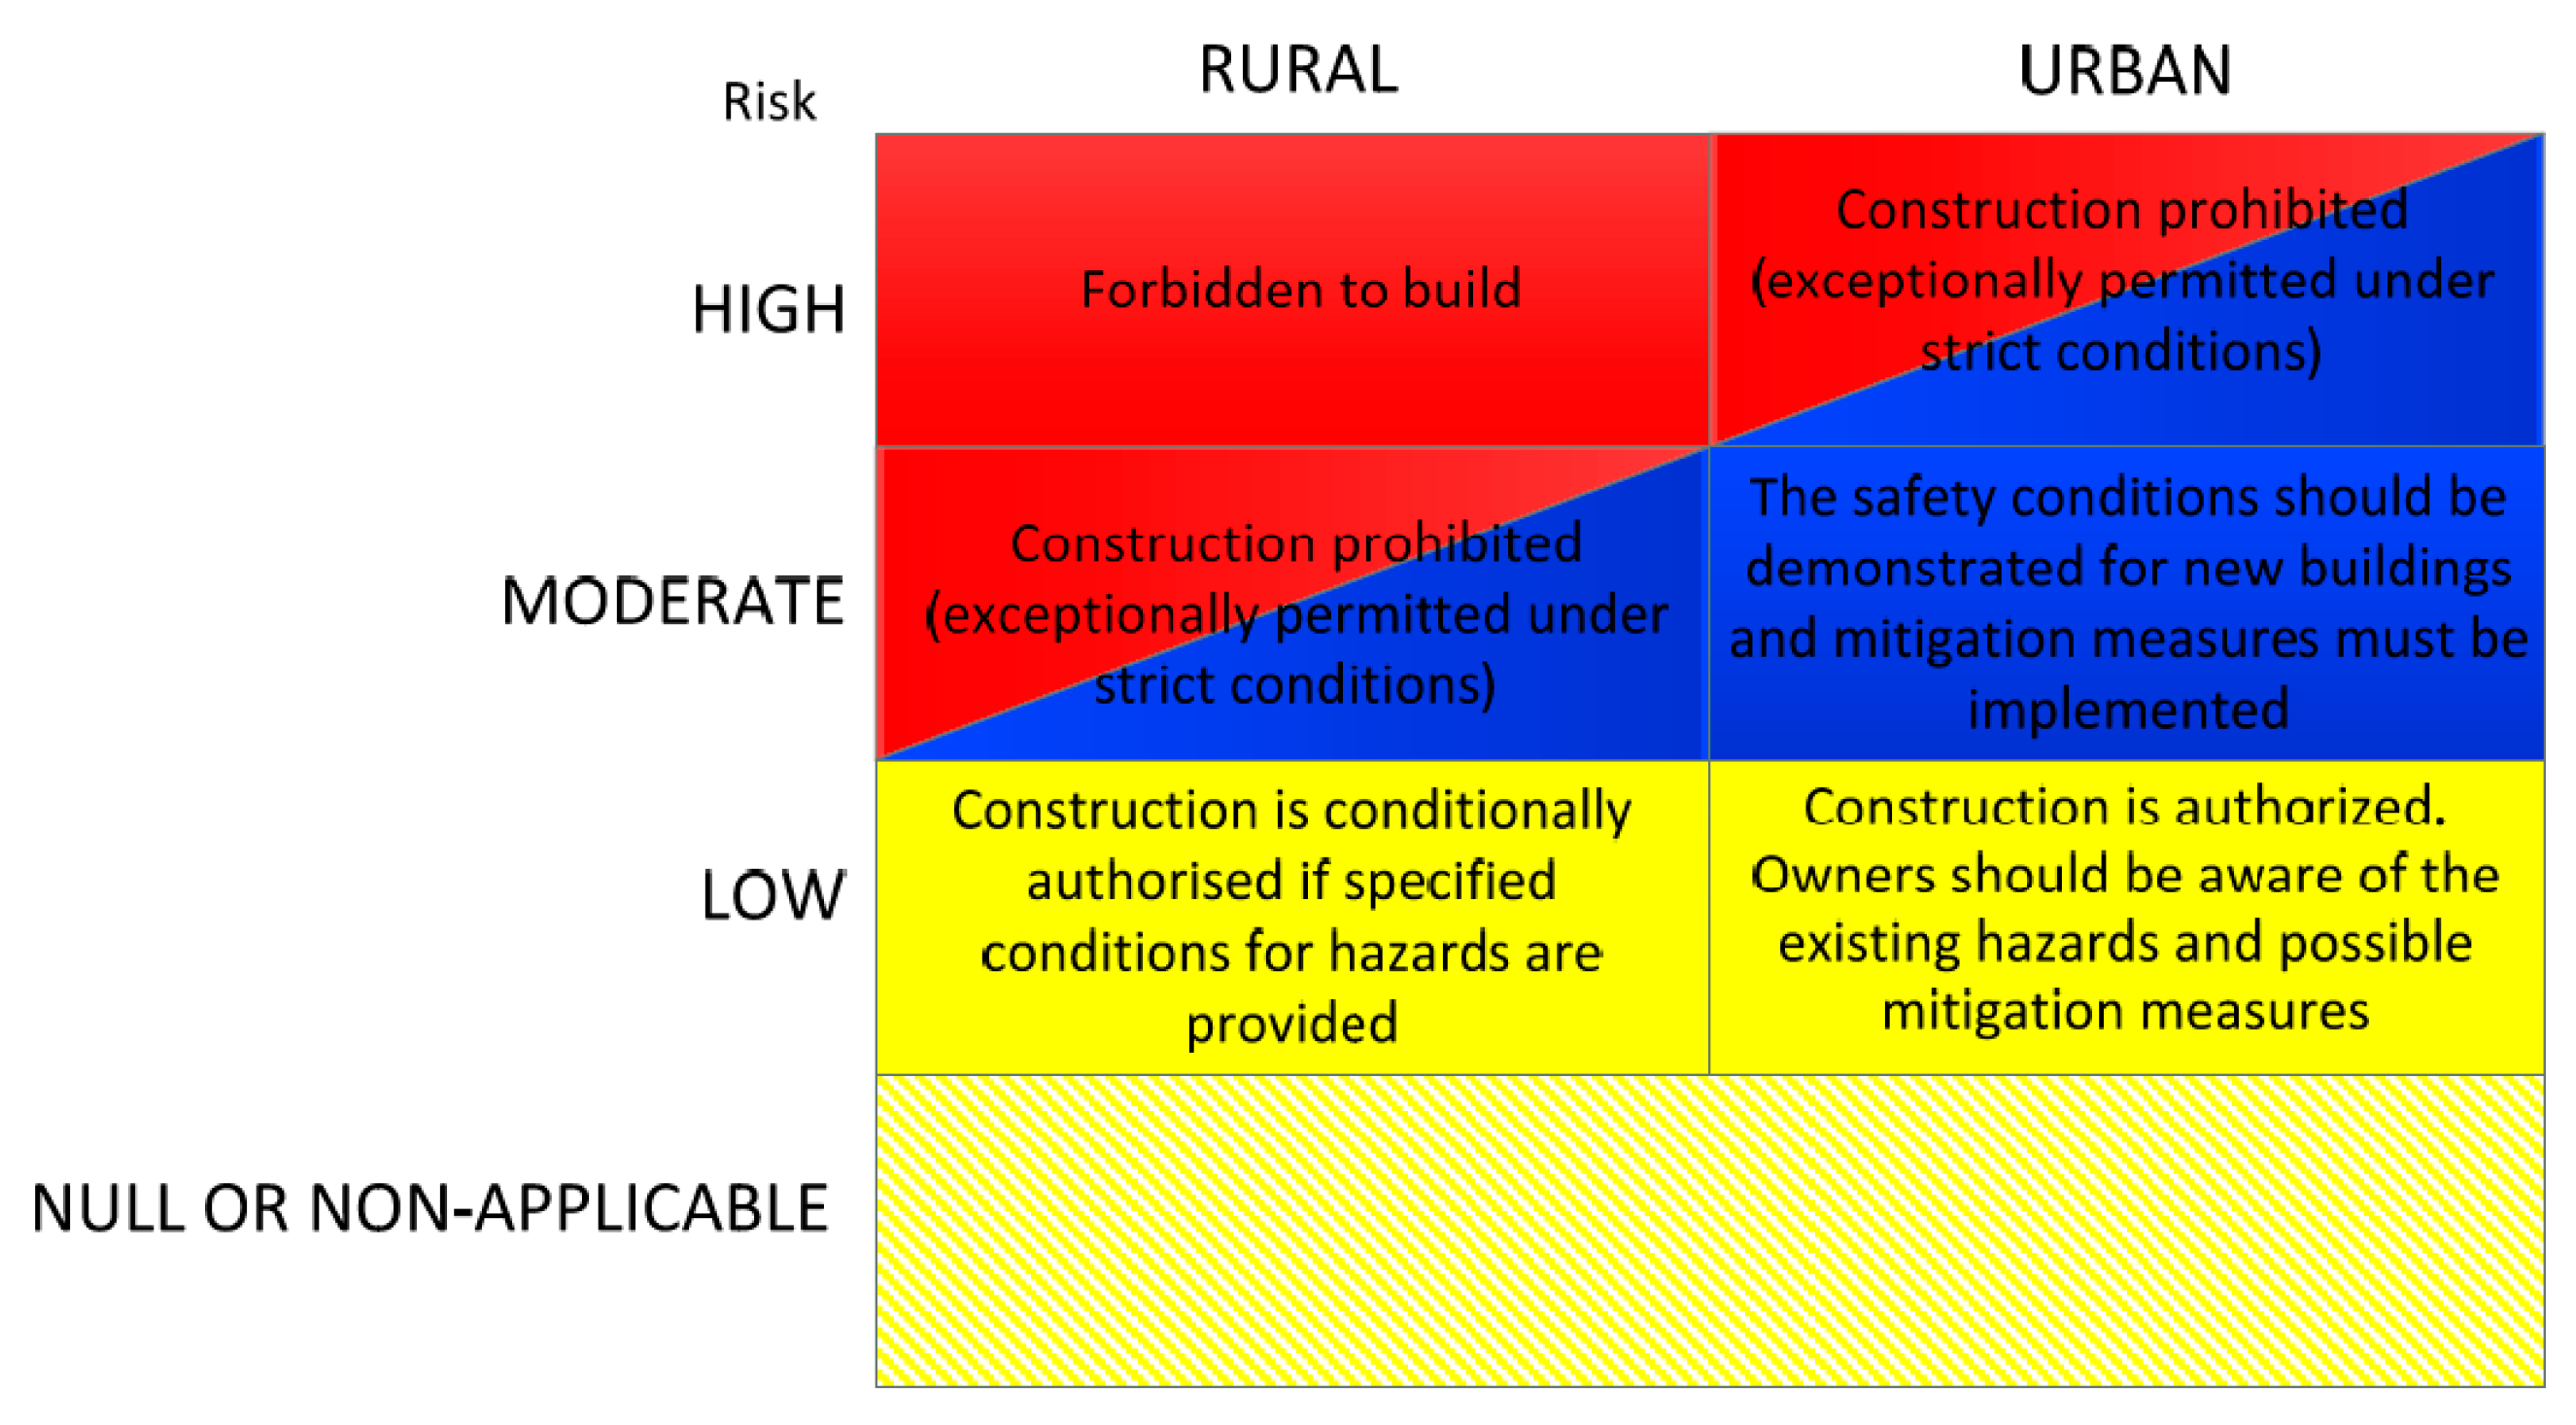
2.1.3. Land Use Transformation Model
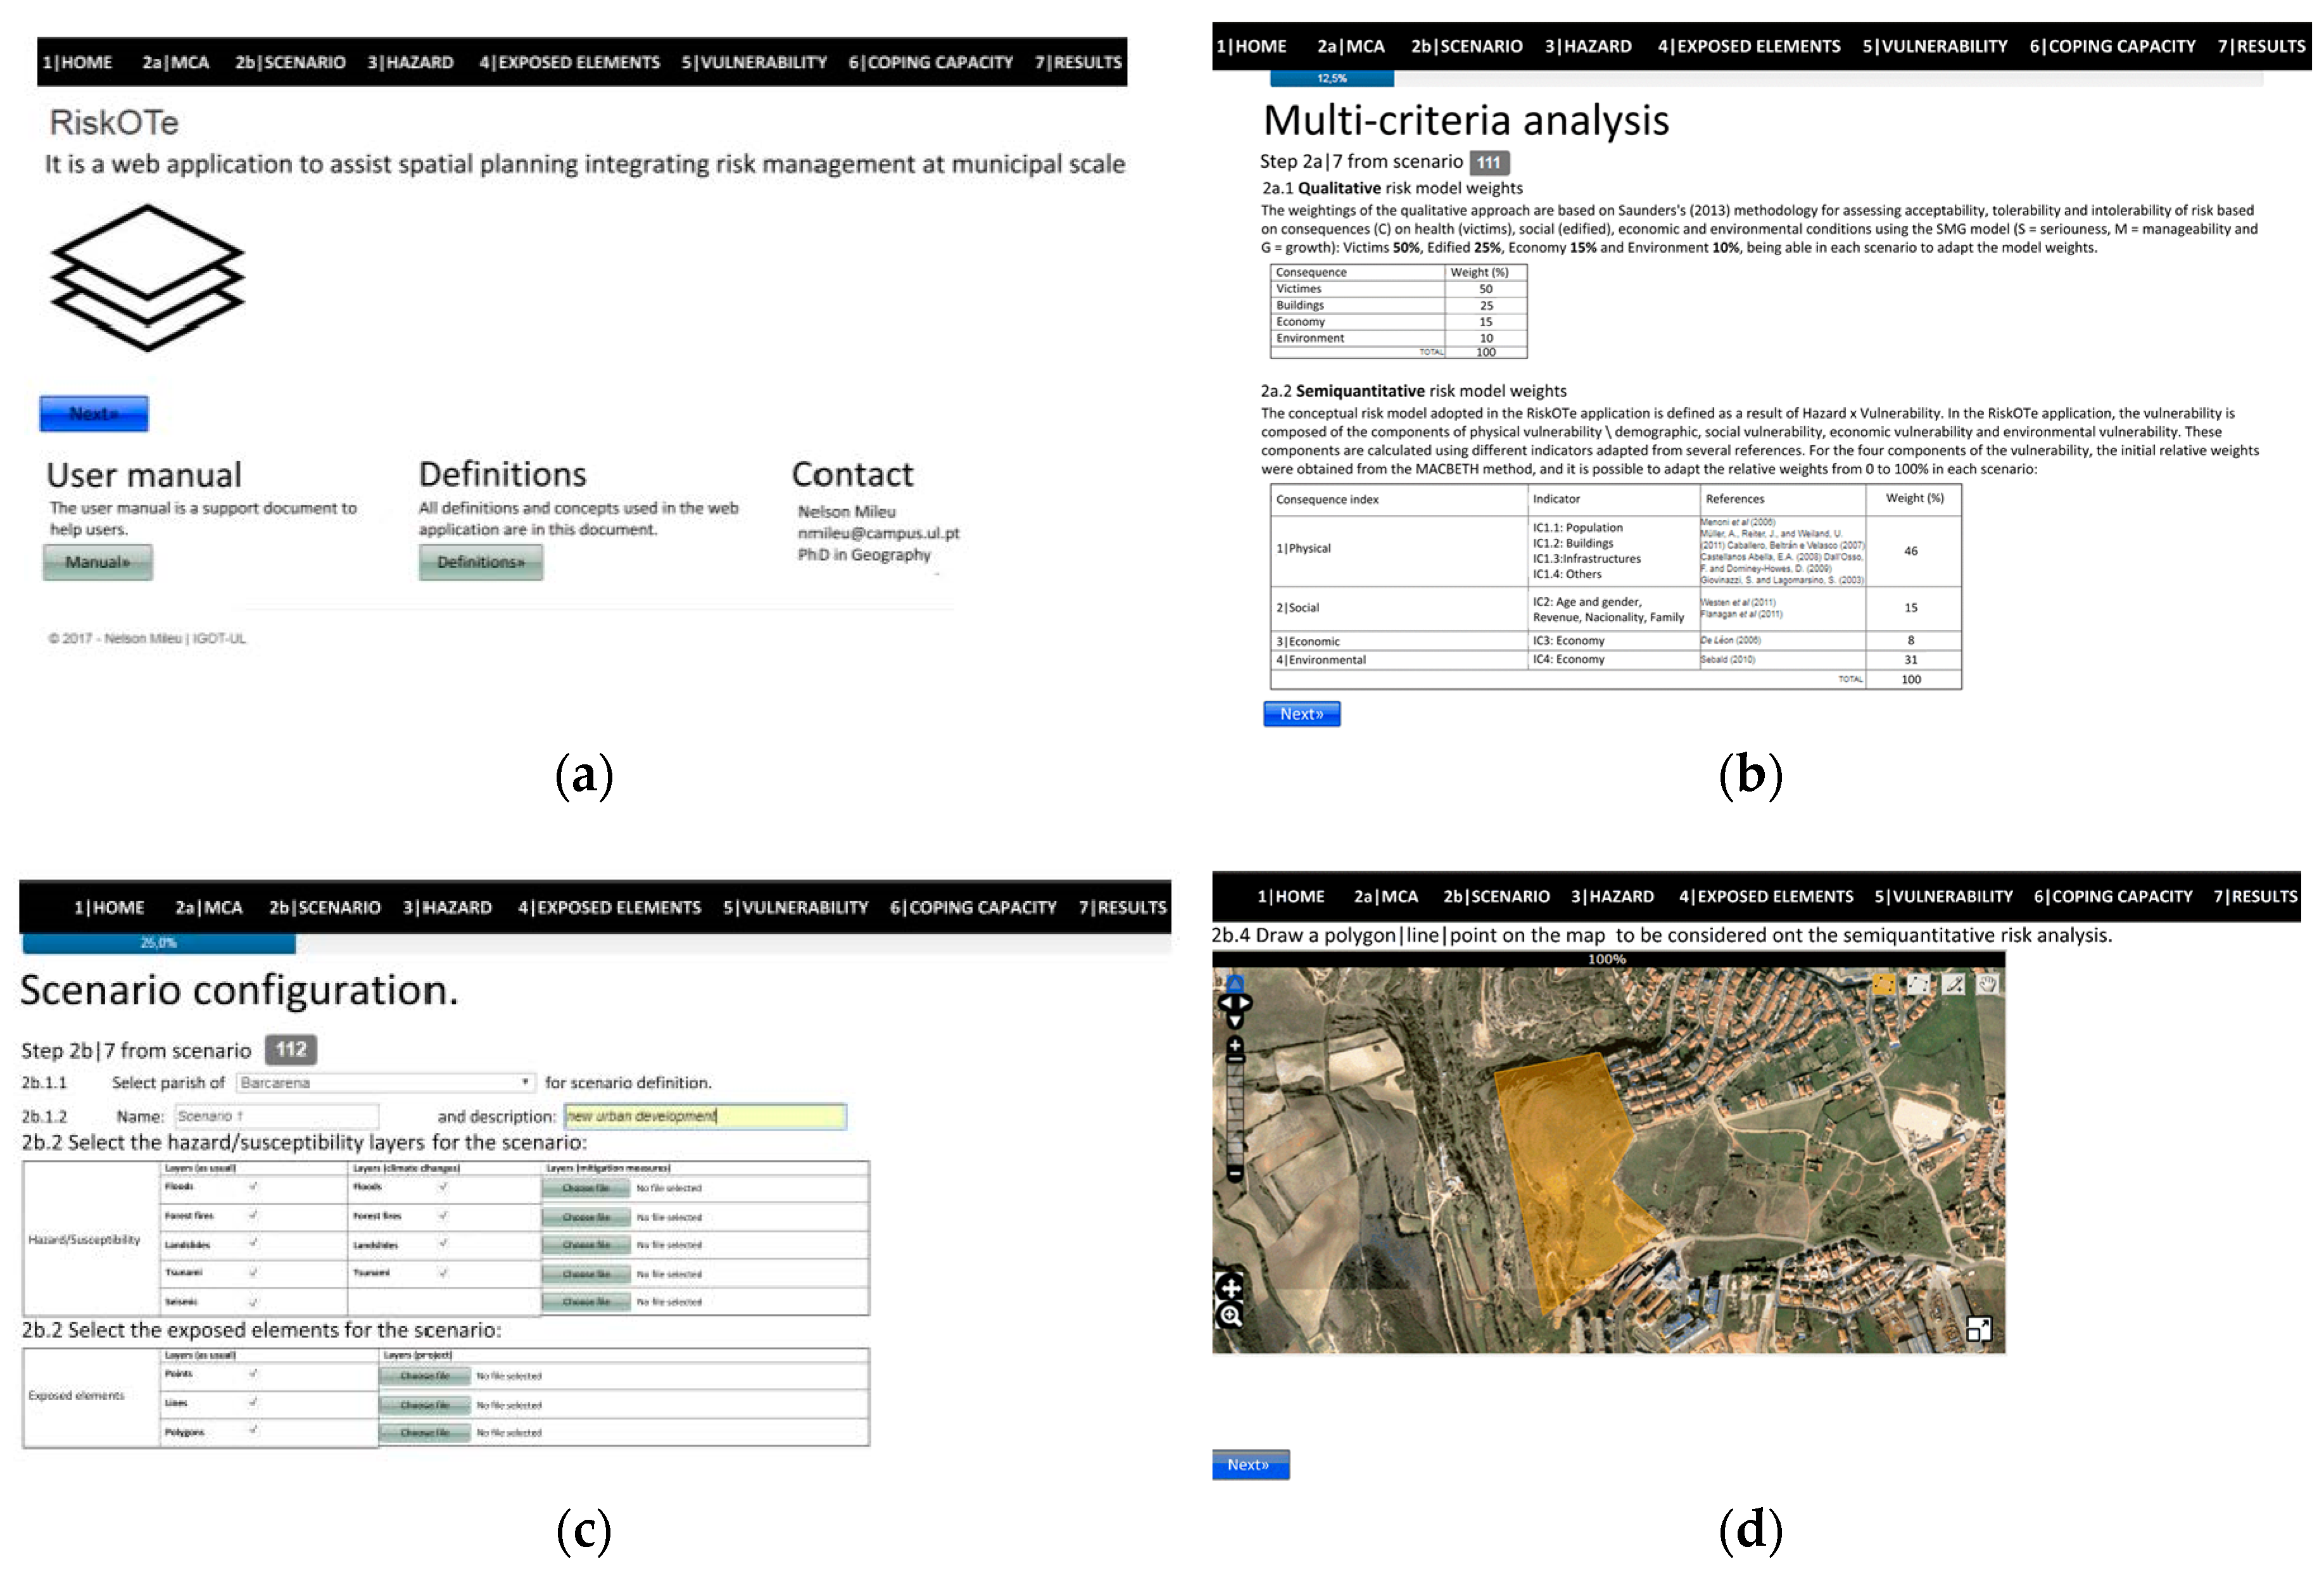
2.2. The Implementation of RiskOTe SDSS
2.2.1. Fundamentals of RiskOTe SDSS
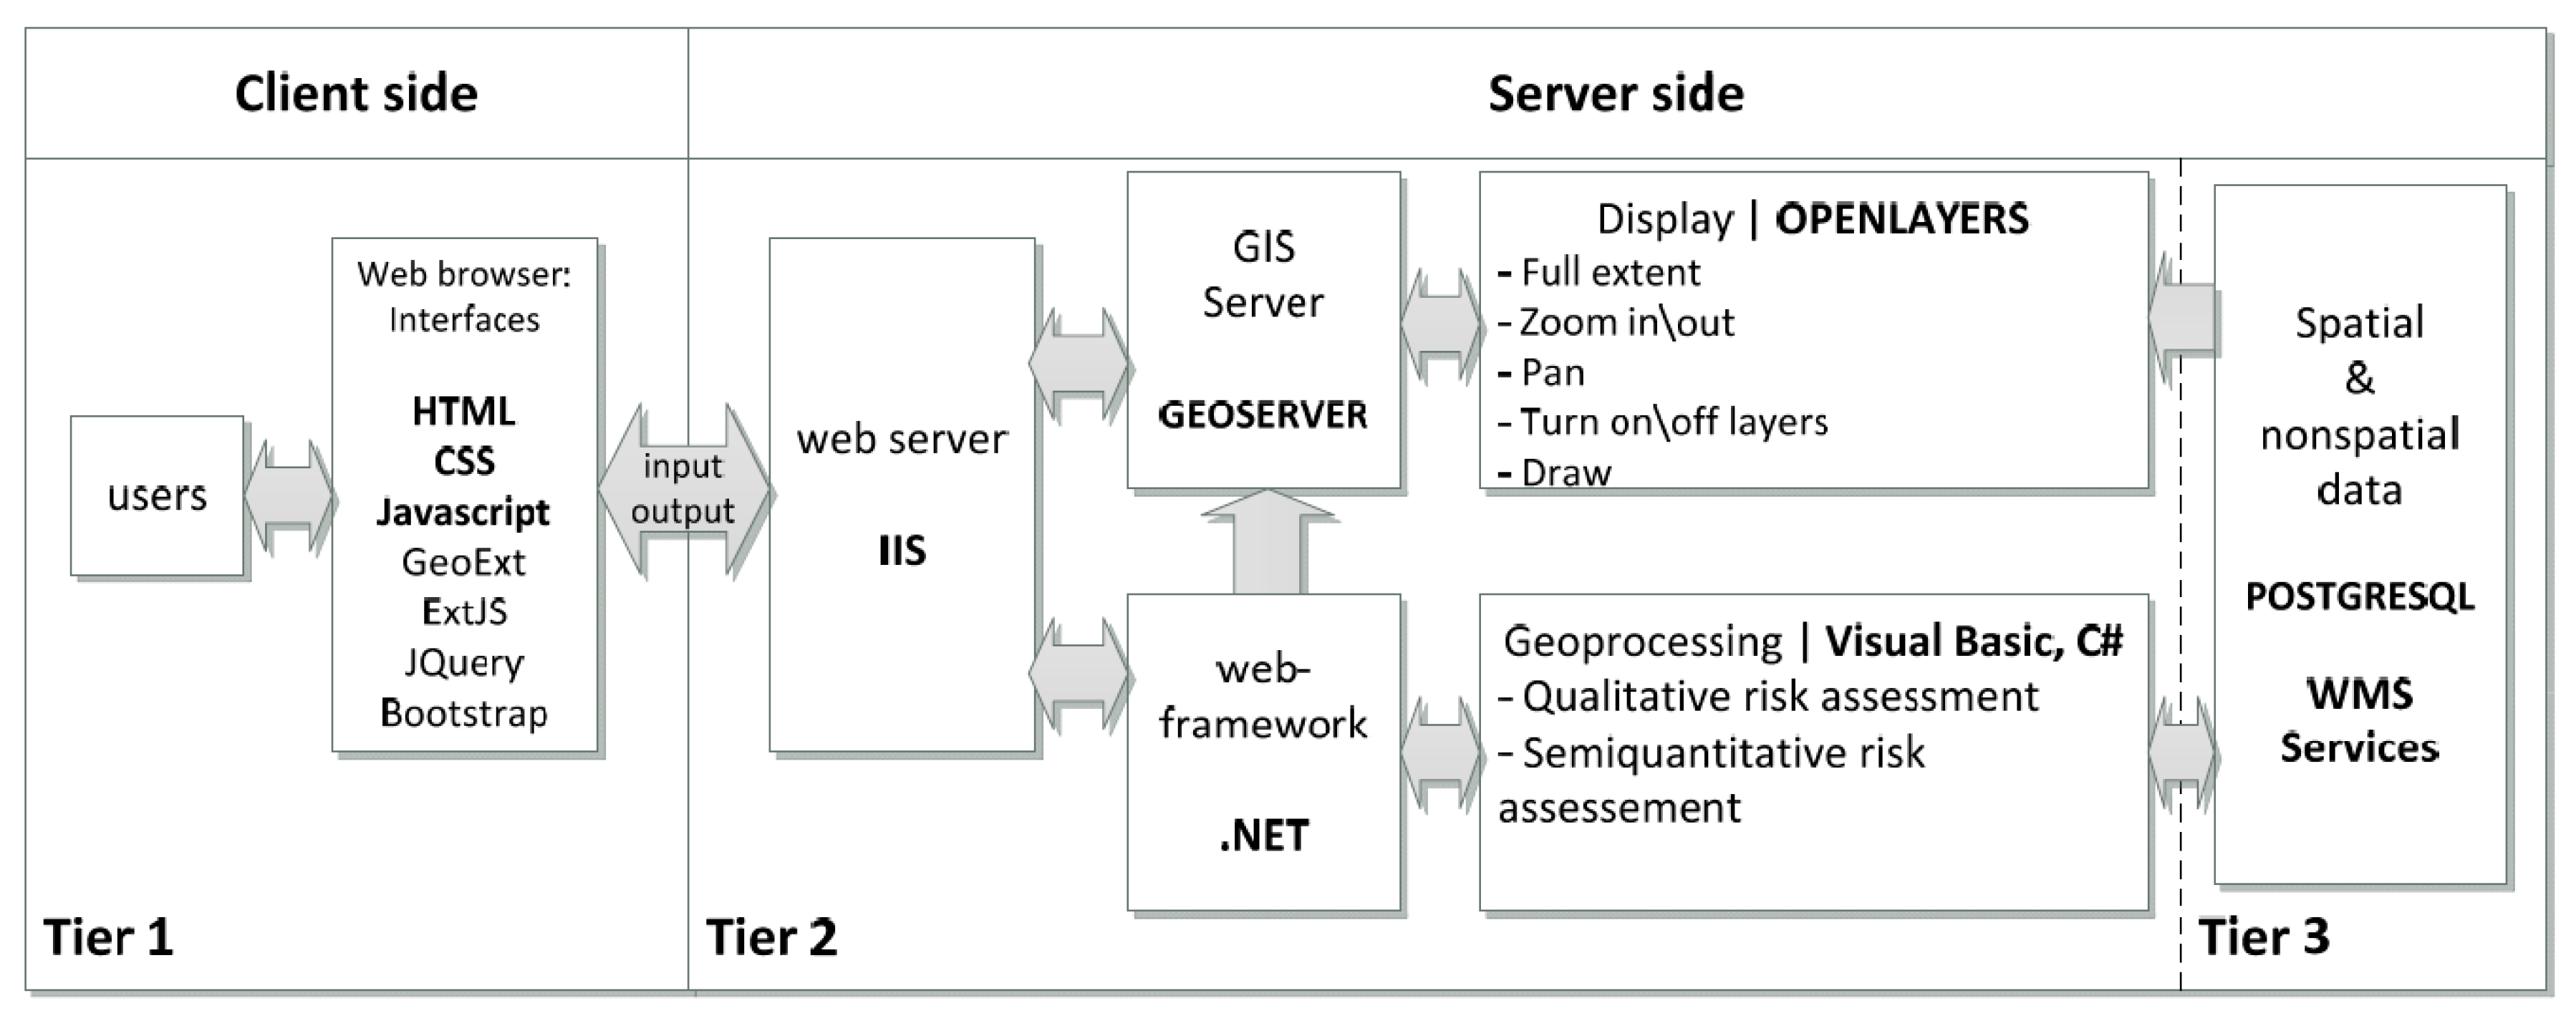
2.2.2. Technological Framework
2.2.3. The Design of the Tool
3. Case Study
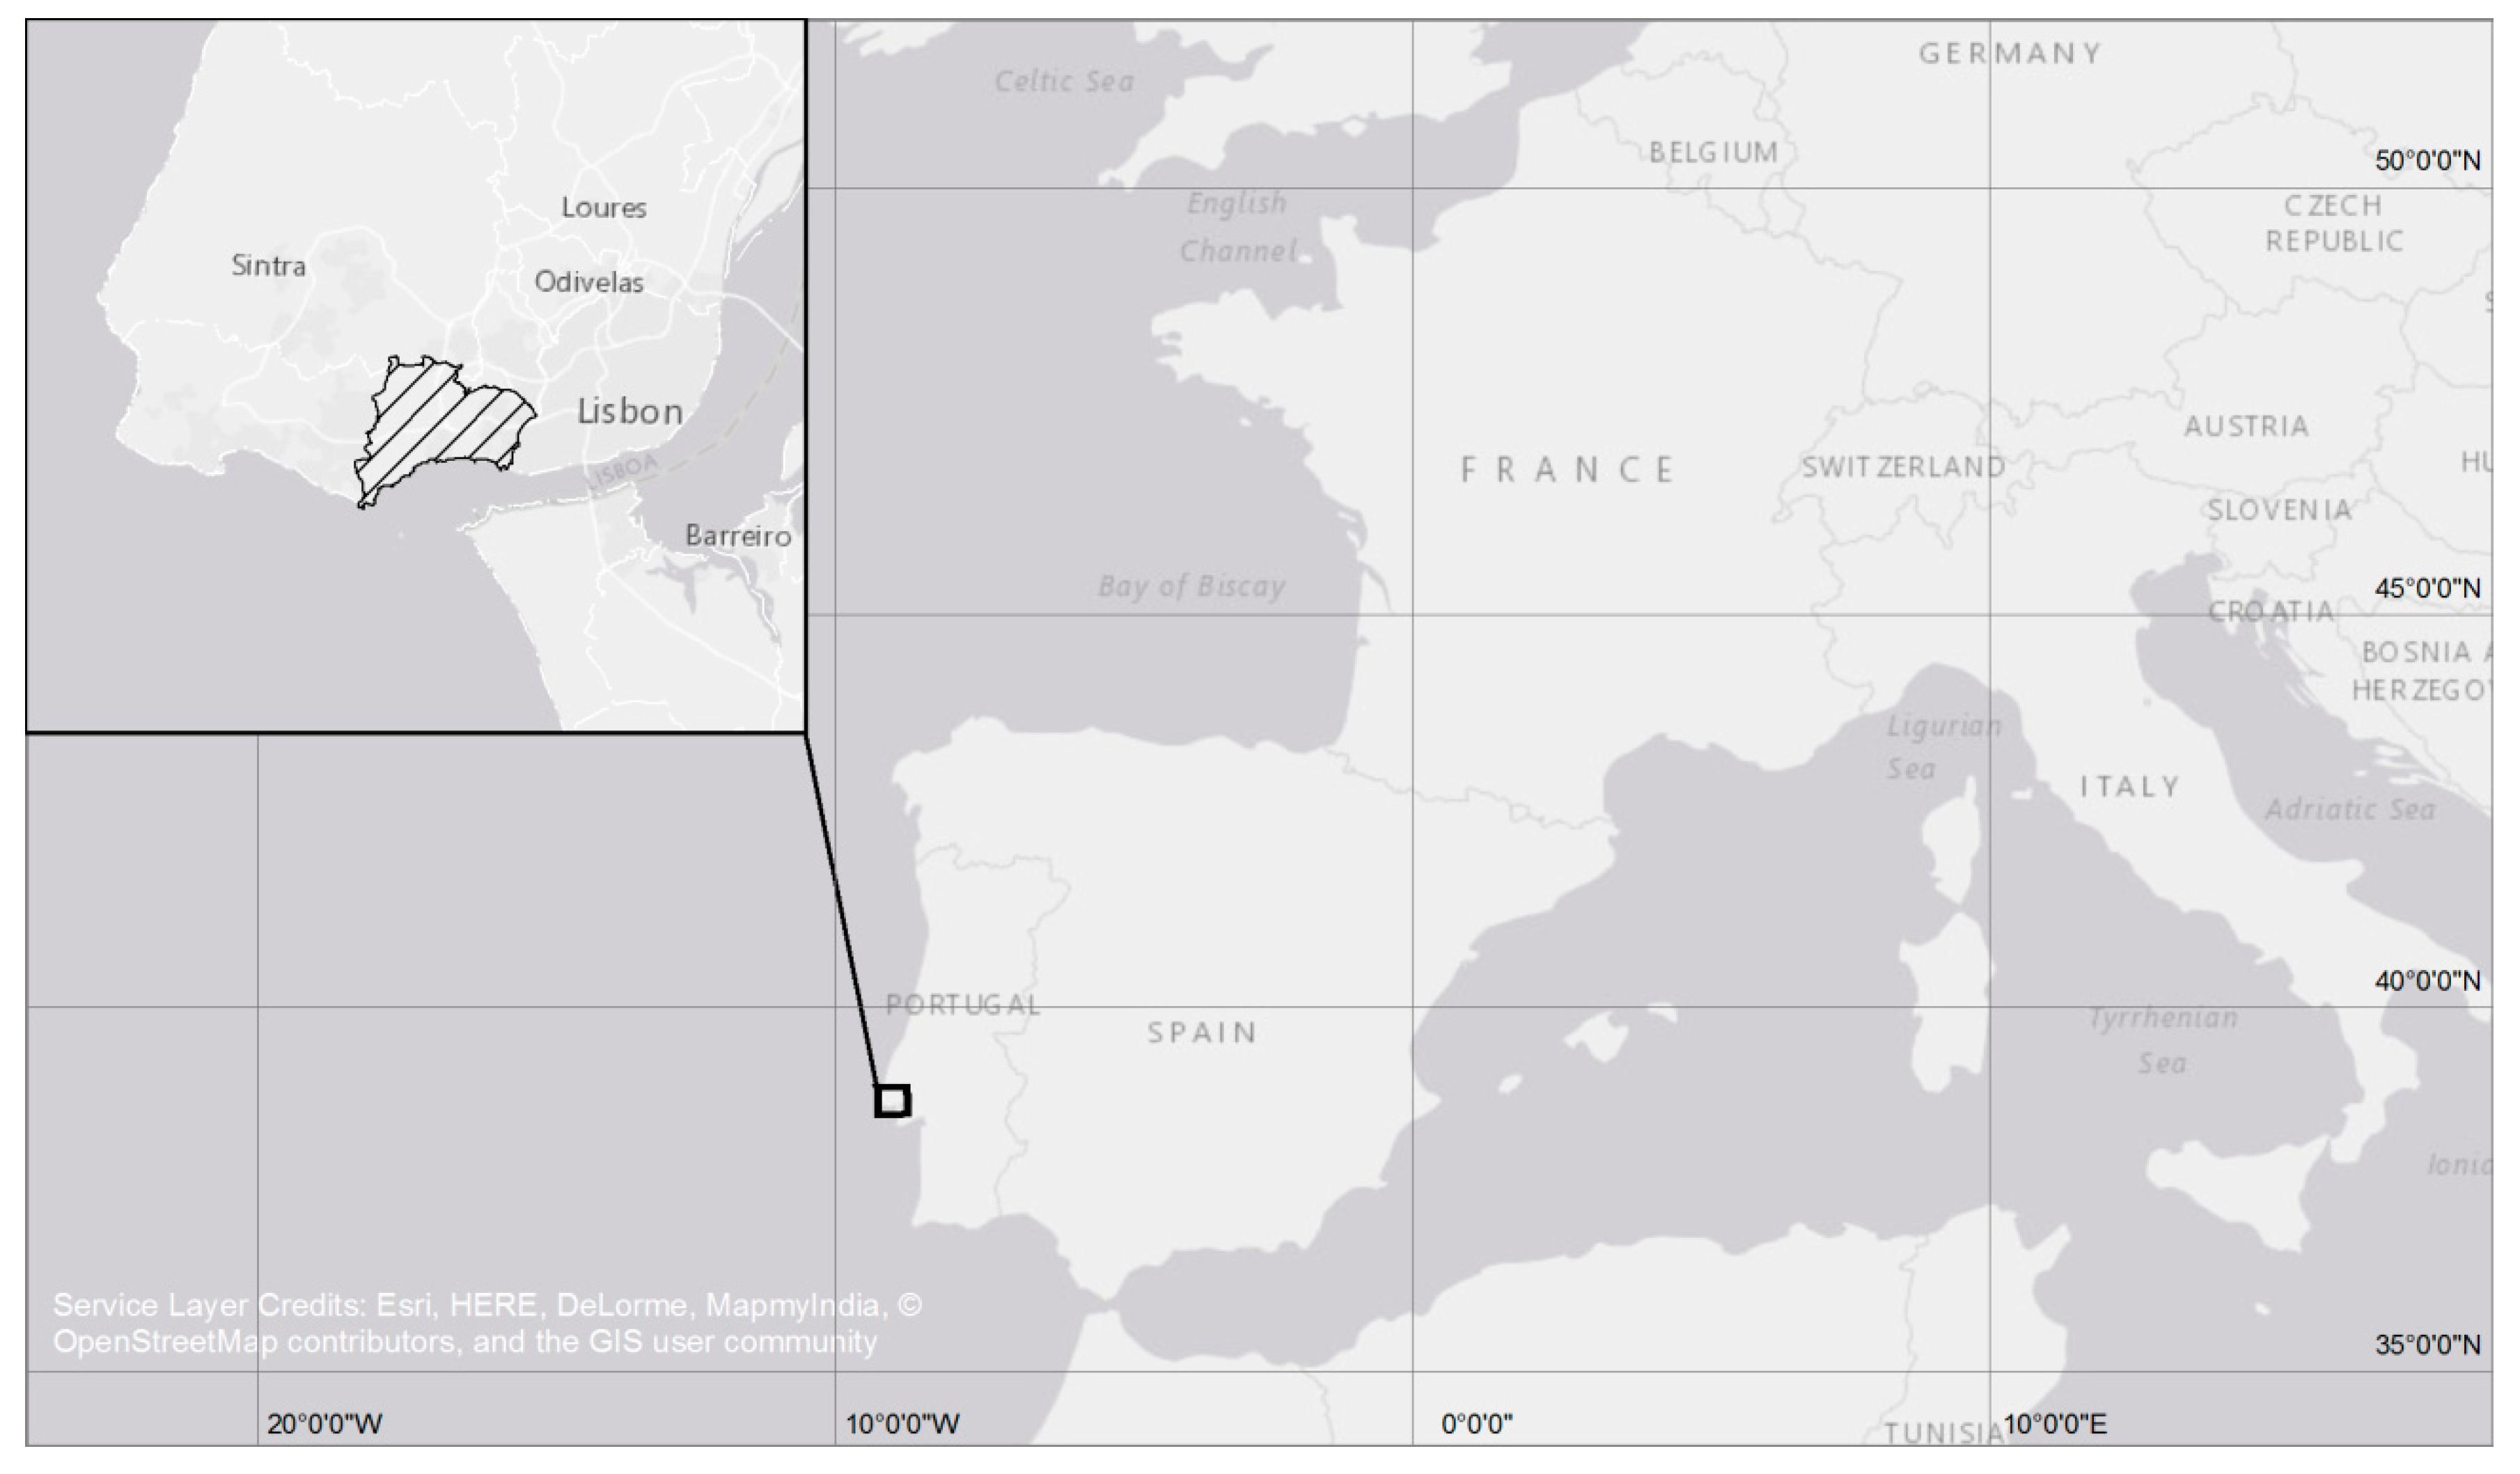
3.1. Study Area
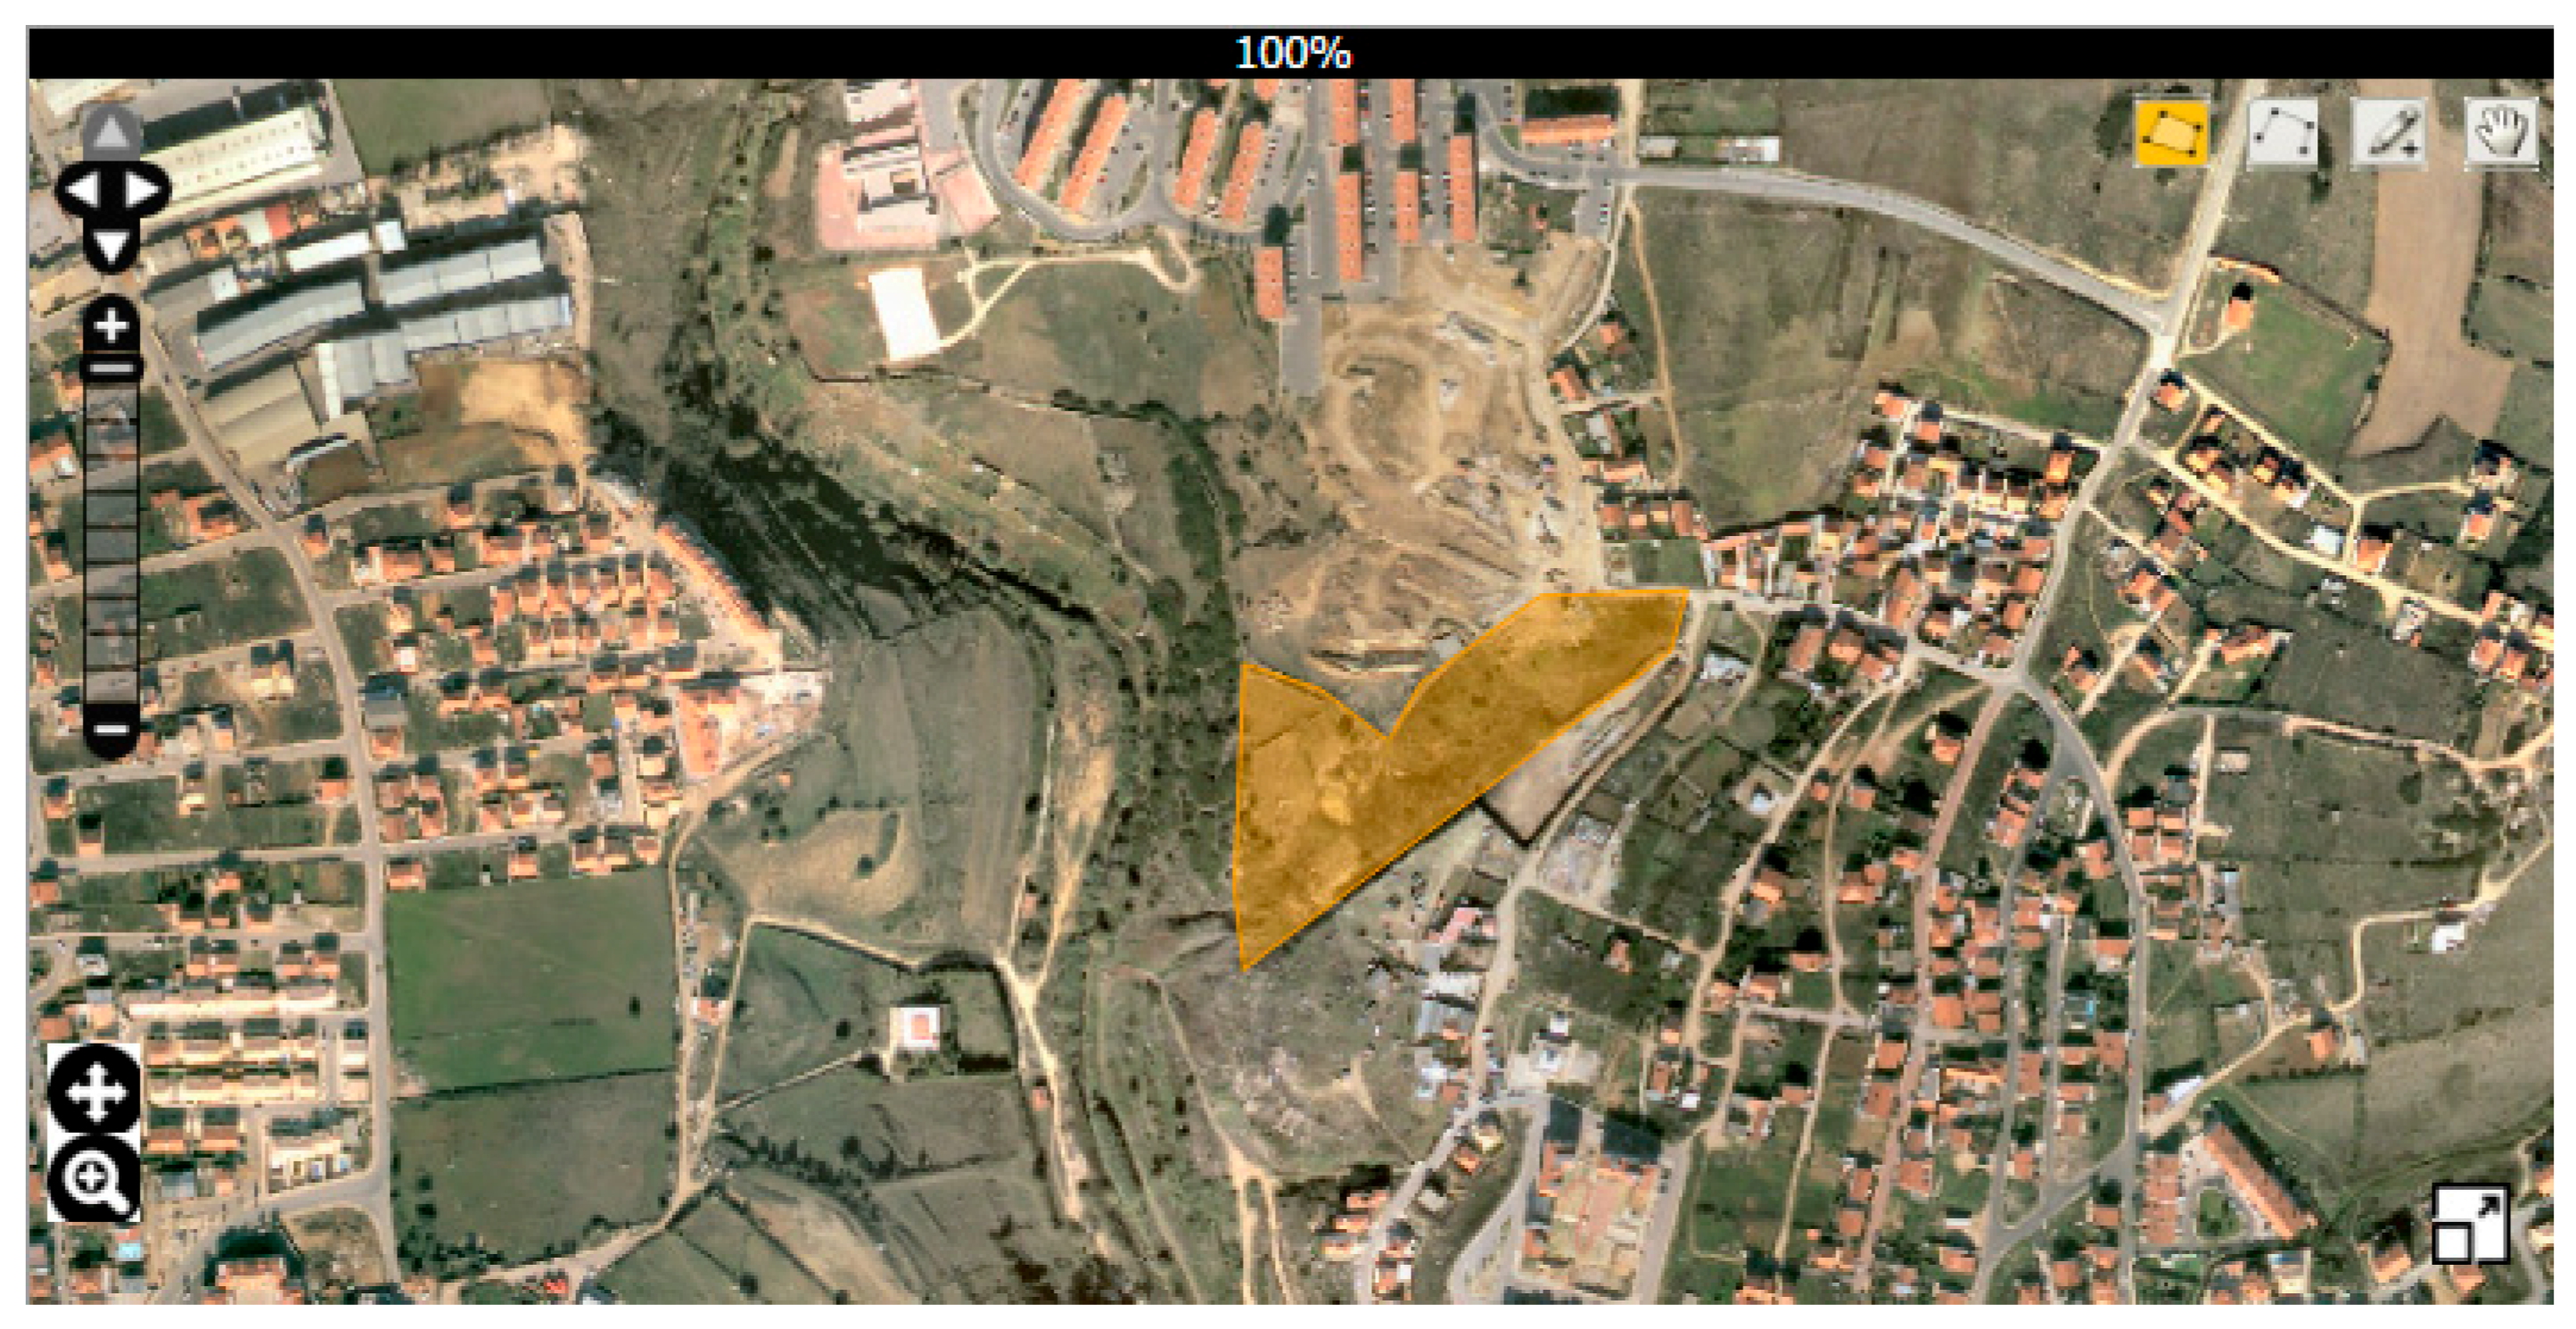
3.2. Scenarios
4. Discussion
- The integrated use of vulnerability components (physical, social, economic and environmental vulnerability), may be too complex regarding the number of indexes to be calculated and the diversity of variables involved;
- The multicriteria approach for the components of vulnerability considered, despite the advantages [16], is always debatable;
- In all components, the adaptability of variables and weights to regional characteristics is a critical point;
- When calculating indexes for different vulnerability components their use in a composite index constitute problems of comparability;
- When the statistical block is used as the geographical unit of analysis, the problems associated with data aggregation are also a critical point.
5. Conclusions
Author Contributions
Acknowledgments
Conflicts of Interest
References
- Newman, J.; Maier, H.; Riddell, G.; Zecchin, A.; Daniell, J.; Schaefer, A.; van Delden, H.; Khazai, B.; O’Flaherty, M.; Newland, C. Review of literature on decision support systems for natural hazard risk reduction: Current status and future research directions. Environ. Model. Softw. 2017, 96, 378–409. [Google Scholar] [CrossRef]
- Queirós, M. Riscos e Ordenamento do Território: Prometeus ou conhecimento e partilha. Rev. Cons. Nac. Planeam. Civ. Emerg. 2009, 25, 20–28. [Google Scholar]
- Neuvel, J. Geographical Dimensions of Risk Management—The Contribution of Spatial Planning and Geo-ICT to Risk Reduction. Ph.D. Thesis, Wageningen University, Wageningen, The Netherlands, 2009. [Google Scholar]
- Schmidt-Thomé, P. Integration of Natural Hazards, Risk and Climate Change into Spatial Planning Practices. Ph.D. Thesis, Helsinki University, Helsinki, Suomi, 2006. [Google Scholar]
- Greiving, S.; Fleischhauer, M.; Wanczura, S. Management of Natural Hazards in Europe: The Role of Spatial Planning in Selected EU Member States. J. Environ. Plann. Manag. 2006, 49, 739–757. [Google Scholar] [CrossRef]
- Ran, J.; Nedovic-Budic, Z. Integrating spatial planning and flood risk management: A new conceptual framework for the spatially integrated policy infrastructure. Comput. Environ. Urban Syst. 2016, 57, 68–79. [Google Scholar] [CrossRef]
- Mileu, N. Integrating Risk Maps in the Definition of Municipal Territorial Models. Finisterra LIII 2018, 107, 51–66. [Google Scholar]
- Sugumaran, R.; DeGroote, J. Spatial Decision Support Systems—Principles and Practices; CRC Press, Taylor&Francis Group: Boca Raton, FL, USA, 2011. [Google Scholar]
- Eissa, A. Spatial Decision Support System for Infrastructure Resource allocation. Master’s Thesis, University of Twente, Enschede, The Nederlands, 2013. [Google Scholar]
- Newman, J.; Maier, H.; Delden, H.; Zecchin, A.; Dandy, G.; Riddel, G.; Newland, C. Literature Review on Decision Support Systems for Optimising Long-Term Natural Hazard Mitigation Policy and Project Portfolios; Report 2014.009; Bushfire and Natural Hazards CRC: Melbourne, Australia, 2014. [Google Scholar]
- Belardo, S.; Karwan, K.; Wallace, W. An investigation of system-design considerations for emergency management decision support. IEEE Trans. Syst. Man Cybern. 1984, 14, 795–804. [Google Scholar] [CrossRef]
- Belardo, S.; Karwan, K.; Wallace, W. Managing the response to disasters using microcomputers. Interfaces 1984, 14, 29–39. [Google Scholar] [CrossRef]
- Wallace, W.; Debalogh, F. Decision support systems for disaster management. Public Adm. Rev. 1985, 45, 134–146. [Google Scholar] [CrossRef]
- Cioca, M.; Cioca, L. Decision Support Systems used in Disaster Management. In Decision Support Systems; Jao, S., Ed.; Intech: Rijeka, Croatia, 2010; pp. 371–391. ISBN 978-953-7619-64-0. [Google Scholar]
- Cioca, M.; Filip, F. Decision Support Systems—A Bibliography 1947–2007. Available online: http://www.cif.ulbsibiu.ro/mariusc/bibliographySSD.htm (accessed on 30 November 2015).
- Mileu, N. Sistema de Apoio à Decisão na Gestão do Risco à Escala Municipal. Ph.D. Thesis, University of Lisbon, Lisbon, Portugal, 2016. [Google Scholar]
- European Communities (EC). European Spatial Development Perspective; European Communities: Potsdam, Germany, 1999; ISBN 92-828-7658-6. [Google Scholar]
- Applied Multi Risk Mapping of Natural Hazards for Impact Assessment (ARMONIA). A Summary of the Research Undertaken by the ARMONIA Research Project, Funded under the Sixth EU Framework Programme for Research and Technological Development; with Support of T6 Società Cooperativa; Lancaster University, Department of Geography: Lancaster, UK, 2007. [Google Scholar]
- Harmonised Hazard, Vulnerability and Risk Assessment Methods Informing Mitigation Strategies Addressing Land-use Planning and Management. Available online: https://forum.eionet.europa.eu/eionet-air-climate/library/public/2010_citiesproject/interchange/armonia_project/armonia_project_8/download/en/1/ARMONIA_PROJECT_Deliverable%205.1.pdf (accessed on 20 March 2018).
- Julião, R.; Nery, F.; Ribeiro, J.L.; Zêzere, J.L. Guia Metodológico Para a Produção de Cartografia Municipal de Risco e Para a Criação de Sistemas de Informação Geografica (SIG) de Base Municipal; Autoridade Nacional de Protecção Civil/Direcção Geral de Ordenamento do Território e Desenvolvimento Urbano/Instituto Geográfico Português: Lisboa, Portugal, 2009. [Google Scholar]
- UNISDR. Living with Risk. A Global Review of Disaster Reduction Initiatives; United Nations International Strategy for Disaster Reduction: Geneva, Switzerland, 2004; ISBN 9211010640. [Google Scholar]
- Implementation of a Case Study Simulation, Armonia Project: Applied Multi-Risk Mapping of Natural Hazards for Impact Assessment. Available online: https://forum.eionet.europa.eu/eionet-air-climate/library/public/2010_citiesproject/interchange/armonia_project/armonia_project_10/download/en/1/ARMONIA_PROJECT_Deliverable%206.1.pdf (accessed on 20 March 2018).
- Bana e Costa, C.; Corte, J.; Vansnick, J. M-MACBETH Versão 2.4.0 Guia do Utilizador. 2015. Available online: http://www.m-macbeth.com/help/pdf/M-MACBETH%202.4.0%20Guia%20do%20utilizador.pdf (accessed on 30 November 2015).
- Müller, A.; Reiter, J.; Weiland, U. Assessment of urban vulnerability towards floods using an indicator-based approach—A case study for Santiago de Chile. Nat. Hazards Earth Syst. Sci. 2011, 11, 2107–2123. [Google Scholar] [CrossRef]
- Caballero, D.; Beltrán, I.; Velasco, A. Forest Fires and Wildland-Urban Interface in Spain: Types and Risk Distribution. In Proceedings of the 4th International Wildland Fire Conference, Seville, Spain, 13–17 May 2007; ISBN ISBN 978-84-8014-691-3. [Google Scholar]
- Abella, E. Multi-Scale Landslide Risk Assessment in Cuba. Ph.D. Thesis, University of Utrecht, Utrecht, The Netherlands, 2008. [Google Scholar]
- Dall’Osso, F.; Dominey-Howes, D. A Method for Assessing the Vulnerability of Buildings to Catastrophic (Tsunami) Marine Flooding; Sydney Coastal Councils Group Inc.: Sydney, Australia, 2009; p. 138. [Google Scholar]
- Giovinazzi, S.; Lagomarsino, S. A Macroseismic Method for the Vulnerability Assessment of Buildings. In Proceedings of the 13th World Conference on Earthquake Engineering, Vancouver, BC, Canada, 27 June 2004; p. 896. [Google Scholar]
- Melis, D.; Maltinti, F. Develloping a Vulnerability Index for Road Networks Under Hidrogeological Events. In Proceedings of the 4th Kuhmo-Nectar Conference and Summer School—“Transport and Urban Economics”, Copenhagen, Denmark, 29 June–3 July 2009. [Google Scholar]
- Jenelius, E. Large-Scale Road Network Vulnerability Analysis. Ph.D. Thesis, Royal Institute of Technology, Stockholm, Sweden, 2010. [Google Scholar]
- Van Westen, C.J.; Alkema, D.; Damen, M.; Kerle, N.; Kingma, N. Multi-Hazard Risk Assessment, Distance Education Course; Guide Book; United Nations University–ITC School on Disaster Geoinformation Management (UNU-ITC DGIM): Geneva, Switzerland, 2011. [Google Scholar]
- Flanagan, B.; Gregory, E.; Hallisey, E.; Heitgerd, J.; Lewis, B. A Social Vulnerability Index for Disaster Management. J. Homel. Secur. Emerg. Manag. 2011, 8, 3. [Google Scholar] [CrossRef]
- Léon, J. Vulnerability—A Conceptual and Methodological Review; Publication Series of United Nations University—Institute for Environment and Human Security (UNU-EHS): Bonn, Germany, 2006. [Google Scholar]
- Sebald, C. Towards an Integrated Flood Vulnerability Index—A Flood Vulnerability Assessment. Master’s Thesis, University of Twente, Enschede, The Netherlands, 2010. [Google Scholar]
- Municípia. Oeiras, Factos e Números—Edição Especial, 1st ed.; Município de Oeiras: Oeiras, Portugal, 2013. [Google Scholar]
- Openshaw, S. The Modifiable Areal Unit Problem, Concepts and Techniques in Modern Geography; Geobooks: Norwich, UK, 1983; Volume 38. [Google Scholar]
- Mileu, N. Definição Automática de Áreas Censitárias. Master’s Thesis, Technical University of Lisbon, Lisbon, Portugal, 2001. [Google Scholar]
- Dias, M. Leitura e Comparação de Mapas Temáticos em Geografia; Memórias do Centro de Estudos Geográficos, 13: Lisboa, Portugal, 1991. [Google Scholar]
- Silva, A. Gráficos e Mapas–Representação de Informação Estatística; LIDEL: Lisboa, Portugal, 2006. [Google Scholar]


| Class | Index |
|---|---|
| High | 3 |
| Moderate | 2 |
| Low | 1 |
| Null or Non-Applicable | 0 |
| Risk Components | Data | Source | ||
|---|---|---|---|---|
| Hazard indexes | Flood hazard | Oeiras Hydrologic and Hydraulic Flood Study|Municípia|2011 | ||
| Forest fires susceptibility | Oeiras Hydrologic and Hydraulic Flood Study|Municípia|2011 | |||
| Earthquake hazard map | Oeiras Hydrologic and Hydraulic Flood Study|Municípia|2011 | |||
| Tsunami susceptibility | Oeiras Hydrologic and Hydraulic Flood Study|Municípia|2011 | |||
| Landslides susceptibility | Oeiras Hydrologic and Hydraulic Flood Study|Municípia|2011 | |||
| Consequences | Physical | Population | Population Census | National Statistical Institute|2011 |
| Buildings | Building inventory | Oeiras GIS Database|Oeiras Municipality|2011 | ||
| Infrastructures | Infrastructures cadastre | Oeiras GIS Database|Oeiras Municipality|2011 | ||
| Social | Population Census | National Statistical Institute|2011 | ||
| Economical | Commerce, services and equipment survey | Oeiras GIS Database|Oeiras Municipality|2012 | ||
| Environmental | Natura Network 2000 National parks | National Forest and Nature Institute | ||
© 2018 by the authors. Licensee MDPI, Basel, Switzerland. This article is an open access article distributed under the terms and conditions of the Creative Commons Attribution (CC BY) license (http://creativecommons.org/licenses/by/4.0/).
Share and Cite
Mileu, N.; Queirós, M. Integrating Risk Assessment into Spatial Planning: RiskOTe Decision Support System. ISPRS Int. J. Geo-Inf. 2018, 7, 184. https://doi.org/10.3390/ijgi7050184
Mileu N, Queirós M. Integrating Risk Assessment into Spatial Planning: RiskOTe Decision Support System. ISPRS International Journal of Geo-Information. 2018; 7(5):184. https://doi.org/10.3390/ijgi7050184
Chicago/Turabian StyleMileu, Nelson, and Margarida Queirós. 2018. "Integrating Risk Assessment into Spatial Planning: RiskOTe Decision Support System" ISPRS International Journal of Geo-Information 7, no. 5: 184. https://doi.org/10.3390/ijgi7050184