1. Introduction
The development of satellite remote-sensing, global navigation systems, aerial photogrammetric cameras, sensor networks, radar remote sensing and laser scanning contributed to an exponential increase in the collected amount of geospatial data [
1]. The amount of collected data largely exceeds the possibility of its storage on individual computers and requires storing on a computer cluster. Point cloud data play an important role in various geospatial applications because they provide abundant information that can be used for different types of analysis. Apache Spark introduces a new platform for distributed processing that runs on one of the cluster resource managers such as Mesos or YARN. It is designed to maintain scalability and fault tolerance of MapReduce programs, but also to support applications for which MapReduce was inefficient. This is achieved through the functionality of intra-memory execution.
Point cloud represents a set of points in an arbitrary coordinate system. In the field of geoinformatics, the point cloud is usually the set of points in a three-dimensional coordinate system. Beside coordinates, every point in the cloud contains a set of attributes, like classification, color and time of acquisition. Due to its characteristics, the point cloud is usually considered a separate data type, beside raster and vector. In that regard, it is not possible to use the methods for processing of raster and vector data on point clouds. Modern techniques for collecting and processing data, like LiDAR and photogrammetry, can generate point clouds with billions of points. So far, there has been little exploration of the processing of large point clouds using distributed computing technology. The Apache Spark framework was chosen as a base for distributed processing of the point clouds. The basic unit of distributed processing in Spark is a resilient distributed dataset (RDD), which represents a read-only collection of objects, shared and distributed on a computer cluster, which can be re-generated if some partition is lost [
2,
3,
4]. The RDD with defined schema represents DataFrame, which is similar to tables in standard databases. The operations over the DataFrame can be expressed as SQL statements or defined using standard RDD operations like
map() and
filter(). The DataFrame Application Programming Interface (API) allows definition of domain-specific language constructs for the domain of interest, for example, point cloud type and operations.
Until now, many Big Data based solutions, which provide a good platform for processing large amounts of data, have been developed. The base problem in the distributed processing of geospatial big data are the methods for the indexing and storing of data. With the use of the GeoSpark library, the standard form of RDD has been expanded into a spatial RDD (SRDD) form. The query operations, provided through a spatial query processing layer, are performed over objects stored in SRDD [
5]. GeoSpark decides how spatial relational n-boxes can be stored, indexed and obtained using SRDD, and returns the results of a spatial query. The GeoMesa library is a spatial-time library that allows Apache Spark to be used over data stored in Big Data stores, Apache Hadoop Distributed File System (HDFS) files, or any other store that the GeoMesa library converter can read. It enables creation of Spark RDDs and DataFrames from data stored in GeoMesa and serialization of SimpleFeatures using Kryo. Currently, it works with three major Hadoop-based database systems: Accumulo, Apache HBase and Google Cloud BigTtable [
6]. Every vector data within the GeoMmesa database is described by two spatial coordinates, latitude and longitude, and the time coordinate. The data is stored in the form of two types of key-values pairs, indexes and data. The index key-value pairs allows spatial and time indexing, while the data key-value pairs contain data related to the observed spatial-temporal coordinates. On the basis of spatial coordinates, a Geohash string of 7 characters is formed corresponding to a spatial resolution of 150 m. The time coordinate is described by the string of yyyyMMddhh format, which provides a time resolution of 1 h. The index key is formed by interleaving the two previously described strings. The indexing schema can be adapted to the structure and resolution of user data. The GeoTrellis library runs fast batch processing on large raster data and supports distributed processing based on Spark. Geospatial raster is spatially divided into tiles and stored within HDFS or the Apache Accumulo database in the form of key-value pairs. The key represents the unique tile identifier, and the value of the raster tile of the original file. Each worker processes one or more tiles. It currently uses Akka clustering to distribute data through a cluster. The GeoWave library supports Apache Accumulo and Apache Hbase repositories and provides out-of-the-box support for distributed key-value stores. It uses multiple, gridded space filling curves (SFCs) to index data to the desired key-value store. Indexing information is stored in a generic key structure that can be used for server-side processing [
7]. Zhou et al. proposed a GeoSpark SQL framework which provides convenient interface for geospatial SQL queries on top of Apache Spark. The experimental results show that Apache Spark has a better performance than traditional RDBMS for various types of geospatial queries [
8].
Regarding point cloud big data in a distributed environment, there is a small number of relevant papers. A file-centric approach for storage of large point clouds collected by LiDAR is described in [
9]. The point clouds are sliced in rectangular regions and each region is stored in a file. Rectangular regions are indexed using the Geohash system and stored in MongoDB database along with the location of the corresponding file. Such a structure allows executions of MapReduce operations on point clouds, either from MongoDB or from an external framework, like Apache Hadoop. The methods based on Apache Spark for large point cloud management are described in [
10,
11]. The method for ingesting the point clouds in the Apache Spark data structures is presented in [
10]. The indexing of point clouds based on space filling curves is presented in [
11]. The methods for classification, feature identification and change detection using large point clouds are described in [
12,
13,
14,
15].
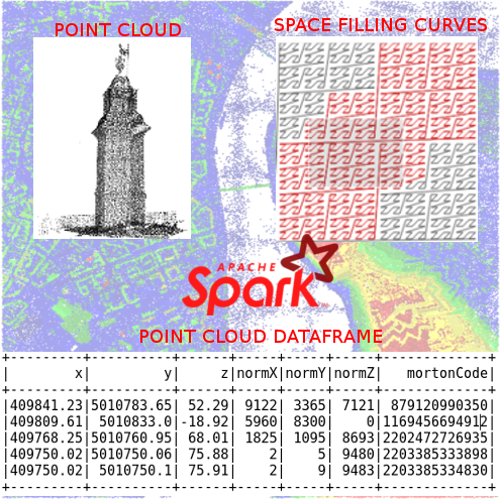
This paper presents the method for point cloud management in a distributed environment based on Apache Spark framework. The main problem that needed to be solved was dimensionality reduction from three-dimensional space to one-dimensional array while preserving the spatial locality of points. This was achieved by using Z-order SFCs. Although, another SFC type exists, which better preserves spatial locality, Z-order curve has been chosen due to the easy calculation of Morton codes. The specific Big Data store schema for point cloud storage was defined in order to provide efficient query operations. The Point cloud data type was defined as DataFrame of PointUDT (user defined type). The operations over point clouds were defined as an array of SQL queries which use a set of user defined functions (UDFs). The proposed method was compared to traditional RDBMS PostgreSQL. The paper concludes with analysis of results and proposal for the future studies.
2. Materials and Methods
When we defined a large point cloud management model, we decided to base it on Big Data techniques. These techniques have proven to be useful for working with other types of geospatial data, as well as working with point clouds. The goal of the model is to create a Point Cloud Data Management System (PCDMS) fully based on the Big Data paradigm which would allow practically unlimited scalability of the system. As we already mentioned, the model is based on the recommendations defined by [
2]. Also, the results of the research in the field of large point cloud management were taken into consideration. The following system components were considered and defined: logical model (data schema), input/output, indexing, physical model (data format, storage), operations, domain specific language (DSL), user defined types and functions.
2.1. Apache Spark Framework
The Apache Spark application can be written in Scala, Python, Java or R. It contains libraries for streaming, graph processing and machine learning based on Big Data concepts. Spark runs programs up to 100 times faster than Hadoop MapReduce with data cashed in memory or 10 times faster when the data is stored on a disk. The data processing is defined as a composition of functions, like map, filter and reduce. The processing plan is then distributed to every node in the cluster [
16].
When creating a RDD, which is a read-only collection of objects, shared and distributed on a computer cluster, this can be re-generated if some partition is lost. Processing in Spark consists of creating new RDDs, transforming existing RDDs, or performing operations that calculate results based on RDDs. Basically, Spark automatically distributes data that RDD contains across clusters and executes parallel operations over them. Apache Spark allows RDD to be accompanied with schema and executes the queries over them, which is similar to tables in standard databases. Such RDDs are composed of rows of objects and have additional schema information about the data types of each column. In recent versions of Spark, it has been renamed to DataFrame. User defined types can be used to define the DataFrame schema and they can be used by Spark to optimize query execution [
17].
2.2. Study Area
The frequent representation and expansion of the use of large data technology and the evolution of Internet of Things (IoT) technology have played an important role in the feasibility of smart cities’ initiatives. Big data offers the potential for cities to be able to monitor, inspect, analyze and plan from large amounts of data collected through different sources, while IoT enables the integration of sensors. They merge geographic sensor data with business information, and transform knowledge of the area and work habits of consumers into the intelligent information ecosystem, enabling cities to feel, decide and act quickly as the city grows [
18,
19].
The data used in the experiments was acquired by aerial laser scanning of a part of the city of Novi Sad. Also, one data set collected by terrestrial means was also used in order to test the method with an even larger volume of data.
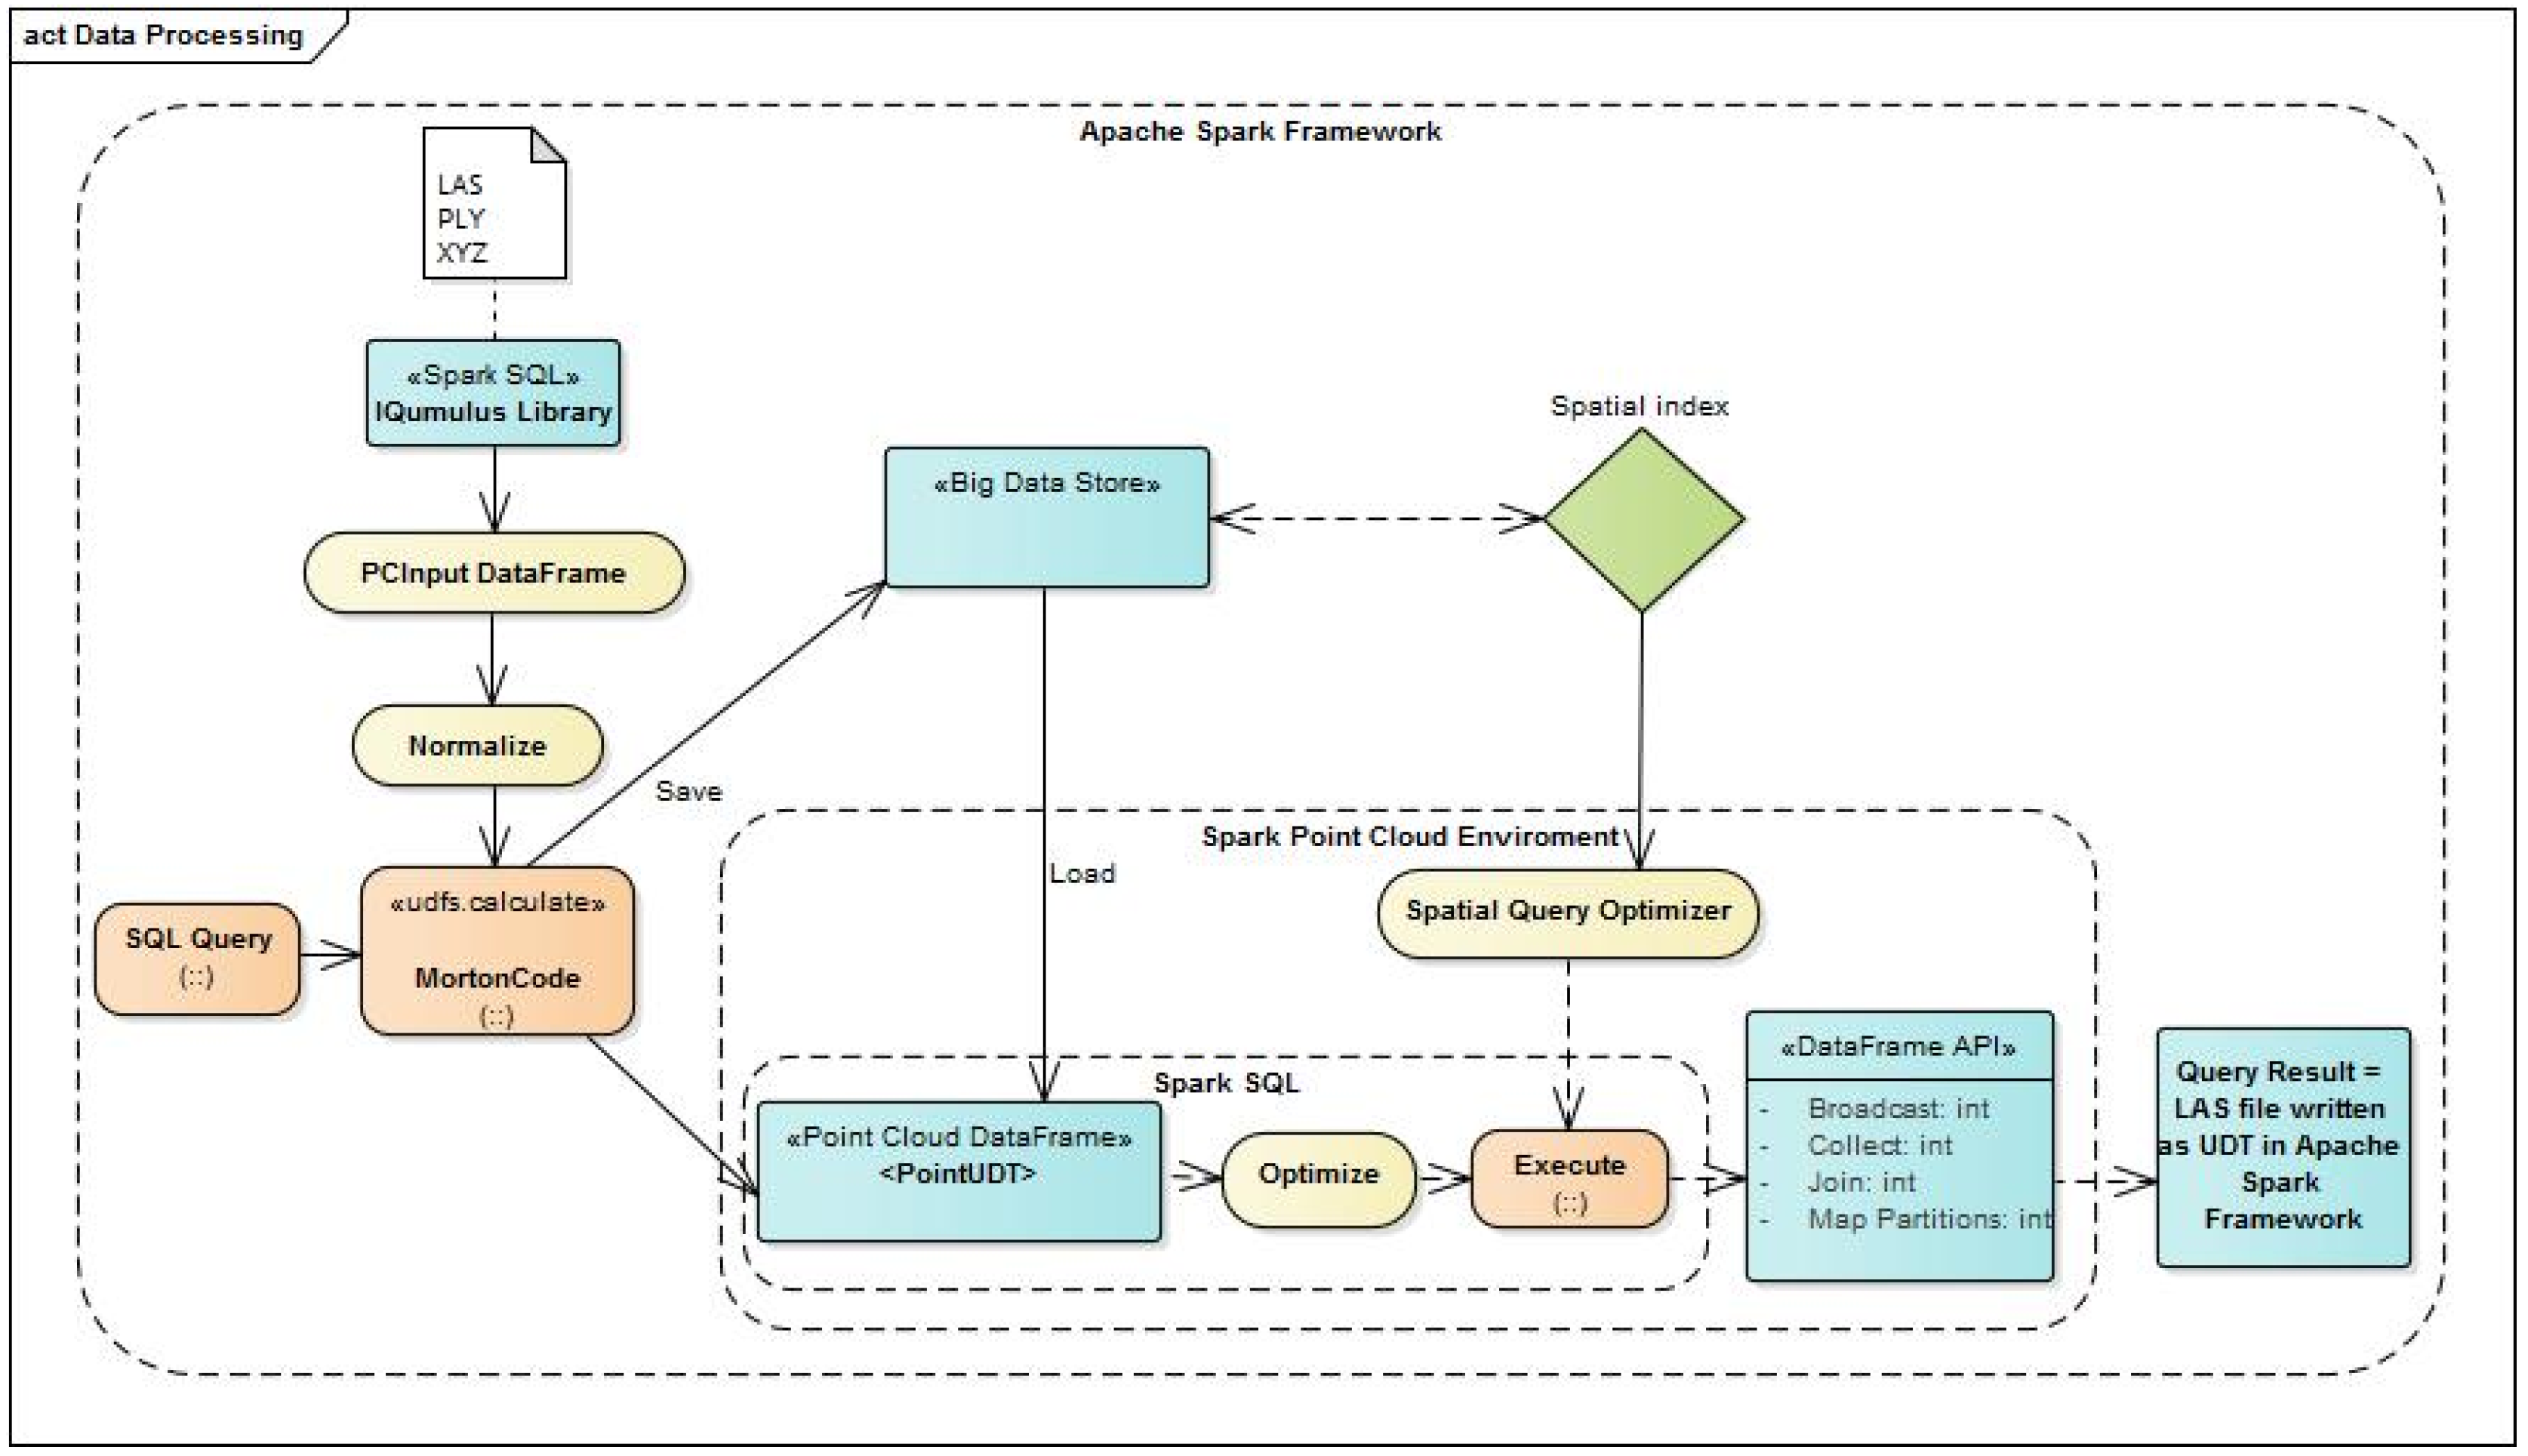
2.3. Data-Processing Module Architecture
In most cases, the point cloud data is stored in a file. Due to limits of the file storage system, point cloud data has to be divided in numerous files. Files may be located on one or more computers within a computer network. The most commonly used data format is ASPRS LAS, which contains points, as well, corresponding metadata. The next widely used format is a delimited text format where each point represents a single line of text where the coordinates and other attributes are separated by some delimiting character. This format does not contain associated metadata. The most commonly used record formats are LAS, Polygon File Format (PLY) and delimited text (XYZ). In addition to these formats, there are still several in use, such as E57 and PCD, which could be implemented in a similar way, but this goes beyond the scope of this paper. Loading points in our data-processing module are done in the way described below. The architecture of the data-processing module, defined by the proposed method, is shown in
Figure 1.
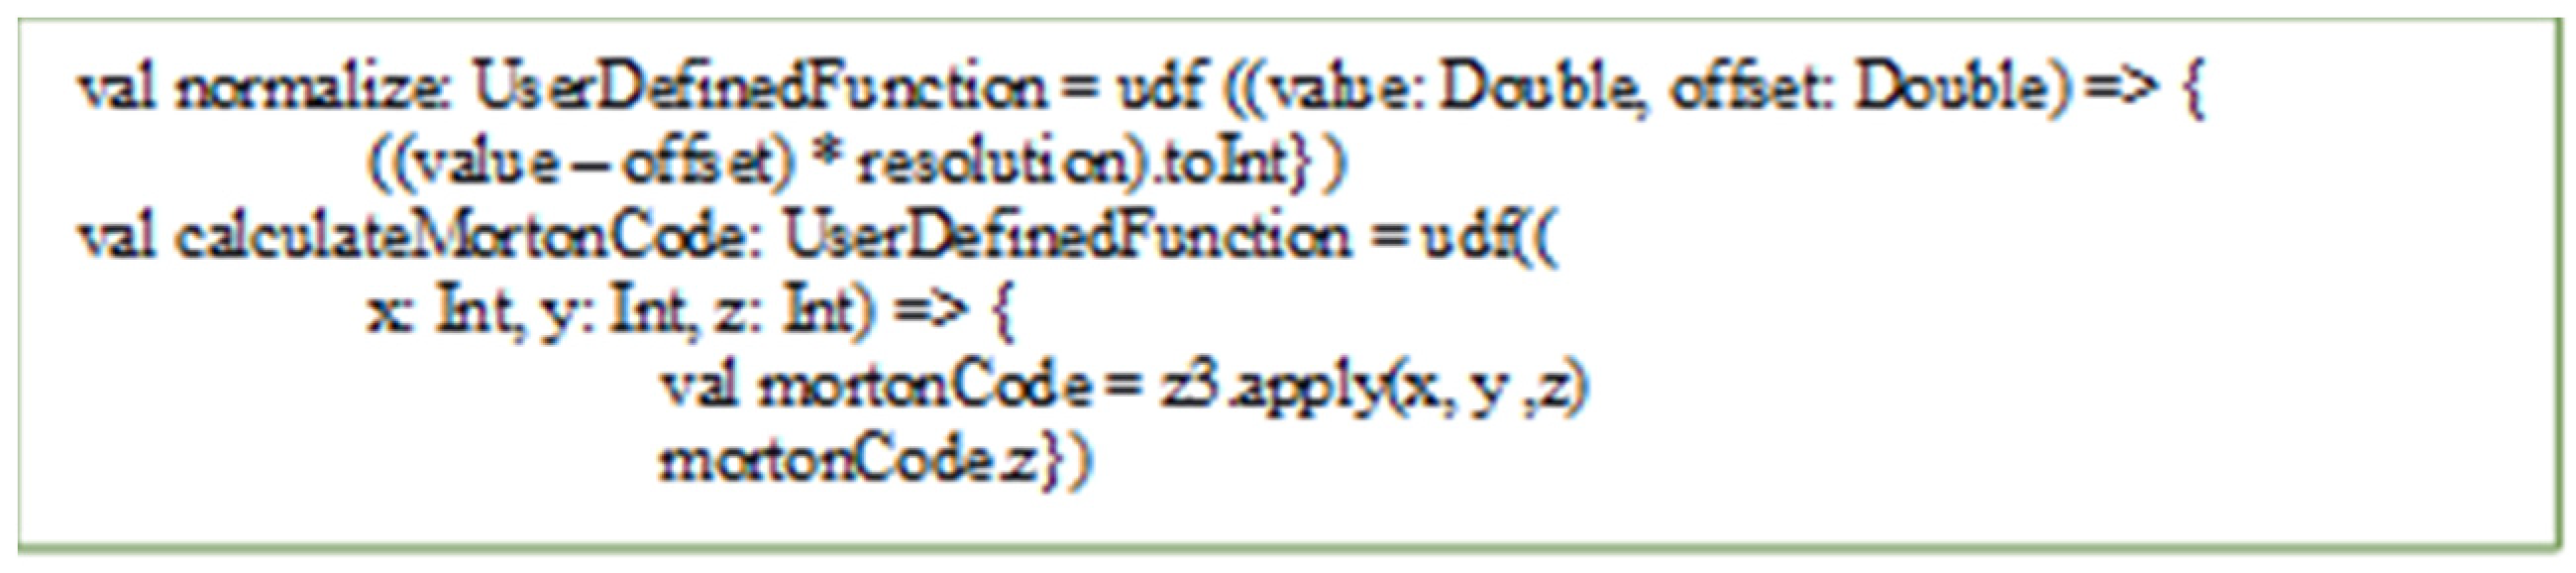
The input/output module is based on the Spark SQL IQmulus Library that provides Input/Output of LAS, PLY and XYZ files. When data is loaded, coordinates are normalized and the Morton code is calculated, which is one of the most commonly used mechanisms for generating keys that identify the octal tree nodes and serves to calculate its address within the hash table [
20,
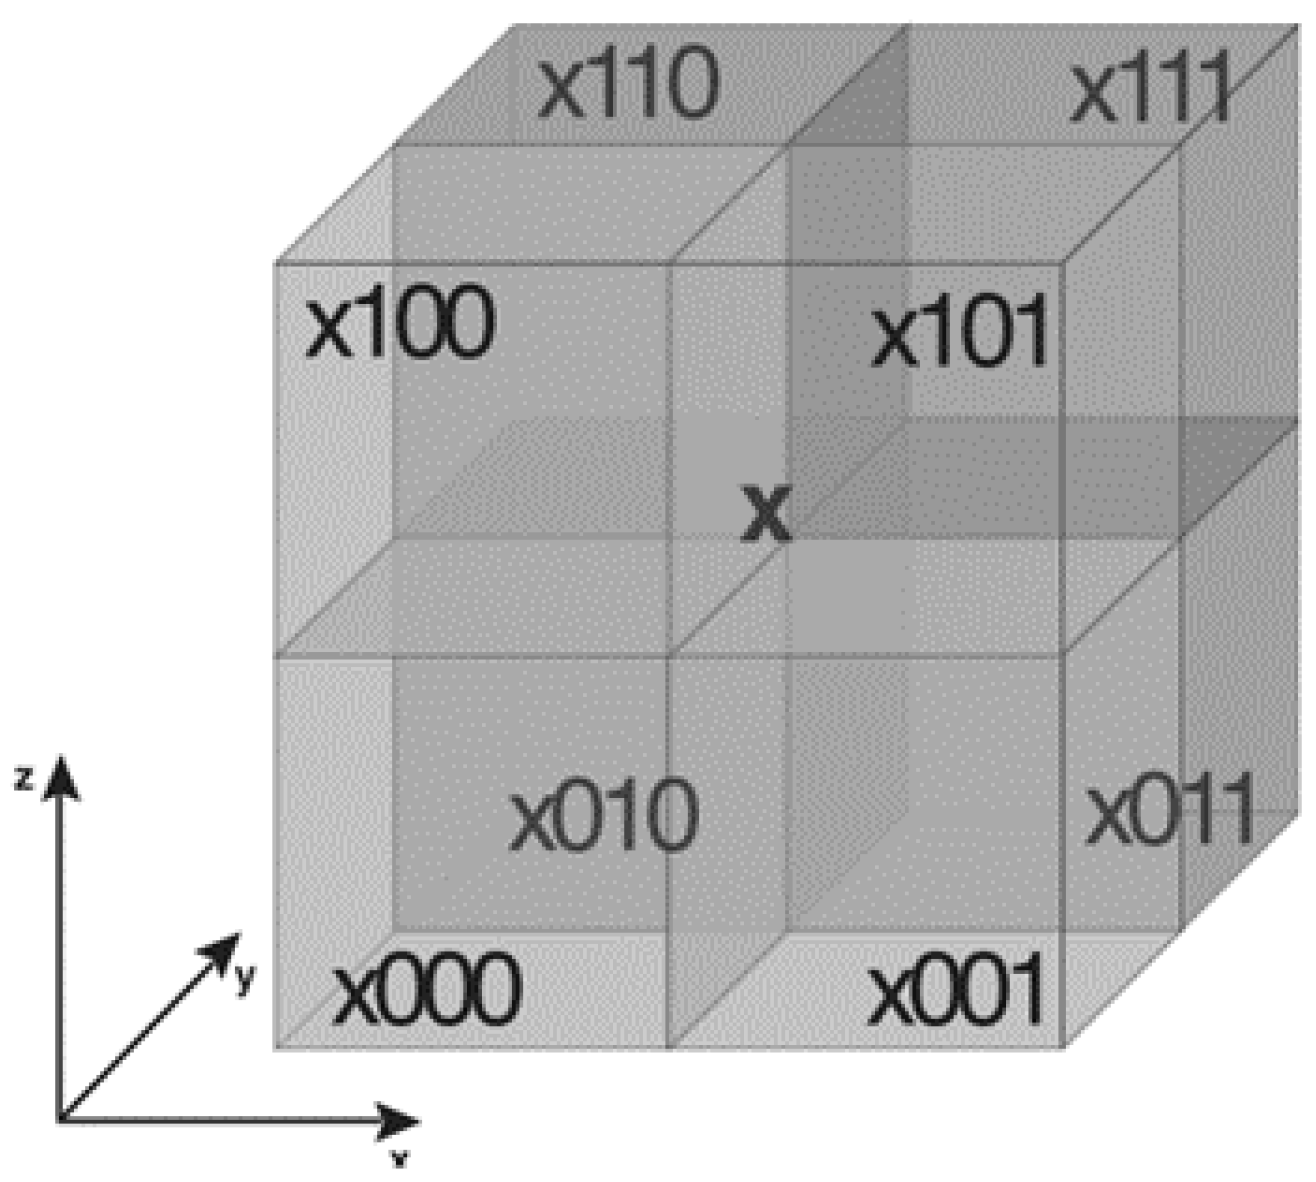
21]. Morton codes are easily calculated and they preserve good spatial locality. They are generated by recursive passage through the hierarchy of the octal tree. The root of the tree is assigned the key 1, and the keys of the child nodes are formed by combining the key of the parent node with its position inside it encoded by three bits.
Figure 2 shows the encoding method for nodes of the node X.
The storage module provides the storage of data in a distributed frame while the Morton code of the point represents the module for UDT, UDF and DSL. The data is loaded into PCInputDataFrame by file path. Then a spatial range is defined for the complete set of loaded points. The spatial range is determined from the metadata, from the original LAS format or from the coordinates of the points if the format of a delimited text. Also, coordinate precision data can be loaded from metadata or can be assigned by users. On the basis of spatial data and precision data, the Morton code is calculated for each point. Finally, points are stored in Hbase according to the schema described in the chapter on the physical data model.
2.3.1. Logical Data Model
Most existing cloud-based systems work on a similar logical data model. The cloud region is divided into rectangular blocks that include spatially closing points located within the block boundaries. For more efficient access, blocks can be indexed by a spatial index, and the same points within the blocks can be spatially indexed. However, the results of the study, described in [
4], show that block-based approaches bring significant overheads when executing queries because query accuracy is at point level. It can be concluded that the model based on blocks was created as the most effective solution for working with point clouds, taking into consideration limitations of individual work stations. Since Big Data architecture provides almost unlimited resources, the block-based model does not have to be the best solution. Therefore, in this paper, a flat model for storage of point clouds is considered. Most existing publications consider the so-called 2.5D point clouds in which the dimensions along the planimetric axes are linear, or several lines of magnitude larger than the dimension along the height axis. We have decided to define a solution that will be applicable to full 3D point clouds. Due to the limitations of distributed data warehouses it is necessary for the multi-dimensional data to be reduced to the one-dimensional application of space filling curves. Existing systems for working with spatio-temporal Big Data, such as GeoMesa and GeoTrellis, are using or experimenting with several types of space filling curves, primarily Z-order and Hilbert. We decided to use the Z-order curve based on Morton codes for easy implementation. Morton code is generated based on the coordinates of the points, which have been previously normalized to represent integer values. Then, the interleaving of the normalized coordinate values are generated and the Morton code is generated. In order to normalize the coordinates we have to know the minimum coordinates of the spatial range of that point, as well as the precision of the coordinates. For example, the millimeter accuracy is 0.001. In order to reduce the complexity we assumed that precision is equal for all three coordinates.
Normalized coordinates are determined according to the formula:
where
p is precision of coordinates and
m is Morton code created by interleaving of coordinates.
The current implementation is limited to 64-bit Morton codes, which leaves 21 bits per coordinate, but a solution that supports larger Morton codes can be implemented relatively easily.
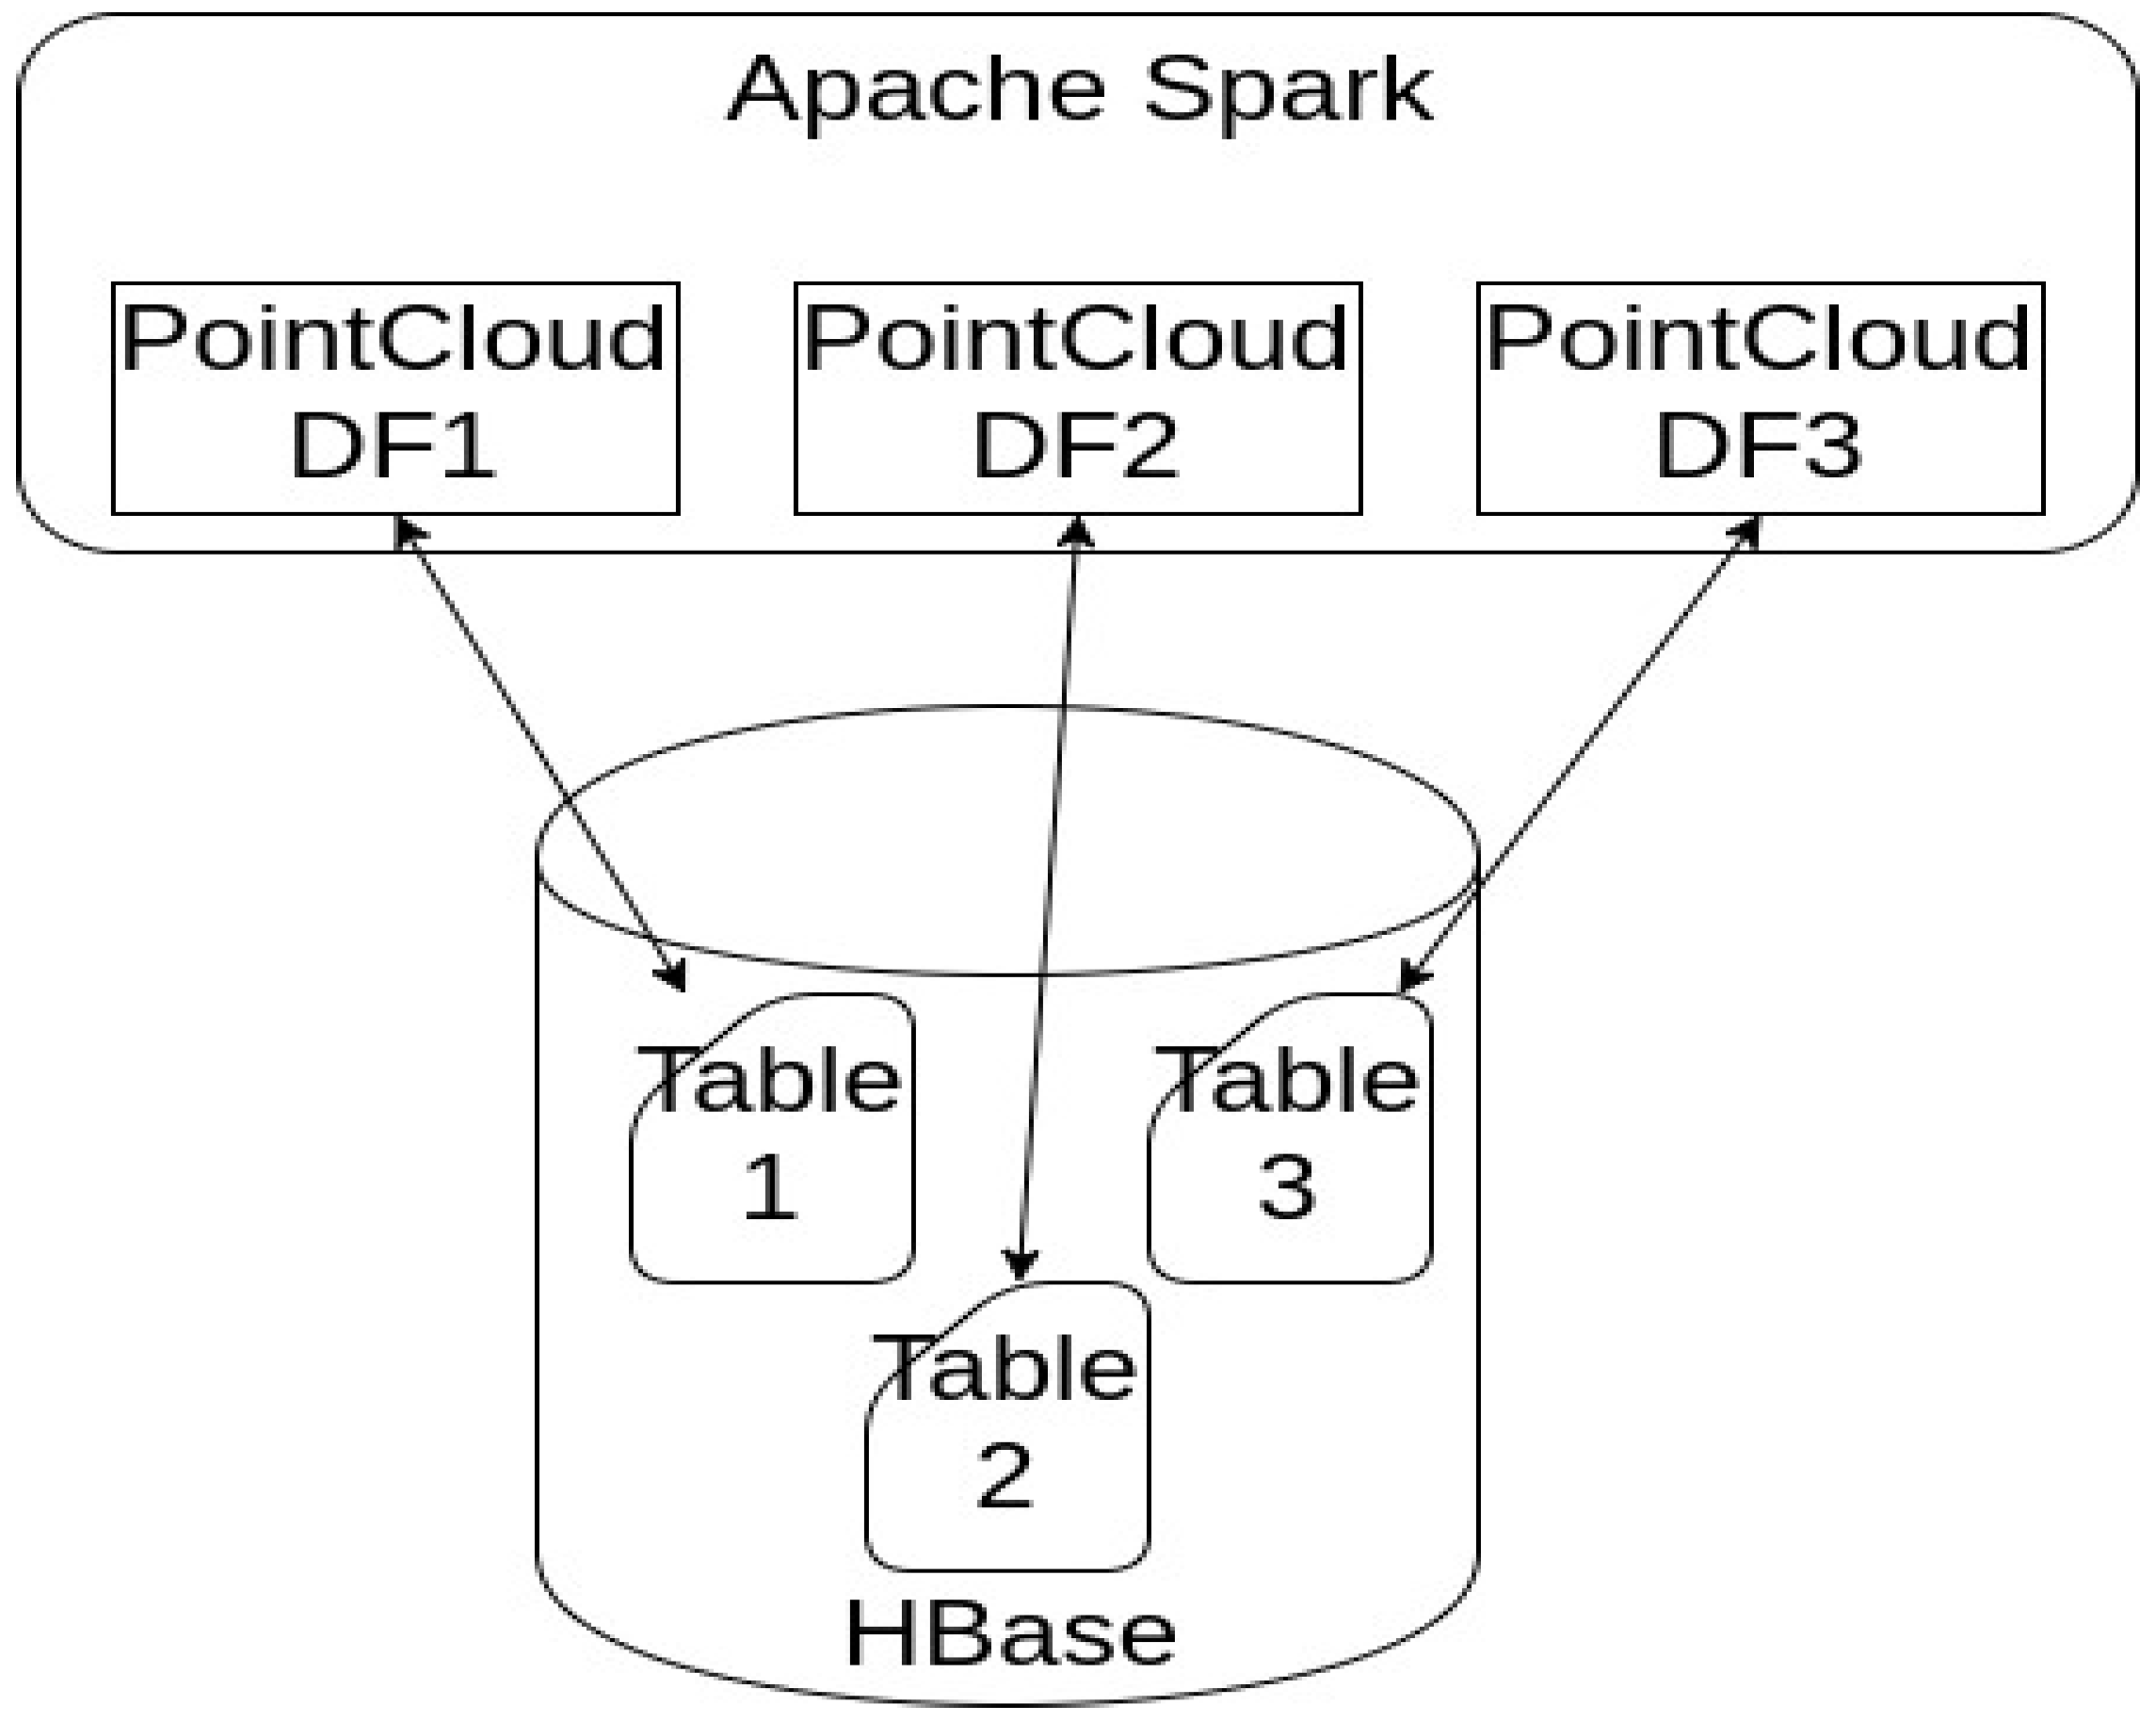
2.3.2. Physical Data Model
To store points data, we decided to use Apache HBase and a distributed Key-Value data store on HDFS. It is modeled after Google’s Big Table, and provides APIs to query the data. In addition to Hbase, there are similar systems with akin distributed storage, such as Apache Accumulo or Apache Casandra, which can be used, but we have decided on Hbase due to better support for Spark. Each point cloud represents a single table in Hbase, and points are recorded in a distributed warehouse according to a flat model (
Figure 3).
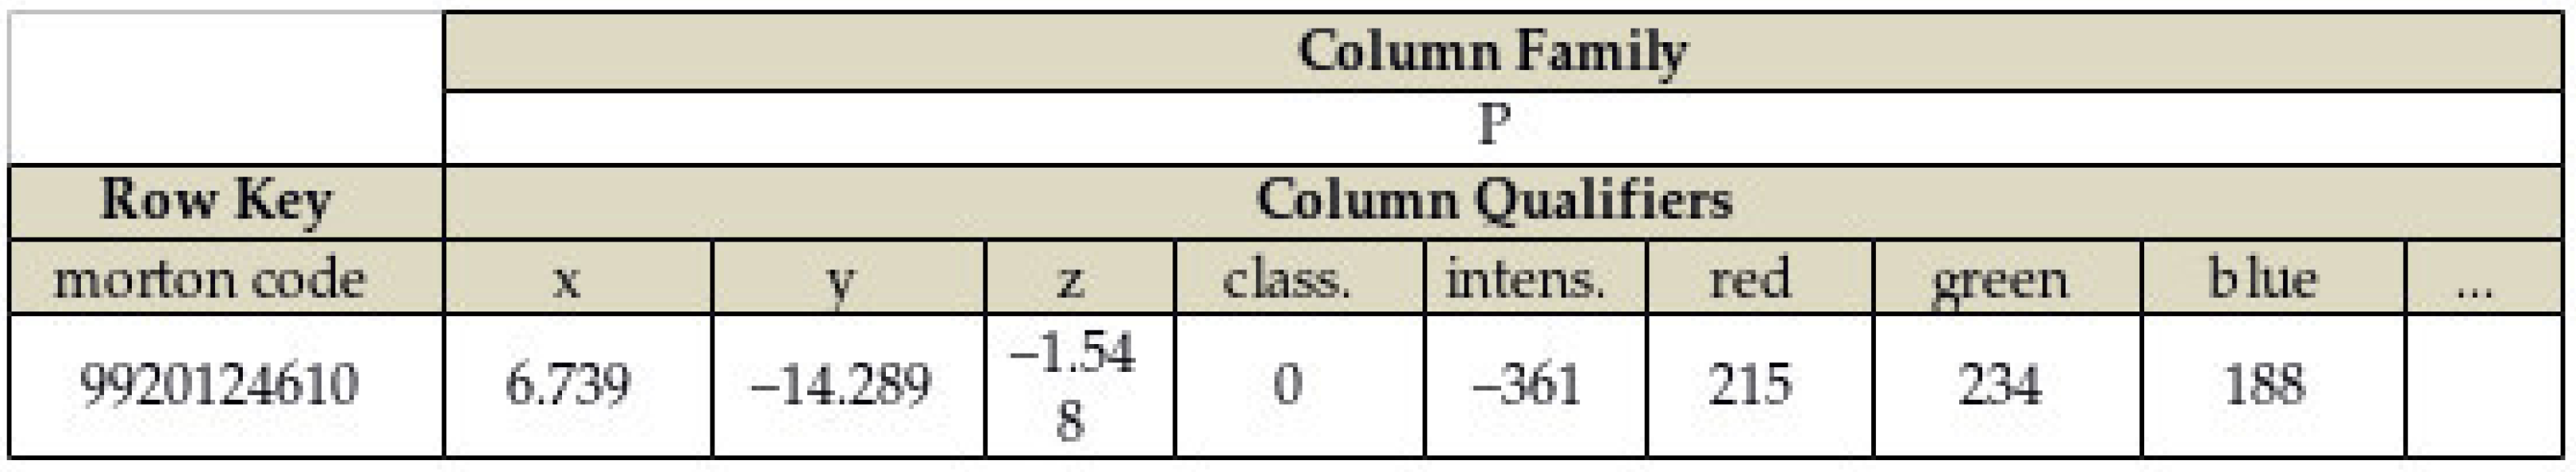
One point is one record in the warehouse. To achieve query efficiency over points, it is necessary to select the appropriate schema of the point record. For the points storage, we propose the structure of the point record by Morton code (
Figure 4).
2.3.3. User Defined Types (UDT)
One of the features that is enabled in advanced analytic processing in Spark SQL are user defined types (UDT) [
10]. User defined types allow the user to create his own classes that are more inter-operable with Spark SQL. Creating a UDT for class X offers the ability to create a DataFrame that has a class X in the schema. In order to Spark SQL recognize UDT, these UDT must be typed with SQL-defined UDT. As example, which is elaborated within the development part, we can take the way of registering a three-dimensional point (x, y, z) as UDT. We can represent such vectors as DOUBLE values.
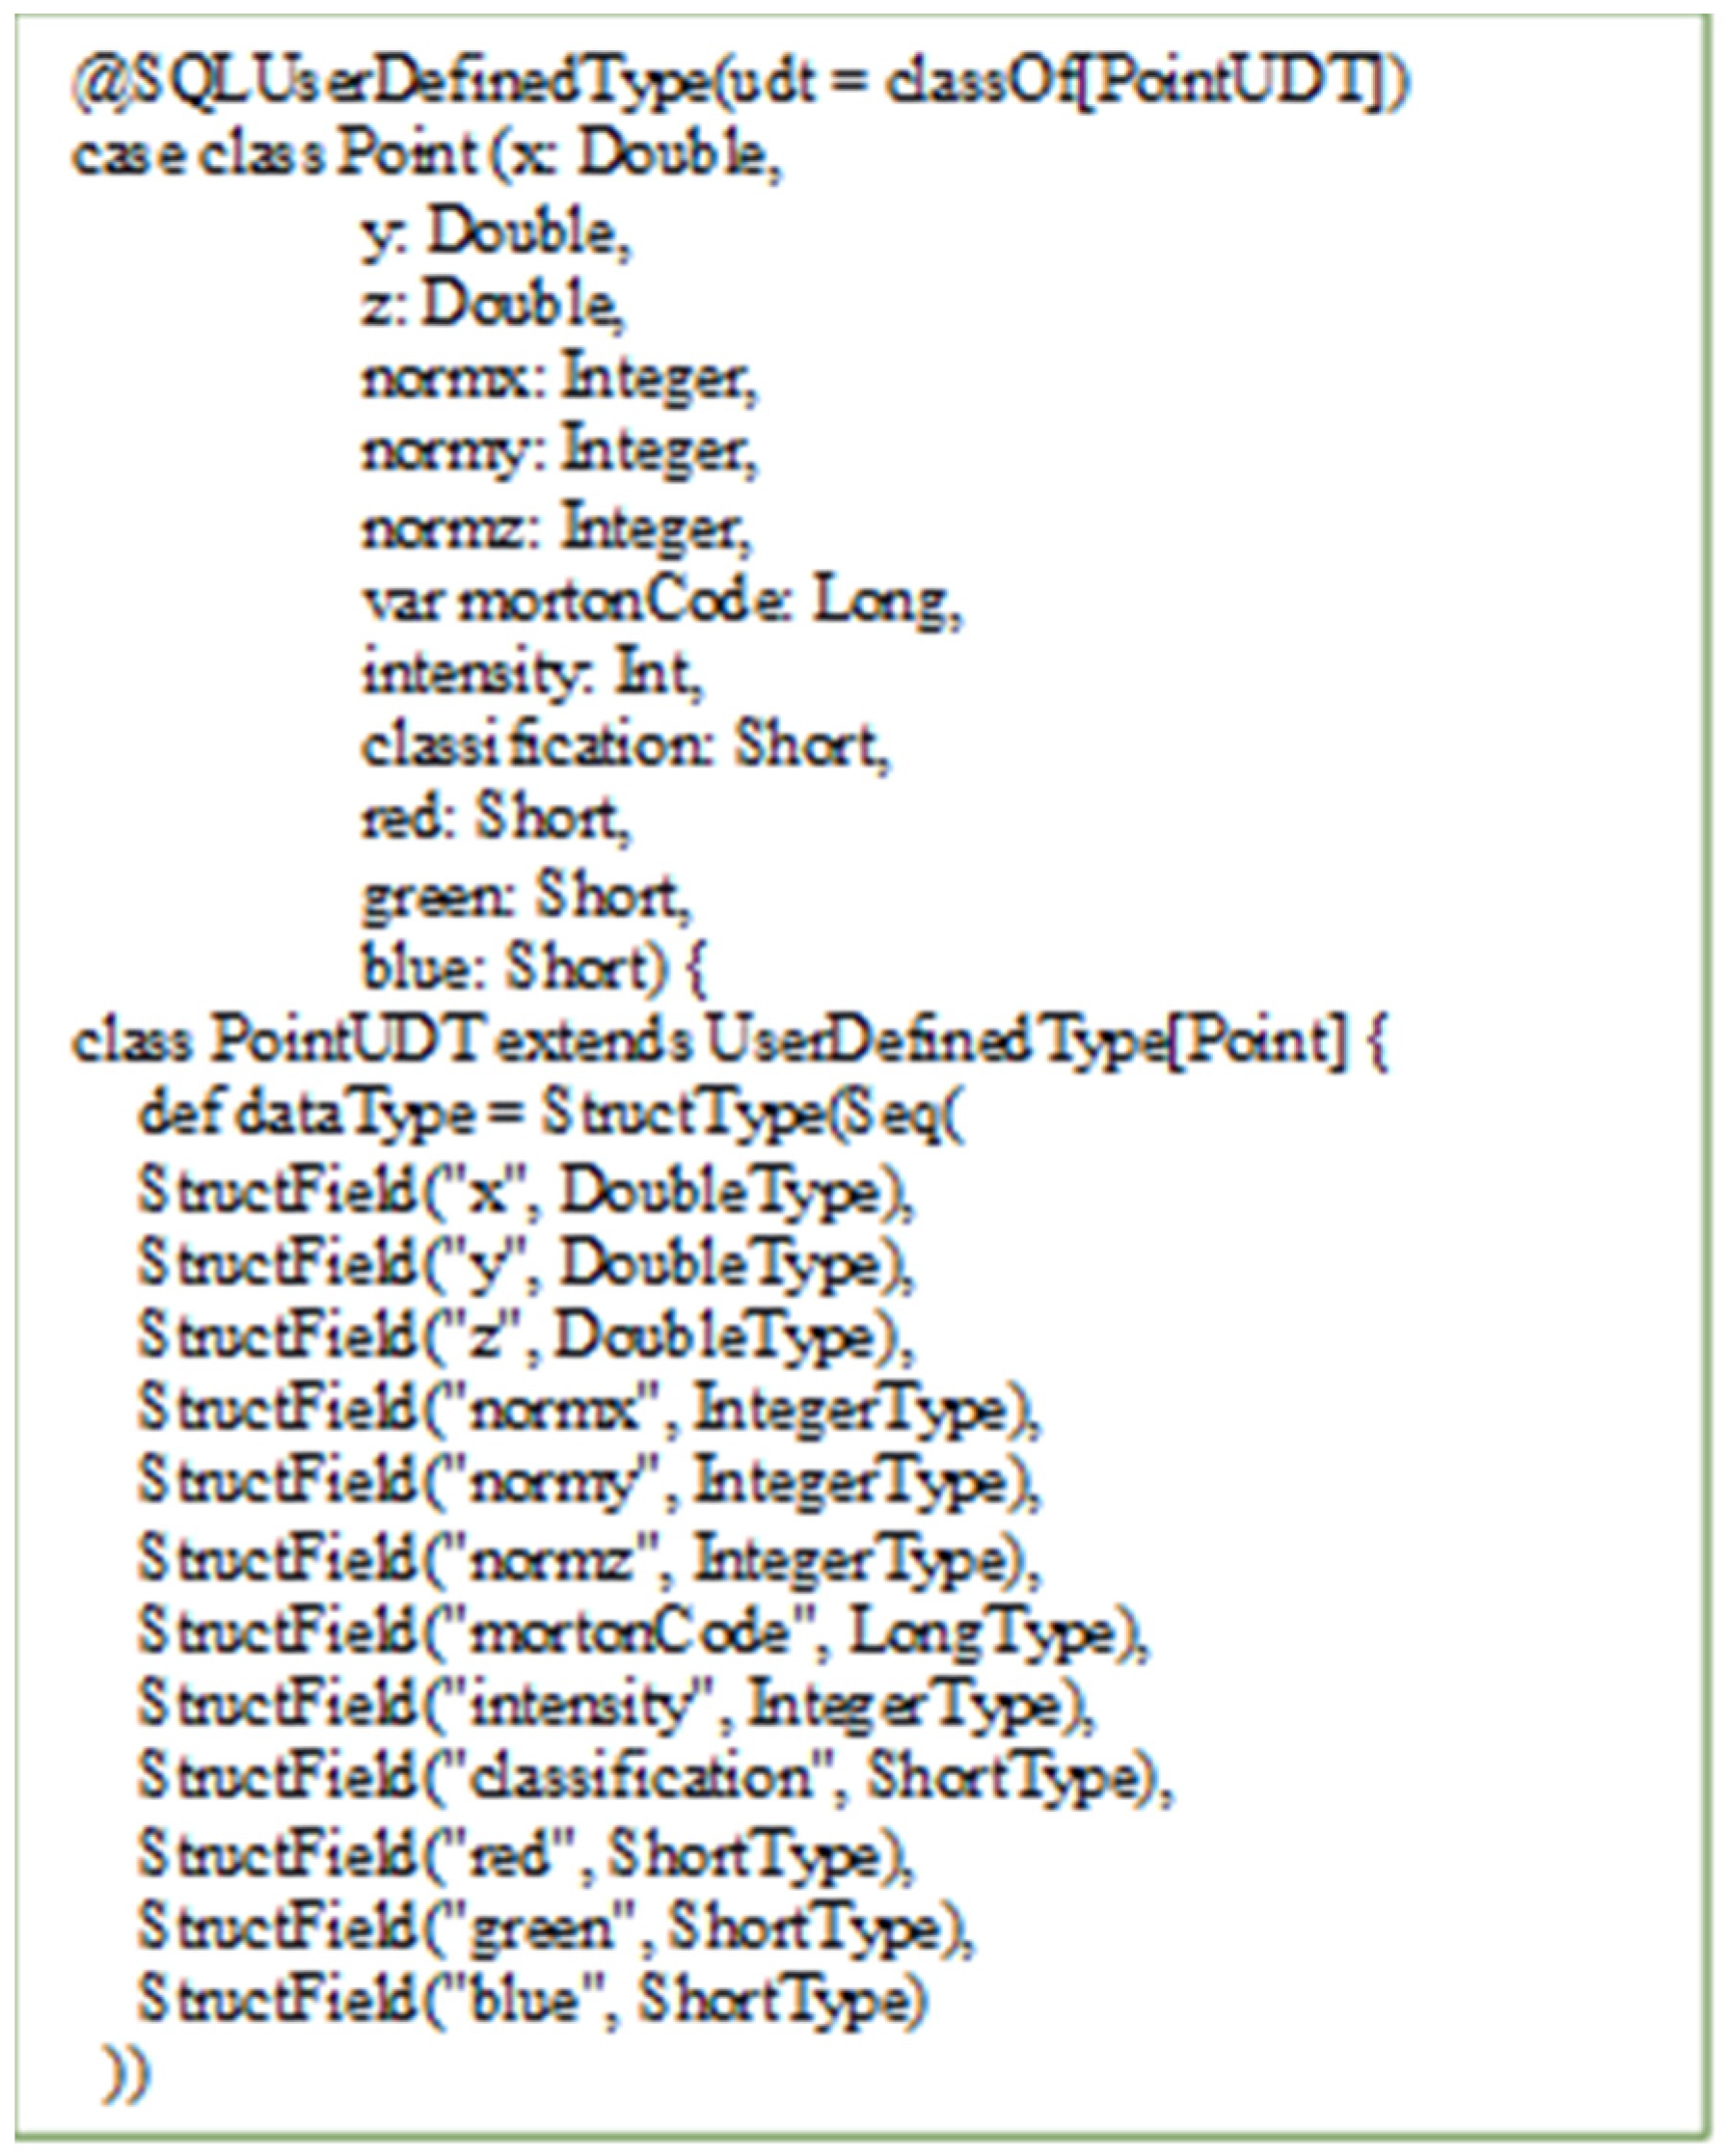
After registering this type, a point will be recognized as the original object that Spark SQL converts to DataFrames and will be adopted in UDFs on Points (
Figure 5). First of all, we define PointUDT according to the logical schema described in the previous chapters (
Figure 6). In addition to point data, it is necessary to define a data type for metadata related to the point cloud.
2.3.4. Range Queries
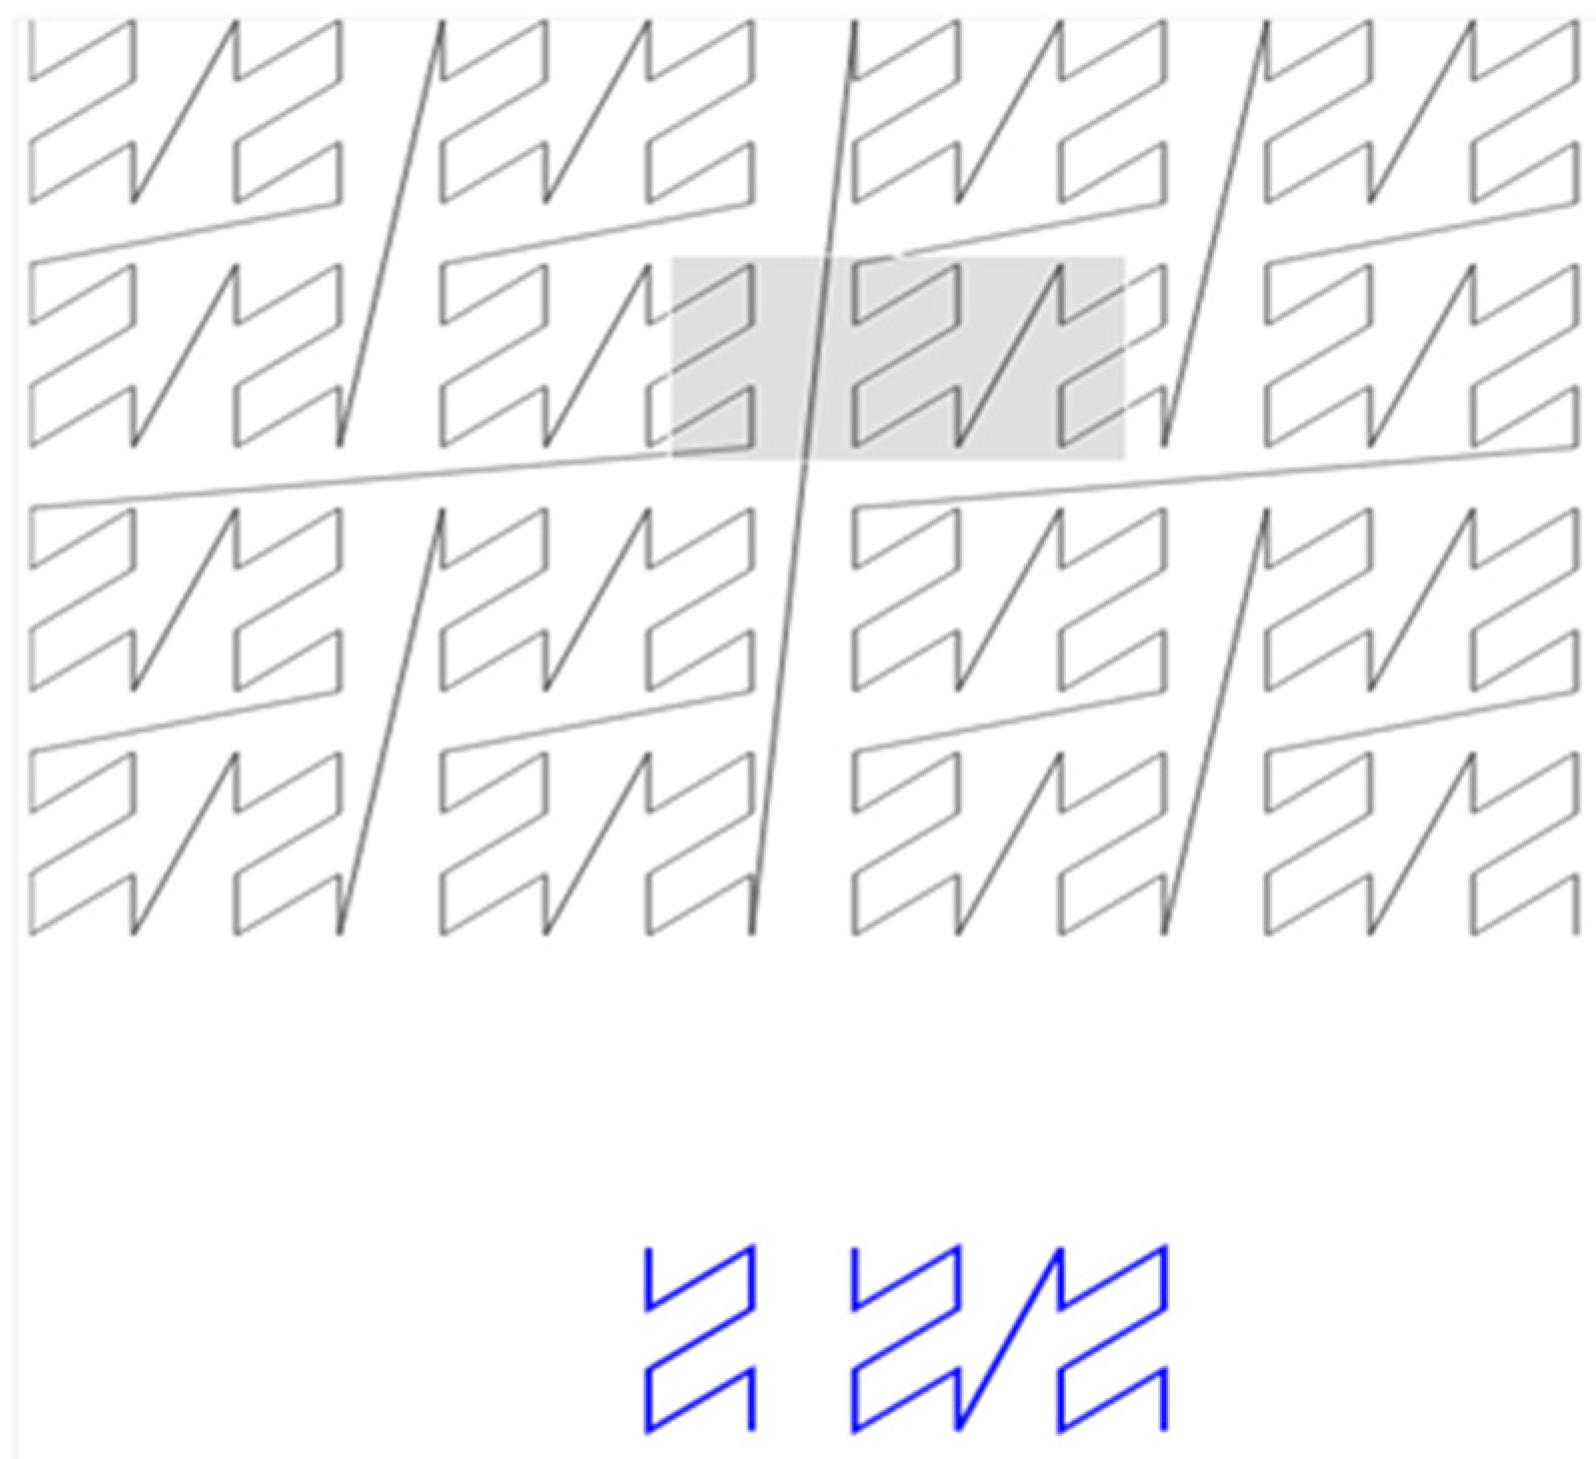
Range query is one of the basic operations on the point cloud. It represents the separation of the points from the clouds that are within the given spatial range. Range query is not trivial if the cloud is organized using space filling curves. A naive approach would be to take into consideration all the points that apply Zmin ≤ Zpoint ≤ Zmax, where Zmin and Zmax, are the smallest and highest value of Morton code that is covered by the given range. However, this also includes the large number of points that do not belong to the given range, which slows down the determination of the final result set.
This is shown in
Figure 7. The approach which reduces covered Morton codes is based on this:
the range of spatial query circuits are produced on shorter sequences containing only codes within a given range (
Figure 8)
if Zi+1min − Zimax < delta arrays are merged to reduce the number of ranges within which the search will be performed. In this way, the set of candidates does not increase drastically, and is obtained at the speed of execution ((Z1min, Z1max), (Z2min, Z2max), …, (Zmmin, Zmmax)) ≥ ((Z1min, Z1max), (Z2min, Z2max), …, (Zkmin, Zkmax)), where m is the number of ranges in a query region, k is the number of ranges after merging, and k < m.
The join operation is performed on all points and ranges with the condition that Zimin ≤ Zpoint ≤ Zimax, where i = 1 to k.
Coordinates of the points from the candidate set are compared with the coordinates of the range query in order to get the final result.
2.3.5. kNN
Determining kNN is the basis for a large number of operations over point cloud such as classification, hierarchical clustering, computer vision, dimensionality reduction, image organization, outlier detection, point normal, etc. Due to the ability to largely maintain spatial locality of points, space filling curves can represent the basis for determining kNN. For each point with index i, from the one-dimensional set of points sorted by Morton cods, the points in the range (I – a × k, i + a × k) were extracted using the following algorithm:
An array of points was sorted according to the rising value of the Morton code.
The RDD partitions were created using the Custom Range Partitioner that provided overlap between partitions for a × k rows. The constant a enables trade-offs between accuracy and execution speed. The larger value provides better accuracy but leads to slower execution.
Using the MapPartitions operation on those partitions, a new RDD containing pairs (point, set of candidate points) were created for each point of the initial RDD, in the form (Pi, (Pi−a×k, Pi−a×k+1, …, Pi−1, Pi+1, …, Pi+a×k−1, Pi+a×k)).
The MapPartitions operation was then performed on the newly created RDD to sort the candidate points according to the distance from the point Pi and return k nearest points.
2.3.6. Improving Results Using Multiple Z-order Curves
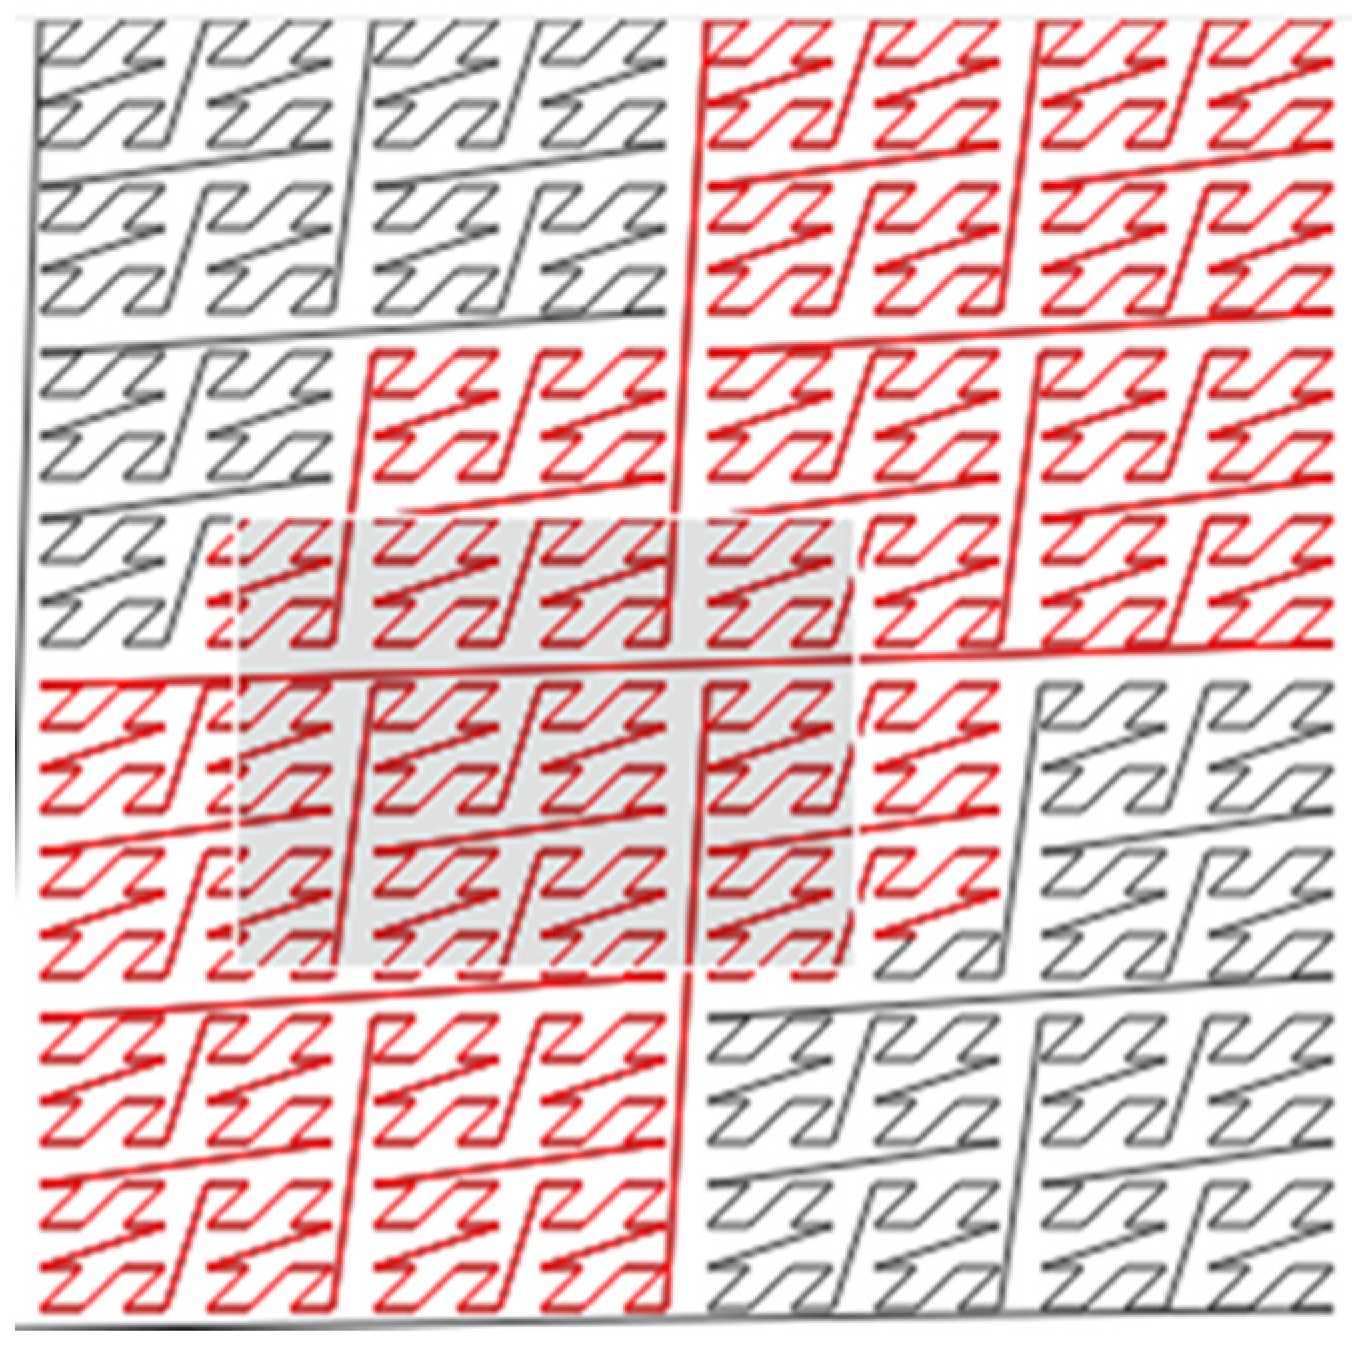
By changing the order of the coordinates of the points or shifting the coordinates of the points, the Z-order curve with a different organization of points is obtained. For example, points that are distant in the original Z-order curve (no shift), in a shifted Z-order curve can be adjacent. Increasing the number of Z-order curves used can improve accuracy. On the other hand, this leads to higher memory requirements and extends the processing time [
22].
The main goal when using multiple Z-order curves for range query is to find the curve that provides the smallest set of ranges in the specified query region, which in turn reduces the number of ranges broadcast through the cluster. In order to determine the smallest set of ranges included in the query region, the following approach is applied.
The four sets were generated by shifting for randomly generated vectors (Xishift, Yishift, Zishift) and/or rotating over the origin for randomly generated angles (Wi, Fi, Ki), where 1 ≤ i ≤ 4. After that, Morton codes were generated for every set. Finally, a set of candidate points was selected from the set which gives the shortest array of ranges in the query region and because of that provides the lowest execution time.
3. Results
3.1. Experimental Platforms
The experiment was performed in the Laboratory for Geoinformatics at the Faculty of Technical Sciences, University of Novi Sad. The laboratory is equipped with 16 computers connected by 10-gigabit network. A total of six computers were used for the experiment. Two methods were selected for the experiment:
PostgreSQL was installed on one computer and Apache Spark was installed and configured on five computers, with one master and four workers. The hardware configuration of the computers is given in
Table 1.
3.2. Data Description
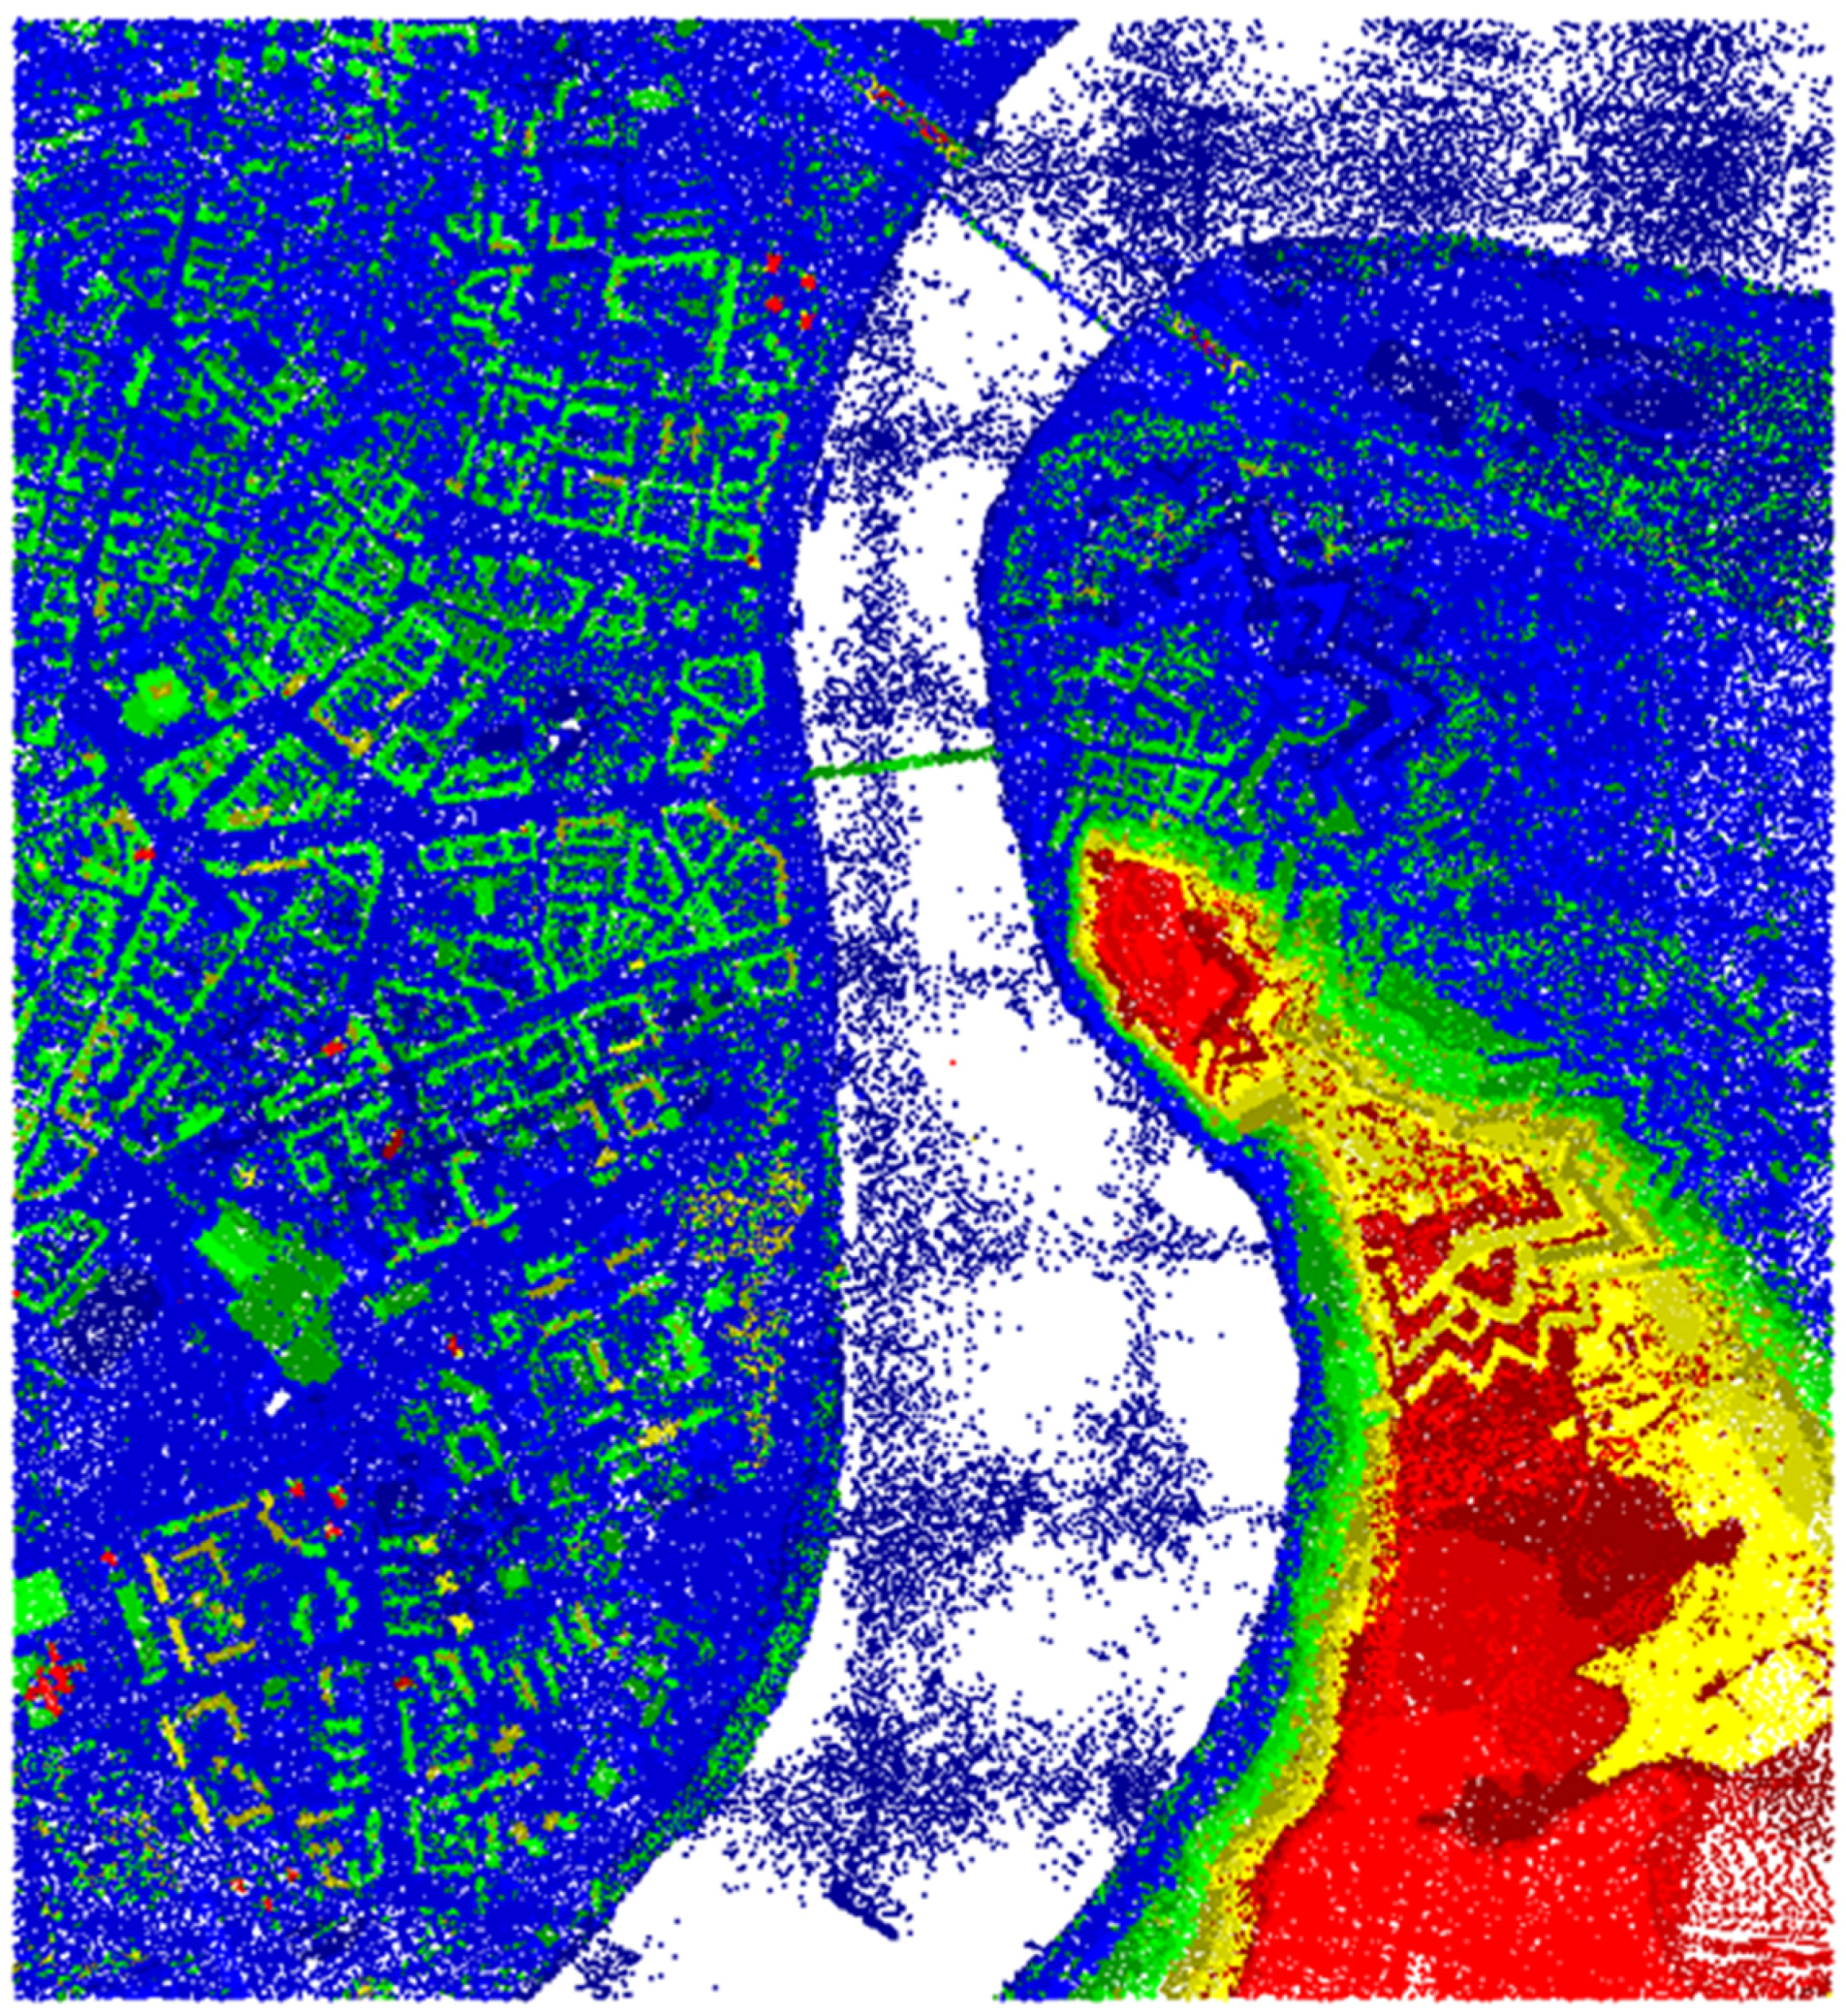
Data used in experiment is the LiDAR point cloud for the part of the city of Novi Sad containing approximately 190 million points (
Figure 9).
3.3. PostgreSQL
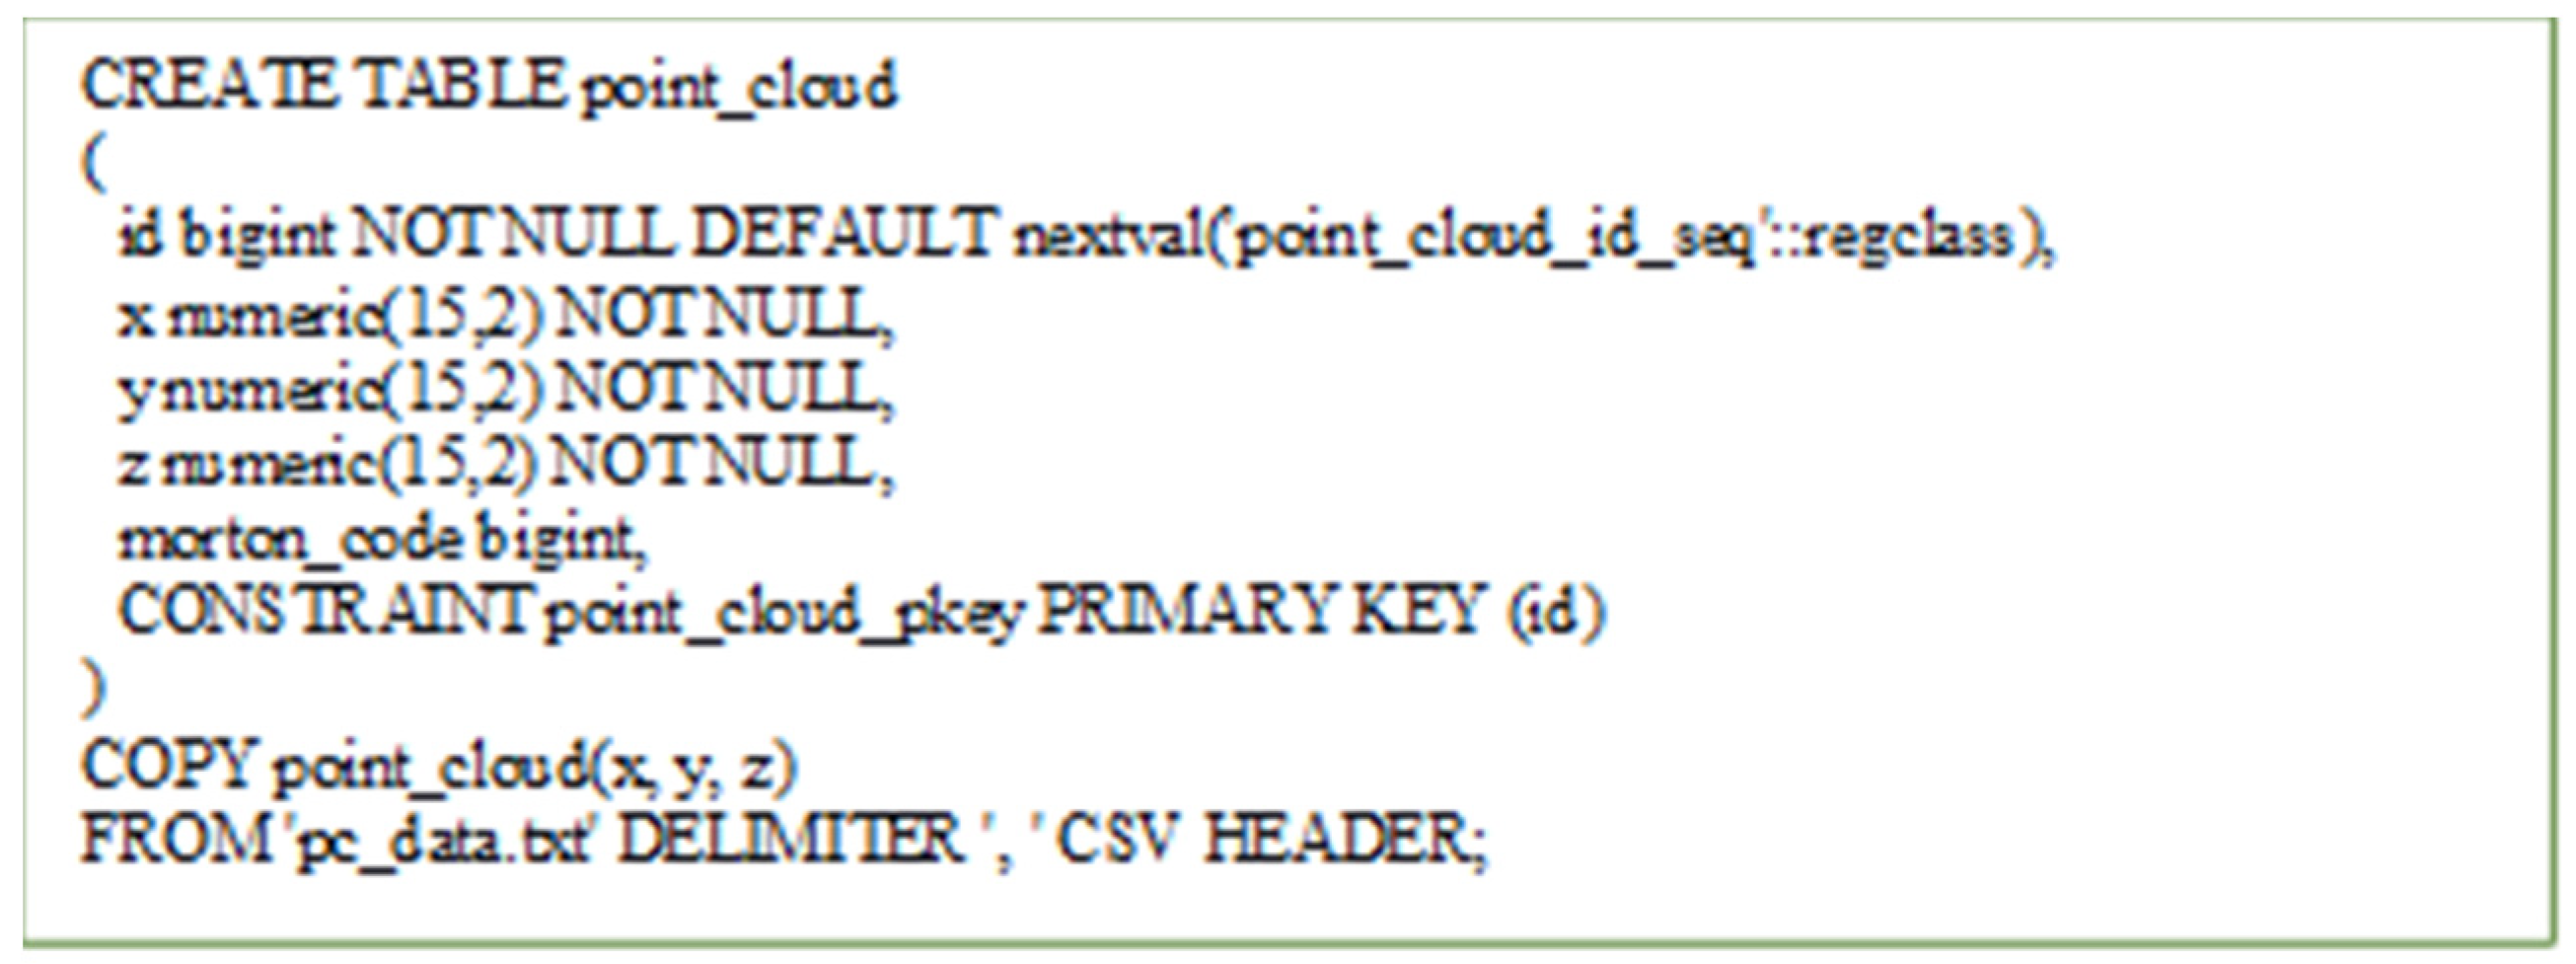
In order to import point cloud in the PostgreSQL table, the data from the LAS files is transformed to a comma separated textual file. The data is imported using the PostgreSQL COPY command (
Figure 10).
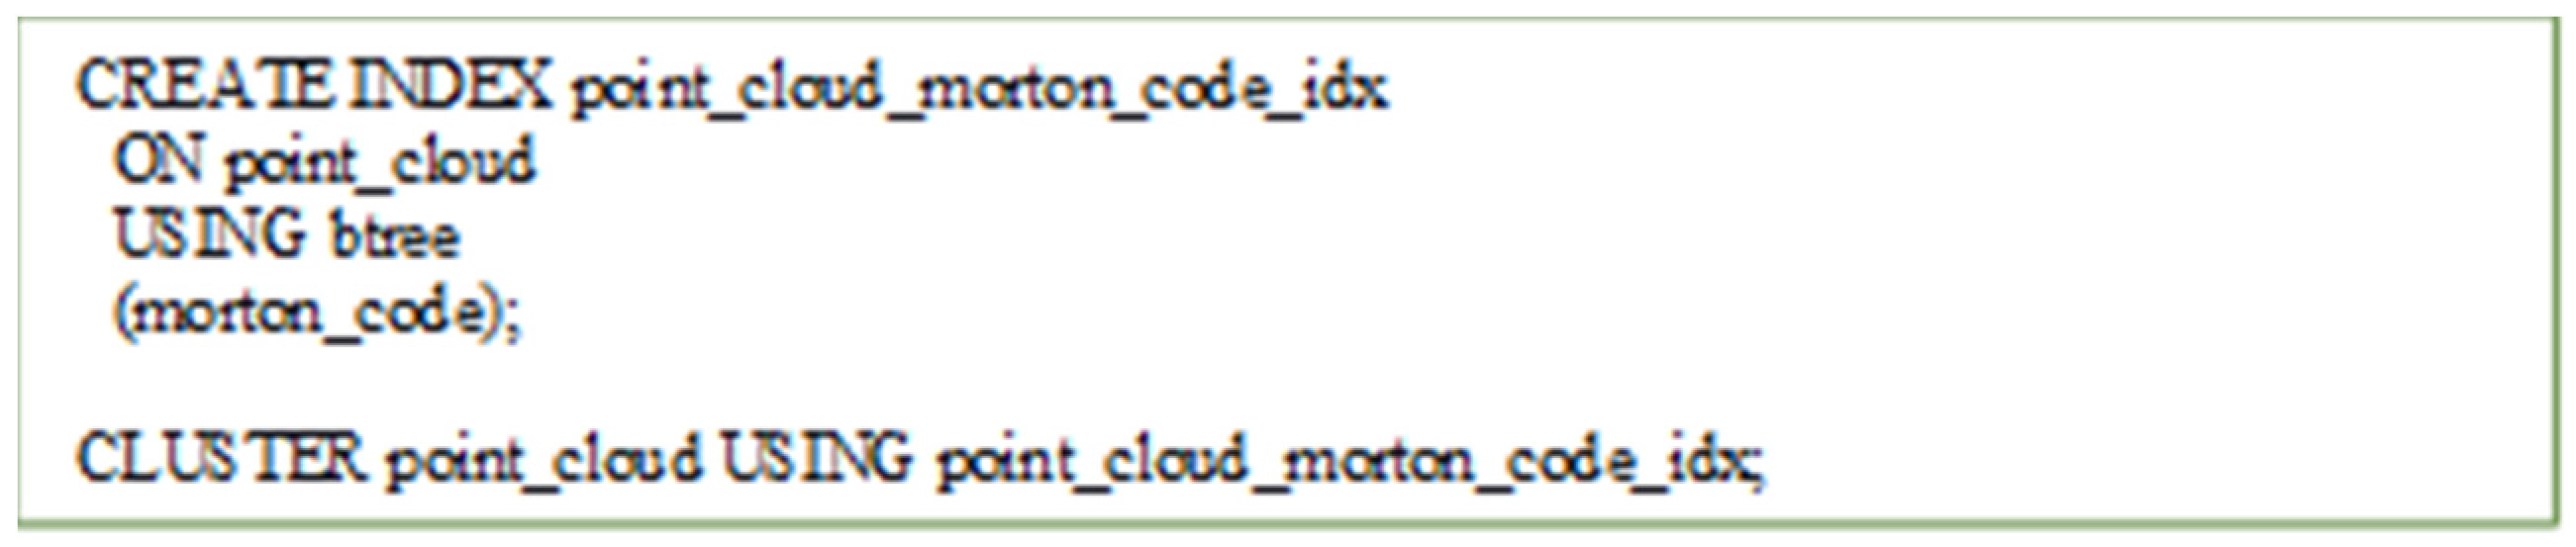
After that we modified pgmorton plugin (
https://github.com/Oslandia/pgmorton) in order to encode three-dimensional Morton codes. Finally, the B-tree index is created on Morton code column and the point cloud table is clustered in order to reorder points according to index information (
Figure 11).
3.4. Apache Spark
The version of Apache Spark was 1.6.2 aiming to use the spark-iqmulus package to read the LAS files. The LAS files were distributed on the worker nodes in order to optimize the loading procedure. The points were ingested into the point cloud DataFrame using the methods described in the previous chapter.
3.5. Query Evaluation
In order to evaluate the performance of Apache Spark against traditional RDBMS the range (window) query was performed on both systems. The range query represents the extraction of points which are contained in the three-dimensional box described with minimal and maximal x, y, and z coordinates. The query is performed in two steps. In the first step, candidate points were selected by comparing Morton codes and in the second step, the final result set is determined by comparing coordinates.
3.5.1. PostgreSQL Query
By calculating minimal and maximal Morton codes covered in the specified box the following query is created in order to find candidate points.
![Ijgi 07 00265 i001]()
The final result set is obtained with the query:
![Ijgi 07 00265 i002]()
3.5.2. Apache Spark Query
The Apache Spark version of range query is performed using Scala DataFrame API but for clarity the Scala code is used here. The boundary coordinates for the range query were transformed to minimal and maximal Morton codes. In order to reduce computation of the Morton code values between minimal and maximal, the Morton codes were split in the array of ranges and transformed to ranges of DataFrame. The set of candidate points was created by the following query.
![Ijgi 07 00265 i003]()
The final result set is obtained with the query:
![Ijgi 07 00265 i004]()
3.6. Query Performance
In order to evaluate the scalability of the two methods, three data sets with different number of points were used. The first set was generated by airborne LiDAR, the second was generated from the first set by removing every second point, and the third was obtained by inserting the points collected by terrestrial LiDAR into the first data set. The first data set contained 190 million points, the second one contained 95 million points, and the third about 273 million points.
The Apache Spark scales much better than PostgreSQL with the increase in the number of points. The time Apache Spark required to set up each query represented most of the time required for query execution and was similar in all three cases. (
Table 2).
The other experiment was conducted in order to evaluate the influence of the cluster size on the speed of processing, with three different cluster setups (
Table 3). The first cluster had one master node and two slaves, the second one, master node and four workers, and the third one, master node and eight workers. The experiment was performed using the first data set from the previous experiment. Here, the set up time of each query also took most of the time of the query execution. Beyond that, Apache Spark shows good improvement in query execution performance by adding more nodes to the cluster.
4. Discussion
The experiments conducted demonstrated good performance of the method for point cloud management based on Apache Spark. This performed better than traditional RDBMS for the large point clouds and also scaled better with the increase of the number of points. The time Apache Spark required to set up each query represented most of the time of query execution. It included loading of the data and distributing the data and execution across the cluster.
The increase of the number of points did not affect the query execution time of Apache Spark much. By contrast, PostgreSQL queries slow down almost linearly.
In the line with expectations, adding nodes to the cluster also increased query performance. The three nodes cluster performed about two times faster than the single node PostgreSQL due to overheads in the Apache Spark query set up. With the increase of the cluster size, the gap in performance was larger and with nine-node cluster we had five times better performance.
Although, the method based on Apache Spark demonstrated good performance for management of large point clouds, it comes at a price. In-memory capability can become a bottleneck when cost-efficient processing of big data is needed, as keeping data in the memory is quite expensive, the memory consumption is very high, and it is not handled in a user-friendly manner. Apache Spark requires lots of RAM to run in-memory, and thus the cost of Spark can be high.
Another issue that makes using Spark challenging, is manual configuration tuning which can be hard to set up optimally. Also, the code has to be carefully thought through and written because naive approaches can lead to additional network transmission and shuffling which largely degrades performance. Therefore, the costs and effort should be taken into account when considering using Spark for data management and processing.
5. Conclusions
Today, more than ever before, huge amounts of geospatial data are collected every day. We are on the verge of finding solutions for storing and processing large amounts of data. In order to tackle that challenge, new methods should be established. Therefore, there is increasing research on that topic every year and, also, software products for geospatial big data are developing at a fast pace. Most of the research and software products are dealing with vector and raster data and only some of them are oriented towards point clouds.
We proposed methods for the large point cloud management based on using big data tools. First of all, we proposed the method for indexing of point clouds in a distributed computing environment. We chose a Z-order space filling curve due to easy computation and good spatial proximity preservation. The point clouds, ordered by Z-order, are partitioned and distributed through the cluster for parallel processing. The Apache Spark framework was chosen as the distributed processing engine due to its performance and scalability.
In the Apache Spark application, point clouds are represented as a DataFrame of the user-defined type Point. We described the method for ingestion of point clouds from various sources, LAS files, text files or JSON format and necessary transformations in order to generate point cloud DataFrame. After that, we were able to define operations on point clouds in the form of SQL queries. Several user defined functions were implemented to support these operations. We demonstrated the implementation of two widely used operations on point clouds, a window query and a kNN query. Moreover, we discussed the additional steps which can be applied in order to make the queries more efficient and accurate.
The proposed point cloud management model can be seen as the elementary form of the future distributed point cloud database. Compared with the traditional methods for point cloud management, based on the file system storage and single processing server, a distributed approach, based on Apache Spark, is able to meet the changing requirements at a more agile speed, and has stronger robustness and fault tolerance support. The Apache Spark is easily horizontally scalable which means that we can deal with increasing amounts of data by adding more nodes to the cluster.
The solution presented can easily be extended by additional operations on point clouds through implementation of user defined functions, for example, point cloud segmentation and feature extraction. The results of the experiments have shown that Apache Spark performs better than the PostgreSQL when execution of range query over point cloud data is concerned. Excellent scalability of the Apache Spark was proven. It demonstrated robust performance with the increase of the amount of the data, as well as a performance boost when adding more nodes to the cluster.
The proposed method put a focus on indexing, partitioning, storage and processing of a single point cloud. The point clouds from different sources should be integrated into a single point cloud and transformed to the same coordinate reference system (CRS) in order to be used. Further research should investigate the approaches which will enable working with the point clouds collected by different methods, different times, or with different CRS. It can be handled through extension of the Morton code index beyond 64-bit encoding larger areas space or for adding another coordinate, for example, a time-stamp. If we extend the Morton code to 128 bits, we will be able to index every coordinate in the space of 2.2 million kilometers with millimeter precision. In that way we can have all point clouds in the country indexed with the same Z-order curve and stored into a single table. That would enable surveying organizations, like the U.S. Geological Survey or Actueel Hoogtebestand Nederland (AHN), to store country-wide point cloud data sets in the system which provides unlimited storage space, preventing loss of data and fast access to the data through a defined interface. This would be in contrast to storing the data in the files, which always leads to problems with version tracking, backup, and access to the data.
Moreover, in this paper we did not analyze correlation with different types of geospatial data. Even though there are libraries for raster and vector data on Spark, significant effort would be needed to integrate them into our method. The traditional RDBMS has the advantage in this field due to mature tools like PostGIS and ORACLE Spatial.
Taking into account all of the above, future research will include the following:
Extension of the Morton code index beyond 64-bit encoding in order to cover larger areas and increase coordinate precision.
Research on using more than three dimensions in space filling curve indexing. For example, four-dimensional space for dynamic point clouds.
Integration of vector geospatial data and implementation of spatial joins with point clouds.
Feature extraction operations in order to produce elements for definition of CityGML structures, such as roofs, walls, city furniture, trees, etc.


