Identifying Alternative Wetting and Drying (AWD) Adoption in the Vietnamese Mekong River Delta: A Change Detection Approach


Sociology Department, School of Liberal Arts, Manhattan College, Riverdale, NY 10471, USA
ISPRS Int. J. Geo-Inf. 2019, 8(7), 312; https://doi.org/10.3390/ijgi8070312
Submission received: 6 June 2019
/
Revised: 23 June 2019
/
Accepted: 13 July 2019
/
Published: 22 July 2019
Abstract
:Alternative wetting and drying (AWD) is an increasingly popular water-saving practice in rice production in the Vietnamese Mekong River Delta, especially considering the impact of projected climate change and reduced water availability. Unfortunately, it is very difficult to determine adoption without deploying thousands of costly household surveys. This research used European Space Agency Sentinel-1a and 1b radar data, combined with in-situ moisture readings, to determine AWD adoption through change detection of a time series wetness index (WI). By using a beta coefficient of the radar data, the WI avoided the pitfalls of cloud cover, surface roughness, and vegetative interference that arise from the sigma coefficient data. The analysis illustrated an AWD adoption likelihood scale across the delta and it showed potential for the use of remotely sensed data to detect adoption. Trends across the Vietnamese delta showed higher adoption rates inland, with lower adoption of AWD in the coastal provinces. These results were supported by a simultaneous effort to collect household level adoption data as part of the same project. However, correlation between the WI values and in situ soil moisture meter readings were most accurate in alluvial soils, illustrating a particularly strong relationship between soil type and WI model robustness. The research suggests that future change detection efforts should focus on retrieving a multi-season dataset and employing a power density analysis on the time series data to fully understand the periodicity of dry down patterns.
1. Introduction
AWD is an irrigation technique in which water is applied to the field a number of days after the disappearance of ponded water. This is in contrast to the conventional irrigation practice of continuous flooding where farmers never let ponded water disappear. AWD allows intermittent drying during certain stages of rice growth because roots of the rice plant are still adequately supplied with water due to the initial flooding. The number of days in which the field is allowed to be “non-flooded” before irrigation is applied can vary from one day to more than 10 days. Under the effects of climate change, water scarcity will be a key concern for Asian rice producers in the dry season. Regionally, applying AWD could conserve fresh water resources and either extend the growing cycle during the dry season or expand rice production areas. Unfortunately, estimating the adoption of AWD is quite difficult.
Determining the extent and degree of AWD adoption has proven difficult. Beginning in 1997, the Irrigated Rice Research Consortium (IRRC) introduced AWD to paddy fields in the Mekong River Delta (MRD) through various projects in coastal provinces, such as Bac Lieu, as well as in inland provinces, such as An Giang [1]. There have been a number of evaluations of the barriers to adoption [2,3], as well as one widely accepted estimate of 40,000 farmers adopting the practice by 2011 [4]. However, these studies are based on small sample sizes, expert interviews, and household surveys. These methods can be time consuming, expensive, and prone to subjectivity. Thus, the core objective of the project is to determine if remotely sensed data can be used to determine the geographic extent and the degree of adoption in the MRD provinces in Vietnam.
A number of authors have used the beta nought (β°) transformation of the C-Band SAR data in moisture change detection analyses. These authors used change detection to create wetness indices that avoided the pitfalls of cloud cover interference inherent in reflectance data [5,6,7]. The change detection approach, by nature, reduces the complications of surface roughness and vegetative interference that arise from the sigma nought (σ°) transformation. For these reasons, this paper used the β° coefficient and a change detection approach, referred to as a “multi-temporal SAR for soil water content (SWC) change detection” that used multiple passes from the same incidence angle and polarization [5]. The primary contribution of this research is primarily to explore the possibility of deploying such a method across large agricultural landscapes to detect water management trends.
The article proceeds in the following fashion. The first part of the chapter discusses the environmental setting of the Mekong River delta. It then outlines the need to develop low-cost methods for determining the adoption of AWD and a promising remote sensing approach using change detection of a WI. The second part of the article is a detailed description of the methods used throughout the process. The third section outlines the results of the workflow that we explored. The fourth section discusses the implications of these results, challenges of implementing the methodology, and the limitations of the study. We conclude with a section discussing some promising avenues for further validation of this method.
1.1. Environmental Setting
Sustainable water management is a regionally urgent issue in Vietnamese agriculture. Vietnam has a complex system of barrages, weirs, and dikes to mitigate flood and salt water intrusion [8]. The canal system expanded from two canals in 1824, 40 canals in 1934, to hundreds in the 1980s [9]. Today, the channel network is over 50,000 kilometers long. Community groups in the delta often govern the sluice gates, and this control over hydrology allows for a double- or triple-cropping system. However, since the canal system was built, Vietnam has experienced subsequent water quality issues, salt-water intrusion, and canal bank erosion. In maximum flooding conditions, these flow obstructions can worsen flood impacts, preventing saline waters from escaping croplands. Dredging canals, upgrading of roads, and other waterway improvements to protect crops can cause between five and 10 additional days of flooding, or between 0.2 and 0.3 additional meters of water depth during peak flood conditions [10]. Additionally, planned dam construction upstream in Laos could also have a synergistically negative effect, with projected climate change impacts [11]. Sediment deposits would accumulate behind the dam, causing a deficit of sediment and nutrient deposition downstream in the latter half of this century when the projected impacts of climate change will be worse than the first half of the century. This may, in turn, have impacts on rice and other crop production.
Flooding is a strength and weakness of the Mekong River Delta agricultural setting. The area is considered a monsoon system, with the rainy season lasting between May and October and averaging between 1400 and 2400 millimeters annually, whilst the length of the growing season is between 270 and 300 days. A large proportion of the Malay Peninsula is seasonally inundated, which includes much of the Mekong River Delta in Vietnam. The floodwaters are filled with nutrient-rich sediment, which replenishes agricultural land and reduces the need for agricultural inputs [12]. However, climate change is expected to increase the average and maximum water levels, as well as the flood duration in the Mekong River Delta between 2010 and 2049 [11]. This will have negative consequences for annual crops, infrastructure integrity, floodplain vegetation, and will most likely decrease the amount of fertile land. The changes in flooding may increase ecosystem productivity and produce dry season water availability, which could allow extended cropping.
Drought is one of the most formidable vulnerabilities in the rice cropping systems of Vietnam, despite the vast irrigation network. Since rice yield is linearly related to the number of days it is grown in saturated soil, water shortages can have a severe impact on rice production [13]. The lack of water reduces biomass, grain set, and forestalls emergence. It also disrupts crop management techniques, such as weeding, fertilization, and transplanting. It is especially damaging during flowering and can incur a large weed problem if drought occurs during emergence periods. In locations without a clay hardpan, acidic water can infiltrate from deeper soil during the dry season or drought years [10]. However, some authors have taken a nutrient management approach to the drought issue, arguing that drought is less important than how loss of soil-water saturation impacts the uptake of nitrogen, phosphorus, and iron, as well as impacting toxic levels of aluminum [13,14]. Additionally, small undulations in rice fields and between bunded fields, known as toposequences, can produce equally important hydrologic shifts as precipitation patterns. Climate change precipitation changes may cause yield fluctuations in already irrigated lands due to the anticipated lack of irrigation water. This presents a hurdle for increasing yields in light of increased water insecurity. Vietnam has a double- or triple-cropping system in the project area, which is sometimes subject to salt-water intrusion from the South China Sea and Gulf of Thailand.
1.2. History of AWD
AWD was developed through the research efforts of the International Rice Research Institute (IRRI), one of the major research centers under the Consultative Group for International Agricultural Research (CGIAR), a global agricultural research organization. In particular, the Water-Savings Workgroup under the IRRC was instrumental in the development and dissemination of this technology in the major rice-growing countries of Asia. The IRRC was established in 1997 with the aim of providing a platform to facilitate the identification, development, dissemination, and adoption of natural resource management (NRM) technologies that were suitable for the irrigated rice-based ecosystems in several Asian countries, including Vietnam. IRRC has provided a mechanism that has expedited partnerships between national agricultural research and extension system partners and scientists from the IRRI.
In Vietnam, AWD has been introduced to paddy fields in the MRD through various agricultural development projects. There are projects in the coastal provinces, such as Bac Lieu, as well as in inland provinces, such as An Giang. With respect to specific IRRI/IRRC dissemination efforts for AWD, there has been an integrated approach to promoting AWD. This integrated approach has been built on the long-established relationship between the IRRI/IRRC and the Plant Protection Department (PPD) of the Ministry of Agriculture and Rural Development (MARD).
Through the IRRI–PPD partnership, AWD was first evaluated in the An Giang province from 2005–2006 for three successive rice-growing seasons. In 2006, AWD was incorporated into a large-scale existing program called “Three Reductions, Three Gains” (3R3G) that aimed to reduce the inputs of fertilizers, pesticides, and seeds. In 2009, technologies that reduced irrigation water use (through AWD) and post-harvest losses were included, and the program was transformed into the “One Must Do, Five Reductions” (1M5R) program. The successful evaluation and dissemination of AWD in Vietnam through the 3R3G program and subsequently through the 1M5R program were facilitated by the widespread media campaigns and training on AWD through these integrated programs. The collaboration of the IRRC with the PPD was instrumental in this endeavor. Moreover, 1M5R is now a national policy that aims to make rice production more sustainable. All the components of the IM5R program are being promoted and wide-scale implementation is being executed throughout An Giang and in nearby provinces in the Mekong Delta. Promotion of this program is also underway for the northern part of Vietnam, particularly in the Red River Delta.
The AWD technique starkly contrasts to traditional rice cultivation. Rice fields are not kept continuously submerged, but are allowed to dry intermittently during the rice growing stage. The number of days in which the field is allowed to be “non-flooded” before irrigation is applied can vary from 1 day to more than 10 days [1]. The underlying premise behind this irrigation technique is that the roots of the rice plant are still adequately supplied with water for some period (because of the initial flooding), even if there is currently no observable ponded water in the field. To assist farmers in the practical implementation of AWD, a simple tool, a 25-centimeter (cm) long perforated field water tube was introduced. The field water tube can be made of plastic pipe or bamboo or any cheap material, and it is embedded in the paddy field to a depth of 15 cm, with the soil removed from inside the tube, to reveal the perched water-table level. During AWD implementation, the field is irrigated to a depth of around 5 cm whenever the ponded water level has dropped to about 15 cm below the surface.
AWD is an elusive water management practice for use in tracking adoption rates in Vietnam. Given the importance of sustainable water management discussed in Section 1.1 above, AWD shows strong potential to solve the projected water scarcity issues in coming decades. While the IRRI, MARD, and other organizations have promoted AWD in Vietnam for many years, there is little understanding of the adoption rates across the delta. This is due to several factors inherent to the technique itself. First, farmers can partially adopt AWD, which gave rise to several AWD adoption scales employed via household surveys. Second, farmers may not always adopt AWD. Depending on the season, general water availability, access to irrigation water, and group membership in the irrigation districts, farmers may choose to flood their fields rather than use the AWD technique. Given these issues, it is very costly to deploy nationally representative household surveys on an annual basis to assess the AWD adoption rate. In other words, the adoption rates would need to be assessed on an annual or seasonal basis to be accurate, and it would be impossible feat to mount such a household survey campaign. Therefore, using publicly available remotely sensed data would not only solve the adoption tracking issue, but also limit the ongoing cost of annual assessments.
1.3. Change Detection Approach
Measuring water SWC using remotely sensed data is a promising avenue for agricultural land management. SWC measures the total amount of water in a column of soil, including water vapor, that lies above the saturated zone and the groundwater table [5]. The measurement is particularly critical to understanding crop production, which in this case study, pertains to rice paddy production practices. Whilst the gravimetric and volumetric measurements of SWC are accurate, they require extensive processing for a single field sample. Radar remote sensing is an effective data for mapping soil moisture regardless of cloud cover or atmospheric interference. This is a promising avenue of research for the landscape-level detection of water management approaches. Synthetic Aperture Radar (SAR) detects a backscatter digital number using microwave bursts from satellites that orbit the earth. Radar data has fewer limitations than reflectance data (such as vegetative indices), due to the lack of cloud cover interference [15,16]. Methods for measuring SWC using radar data have been broadly categorized into five types, including: (a) semi-empirical SAR formulation, (b) multi-temporal SAR for SWC change detection, (c) SAR data fusion of images from microwave sensors, (d) SAR data fusion from optical and microwave sensors, and (e) SAR and microwave scattering properties [17]. This article examines the second approach, the change detection method. Change detection can reduce the noise related to terrain and vegetative interference by processing radar images from identical passes, which use the same polarization and incidence angles [5].
In particular, Sentinel-1 shows promise for change-detection approaches to understanding surface wetness [6,18]. There are three possible Sentinel-1 data coefficients: sigma nought (σ°), which refers to the “radar cross section per unit area in ground range;” beta nought (β°), otherwise known as the radar brightness coefficient, which refers to the radar cross section in the slant range or line of sight; and gamma nought (Υ°), which refers to the “radar cross section per unit area of the radar’s incident waveform,” running perpendicular to the slant range [19]. We do not discuss the Υ° possibilities in this paper. Whilst the σ° coefficient is often used in the remote sensing of agricultural areas, it poses a great deal of trouble in creating a reliable WI. First, vegetative interference must be carefully calculated and accounted for as a function of σ° [20,21]. Provinces, districts, and farmers plant their rice crops at variable times throughout the season in the study area. This predicament creates unpredictable stages of rice growth throughout the Mekong River Delta, and thus, if the study used the σ° coefficient, the vegetative interference would have been too high and too variable to measure. Additionally, surface roughness is also a confounding factor when using σ° [5]. Simultaneously, the immense variability in the surface roughness of rice paddies throughout the delta would present scaling issues with the method explored in this paper. However, the σ° coefficient has been used to understand different characteristics of the rice paddy and plant, including the contribution of leaf area index, and plant growth stage and type [21]. It has also been successfully used to understand the extent of the triple rice crop [22,23,24]. These studies illustrate the σ° coefficient’s usefulness in vegetative changes, rather than the moisture index creation. This article uses the β° coefficient, rather than the commonly used σ° coefficient, to bridge the gap between AWD research and remote sensing approaches to measuring the SWC. The results of the methodology deployed for such purposes are discussed in the following section.
2. Materials and Methods
This section outlines the methods utilized in the field and on the desktop to execute the change detection approach. The method estimated AWD adoption using the geospatial analysis of remotely sensed data, with soil moisture meters being used for calibration. Figure 1 represents the complete remote sensing workflow, wherein this unique process includes data acquisition, pre-processing, parameterization, WI creation, temporal lag analysis, and classification system creation. Each step is detailed below.
It should be noted that this remote sensing exercise was conducted in parallel with a typical household survey approach. The project conducted a series of key informant interviews and focus group discussions to determine the appropriate provinces to survey. It sampled four likely AWD-adopting delta provinces, and then conducted 285 household surveys. The results of these household surveys were included in a separate publication. However, the pertinent results for the remote sensing portion of the project are included briefly in the results section.
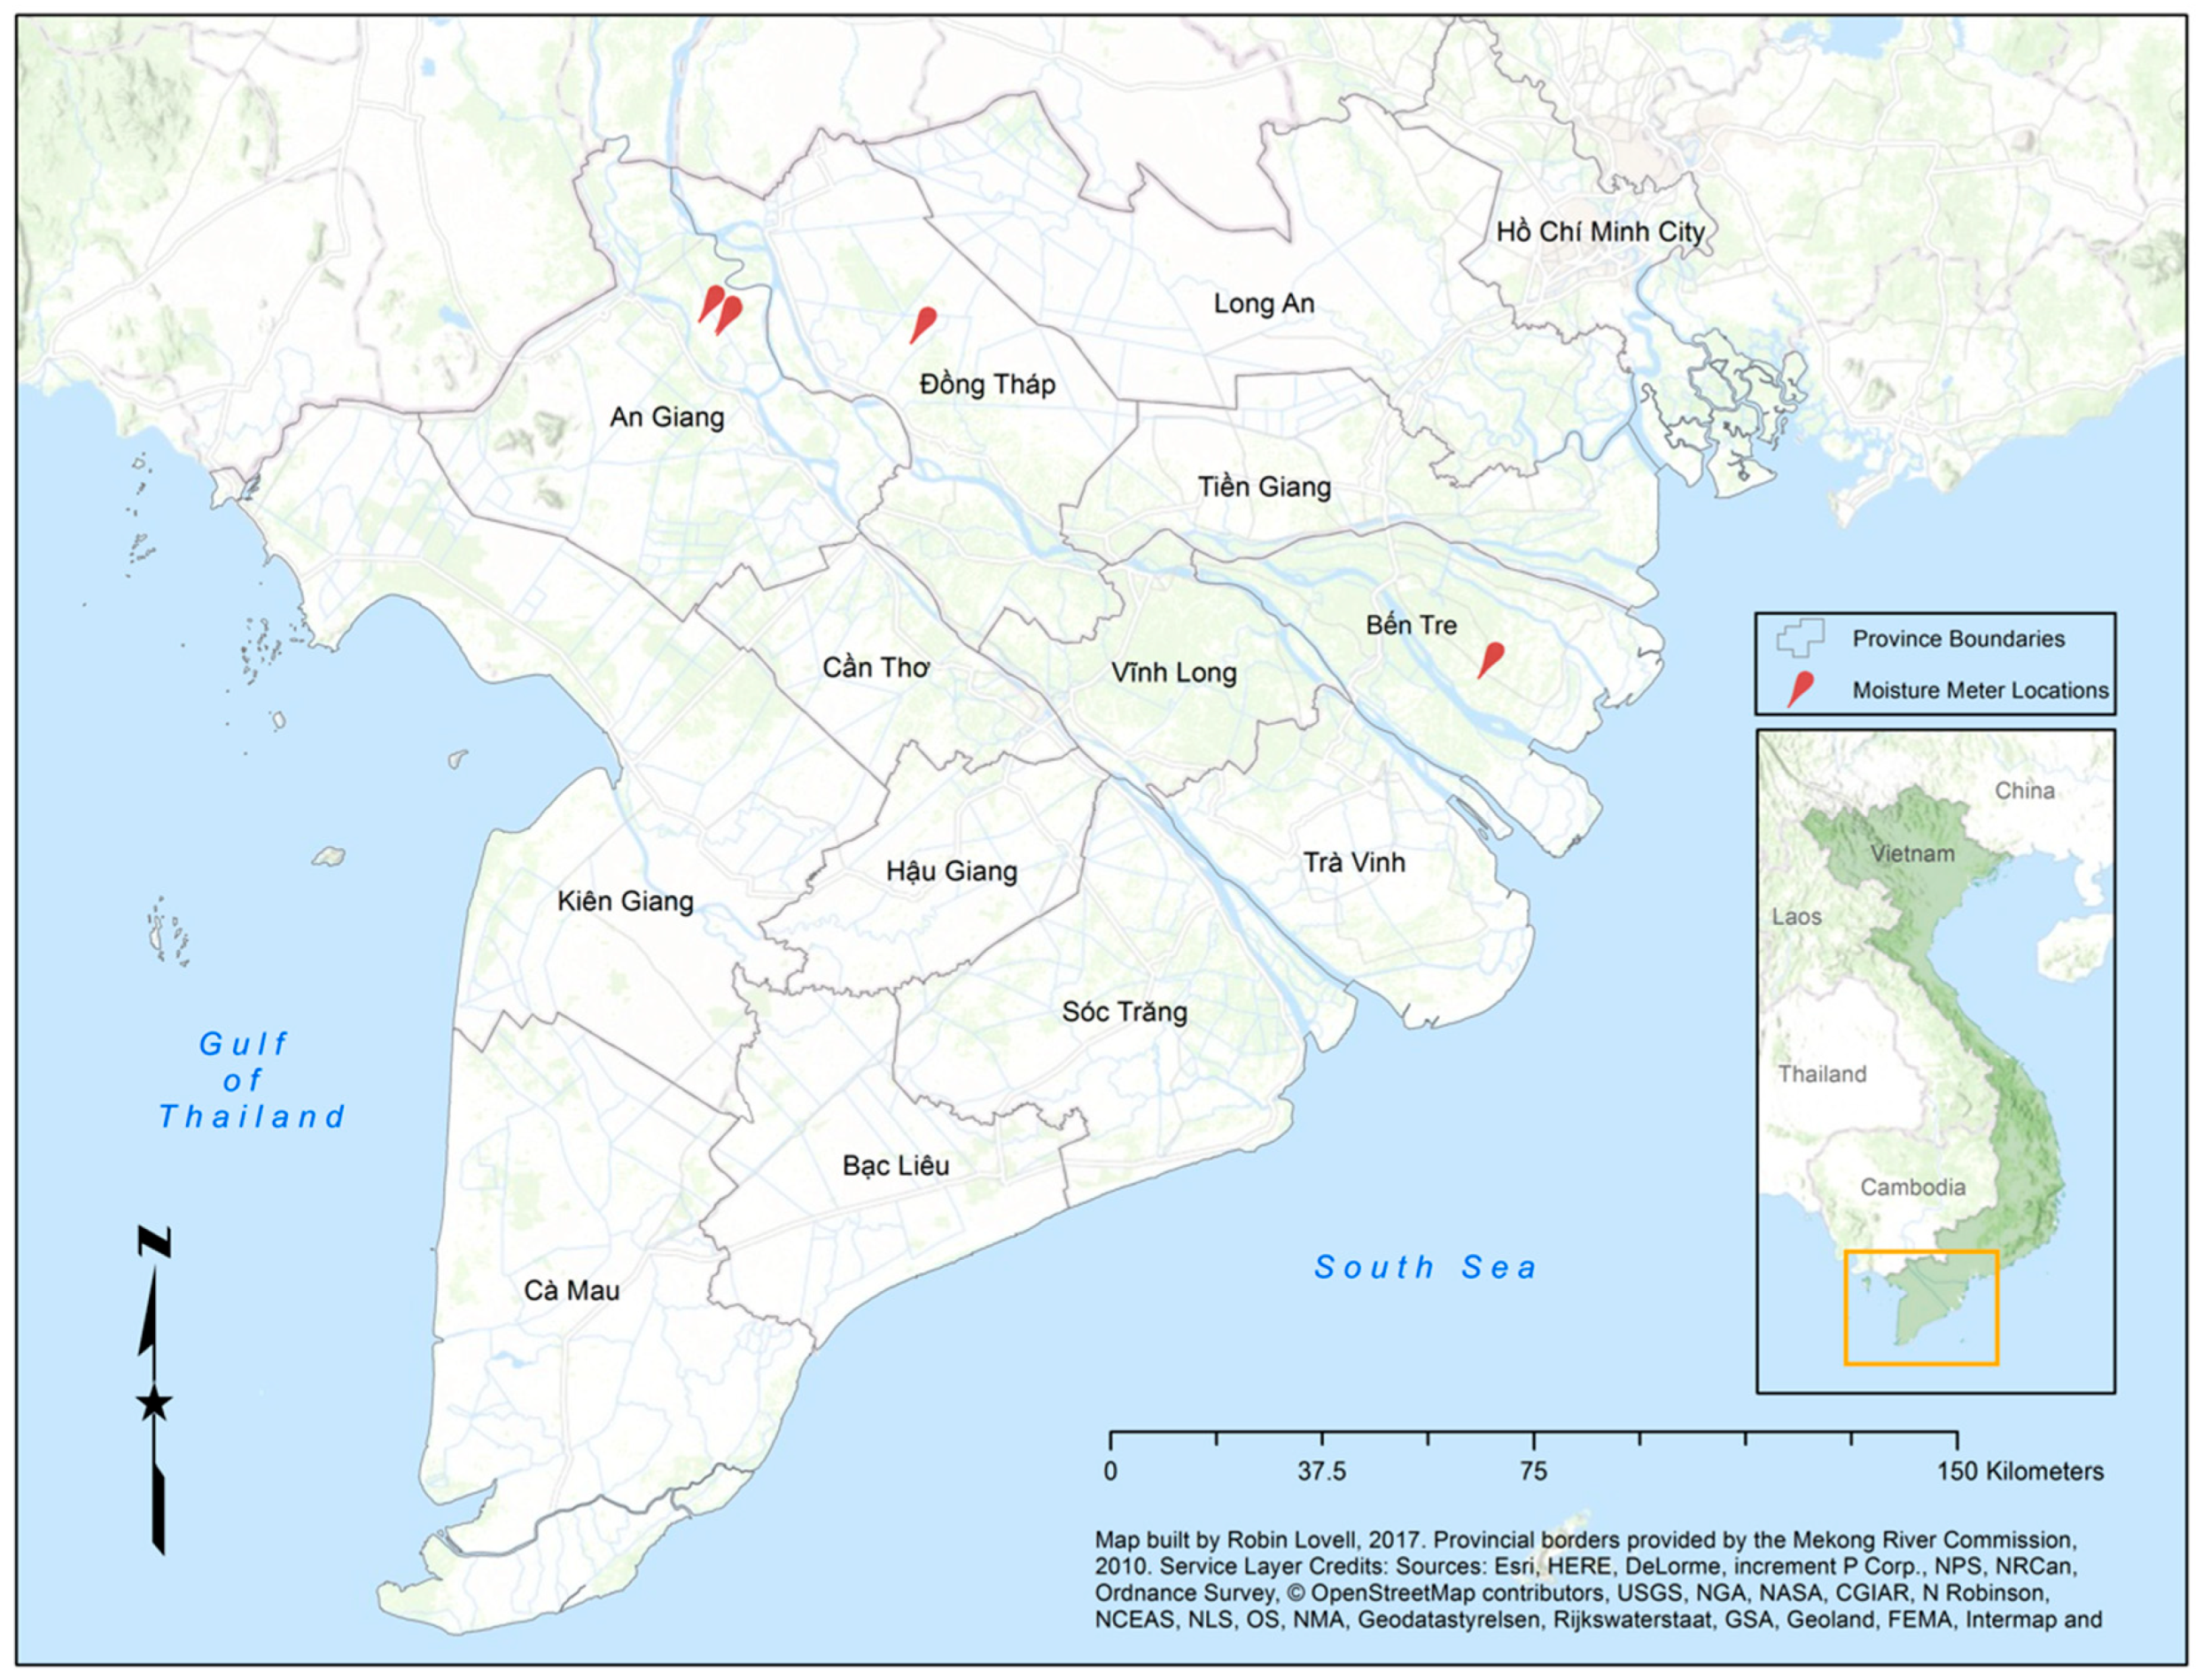
A series of dual-pronged in-situ soil moisture meters were installed throughout the Mekong River Delta (MRD) in strategic locations to validate the satellite data (see Figure 2). The meters were installed in December 2016 and then removed in April 2017 to capture the dry season growing period. The meters were installed in the three major soil types (and coincidentally three provinces: An Giang, Dong Thap, and Ben Tre) where rice is grown in the dry season to capture how the SAR data may be effected by soil type [25,26], and to replicate data acquisition in case of retrieval failures. In each province, data collection included moisture meters in a known AWD field and a non-AWD field with one replication per site. In total, there were 12 meters installed, four per soil type. Test plots were named sequentially from west to east, one through 12. The moisture meter locations are shown below in Figure 2. The meters were installed at least 10 meters away from the edge of the rice fields to account for the edge effects of watering regimes in the AWD and non-AWD fields. The dual prongs were placed in the soil to reach an approximate depth of 15 cm below the soil surface, the ideal depth to which AWD dry-down would reach. The moisture sensors remained in place throughout the growing season, with a connecting wire extending to the remote relay apparatuses. Air and humidity gauges were also attached to the meters to track climatic conditions. Since the relay apparatuses were sensitive to flood inundation, they were firmly secured inside a weather-proof box attached to a PVC pipe deeply buried in the rice field. The weather-proof box rested at an approximately 30 cm height above the soil surface. Moisture meters and climate gauges were powered by a solar panel. The solar panel was secured to the top of the PVC pipe, shading the relay apparatus inside the weather-proof box. Soil moisture meter data was remotely relayed on an hourly basis for the five months they were installed. Calibration of the soil moisture percentage occurred throughout the soil moisture meter tenure.
2.1. Remote Sensing Data Acquisition
The best source of data for this project currently includes the European Space Agency’s (ESA) Sentinel-1 satellite. The Vietnamese Mekong River Delta is approximately 40,000 square kilometers, where the majority of the area is covered by a single tile of ascending and descending passes by Sentinels 1-a and 1-b. SAR data is downloadable in raster format, with thousands of individual cells representing a set area in space or tile. Each cell within the tile of Sentinel-1 data represents 10 by 10 meters (m), for which a backscatter number, or digital number (DN), is given for that area of space. Each cell contains two bands of data collected from the satellite platform at different sending and retrieving polarizations: vertically sent and vertically retrieved (VV), and vertically sent and horizontally retrieved (VH). The VV band was used in this analysis because it had a higher accuracy in other similar WI studies [5]. Table 1 outlines the acquisition dates for which the VV and VH data was available for our study location.
2.2. Pre-processing
During pre-processing, this DN can be transformed, calibrated, and filtered to understand the different biophysical parameters of that space. There are a number of different constraints that must be accounted for when determining the SWC, depending on how the DN is transformed. The DN given by Sentinel-1 data can be transformed into sigma, beta, or gamma values. Different transformations were explored to determine what was best for determining AWD adoption in the MRD. Given the complexity of surface roughness and the rice crop canopy itself, the beta transformation was chosen using beta values (β°) to create a WI that represents SWC [5,7]. First, the β° transformation takes the DN and transforms it into a reflectivity coefficient. Then, the approach calibrates the β° using a script embedded in the downloadable file via the ESA web interface (beta calibration) [16]. Calibration for the beta values mostly uses a constant unique to the acquisition date, time, and incidence angle, so that the shift in distribution after calibration would not be as significant as it might be for sigma. After calibration, the data was run through a median smoothing filter to remove speckling [19]. These pre-processing steps created a multi-temporal dataset ready for analysis.
2.3. Parameterization
The test plots in An Giang, Dong Thap, and Ben Tre were used to train the model. The method calculated the maximum and minimum values for the VV bands of each soil type, with the minimum representing a “flooded” field with low reflectivity, and the maximum representing a “dry” field with high reflectivity [5,27]. Given the maximum and minimum VV values were not significantly different between soil types, we used the maximum and minimum VV from the An Giang province moisture meters. Using these values, we excluded VV values below the minimum and above the maximum values of these rice paddies across the entire dataset. In essence, this process acted as a high pass filter to pull out water features, urban features, and other non-paddy features [19]. Values outside a flooded or non-flooded field could confound the results by including non-agricultural land uses in the analysis. In other words, the maximum and minimum values from the test plots indicated a general range of scores that rice paddies may exhibit when dry or flooded. Meanwhile, scores above and below might represent buildings, open water, or roadways. The average maximum score of all the six test plots represented the highest score found in a dry paddy, whilst the average minimum score of all the six test plots represented the lowest score found in a wet paddy. Since some non-paddy features may fall within the maximum and minimum VV values, we assumed that some area included in the results was not cultivating rice. However, the purpose of this approach was to understand the broader trends across large areas of land. Worth noting that areas not fitting within the minimum and maximum range of a rice paddy have been shown in white in the results.
2.4. Wetness Index Calculation
The approach used the processed and parameterized dataset to create a WI. The method used the below formula, following similar studies of SWC using remotely sensed SAR data [5]:
where is the minimum value in the test plots, is the maximum value in the test plots, and is the instantaneous value of any given cell in a tile at any given time. The approach uses the most extreme maximum and minimum VV values from all the test plot values to evaluate how wet or dry a cell of data is, on any given data acquisition date. By setting a ceiling of maximum values and a floor of minimum values, each instantaneous reading was transformed into an index of relative wetness. By constraining the entire delta to values between a maximum and minimum VV value, known to be part of a wet or dry rice paddy, many non-paddy locations were excluded. The process turned the β° values into a ratio scale from −2 to +2. In doing so, each cell represents a relative degree of moisture compared to the maximum and minimum values outlined above. Thus, each scaled cell was more or less “wet” or “dry.”
2.5. Change Detection
The approach then analyzed the WI for each acquisition date in comparison to the following time step. This analysis was performed to calculate each cell’s change in dryness over time. Thus, for each set of two consecutive tiles, a third “change detection” tile was created to represent the raw WI score change for each cell. Figure 3 illustrates this approach, with the third tile illustrating the drying or wetting trends in Test Plot 3. Using this approach, the method averaged the individual time step WI scores across the delta to determine which rice paddy fields showed a drying or wetting trend.
2.6. Classification System
From the neighborhood analysis and time lag evaluation, a classification scheme was developed to average the change index across time. In this way, pixels that showed an overall drying trend over time would exhibit lower scores, whilst pixels that showed little change would hover around zero. Pixels that overall exhibited a wetting trend were the least likely to have adopted AWD, while pixels that exhibited more regular dry down periods between wetting events were likely AWD adopters.
3. Results
The results were broken up into two sections. The first section discusses the WI results, including how the WI can be paired with in situ soil moisture meter readings as validation. The test plots and soil moisture meter locations are shown within the larger study area in Figure 2. The second section reports the delta-wide patterns of wetting and drying. It should be noted that the number of soil moisture meters and the number of time steps analyzed in this study were quite small, as it was a pilot study to see if a correlation could be drawn between satellite data and in-situ moisture readings. For this reason, the statistical significance of the correlation found was not conclusive, but rather it was suggestive that the methods explored in this research illustrated a new promising approach to account for the adoption of water-saving behavior in agriculture.
3.1. Wetness Index Correlation
Soil moisture meter readings illustrated a clear association between VV-WI values, and soil moisture percentage taken from the test plots. The analysis used the VV band data to begin calculating the WI, similar to other WI studies [5]. An Giang is primarily alluvial, Ben Tre is saline, and Dong Thap is acid-sulfate. An Giang data most accurately reflected the WI calculations, as illustrated in Figure 4 and Figure 5. Figure 4 shows An Giang’s AWD test plot (Plot 3) in alluvial soils. The WI score and in situ soil moisture percent clearly corresponded. Figure 5 shows An Giang’s flooded test plot (Plot 5), with a similar correspondence in readings. The test plots for the Dong Thap and Ben Tre provinces did not display a clear trend.
3.2. AWD Adoption Likelihood
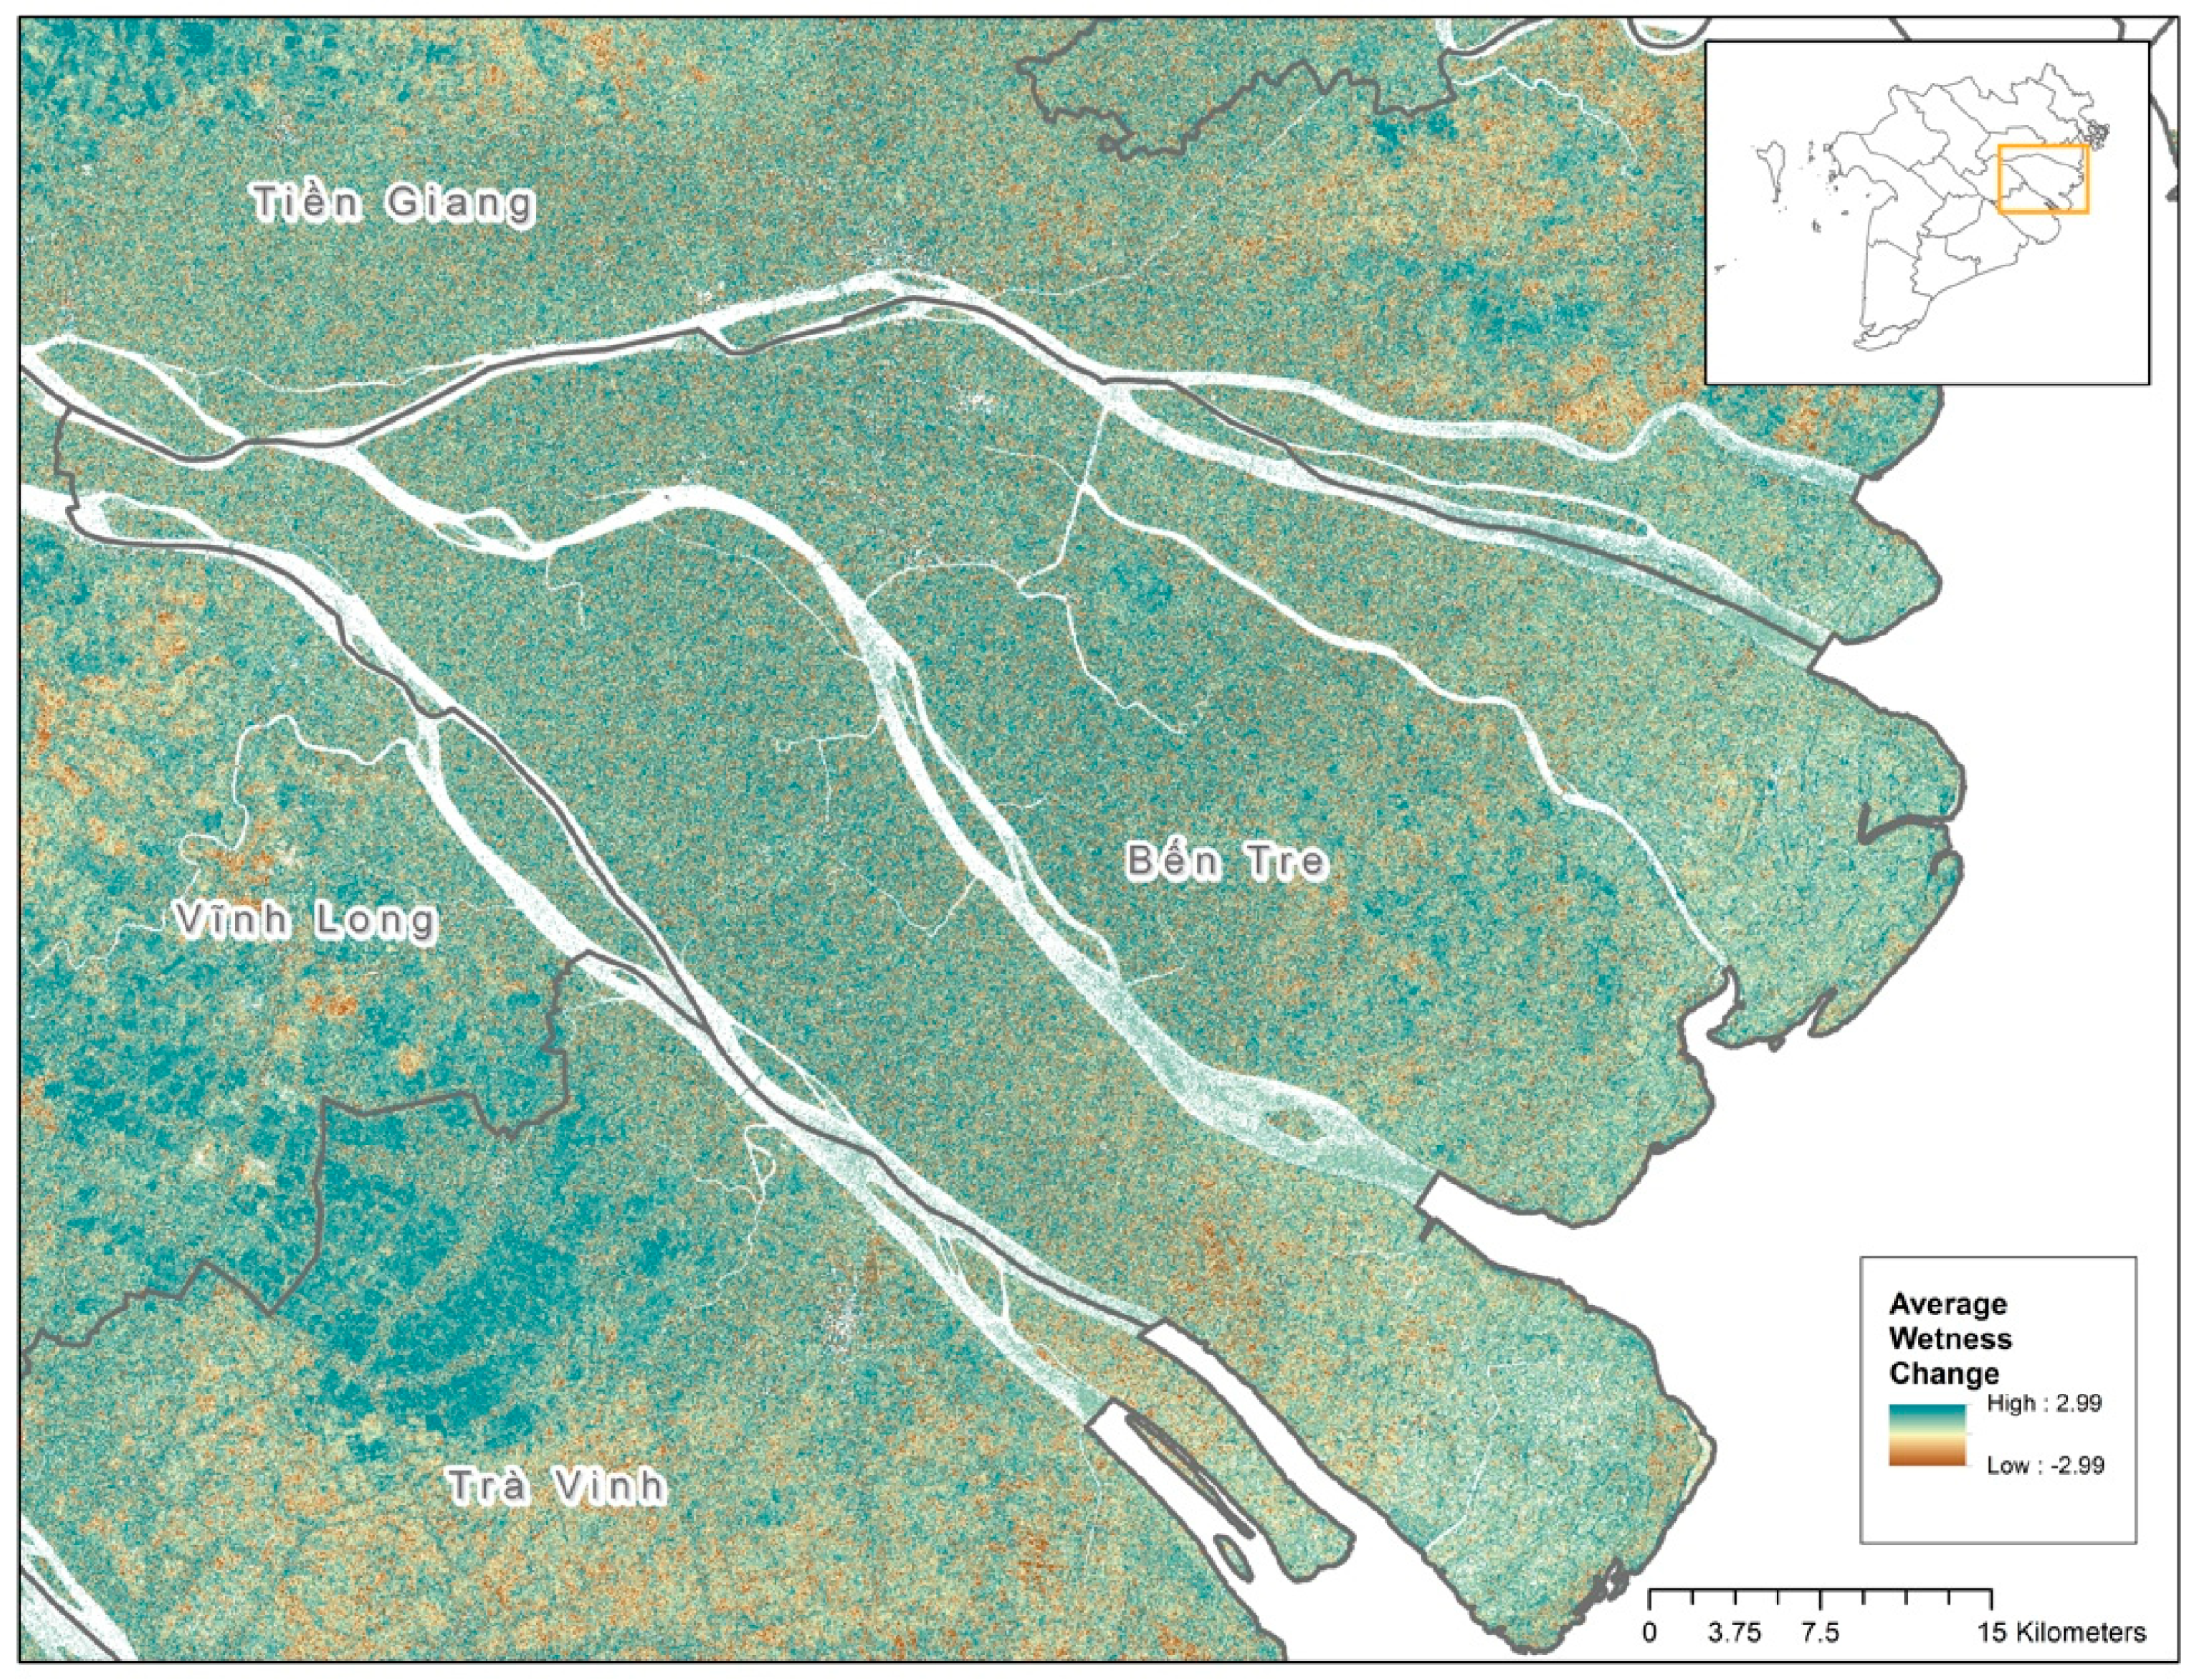
Results from the analysis illustrate the average drying trends in An Giang, Dong Thap, and Kien Giang (Figure 6 and Figure 7). However, there are some hot spots in coastal regions, such as Soc Trang, Tra Vinh, and Ben Tre. This is counterintuitive, as the household surveys, key informant interviews, and focus group discussions indicated that AWD was not often practiced in these coastal provinces.
As discussed earlier, the comparison between the coastal and inland province adoption of AWD was mirrored in the simultaneous effort undertaken by this research program to conduct household surveys. The results of that research demonstrated a clear trend toward large-scale adoption in Dong Thap and An Giang, whilst there was very low or no adoption in Bac Lieu (see Table 2 below). Low adoption rates in the coastal provinces were due to many factors, such as saltwater intrusion, low government sponsorship of flagship projects, and soil type. Interestingly, coastal provinces have had the most trouble accessing water, so it was notable that in the one rice season in which AWD was possible (Winter–Spring), the coastal province of Bac Lieu had the highest degree of adoption at 0.73. Overall, the household surveys corroborated the regional findings of the WI change detection approach, being that adoption was consistently much lower and inconsistent in the coastal provinces than the inland provinces.
4. Discussion
This section delves into three aspects of the results of this project. First, it states the limitations of this study and how future research could curtail these limitations and bolster the use of remotely sensed data to understand AWD adoption. It then outlines the challenges of using this methodology, both in the field and on the desktop. Finally, the discussion outlines the potential of the change detection approach in understanding regional differences in AWD adoption and water management on the farm level.
4.1. Limitations of the Change Detection Approach
There are several issues with the data availability and approach discussed in this paper. Estimating AWD adoption using remotely sensed data is a complex and nuanced issue. Not only was data availability an issue, but also the complexity of the SAR data itself. We suggest two avenues for correcting data availability and data analysis issues.
Further analysis of SAR data with additional time series datasets could yield more accurate results. To understand the sinusoidal patterns of each cell in the raster datasets, we suggest a power spectral density test. The average dry down, whilst a good estimate of an overall likelihood of some degree of AWD adoption, does not necessarily account for the complex periodicity of the SAR data across the delta over time. The change detection approach used for the SAR data analysis illustrates the average change over time for each cell in the tile that covers the MRD. However, a more nuanced approach would be to use a power spectral density analysis to understand the periodicity of the “dry down” signal and the power of that signal. In other words, cells with an increased likelihood of exhibiting an oscillating habit (which is presumed to be the AWD signal), would score higher on the power spectral density analysis.
Second, we suggest that researchers repeat the same analysis for all three seasons of rice to increase the accuracy of the power spectral density test. While the approach was able to detect the patterns of “dry down” across the delta, these conclusions would create a more robust signal analysis with longer sets of continuous data. If each growing season in a year could be analyzed continuously, especially over a series of years, this would enable the detection of a more conclusive and reliable AWD signal.
4.2. Challenges of the Change Detection Method
This approach was challenging methodologically, including issues with in-situ moisture meter readings and Sentinel-1 data gaps. Firstly, the moisture meters placed in the paddy fields were relaying data inconsistently due to product failure. The closest moisture meter readings to the Sentinel-1 time step (collected at approximately 22:45 on each day) were substituted in these cases. This substitution was adopted because the moisture did not vary considerably overnight in nearby replications, and the team was able to substitute the values within hours of the Sentinel-1 pass over. Therefore, it was assumed that these substituted readings did not impact the overall findings. To combat this inconsistent product issue, future studies should field test a number of different products prior to initiating the next seasonal study. Secondly, some Sentinel-1 pass over dates were simply not available. In this study, February 17, 2017 was not available for the analysis. This had an obvious effect of creating a large time gap in moisture change detection. To rectify these time gaps, future studies should use a longer dataset, either comparing seasons or full years of rice cropping behavior. In this way, the longitudinal gallery of images will subsume any influence the data gaps may have on change detection.
4.3. Potential of the Change Detection Approach
SAR data shows potential as a tool to document the adoption of water-saving practices, especially in alluvial soils. Whilst there are plenty of challenges with this new approach, the ability to broadly understand dry down patterns across the Mekong River Delta is useful for agricultural outreach, water management, and targeting training and intervention. Results of this study support further research and development in using remotely sensed data for documenting the adoption of AWD. Specifically, for alluvial soil types, as shown with the parallel patterns between the WI values and in situ moisture meters, this approach shows promising links to real world conditions.
The satellite data used, from Sentinel-1, had a moderately useful return time for analysis of AWD adoption in the MRD. Each satellite returns at 12-day intervals, meaning that the rate of return for the two satellites combined is every six days. While strict adherence to AWD technology would dictate that adoption means the dry down of rice fields every five days, a pattern of dry down was still detectable every six to 12 days. Therefore, it could be concluded that farmers are not necessarily utilizing a five-day dry down period, but perhaps a longer period of time between irrigations. Again, this deduction should be further tested in future studies.
The SAR data analysis was much more cost effective than other efforts to measure the extent of AWD adoption. This research project included a parallel effort to understand AWD adoption by conducting 285 household surveys in four delta provinces. The household survey efforts incurred approximately the same cost of developing and executing an analysis across the entire rice growing Mekong River Delta. With further development, this cost would continue to decline to near zero, using free data and repeating the same analysis over time to understand the adoption ebbs and flows.
5. Conclusion
There are several important conclusions to draw from this work. This was a pilot study to explore the relative merits of conducting a remote sensing evaluation in the form of the methodology outlined above, as a substitute for household surveys. The WI results show promise for natural resource managers that track water use in agricultural settings. However, there were many lessons learned throughout this process. First, the scope of this project, to truly test the veracity of the method, must increase in temporal scale and number of replications. In other words, not only does the method require additional seasons of data, but also many more in situ soil moisture meter readings to calibrate the WI values. Second, and in relation to the soil moisture meter replications, the WI did not correspond as tightly with moisture meter trends in saline and acid-sulfate soils as it did in alluvial soils. This was either an issue with moisture meter calibration, or potentially a deeper issue with how well the β° coefficient reflected soil moisture in soil types other than alluvium. Therefore, part of future research must include a deeper engagement to calibrate soil type with WI values and moisture meter readings. Finally, whilst the average change detection scores successfully reflected the household survey results, illustrating a higher degree of adoption inland and a lower degree of adoption in coastal provinces, a power spectral density analysis would better capture the periodicity of the AWD practice. In conclusion, there are many challenges that face this method, but with proper vetting, this new change detection approach could save time, money, and efforts wasted in promoting water-saving practices in the wrong places.
Author Contributions
R.L. conceived and designed the research, analyzed the data, and wrote the paper.
Acknowledgments
I would like to acknowledge the CGIAR Strengthening Impact Assessment in the CGIAR System Grant for funds to conduct this research and publish in an open access format.
Conflicts of Interest
The authors declare no conflict of interest. The founding sponsors had no role in the design of the study; in the collection, analyses, or interpretation of data; in the writing of the manuscript, and in the decision to publish the results.
References
- Lampayan, R.M.; Rejesus, R.M.; Singleton, G.R.; Bouman, B.A. Adoption and economics of alternate wetting and drying water management for irrigated lowland rice. Field Crop. Res. 2015, 170, 95–108. [Google Scholar] [CrossRef]
- Quynh, V.D.; Sander, B.O. Applying and Scaling up Alternate Wetting and Drying Technology for Paddy Rice in the Mekong River Delta. Available online: file:///C:/Users/mdpi/Downloads/Can%20Tho%20Workshop%20Report%20FINAL.pdf (accessed on 15 June 2019).
- Rejesus, R.M.; Palis, F.G.; Rodriguez, D.G.P.; Lampayan, R.M.; Bouman, B.A. Impact of the alternate wetting and drying (AWD) water-saving irrigation technique: Evidence from rice producers in the Philippines. Food Policy 2011, 36, 280–288. [Google Scholar] [CrossRef]
- Mendoza, T.L.; Singleton, G. Technologies meet farmers, Rice Today 2011. Available online: https://www.scribd.com/user/30672931/Rice-Today (accessed on 15 June 2019).
- Hassan, Q.K.; Bourque, C.P.A. Development of a New Wetness Index Based on RADARSAT-1 ScanSAR Data. In Remote Sensing for Archaeology and Cultural Landscapes; Springer Science and Business Media LLC: Medford, MA, USA, 2015; pp. 301–314. [Google Scholar]
- Wagner, W.; Sabel, D.; Doubkova, M.; Bartsch, A.; Pathe, C. The Potential of Sentinel-1 for Monitoring Soil Moisture with a High Spatial Resolution at Global Scale. In Proceedings of the Earth Observation and Water Cycle Science, Frascati, Italy, 18–20 November 2009. [Google Scholar]
- Wang, Y.; Ruan, R.; She, Y.; Yan, M. Extraction of Water Information based on RADARSAT SAR and Landsat ETM+. Procedia Environ. Sci. 2011, 10, 2301–2306. [Google Scholar] [CrossRef] [Green Version]
- Penny, D. The Mekong at Climatic Crossroads: Lessons from the Geological Past. Ambio 2008, 37, 164–169. [Google Scholar] [CrossRef]
- Hung, N.N.; Delgado, J.M.; Tri, V.K.; Hung, L.M.; Merz, B.; Bárdossy, A.; Apel, H. Floodplain hydrology of the Mekong delta, Vietnam. Hydrol. Process. 2012, 26, 674–686. [Google Scholar] [CrossRef]
- Hoa, L.T.V.; Shigeko, H.; Nhan, N.H.; Cong, T.T. Infrastructure effects on floods in the Mekong River Delta in Vietnam. Hydrol. Process. 2008, 22, 1359–1372. [Google Scholar] [CrossRef]
- Keskinen, M.; Chinvanno, S.; Kummu, M.; Nuorteva, P.; Snidvongs, A.; Varis, O.; Västilä, K. Climate change and water resources in the lower Mekong River Basin: Putting adaptation into the context. J. Water Clim. Chang. 2010, 1, 103–117. [Google Scholar] [CrossRef]
- Wade, L.; George, T.; Ladha, J.; Singh, U.; Bhuiyan, S.; Pandey, S. Opportunities to manipulate nutrient-by-water interactions in rainfed lowland rice systems. Field Crop. Res. 1998, 56, 93–112. [Google Scholar] [CrossRef]
- Natural Resource Management for Poverty Reduction and Environmental Sustainability in Fragile Rice-based Systems 2009. Available online: https://www.slideshare.net/consortiumforunfavorablericeenvironments/irri-limited-proceedings-progress-in-natural-resource-management-for-poverty-reduction-and-environmental-sustainability-in-fragile-ricebased-systems (accessed on 15 June 2019).
- Bell, R.W.; Seng, V. Rainfed lowland rice-growing soils of Cambodia, Laos, and North-east Thailand. In Proceedings of the Water in Agriculture ACIAR Proceedings No. 116e, Phnom Penh, Cambodia, 25–28 November 2004; pp. 161–173. [Google Scholar]
- Lakhankar, T.; Ghedira, H.; Azar, A.; Khanbilvardi, R. Effect of sub-pixel variability and land-cover on soil moisture retrieval from RADARSAT-1 data. IEEE MicroRad 2006, 187–192. [Google Scholar]
- Miranda, N.; Meadows, P.J.; Type, D.; Note, T. Radiometric Calibration of S-1 Level-1 Products Generated by the S-1 IPF; European Space Agency: Paris, France, 2015; pp. 1–13. [Google Scholar]
- Moran, M.S.; Peters-Lidard, C.D.; Watts, J.M.; McElroy, S. Estimating soil moisture at the watershed scale with satellite-based radar and land surface models. Can. J. Remote Sens. 2004, 30, 805–826. [Google Scholar] [CrossRef] [Green Version]
- Hornacek, M.; Wagner, W.; Sabel, D.; Truong, H.L.; Snoeij, P.; Hahmann, T.; Diedrich, E.; Doubkova, M. Potential for High Resolution Systematic Global Surface Soil Moisture Retrieval via Change Detection Using Sentinel-1. IEEE J. Sel. Top. Appl. Earth Obs. Remote Sens. 2012, 5, 1303–1311. [Google Scholar] [CrossRef] [Green Version]
- Padhye, S.A.; Rege, P.P. Feature extraction from microwave data using backscatter coefficient. In Proceedings of the International Conference on Industrial Instrumentation and Control (ICIC), Pune, India, 28–30 May 2015; pp. 789–794. [Google Scholar]
- Barrett, B.; Petropoulos, G. Satellite Remote Sensing of Surface Soil Moisture. In Remote Sens. Energy Fluxes Soil Moisture Content, 1st ed.; Taylor & Francis: Abingdon, UK, 2013. [Google Scholar]
- Inoue, Y.; Sakaiya, E.; Wang, C. Capability of C-band backscattering coefficients from high-resolution satellite SAR sensors to assess biophysical variables in paddy rice. Remote Sens. Environ. 2014, 140, 257–266. [Google Scholar] [CrossRef]
- Liew, S.C.; Kam, S.P.; Tuong, T.P.; Chen, P.; Minh, V.Q.; Balababa, L.; Lim, H. Application of multitemporal ERS synthetic aperture radar in delineating rice cropping systems in the Mekong river delta. Int. Geosci. Remote Sens. Symp. 1997, 2, 1084–1086. [Google Scholar] [CrossRef]
- Guan, X.; Huang, C.; Liu, G.; Meng, X.; Liu, Q. Mapping Rice Cropping Systems in Vietnam Using an NDVI-Based Time-Series Similarity Measurement Based on DTW Distance. Remote Sens. 2016, 8, 19. [Google Scholar] [CrossRef]
- Nguyen, T.T.H.; De Bie, C.A.J.M.; Ali, A.; Smaling, E.M.A.; Chu, T.H. Mapping the irrigated rice cropping patterns of the Mekong delta, Vietnam, through hyper-temporal SPOT NDVI image analysis. Int. J. Remote Sens. 2012, 33, 415–434. [Google Scholar] [CrossRef]
- Xiao, D.; Feng, J.; Wang, N.; Luo, X.; Hu, Y. Integrated soil moisture and water depth sensor for paddy fields. Comput. Electron. Agric. 2013, 98, 214–221. [Google Scholar] [CrossRef]
- Montzka, C.; Moradkhani, H.; Weihermüller, L.; Franssen, H.J.H.; Canty, M.; Vereecken, H. Hydraulic parameter estimation by remotely-sensed top soil moisture observations with the particle filter. J. Hydrol. 2011, 399, 410–421. [Google Scholar] [CrossRef]
- Lillesand, T.M.; Kiefer, R.W.; Chipman, J.W. Remote Sensing and Image Interpretation; Wiley: Hoboken, NJ, USA, 2008; Volume 3, ISBN 978-0-470-05245-7. [Google Scholar]
Figure 1.
Remote sensing workflow. The workflow was adapted and developed throughout the project, based on previous WI studies, as well as project iterations.
Figure 1.
Remote sensing workflow. The workflow was adapted and developed throughout the project, based on previous WI studies, as well as project iterations.

Figure 2.
Study Location Map. Test plots and soil moisture meter locations are shown in red. Two test plots were chosen in each province, an alternative wetting and drying (AWD) and non-AWD rice paddy, representing the three major soil types in the delta. An Giang Province is alluvial soils, Ben Tre Province is saline, and Dong Thap Province is acid-sulfate. Note: the two plots are somewhat separated in An Giang, while they are very close together in Dong Thap and Ben Tre, so they display as a single point in the latter two provinces.

Figure 3.
Change detection approach. (a) Initial time step wetness index (WI) scores for Test Plot 3, used in this figure as an example to illustrate the variability within each rice paddy, as well as its change over time. (b) The second time step in Test Plot 3, showing the wet and dry patterns changing over time. (c) Average change over time is shown, with bluer values illustrating a wetting trend and tan values illustrating a drying trend.

Figure 4.
Plot 3 soil water content variability. The following are readings from Test Plot 3 in An Giang province, in which the farmer uses AWD management practices. It shows the VV-WI, and moisture percent readings for the plot. The two factors show a strong correlation (r = 0.65).
Figure 4.
Plot 3 soil water content variability. The following are readings from Test Plot 3 in An Giang province, in which the farmer uses AWD management practices. It shows the VV-WI, and moisture percent readings for the plot. The two factors show a strong correlation (r = 0.65).

Figure 5.
Plot 5 soil water content variability. The following readings from Test Plot 5 in An Giang province, in which the farmer uses flooded management practices, shows the VV WI and moisture percent readings for the plot. The two factors show a strong correlation (r = 0.59)
Figure 5.
Plot 5 soil water content variability. The following readings from Test Plot 5 in An Giang province, in which the farmer uses flooded management practices, shows the VV WI and moisture percent readings for the plot. The two factors show a strong correlation (r = 0.59)

Figure 6.
Inland average WI change. The inland pattern of higher dryness averages showing an overall greater occurrence of drying down, or a lower WI score. These results demonstrate that the inland provinces of An Giang and Dong Thap may be adopting AWD at a broader, more uniform rate than the coastal provinces.

Figure 7.
Coastal average WI change. The coastal pattern of higher WI averages shows an overall average trend toward flooding or a higher WI score. These results demonstrate that coastal provinces, such as Ben Tre, adopt AWD practices less often than the inland provinces.
Figure 7.
Coastal average WI change. The coastal pattern of higher WI averages shows an overall average trend toward flooding or a higher WI score. These results demonstrate that coastal provinces, such as Ben Tre, adopt AWD practices less often than the inland provinces.


Table 1.
1a and 1b Data Acquisition.
| Acquisition Dates 1 |
|---|
| 5 January 2017 |
| 11 January 2017 |
| 17 January 2017 |
| 23 January 2017 |
| 29 January 2017 |
| 4 February 2017 |
| 10 February 2017 |
| 22 February 2017 |
| 28 February 2017 |
| 23 March 2017 |
1 Acquisition times were between 22:45:06 and 22:45:46.
Table 2.
Adoption rates in three provinces of the Mekong River Delta. 1
| Degree of Adoption by Season | An Giang | Dong Thap | Bac Lieu | |||
|---|---|---|---|---|---|---|
| N | Mean/SP 2 | N | Mean/SP | N | Mean/SP | |
| Winter-Spring | 96 | 0.68 | 63 | 0.68 | 44 | 0.73 |
| Summer-Autumn | 96 | 0.66 | 63 | 0.68 | 44 | 0.04 |
| Autumn-Winter | 95 | 0.67 | 46 | 0.63 | 2 | 0.25 |
1 Adoption rates are expressed as a scale from 0 to 1. 2 SP = sample share.
© 2019 by the author. Licensee MDPI, Basel, Switzerland. This article is an open access article distributed under the terms and conditions of the Creative Commons Attribution (CC BY) license (http://creativecommons.org/licenses/by/4.0/).
Share and Cite
MDPI and ACS Style
Lovell, R.J. Identifying Alternative Wetting and Drying (AWD) Adoption in the Vietnamese Mekong River Delta: A Change Detection Approach. ISPRS Int. J. Geo-Inf. 2019, 8, 312. https://doi.org/10.3390/ijgi8070312
AMA Style
Lovell RJ. Identifying Alternative Wetting and Drying (AWD) Adoption in the Vietnamese Mekong River Delta: A Change Detection Approach. ISPRS International Journal of Geo-Information. 2019; 8(7):312. https://doi.org/10.3390/ijgi8070312
Chicago/Turabian StyleLovell, Robin J. 2019. "Identifying Alternative Wetting and Drying (AWD) Adoption in the Vietnamese Mekong River Delta: A Change Detection Approach" ISPRS International Journal of Geo-Information 8, no. 7: 312. https://doi.org/10.3390/ijgi8070312
Note that from the first issue of 2016, this journal uses article numbers instead of page numbers. See further details here.