Abstract
Osmotic stress is a condition in which plants do not get enough water due to changes in environmental factors. Plant response to osmotic stress is a complex process involving the interaction of different stress-sensitive mechanisms. Differentially expressed genes and response mechanisms of kohlrabi have not been reported under osmotic stress. A total of 196,642 unigenes and 33,040 differentially expressed unigenes were identified in kohlrabi seedlings under polyethylene glycol osmotic stress. AP2/ERF, NAC and eight other transcription factor family members with a high degree of interaction with CAT and SOD antioxidant enzyme activity were identified. Subsequently, 151 AP2/ERF genes were identified and analyzed. Twelve conserved motifs were searched and all AP2/ERF genes were clustered into four groups. A total of 149 AP2/ERF genes were randomly distributed on the chromosome, and relative expression level analysis showed that BocAP2/ERF genes of kohlrabi have obvious specificity in different tissues. This study lays a foundation for explaining the osmotic stress resistance mechanism of kohlrabi and provides a theoretical basis for the functional analysis of BocAP2/ERF transcription factor family members.
1. Introduction
Kohlrabi (Brassica oleracea L. var. caulorapa L.) is a variety of cabbage (Brassica oleracea) that belongs to the Cruciferae family (Brassicaceae) [1], and is widely cultivated in Europe, the US, Canada and Asia [2]. The swollen stem at the base of the plant is mainly consumed by humans as food [3,4]. It is a valuable source of nutrients, mainly containing carotenoids, glucosinolates, and phenylpropanoids [5]. In addition, potential antidiabetic, anti-inflammatory, and antioxidant properties and anticancer effects have been found in kohlrabi [6].
Osmotic stress occurs when the osmotic pressure in a plant is lower than the environmental osmotic pressure, and thus the plant cannot absorb or even lose water. This leads to a physiological drought caused by water deficit and ultimately affects plant growth and development. Water deficit is an important abiotic stress factor that limits agricultural crop production worldwide [7,8,9,10]. Water deficit affects plant growth, development, and productivity at any stage [11]. Due to varied species, different drought stress severity, duration, and the timing of water deficit occurrence, physiological and gene network responses to water deficit are complex [10,12]. Therefore, it is of great significance to study response mechanisms to physiological drought caused by osmotic stress and excavate differentially expressed genes of different crops. Relying on transcriptome sequencing approach, a large number of differentially expressed genes (DEGs) in response to Polyethylene Glycol (PEG) osmotic stress were identified [13,14]. In root and tuber crops, Karanja et al. [15] reported that the RsERF045, RsERF104 and RsERF184 genes were highly responsive to PEG in radish. Öztürk Gökçe et al. [16] described MYB-48 transcription factor, F-box protein, ferric reduction oxidase, and ABA-induced somatic embryo gene expression upregulation under water deficit. Zhao et al. [10] reported that NAC, MYB, WRKY, homeobox-leucine zipper (HD-ZIP) and basic leucine-zipper (bZIP) were closely related to the response to PEG osmotic stress in Jerusalem artichoke. In potato, Charfeddine et al. [17] revealed that overexpression of StERF94 improved the tolerance of transgenic plants to drought, heat, and combined stresses. However, the DEGs and responding mechanism of kohlrabi under water deficit induced by osmotic stress have not been reported.
APETALA2/ethylene responsive factor (AP2/ERF) is one of the largest transcription factor families in plants, with a typical feature of one or two AP2 DNA-binding conserved domains [18,19]. AP2/ERF transcription factor family members are divided into AP2, ERF, and RAV subfamilies based on the number and type of conserved domains [20]. The AP2 subfamily members contain two AP2 domains, while the ERF subfamily members contain an AP2 domain, and the RAV subfamily members contain one AP2 domain and one B3 domain [21,22,23]. Research on the AP2/ERF family has been conducted in a variety of plants, including rhododendron [24], oily persimmon [25], maize [26], sand pear [27], tomato [28], Juglans mandshurica [29], ramie [30], and so on. The identification and analysis of AP2/ERF family members lays the foundation for clarifying the function of the AP2/ERF gene.
In this study, DEGs under osmotic stress and the AP2/ERF transcription factor family in kohlrabi are reported for the first time. This study lays a foundation for explaining the osmotic stress resistance mechanism of kohlrabi and provides a theoretical basis for the function analysis of BocAP2/ERF transcription factor family members.
2. Results
2.1. Changes in SOD Activity, CAT Activity, and Proline Content under Osmotic Stress
To study the physiology and biochemical effect of osmotic stress treatment on kohlrabi seedlings, kohlrabi seedlings were treated with PEG-6000 and phenotypes observed and photographed (Figure 1A–D). Kohlrabi seedling leaves were dehydrated at 24 h and wilted at 48 h after PEG-6000 treatment. According to the phenotype changes, seedlings leaves were sampled at 0 h (untreated, CK) and 12 h, 24 h, and 48 h after treatment and each sample contains three biological replicates.
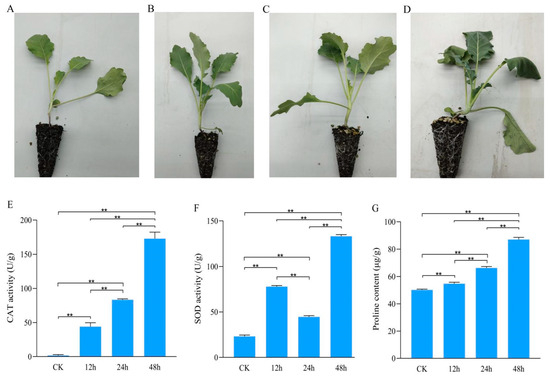
Figure 1.
Phenotypes and biochemical indicators of kohlrabi seedlings under PEG6000 osmotic stress treatment. (A–D) Phenotypes of kohlrabi seedlings under PEG6000 osmotic stress treatment at 0 h, 12 h, 24 h and 48 h; (E) catalase activity of kohlrabi seedlings under osmotic stress at 0 h, 12 h, 24 h and 48 h; (F) superoxide dismutase activity of kohlrabi seedlings under osmotic stress at 0 h, 12 h, 24 h and 48 h; (G) proline content of kohlrabi seedlings under osmotic stress at 0 h, 12 h, 24 h and 48 h. ** represents significantly difference when p value was 0.01.
Biochemical indicators, including CAT activity, SOD activity and proline content, were detected. With increasing treatment time, the activity of CAT had significantly increased from 1.68 ± 1.33 U/g FW at CK to 172.89 ± 9.55 U/g FW at 48 h after treatment (Figure 1E). The change trend of SOD activity varied from that of CAT activity with increasing treatment time. SOD activity was significantly stronger after treatment than that in control and significantly weaker at 24 h (44.65 ± 1.32 U/g FW) after treatment than those at 12 h (77.87 ± 1.67 U/g FW) and 48 h (133.16 ± 1.76 U/g FW) after treatment (Figure 1F). Proline content was significantly increased with increasing treatment time: 50.18 ± 0.61 μg/g FW at CK and 87.02 ± 1.61 μg/g FW at 48 h after treatment (Figure 1G).
2.2. Unigene Annotation and Differentially Expressed Gene Identification under Osmotic Stress
Twelve RNA-sequence libraries were built and used for analyzing DEGs in kohlrabi seedlings under PEG-6000 osmotic stress. A total of 45,262,254 – 53,167,538 raw reads and an average of 46,526,798 clean reads with 6.98 Gb clean base were generated. Data quality analysis showed that the average Q30 was 94.40% and the average GC content 47.15% (Table S1). After Trinity splicing, 204,346 transcripts were generated with an average length of 1304 bp, with N50 length of 1834 bp and N90 length of 664 bp. Then, upon Corset hierarchical clustering, 196,642 unigenes were obtained with an average length of 1345 bp, an N50 length of 1844 bp, and an N90 of 689 bp.
Transcript and unigene length analysis showed that 38,951 transcripts (19.06%) and 38,951 unigenes (19.80%) were more than 2000 bp in length, while 22,900 transcripts (11.21%) and 15,804 unigenes (8.04%) were less than 500 bp in length (Figure S1A). Unigene annotation revealed 134,011 (68.15%), 173,759 (88.36%), 144,868 (73.67%), 103,662 (52.72%), 123,671 (62.89%), 125,704 (63.93%) and 175,825 (89.41%) unigenes were annotated in the Kyoto Encyclopedia of Genes and Genomes (KEGG), NCBI non-redundant (NR) protein sequence, Gene Ontology (GO), Eukaryotic Orthologous Groups (KOG), Protein Family (Pfam), Swiss-Prot and Trembl databases, respectively. A total of 177,301 unigenes (90.16%) were annotated in at least one database and all unigenes were annotated (Table 1). Alignment with the NR database showed that the species with the most unigene hits (72,081, 41.48%) was Brassica napus, followed by Brassica oleracra var. oleracra (66,448, 38.24%) (Figure S1B).

Table 1.
Functional annotation of assembled unigenes under polyethylene glycol 6000 osmotic stress in kohlrabi seedling.
Based on the FPKM value of each unigene in kohlrabi seedling leaves under PEG-6000 osmotic stress, a total of 33,040 DEGs were identified (Table S2). Subsequently, six pairwise comparisons of DEGs at CK vs. 12 h, CK vs. 24 h, CK vs. 48 h, 12 h vs. 24 h, and 24 h vs. 48 h were calculated. Overall, 16,597 (6924 upregulated at 12 h and 9673 downregulated), 4723 (2246 upregulated at 24 h and 2477 downregulated), and 9977 DEGs (4734 upregulated at 48 h and 5243 downregulated) were identified in the comparisons of CK vs. 12 h, CK vs. 24 h and CK vs. 48 h (Figure 2A). Comprehensive analysis of these three pairwise comparisons revealed a total of 1541 common DEGs (Figure 2B, Table S3). In the pairwise comparisons of 12 h vs. 24 h and 24 h vs. 48 h, 10,775 DEGs (6630 upregulated at 24 h and 4145 downregulated), 5748 DEGs (3190 upregulated at 48 h and 2558 downregulated) were identified and three pairwise comparisons (CK vs. 12 h, 12 h vs. 24 h and 24 h vs. 48 h) showed 684 common DEGs (Figure 2C, Table S4).
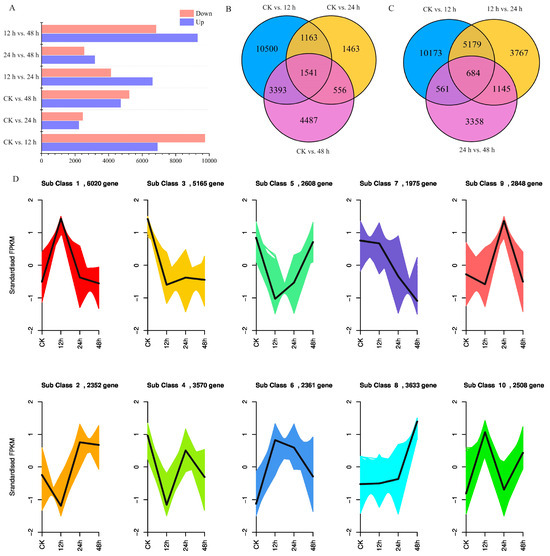
Figure 2.
Differentially expressed unigene analysis of kohlrabi seedlings under PEG-6000 osmotic stress treatment. (A) Differentially expressed unigenes in different pairwise comparisons between control and different treatment times; (B) Venn diagram of differentially expressed unigene numbers in pairwise comparisons between control and treatment of CK vs. 12 h, CK vs. 24 h, and CK vs. 48 h; (C) Venn diagram of differentially expressed unigene numbers in pairwise comparisons of treatment of CK vs. 12 h, 12 h vs. 24 h, and 24 h vs. 48 h; (D) Trend analysis of differentially expressed unigenes under PEG6000 osmotic stress from 0 h to 48 h.
Trend analysis was also performed, and results showed that all DEGs were divided into 10 subclasses, in which subclass 7 showed a downward trend and subclass 8 showed an upward trend. A total of 2383 unigenes and 2583 unigenes were clustered separately (Figure 2D, Table S5). To further select the DEGs related to osmotic stress, common DEGs in the pairwise comparisons of CK vs. 12 h, CK vs. 24 h and CK vs. 48 h and pairwise comparisons of CK vs. 12 h, 12 h vs. 24 h and 24 h vs. 48 h were identified. A total of 282 DEGs were screened, and a heatmap of mRNA accumulation is shown in Figure 3.
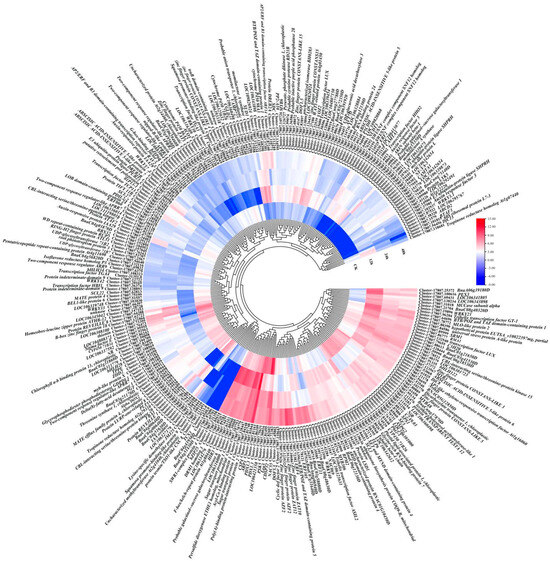
Figure 3.
Heatmap of 282 DEGs normalized using log2FPKM in leaves of kohlrabi seedlings under PEG-6000 osmotic stress.
2.3. Validation of the Transcriptomic Data
To verify the reliability of the transcriptome data, eight randomly selected DEGs were used to analyze expression levels in kohlrabi seedling leaves under PEG-6000 osmotic stress of CK and treatment for 12 h, 24 h, and 48 h by RT-qPCR, with three replicates for each. The qRT-PCR experiment primers are listed in Table S6. The log2(ratio) of RT-qPCR and log2(ratio) of RNA-seq were analyzed at 12 h/CK, 24 h/CK and 48 h/CK (Figure 4A,B). Despite there existing some tiny differences between RT-qPCR data and the transcriptomic data, the expression trends in these genes were the same (Figure 4C). A significant positive correlation (r2 = 0.7423) of the fold change in gene expression rate between RT-qPCR and transcriptome data based on the linear regression analysis results was found, which indicates that the transcriptome data were reliable and valid.
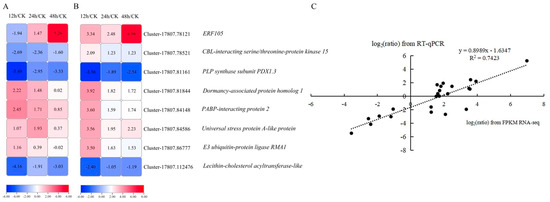
Figure 4.
Linear regression analysis of eight DEGs between RNA-sequencing data and RT-qPCR data. (A) Expression level heatmap of eight DEGs using RT-qPCR. (B) RNA expression profile heatmap of eight DEGs using RNA-seq. (C) Linear regression correlation analysis between RNA-seq data and RT-qPCR data of the expression levels of eight DEGs.
2.4. Weighted Gene Co-Expression Network Analysis between Biochemical Indicators and DEGs
To explore the key DEGs involved in CAT activity, SOD activity and proline biosynthesis in kohlrabi seedlings under PEG-6000 osmotic stress, the interaction regulatory network between biochemical indicators and DEGs was analyzed by weighted gene correlations. Twenty-one DEGs showed high correlation with CAT activity, SOD activity and proline content, including AP2/ERF transcription factor family genes, NAC transcription factor family genes and eight other transcription factor family genes (Figure 5). The results showed that these genes may adapt to the effects of osmotic stress by promoting or inhibiting CAT activity, SOD activity and proline content.
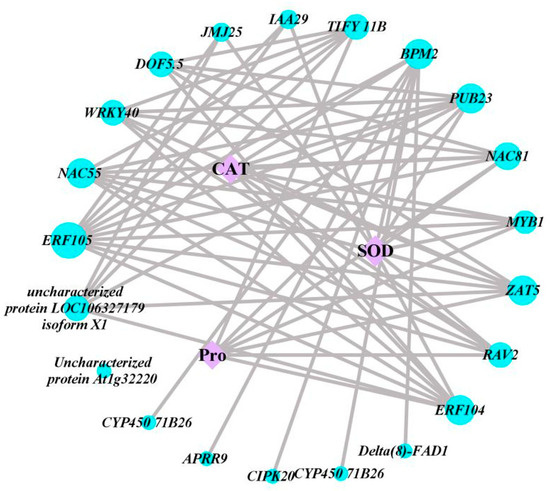
Figure 5.
Weighted gene co-expression network map between DEGs and CAT activity, SOD activity and proline content. Blue circles indicate differentially expressed genes; purple squares indicate CAT, SOD and proline.
2.5. AP2/ERF Transcription Factor Family Member Identification and Chromosomal Localization
Considering the high correlation of AP2/ERF transcription factor family genes with CAT activity, SOD activity and proline content, we performed AP2/ERF transcription factor family analysis in kohlrabi. A total of 151 BocAP2/ERF transcription factors were identified based on a batch CD search of NCBI conserved domain database for the Brassiceae genome (Table S7). The length of BocAP2/ERF proteins ranged from 151 to 588 amino acids (aa) and the molecular weight (MW) ranged from 16,380 Da to 65,563 Da. Physicochemical property analysis showed that the theoretical isoelectric point (pI) ranged from 4.62 to 10.00. Conserved domains analysis showed that 151 members were classified into three subfamilies, including 34 AP2 subfamily genes (two AP2 domains), 108 ERF subfamily genes (one AP2 domain), and 9 RAV subfamily genes (one AP2 and an extra B3 domain) (Figure 6A).
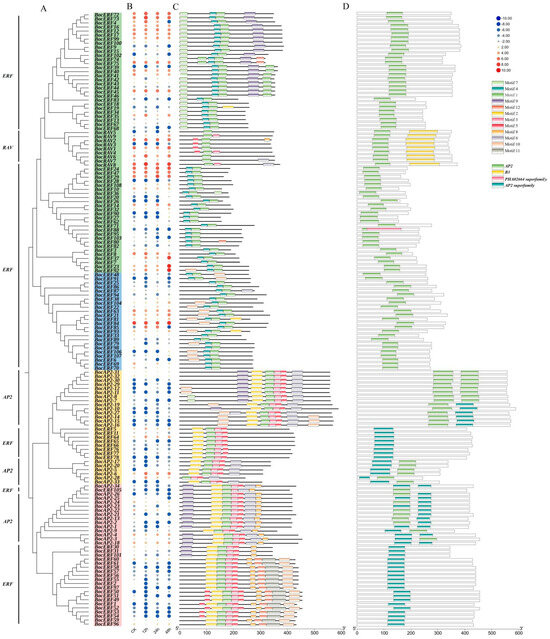
Figure 6.
Evolutionary relationships, expression analysis, conserved protein motifs and domains of the 151 BocAP2/ERFs. (A) Phylogenetic relationships were constructed according to amino acid sequences by MEGA11. (B) Expression profile of BocAP2/ERF genes in kohlrabi using RNA sequencing during osmotic stress. (C) Distribution of 12 motifs. (D) Distribution of AP2 domain, B3 domain, PHA02664 superfamily domain and AP2 superfamily domain.
The expression profiles of these 151 BocAP2/ERF genes were also analyzed and showed in Figure 6B. A total of 27 genes showed significant changes under osmotic stress, of which 11 (BocERF26, BocERF28, BocERF78, BocERF90, BocERF104, BocERF106, BocERF107, BocERF108, BocAP2-27, BocAP2-33, BocRAV3) were upregulated and 16 (BocERF6, BocERF18, BocERF44, BocERF51, BocERF53, BocERF54, BocERF58, BocERF68, BocERF74, BocERF88, BocERF97, BocERF100, BocERF103, BocERF105, BocAP2-2, BocAP2-7, BocAP2-22) were downregulated. A total of 12 different conserved motifs were searched by MEME (Figure 6C and Figure 7). Motif 1 was present in all BocAP2/ERF members, while motif 5 and 6 were present in the AP2 subfamily, which could be important elements in distinguishing from other subfamilies. No unique motif were found in the RAV or ERF subfamily (Figure 7). The prediction of the conserved structural domains of the 151 BocAP2/ERF proteins revealed that all BocAP2/ERF proteins had highly conserved structural domains. The distribution of the AP2 domain, B3 domain, PHA02664 superfamily domain and AP2 superfamily domain are showed in Figure 6D.
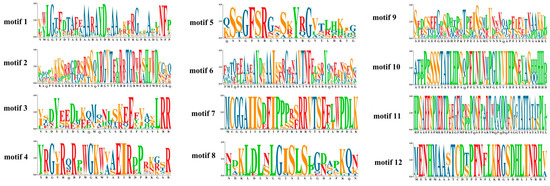
Figure 7.
Twelve differently conserved motifs of BocAP2/ERFs.
The chromosomal localization results showed that 149 AP2/ERF genes were randomly distributed on the chromosome (Chr) of kohlrabi and 2 genes were not localized on the chromosome (Figure 8). Chromosome 3 contained 37 genes, while chromosome 4 contained only 9 genes. Chromosome 1, 3, 5, 7 and 9 contained a substantial number of BocAP2/ERF genes. There was no obvious relationship between chromosome length and the distribution number of BocAP2/ERF genes. This result revealed an irregular distribution of BocAP2/ERF genes on the chromosomes.
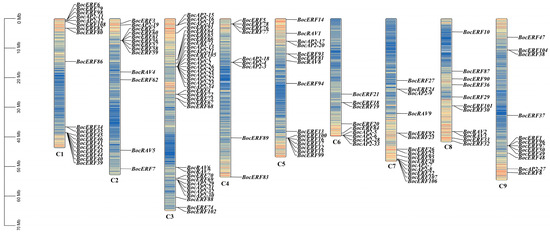
Figure 8.
Chromosomal locations of the BocAP2/ERF genes. The BocAP2/ERF genes were located on 9 chromosomes, representing gene positions by proportion. Note: C1–C9 indicates 9 chromosomes. Scale bar on the left indicates the chromosome lengths (Mb).
2.6. Evolutionary Analysis of BocAP2/ERF Family Genes
The evolutionary relationship of 151 BocAP2/ERF genes from kohlrabi and 136 AtAP2/ERFs from Arabidopsis was constructed and is shown in Figure 9. All the AP2/ERF genes were clustered into 10 groups, named I–X. Among these, the RAV subfamily were distributed into group VI and the AP2 subfamily into group IX and group X. All genes of group II, group III, group IV, group VII and group VIII were obtained from Arabidopsis. One BocERF subfamily gene, 24 BocERF subfamily genes, 24 BocERF subfamily genes and 9 BocRAV subfamily genes, 25 BocERF subfamily genes and 14 BocAP2 subfamily genes, and 34 BocERF subfamily genes and 20 BocAP2 subfamily genes were clustered in group I, group V, group VI, group IX and Group X, separately.
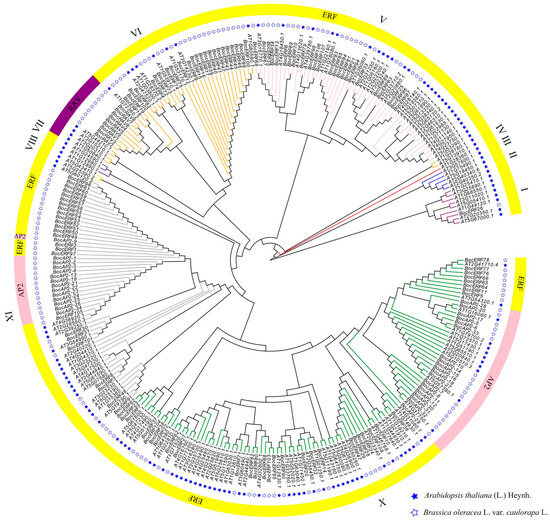
Figure 9.
Evolutionary tree of BocAP2/ERF family genes in kohlrabi and Arabidopsis.
2.7. Expression Analysis of BocAP2/ERFs by RT-qPCR in Different Tissues
The relative expression levels of BocAP2/ERFs in different tissues in kohlrabi were obtained by qRT-PCR (Figure 10). The primers used are listed in Table S8. Ninety-five BocAP2/ERF genes showed relatively lower expression levels in roots. Two BocAP2/ERF genes, BocERF26 and BocERF99, showed higher expression levels in peels. Twelve BocAP2/ERF genes showed relatively higher expression levels in flesh, including BocERF3, BocERF26, BocERF39, BocERF62, BocERF66, BocERF72, BocERF73, BocERF82, BocERF99, BocERF102, BocAP2-12 and BocRAV1. Three BocAP2/ERF genes showed relatively higher expression levels in leaves: BocERF20, BocERF36 and BocERF106. Twelve BocAP2/ERF genes showed relative higherly expression levels in veins: BocERF20, BocERF72, BocERF81, BocERF82, BocERF66, BocERF72, BocERF73, BocERF82, BocERF88, BocERF92, BocERF99 and BocERF106. Ten BocAP2/ERF genes showed relatively higher expression levels in petioles: BocERF20, BocERF26, BocERF62, BocERF82, BocERF88, BocERF99, BocERF102, BocERF106, BocAP2-25 and BocRAV4. The expression of BocAP2/ERF family genes of kohlrabi have obvious specificity in different tissues that might be related to the function of specific organs.
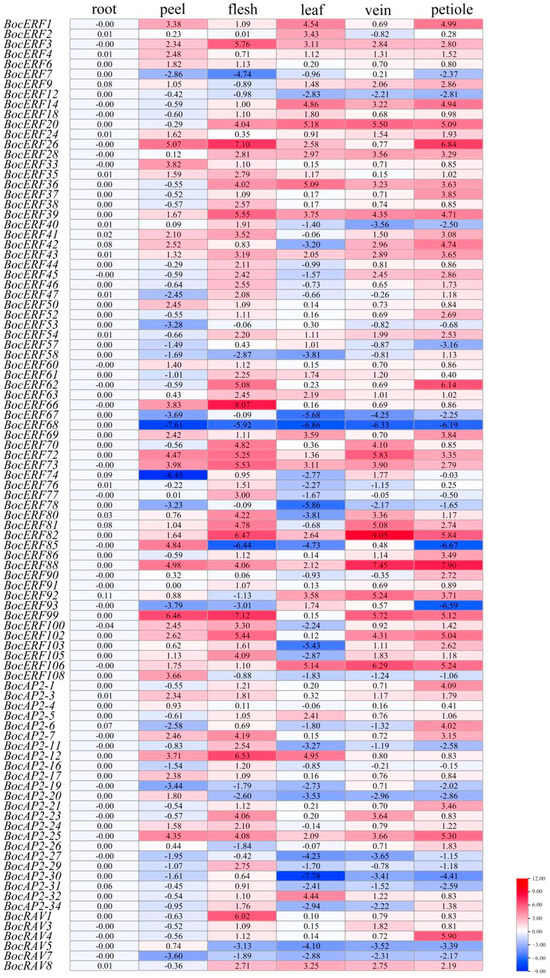
Figure 10.
Reverse-transcription quantitative PCR analysis of ninety-five BocAP2/ERF transcription factors in roots, peels, flesh, leaves, veins, and petioles of kohlrabi. Normalized expression levels of BocAP2/ERF genes in different tissues. Data in the heatmap box are normalized expression levels of three replicates.
3. Discussion
Plant response to stress is a complex process that involves the interaction of different stress-sensitive mechanisms [31]. In order to explore the regulatory mechanism of kohlrabi in response to osmotic stress, we measured the physiological indices associated with osmotic stress in plants, screened the DEGs based on transcriptomes, and subsequently identified and analyzed the AP2/ERF transcription factor family.
Previous studies showed that plants purge water deficit-induced excess ROS by developing a stronger antioxidative defense system using such enzymes as SOD and CAT, thus alleviating the destructive effects of water deficit on the plant [32,33]. Under conditions of water deficit, plants significantly increase their proline content and CAT activity compared with the normal environment, and SOD activity shows an overall upward trend [34]. In this study, the variation trends for proline content, SOD activity and CAT activity measured at different time points were basically consistent with the above results. Plants produce SOD, CAT and proline to regulate gene expression in response to water deficit [35]. Based on weighted gene correlation network analysis, multiple families of transcription factors had high degrees of interaction with proline content, superoxide dismutase activity and catalase activity, mainly including AP2/ERFs, NACs and eight other transcription factor families.
The AP2/ERF transcription factor family is one of the largest transcription factor families in plants, and plays an important role in plant growth and response to stress [10,35,36,37]. Kong et al. [38] proved that overexpression of PtoERF15 contributed to stem water potential maintenance in response to water deficit in Populus tomentosa, thus promoting drought tolerance. Similarly, Li et al. [39] revealed that overexpression of AtruDREB28 increased tolerance to drought stress by enhancing reactive oxygen species-scavenging capability in Acer truncatum. Zhu et al. [40] reported that CqERF24 overexpression in Arabidopis thaliana lines could enhance drought resistance through increased antioxidant enzyme activity and activated related stress genes, while silencing CqERF24 in quinoa decreased drought tolerance and overexpression of CqERF24 in quinoa calli enhanced resistance to mannitol. In this study, we undertook a transcriptome search for AP2/ERF family genes in kohlrabi and identified 151 AP2/ERF transcription factors. The specific expression analysis of BocAP2/ERFs in six different tissues showed that the expression of BocAP2/ERFs was higher in flesh and veins, but lower in roots. PEG-6000 osmotic stress-induced expression analysis of BocAP2/ERF family genes showed that 27 BocAP2/ERFs were induced by osmotic stress, of which 11 genes were upregulated varying degrees and 16 genes were downregulated. In addition, some BocAP2/ERF genes were obviously induced by osmotic stress in leaves, and the expression levels showed a trend of “up–down–up” in general, with high expression characteristics at 48 h under osmotic stress. According to the analysis of BocAP2/ERF expression characteristics, BocAP2/ERF genes are involved in plant response to abiotic stress, which may depend on the response site and the time and severity of the stress. Some BocAP2/ERF transcription factors showed tissue-specific expression, and many other candidate genes in the BocAP2/ERF family may also be involved in stress response and plant development.
4. Materials and Methods
4.1. Plant Materials and Sample Collection
The kohlrabi cultivated variety C8, provided by the Brassica vegetable crop breeding team at the Academy of Agriculture and Forestry Sciences of Qinghai University, was planted in a light incubator (Thermo Fisher Scientific, Waltham, MA, USA) under 12 h light/12 dark at 25 ± 1 °C, 65% relative humidity, and 120 mmol m−2 s−1 light intensity. After 40 days, growing seedlings were watered to saturation, and 24 h later, the control seedlings leaf samples (0 h) were collected and all seedlings were irrigated with 25% PEG-6000. Then, the osmotic stress leaf samples were collected at 12, 24 and 48 h later with three biological replicates for each treatment and each biological replicate containing seven individual plants. The collected leaves were immediately frozen and stored at −80 °C.
4.2. CAT and SOD Antioxidant Enzyme Activity and Proline Content Measurement
CAT activity, SOD activity and proline content were measured using a CAT activity detection kit (BC0205), a superoxide dismutase activity detection kit (BC0175) and proline content detection kit (BC0295), respectively. All detection kits were purchased from Beijing Solarbio Science and Technology Co., Ltd. (Beijing, China). The specific operation processes of the three indicators were followed according to the instructions of the kit.
4.3. RNA-Sequencing Data Assembly and Gene Annotation
Processes from total RNA extraction to gene annotation were conducted by Wuhan Metware Biotechnology Co. Ltd. (Wuhan, China) following the methods described by Lu et al. [41]. Based on the Trinity software 2.1.1, the short reads were assembled [42] and the assembled sequences were used as the reference. The unigene sequence was annotated using the BLAST searcher on KEGG, NR, Swiss-Prot, GO, KOGs, Trembl, and Pfam databases separately. The similarity between the transcript sequences of the species and similar species were compared by Nr database. The dataset can be searched from the NCBI Short Read Archive (SRA) under accession number PRJNA1051351, which contains 12 RNA-seq data from 12 libraries: SRR27183516, SRR27183515, SRR27183514, SRR27183507, SRR27183506, SRR27183505, SRR27183513, SRR27183512, SRR27183511, SRR27183510, SRR27183509 and SRR27183508.
4.4. Analysis and Screening of Differentially Expressed Genes under Osmotic Stress
To be able to accurately analyze the levels of differential expression in genes, clean reads of each sample were derived and mapped onto the reference by bowtie2 in RSEM software [43]. The number of mapped reads and transcript lengths were normalized using FPKM (fragments per kilobase of transcript per million fragments mapped). In the process of screening DEGs, we performed differential analyses between sample groups using the DESeq2 package [44]. To obtain the false-discovery rate (FDR), we performed strict hypothesis-testing correction for the hypothesis probability (p-value). The requirements for differential gene screening were |log2Folge| ≥ 1, with FDR < 0.05.
4.5. Validation of DEGs
To confirm the accuracy of the RNA-seq data of kohlrabi seedlings under PEG-6000 osmotic stress, eight DEGs were casually screened for RT-qPCR experiments. Three biological and three technical replicates were tested.
4.6. Weighted Gene Co-Expression Network Analysis
The co-expression network among FPKM values of DEGs and physicochemical parameters was generated using the weighted gene co-expression network analysis in R package 3.16.5 [45] based on Pearson’s correlation coefficient. The requirements for co-expression gene screening were |r| > 0.8, with p < 0.05. Cytoscape v3.8.0 [46] was used to visualize the co-expression network.
4.7. Identification of BocAP2/ERF Transcription Factor Family Members in Kohlrabi
According to the transcriptome unigene annotation file, AP2 and ERF as keywords were filtered in the KEGG, NR and Swiss-Prot annotation files, respectively. The CDS sequences searched were submitted to NCBI for online BLAST analysis, cluster and homologous sequences analyzed were aligned using DNAMAN 9.0 software, and the false-positive sequences were eliminated. Full-length CDS sequences of 151 BocAP2/ERF sequences were found. The predicted physicochemical parameters of BocAP2/ERF proteins were predicted with ProtParam. Motif prediction analysis was performed using the website tool MEME [47]. Tbtools software V1.098 [48] was used to visualize the conserved motifs and domains.
4.8. Phylogenetic Analysis and Chromosomal Distribution of BocAP2/ERF Transcription Factor Family
The AP2/ERF amino acid sequences of A. thaliana were downloaded from the Arabidopsis Information Resource (https://www.arabidopsis.org, accessed on 23 December 2023) database. The 287 amino acid sequences were aligned in MEGA 11 for the construction of the phylogenetic tree and 1000 bootstrap replicates [49,50]. The ultimate phylogenetic trees were visualized and beautified using Evolview 3.0 (www.evolgenius.info, accessed on 23 December 2023). The chromosomal localization information of the BocAP2/ERF genes in kohlrabi was retrieved from the Brassica oleracea genome database, and then analyzed using TBtools software V1.098 [48].
4.9. cDNA Synthesis and Expression Analysis by Quantitative Real-Time PCR
CDNA synthesis, final cDNA concentration adjustment, and RT-qPCR were performed following the manufacturer’s instructions as per Ren et al. [51]. The TIP4 gene was used as an internal control. RT-qPCR specific primers were designed with Primer Premier 5 software. The relative expression levels of genes were measured using the 2−ΔΔCt method [52]. The relative expression was analyzed using Excel 97-2003 and plotted heatmaps using TBtools software [48].
5. Conclusions
In this study, 282 DEGs were analyzed and screened under osmotic stress in kohlrabi by RNA-seq data. The AP2/ERF transcription factor family, NAC transcription factor family and eight other transcription factor families were identified, with high degrees of interaction with CAT and SOD antioxidant enzyme activity and proline content. Subsequently, 151 AP2/ERF genes were identified and analyzed. Twelve conserved motifs were searched and all AP2/ERF genes were clustered into four groups. A total of 149 AP2/ERF genes were randomly distributed on the chromosome, and relative expression level analysis showed that BocAP2/ERF genes of kohlrabi have obvious specificity in different tissues. According to the analysis of BocAP2/ERF expression characteristics, BocAP2/ERF genes are involved in plant response to abiotic stress, which may depend on the response site and the time and severity of the stress. This study lays a foundation for explaining the osmotic stress resistance mechanism of kohlrabi and provides a theoretical basis for functional analysis of BocAP2/ERF transcription factor family members.
Supplementary Materials
The following supporting information can be downloaded at https://www.mdpi.com/article/10.3390/plants13081167/s1. Table S1: Summary of kohlrabi seedling RNA-sequencing data under polyethylene glycol 6000 osmotic stress in this study. Table S2: All differentially expressed unigenes were identified in the pairwise comparison of 0 h vs. 12 h, 0 h vs. 24 h, 0 h vs. 48 h, 12 h vs. 24 h, 12 h vs. 48 h and 24 h vs. 48 h. Table S3: A total of 1541 common differentially expressed unigenes were identified in the pairwise comparison of treatment groups and control (0 h vs. 12 h, 0 h vs. 24 h and 0 h vs. 48 h). Table S4: Overall 684 common differentially expressed unigenes were identified in the pairwise comparison of 0 h vs. 12 h, 12 h vs. 24 h and 24 h vs. 48 h. Table S5: There were 2383 unigenes in subclass 7 with a downward trend and 2583 unigenes in subclass 8 with a upward trend. Table S6: Primers used for validation of the transcriptomic data by the qRT-PCR experiment. Table S7: Physicochemical property analysis of 151 BocAP2/ERFs in kohlrabi. Table S8: Primers used for the relative expression levels of BocAP2/ERFs in different tissues in kohlrabi. Figure S1: Transcriptome annotation of all unigenes in kohlrabi seedlings under PEG6000 osmotic stress. (a) Distribution of transcript and unigene sequence lengths. (b) Top BLAST hit species based on unigene annotation of kohlrabi leaves. Seven top hit species were identified.
Author Contributions
Methodology, software, validation, data curation, formal analysis, investigation, and writing—original draft preparation, S.B.; methodology, writing—original draft preparation, and supervision, M.Z.; data curation, validation, and formal analysis, H.Z.; conceptualization, resources, writing—original draft preparation, writing—review and editing, and supervision, Y.R. All authors have read and agreed to the published version of the manuscript.
Funding
This research was funded by the Open Project of State Key Laboratory of Plateau Ecology and Agriculture, Qinghai University (2021-ZZ-07), the Qinghai Province High-End Innovative Talents Plan project (K9923197), and the Qinghai University Youth Fund Project (2021-QNY-2).
Data Availability Statement
The dataset is available from the NCBI Short Read Archive (SRA) under accession number PRJNA1051351.
Acknowledgments
The authors would like to thank Wuhan Metware Biotechnology Co., Ltd. for transcript sequencing.
Conflicts of Interest
The authors declare no conflicts of interest.
References
- Marcinkowska, M.; Frank, S.; Steinhaus, M.; Jeleń, H.H. Key Odorants of Raw and Cooked Green Kohlrabi (Brassica oleracea var. gongylodes L.). J. Agric. Food Chem. 2021, 69, 12270–12277. [Google Scholar] [CrossRef] [PubMed]
- Lim, T. Brassica oleracea (gongylodes group). In Edible Medicinal and Non Medicinal Plants; Springer: Dordrecht, The Netherlands, 2015; pp. 768–776. [Google Scholar]
- Prajapati, R.; Seong, S.-H.; Kim, H.-R.; Jung, H.-A.; Choi, J.-S. Isolation and Identification of Bioactive Compounds from the Tuber of Brassica oleracea var. gongylodes. Nat. Prod. Sci. 2020, 26, 214–220. [Google Scholar] [CrossRef]
- Golob, A.; Novak, T.; Maršić, N.K.; Šircelj, H.; Stibilj, V.; Jerše, A.; Kroflič, A.; Germ, M. Biofortification with selenium and iodine changes morphological properties of Brassica oleracea L. var. gongylodes) and increases their contents in tubers. Plant Physiol. Biochem. PPB 2020, 150, 234–243. [Google Scholar] [CrossRef] [PubMed]
- Cosic, T.; Savic, J.; Raspor, M.; Cingel, A.; Ghalawnji, N.; Vinterhalter, B.; Ninkovic, S. Effects of different types of sugars and plant growth regulators on kohlrabi seedling growth and development in vitro. Arch. Biol. Sci. 2020, 72, 349–357. [Google Scholar] [CrossRef]
- Vue, M.; Rydberg, M.; Talaga, M.L. Purification of a Plant Lectin from Kohlrabi/Brassica oleracea var. gongylodes and Identification of Binding Specificity. FASEB J. 2020, 34, 1. [Google Scholar] [CrossRef]
- Oguz, M.C.; Aycan, M.; Oguz, E.; Poyraz, I.; Yildiz, M. Drought Stress Tolerance in Plants: Interplay of Molecular, Biochemical and Physiological Responses in Important Development Stages. Physiologia 2022, 2, 180–197. [Google Scholar] [CrossRef]
- Godfray, H.C.J.; Beddington, J.R.; Crute, I.R.; Haddad, L.; Lawrence, D.; Muir, J.F.; Pretty, J.; Robinson, S.; Thomas, S.M.; Toulmin, C. Food security: The challenge of feeding 9 billion people. Science 2010, 327, 812–818. [Google Scholar] [CrossRef] [PubMed]
- Wang, X.; Chen, S.; Shi, X.; Liu, D.; Zhao, P.; Lu, Y.; Cheng, Y.; Liu, Z.; Nie, X.; Song, W.; et al. Hybrid sequencing reveals insight into heat sensing and signaling of bread wheat. Plant J. 2019, 98, 1015–1032. [Google Scholar] [CrossRef] [PubMed]
- Zhao, M.; Ren, Y.; Li, Z. Transcriptome profiling of Jerusalem artichoke seedlings (Helianthus tuberosus L.) under polyethylene glycol-simulated drought stress. Ind. Crops Prod. 2021, 170, 113696. [Google Scholar] [CrossRef]
- Moschen, S.; Di Rienzo, J.A.; Higgins, J.; Tohge, T.; Watanabe, M.; González, S.; Rivarola, M.; García-García, F.; Dopazo, J.; Hopp, H.E.; et al. Integration of transcriptomic and metabolic data reveals hub transcription factors involved in drought stress response in sunflower (Helianthus annuus L.). Plant Mol. Biol. 2017, 94, 549–564. [Google Scholar] [CrossRef]
- Tardieu, F.; Tuberosa, R. Dissection and modelling of abiotic stress tolerance in plants. Curr. Opin. Plant Biol. 2010, 13, 206–212. [Google Scholar] [CrossRef]
- Huang, B.-L.; Li, X.; Liu, P.; Ma, L.; Wu, W.; Zhang, X.; Li, Z.; Huang, B. Transcriptomic analysis of Eruca vesicaria subs. sativa lines with contrasting tolerance to polyethylene glycol-simulated drought stress. BMC Plant Biol. 2019, 19, 419. [Google Scholar] [CrossRef]
- Tang, X.; Sun, F.; Zhang, N.; Rana, B.B.; Kharel, R.; Luo, P.; Si, H. RNA-seq provides insights into potato deubiquitinase responses to drought stress in seedling stage. Front. Plant Sci. 2023, 14, 1268448. [Google Scholar] [CrossRef] [PubMed]
- Karanja, B.K.; Xu, L.; Wang, Y.; Tang, M.; Muleke, E.M.; Dong, J.; Liu, L. Genome-widecharacterization of the AP2/ERF gene family in radish (Raphanus sativus L.): Unveilingevolution and patterns in response to abiotic stresses. Gene 2019, 718, 144048. [Google Scholar] [CrossRef]
- Gökçe, Z.N.; Gökçe, A.F.; Junaid, M.D.; Chaudhry, U.K. Comparative transcriptomics of drought stress response of taproot meristem region of contrasting purple carrot breeding lines supported by physio-biochemical parameters. Funct. Integr. Genom. 2022, 22, 697–710. [Google Scholar] [CrossRef] [PubMed]
- Charfeddine, M.; Chiab, N.; Charfeddine, S.; Ferjani, A.; Gargouri-Bouzid, R. Heat, drought, and combined stress efect on transgenic potato plants overexpressing the StERF94 transcription factor. J. Plant Res. 2023, 136, 549–562. [Google Scholar] [CrossRef] [PubMed]
- Okamuro, J.K.; Caster, B.; Villarroel, R.; Van Montagu, M.; Jofuku, K.D. The AP2 domain of APETALA2 defines a large new family of DNA binding proteins in Arabidopsis. Proc. Natl. Acad. Sci. USA 1997, 94, 7076–7081. [Google Scholar] [CrossRef]
- Girardi, C.L.; Rombaldi, C.V.; Cero, J.D.; Nobile, P.M.; Laurens, F.; Bouzayen, M.; Quecini, V. Genome-wide analysis of the AP2/ERF superfamily in apple and transcriptional evidence of ERF involvement in scab pathogenesis. Sci. Hortic. 2013, 151, 112–121. [Google Scholar] [CrossRef]
- Riechmann, J.L.; Heard, J.; Martin, G.; Reuber, L.; Jiang, C.; Keddie, J.; Adam, L.; Pineda, O.; Ratcliffe, O.J.; Samaha, R.R.; et al. Arabidopsis transcription factors: Genome-wide comparative analysis among eukaryotes. Science 2000, 290, 2105–2110. [Google Scholar] [CrossRef]
- Li, X.; Tao, S.; Wei, S.; Ming, M.; Huang, X.; Zhang, S.; Wu, J. The mining and evolutionary investigation of AP2/ERF genes in pear (Pyrus). BMC Plant Biol. 2018, 18, 46. [Google Scholar] [CrossRef]
- Xie, X.-L.; Shen, S.-L.; Yin, X.-R.; Xu, Q.; Sun, C.-D.; Grierson, D.; Ferguson, I.; Chen, K.-S. Isolation, classifcation and transcription profles of the AP2/ERF transcription factor superfamily in citrus. Mol. Biol. Rep. 2014, 41, 4261–4271. [Google Scholar] [CrossRef]
- Mizuno, S.; Hirasawa, Y.; Sonoda, M.; Nakagawa, H.; Sato, T. Isolation and characterization of three DREB/ERF-type transcription factors from melon (Cucumis melo). Plant Sci. 2006, 170, 1156–1163. [Google Scholar] [CrossRef]
- Guo, Z.; He, L.; Sun, X.; Li, C.; Su, J.; Zhou, H.; Liu, X. Genome-Wide Analysis of the Rhododendron AP2/ERF Gene Family: Identification and Expression Profiles in Response to Cold, Salt and Drought Stress. Plants 2023, 12, 994. [Google Scholar] [CrossRef]
- Wang, Y.; Du, X.; Liu, M.; Liu, X.; Zhao, L.; Cao, L.; Zhang, S.; Song, L.; Sun, Y.; Liu, D.; et al. Genome-Wide Analysis of the AP2/ERF Family in Oily Persimmon (Diospyros oleifera) and Their Preliminary Roles Exploration in Response to Polyamines for Adventitious Root Formation in Cultivated Persimmon (D. kaki). Horticulturae 2023, 9, 191. [Google Scholar] [CrossRef]
- Cheng, C.; An, L.; Li, F.; Ahmad, W.; Aslam, M.; Haq, M.Z.U.; Yan, Y.; Ahmad, R.M. Wide-Range Portrayal of AP2/ERF Transcription Factor Family in Maize (Zea mays L.) Development and Stress Responses. Genes 2023, 14, 194. [Google Scholar] [CrossRef]
- Xu, Y.; Li, X.; Yang, X.; Wassie, M.; Shi, H. Genome-wide identification and molecular characterization of the AP2/ERF superfamily members in sand pear (Pyrus pyrifolia). BMC Genom. 2023, 24, 32. [Google Scholar] [CrossRef]
- Chen, Y.; Yang, H.; Tang, B.; Li, F.; Xie, Q.; Chen, G.; Hu, Z. The AP2/ERF transcription factor SlERF.J2 functions in hypocotyl elongation and plant height in tomato. Plant Cell Rep. 2022, 42, 371–383. [Google Scholar] [CrossRef] [PubMed]
- Zhao, M.; Li, Y.; Zhang, X.; You, X.; Yu, H.; Guo, R.; Zhao, X. Genome-Wide Identification of AP2/ERF Superfamily Genes in Juglans mandshurica and Expression Analysis under Cold Stress. Int. J. Mol. Sci. 2022, 23, 15225. [Google Scholar] [CrossRef]
- Qiu, X.; Zhao, H.; Abubakar, A.S.; Shao, D.; Chen, J.; Chen, P.; Yu, C.; Wang, X.; Chen, K.; Zhu, A. Genome-Wide Analysis of AP2/ERF Gene Superfamily in Ramie (Boehmeria nivea L.) Revealed Their Synergistic Roles in Regulating Abiotic Stress Resistance and Ramet Development. Int. J. Mol. Sci. 2022, 23, 15117. [Google Scholar] [CrossRef]
- Ahmad, A.; Selim, M.M.; Alderfasi, A.A.; Afzal, M. Effect of Drought Stress on Mungbean (Vigna radiata L.) under Arid Climatic Conditions of Saudi Arabia. In Ecosystems and Sustainable Development X; WIT Press: Southampton, UK, 2015; pp. 185–193. ISBN 978-1-84564-900-5. [Google Scholar]
- Santanu, S.; Shekhar, C.S.; Aryadeep, R. The molecular paradigm of reactive oxygen species (ROS) and reactive nitrogen species (RNS) with different phytohormone signaling pathways during drought stress in plants. Plant Physiol. Biochem. 2024, 206, 108259. [Google Scholar] [CrossRef]
- Ghani, M.I.; Saleem, S.; Rather, S.A.; Rehmani, M.S.; Alamri, S.; Rajput, V.D.; Kalaji, H.M.; Saleem, N.; Sial, T.A.; Liu, M. Foliar application of zinc oxide nanoparticles: An effective strategy to mitigate drought stress in cucumber seedling by modulating antioxidant defense system and osmolytes accumulation. Chemosphere 2022, 289, 133202. [Google Scholar] [CrossRef] [PubMed]
- Li, A.; Lv, D.; Zhang, Y.; Zhang, D.; Zong, Y.; Shi, X.; Li, P.; Hao, X. Elevated CO2 concentration enhances drought resistance of soybean by regulating cell structure, cuticular wax synthesis, photosynthesis, and oxidative stress response. Plant Physiol. Biochem. 2024, 206, 108266. [Google Scholar] [CrossRef] [PubMed]
- Guan, L.M.; Zhao, J.; Scandalios, J.G. Cis-Elements and Trans-Factors That Regulate Expression of the Maize Cat1 Antioxidant Gene in Response to ABA and Osmotic Stress: H2O2 Is the Likely Intermediary Signaling Molecule for the Response. Plant J. 2000, 22, 87–95. [Google Scholar] [CrossRef] [PubMed]
- Feng, K.; Hou, X.; Xing, G.; Liu, J.; Duan, A.; Xu, Z.; Li, M.; Zhuang, J.; Xiong, A. Advances in AP2/ERF super-family transcription factors in plant. Crit. Rev. Biotechnol. 2020, 40, 750–776. [Google Scholar] [CrossRef] [PubMed]
- Thirugnanasambantham, K.; Durairaj, S.; Saravanan, S.; Karikalan, K.; Muralidaran, S.; Islam, V.I.H. Role of Ethylene Response Transcription Factor (ERF) and Its Regulation in Response to Stress Encountered by Plants. Plant Mol. Biol. Rep. 2015, 33, 347–357. [Google Scholar] [CrossRef]
- Kong, L.; Song, Q.; Wei, H.; Wang, Y.; Lin, M.; Sun, K.; Zhang, Y.; Yang, J.; Li, C.; Luo, K. The AP2/ERF transcription factor PtoERF15 confers drought tolerance via JA-mediated signaling in Populus. New Phytol. 2023, 240, 1848–1867. [Google Scholar] [CrossRef] [PubMed]
- Li, J.; Guo, W.; Meng, H.; Zhao, J.; Zheng, G.; Yuan, W. Comprehensive analysis of AP2/ERF gene members in Acer truncatum B. and the positive regulator role of AtruDREB28 in drought tolerance. Ind. Crops Prod. 2023, 116837. [Google Scholar] [CrossRef]
- Zhu, X.; Wang, B.; Liu, W.; Wei, X.; Wang, X.; Du, X.; Liu, H. Genome-wide analysis of AP2/ERF gene and functional analysis of CqERF24 gene in drought stress in quinoa. Int. J. Biol. Macromol. 2023, 253, 127582. [Google Scholar] [CrossRef]
- Lu, X.; Li, J.; Chen, H.; Hu, J.; Liu, P.; Zhou, B. RNA-seq analysis of apical meristem reveals integrative regulatory network of ROS and chilling potentially related to flowering in Litchi chinensis. Sci. Rep. 2017, 7, 10183. [Google Scholar] [CrossRef]
- Grabherr, M.G.; Haas, B.J.; Yassour, M.; Levin, J.Z.; Thompson, D.A.; Amit, I.; Adiconis, X.; Fan, L.; Raychowdhury, R.; Zeng, Q.D.; et al. Full-length transcriptome assembly from RNA-Seq data without a reference genome. Nat. Biotechnol. 2011, 29, 644–652. [Google Scholar] [CrossRef]
- Li, B.; Dewey, C.N. RSEM: Accurate transcript quantification from RNA-Seq data with or without a reference genome. BMC Bioinform. 2011, 12, 323–338. [Google Scholar] [CrossRef] [PubMed]
- Love, M.I.; Wolfgang, H.; Simon, A. Moderated estimation of fold change and dispersion for RNA-Seq data with DESeq2. Genome Biol. 2014, 15, 550. [Google Scholar] [CrossRef] [PubMed]
- Lucas, A. Amap: Another Multidimensional Analysis Package. 2022. Available online: https://CRAN.R-project.org/package=amap (accessed on 23 December 2023).
- Shannon, P.; Markiel, A.; Ozier, O.; Baliga, N.S.; Wang, J.T.; Ramage, D.; Amin, N.; Schwikowski, B.; Ideker, T. Cytoscape: A software environment for integrated models of biomolecular interaction networks. Genome Res. 2003, 13, 2498–2504. [Google Scholar] [CrossRef]
- Bailey, T.L.; Boden, M.; Buske, F.A.; Frith, M.; Grant, C.E.; Clementi, L.; Ren, J.; Li, W.W.; Noble, W.S. MEME SUITE: Tools for motif discovery and searching. Nucleic Acids Res. 2009, 37, W202–W208. [Google Scholar] [CrossRef]
- Chen, C.J.; Chen, H.; Zhang, Y.; Thomas, H.R.; Frank, M.H.; He, Y.H.; Xia, R. TBtools: An integrative toolkit developed for interactive analyses of big biological data. Mol. Plant 2020, 13, 1194–1202. [Google Scholar] [CrossRef]
- Edgar, R.C. MUSCLE: Multiple sequence alignment with high accuracy and high throughput. Nucleic Acids Res. 2004, 32, 1792–1797. [Google Scholar] [CrossRef] [PubMed]
- Kumar, S.; Stecher, G.; Tamura, K. MEGA7: Molecular Evolutionary Genetics Analysis Version 7.0 for Bigger Datasets. Mol. Biol. Evol. 2016, 33, 1870–1874. [Google Scholar] [CrossRef]
- Ren, Y.J.; He, Q.; Ma, X.M.; Zhang, L.G. Characteristics of color development in seeds of brown and yellow-seeded heading Chinese cabbage and molecular analysis of Brsc the candidate gene controlling seed coat color. Front. Plant Sci. 2017, 8, 1410. [Google Scholar] [CrossRef]
- Livak, K.J.; Schmittgen, T.D. Analysis of relative gene expression data using real-time quantitative PCR and the 2−ΔΔCT method. Methods 2001, 25, 402–408. [Google Scholar] [CrossRef]
Disclaimer/Publisher’s Note: The statements, opinions and data contained in all publications are solely those of the individual author(s) and contributor(s) and not of MDPI and/or the editor(s). MDPI and/or the editor(s) disclaim responsibility for any injury to people or property resulting from any ideas, methods, instructions or products referred to in the content. |
© 2024 by the authors. Licensee MDPI, Basel, Switzerland. This article is an open access article distributed under the terms and conditions of the Creative Commons Attribution (CC BY) license (https://creativecommons.org/licenses/by/4.0/).