1. Introduction
The temperatures at which crop leaves accomplish photosynthesis vary diurnally, seasonally, and with geographic location. Intraspecific variation in the response and acclimation of photosynthesis to temperature has been studied extensively since the first infra-red CO
2 analyzers came into use in plant physiology [
1,
2]. Photosynthetic response and acclimation to temperature has often been studied in crop species, such as barley, broad bean, soybean, sunflower, tomato, and turnip [
3]. Intraspecific variation in responses to brief, extreme temperature events has also been documented in maize, soybean, tomato and wheat [
4,
5,
6,
7]. However, studies of intraspecific variation in photosynthetic response or acclimation to temperature in crops are rare. Intraspecific variation in response or acclimation of photosynthesis to temperature could prove a useful avenue for crop improvement or for the matching of plant physiological characteristics with climate. That strategy may avoid the inverse relationship between leaf size and photosynthetic rate commonly found in studies of intraspecific variation in photosynthesis in crops, which limits the usefulness of photosynthetic rate itself as a selection criterion [
8].
Photosynthesis of C
3 species measured at high light and at the current atmospheric CO
2 concentration has an optimum temperature which may vary with species, and sometimes with growth temperature [
9,
10,
11]. Growth at different temperatures may also affect the maximum photosynthetic rates without changing the shape of the temperature response curves or the optimal temperature [
3,
10,
11]. Several recent studies have found considerable variation in the kinetic properties of Rubisco which affected the response of photosynthesis to temperature [
10,
12,
13,
14,
15,
16], but none of these studies compared cultivars of soybean.
Soybean (Glycine max L. Merr.), while of sub-tropical origin, is grown in North America from southern Canada to the gulf coast states of the southern United States of America. Mean monthly temperatures during soybean growing seasons range from about 15 °C in the north to about 27 °C in the south, while midday mean temperatures during the growing seasons range from a low of about 20 °C in the early season in the north to about 32 °C in mid-season in the southern part of this range. Thus, soybeans grown in North America are subject to a wide range of both growth and midday temperatures, even without considering extreme temperature events.
This study examined photosynthetic responses to temperature in three cultivars of soybean when grown at three growth temperatures in order to determine whether significant variation in response exists within soybeans, and to identify which kinetic parameters may be involved in any such variation. The hypothesis was that there would be insignificant variation in photosynthetic response to moderate temperatures among these soybean cultivars.
2. Results
The net rate of CO
2 assimilation (A) measured at 400 μmol mol
−1 CO
2 was highest at temperatures which ranged from 15 to 30 °C, depending upon the cultivar and the growth temperature (
Figure 1). The 20 °C growth temperature produced leaves with the highest A, for measurement temperatures of 25 and 30 °C, for all three cultivars. The shape of the response of A to measurement temperature was least affected by growth temperature in Fiskeby V, and most affected in Spencer (
Figure 1). Only Spencer had highest A at 15 °C when grown at 15 °C. For the other two cultivars, highest A at 15 °C occurred in leaves grown at 20 °C.
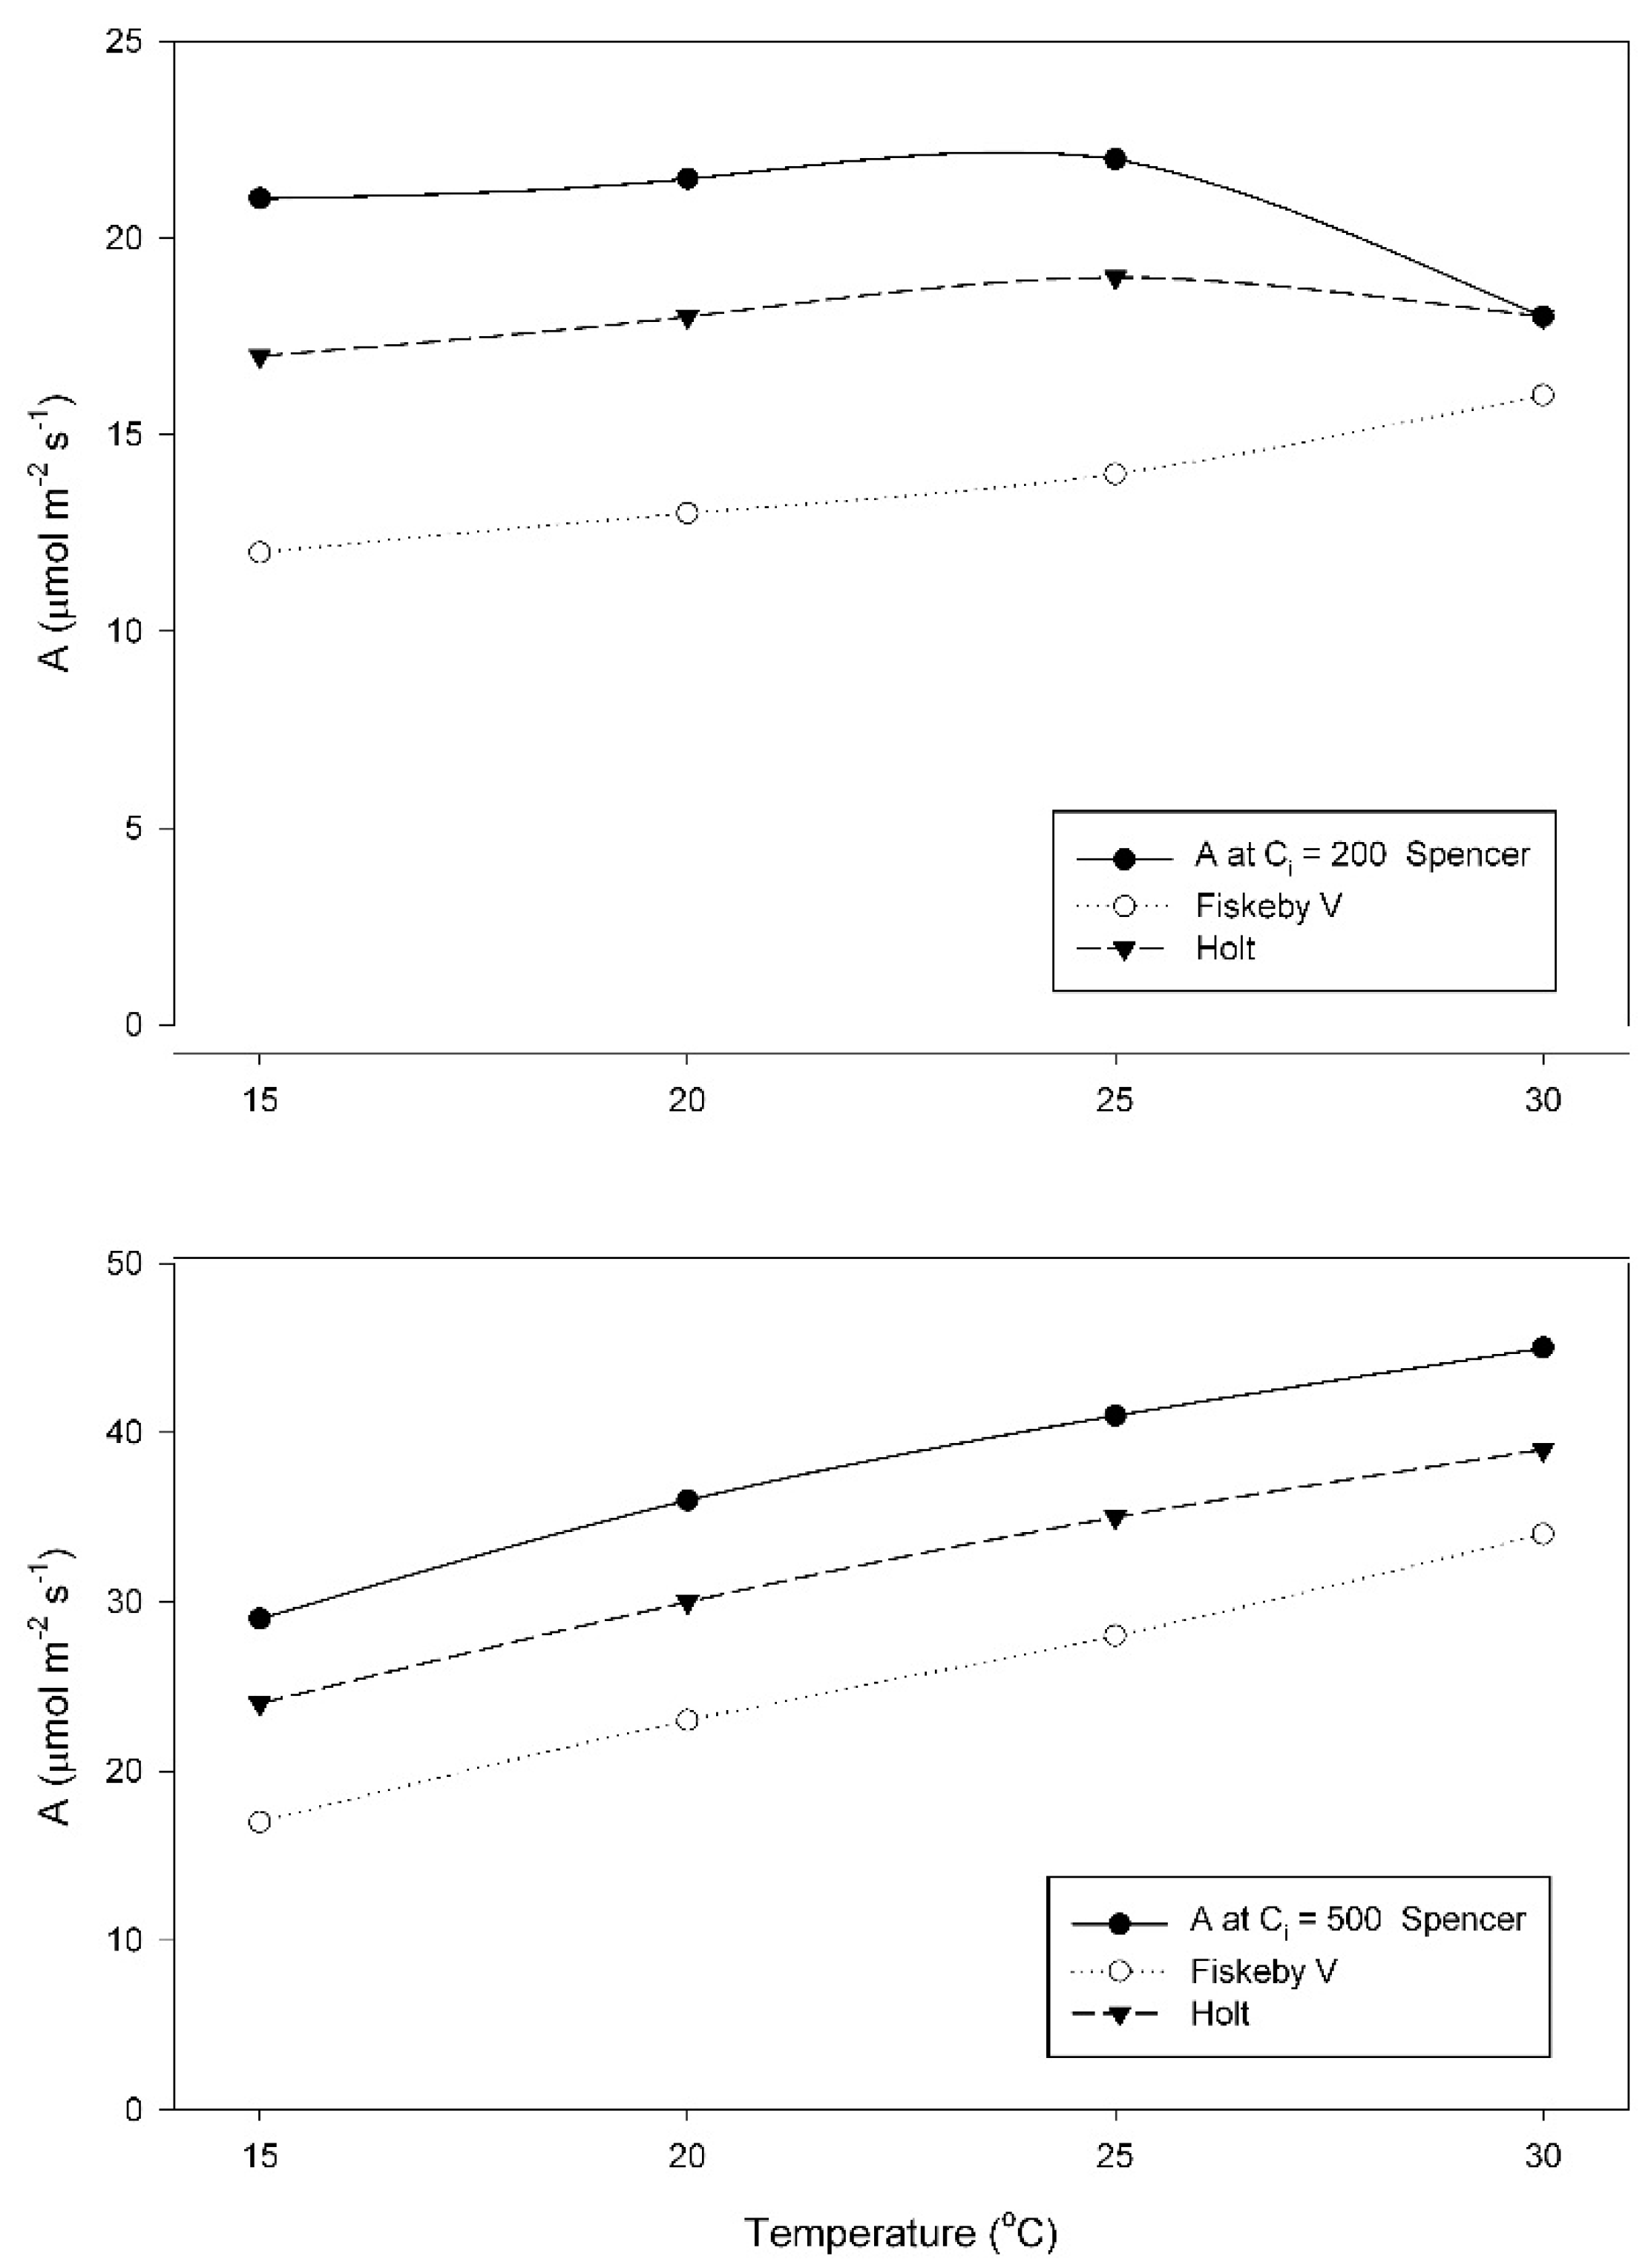
When grown at 15 °C, A at a sub-stomatal CO
2 concentration (C
i) of 200 μmol mol
−1, increased between 25 and 30 °C in Fiskeby V, and decreased between 25 and 30 °C in the other two cultivars (
Figure 2). Two-way ANOVA indicated significant effects of cultivar, temperature and their interaction (
Table A1). In contrast, values of A obtained at a measurement C
i of 500 μmol mol
−1 increased from 15 to 30 °C in all three cultivars (
Figure 2). Effects of cultivar and temperature were significant, but the interaction term was not significant (
Table A2). For all measurement CO
2 conditions, A was highest in Spencer and lowest in Fiskeby V at all temperatures, with Holt intermediate.
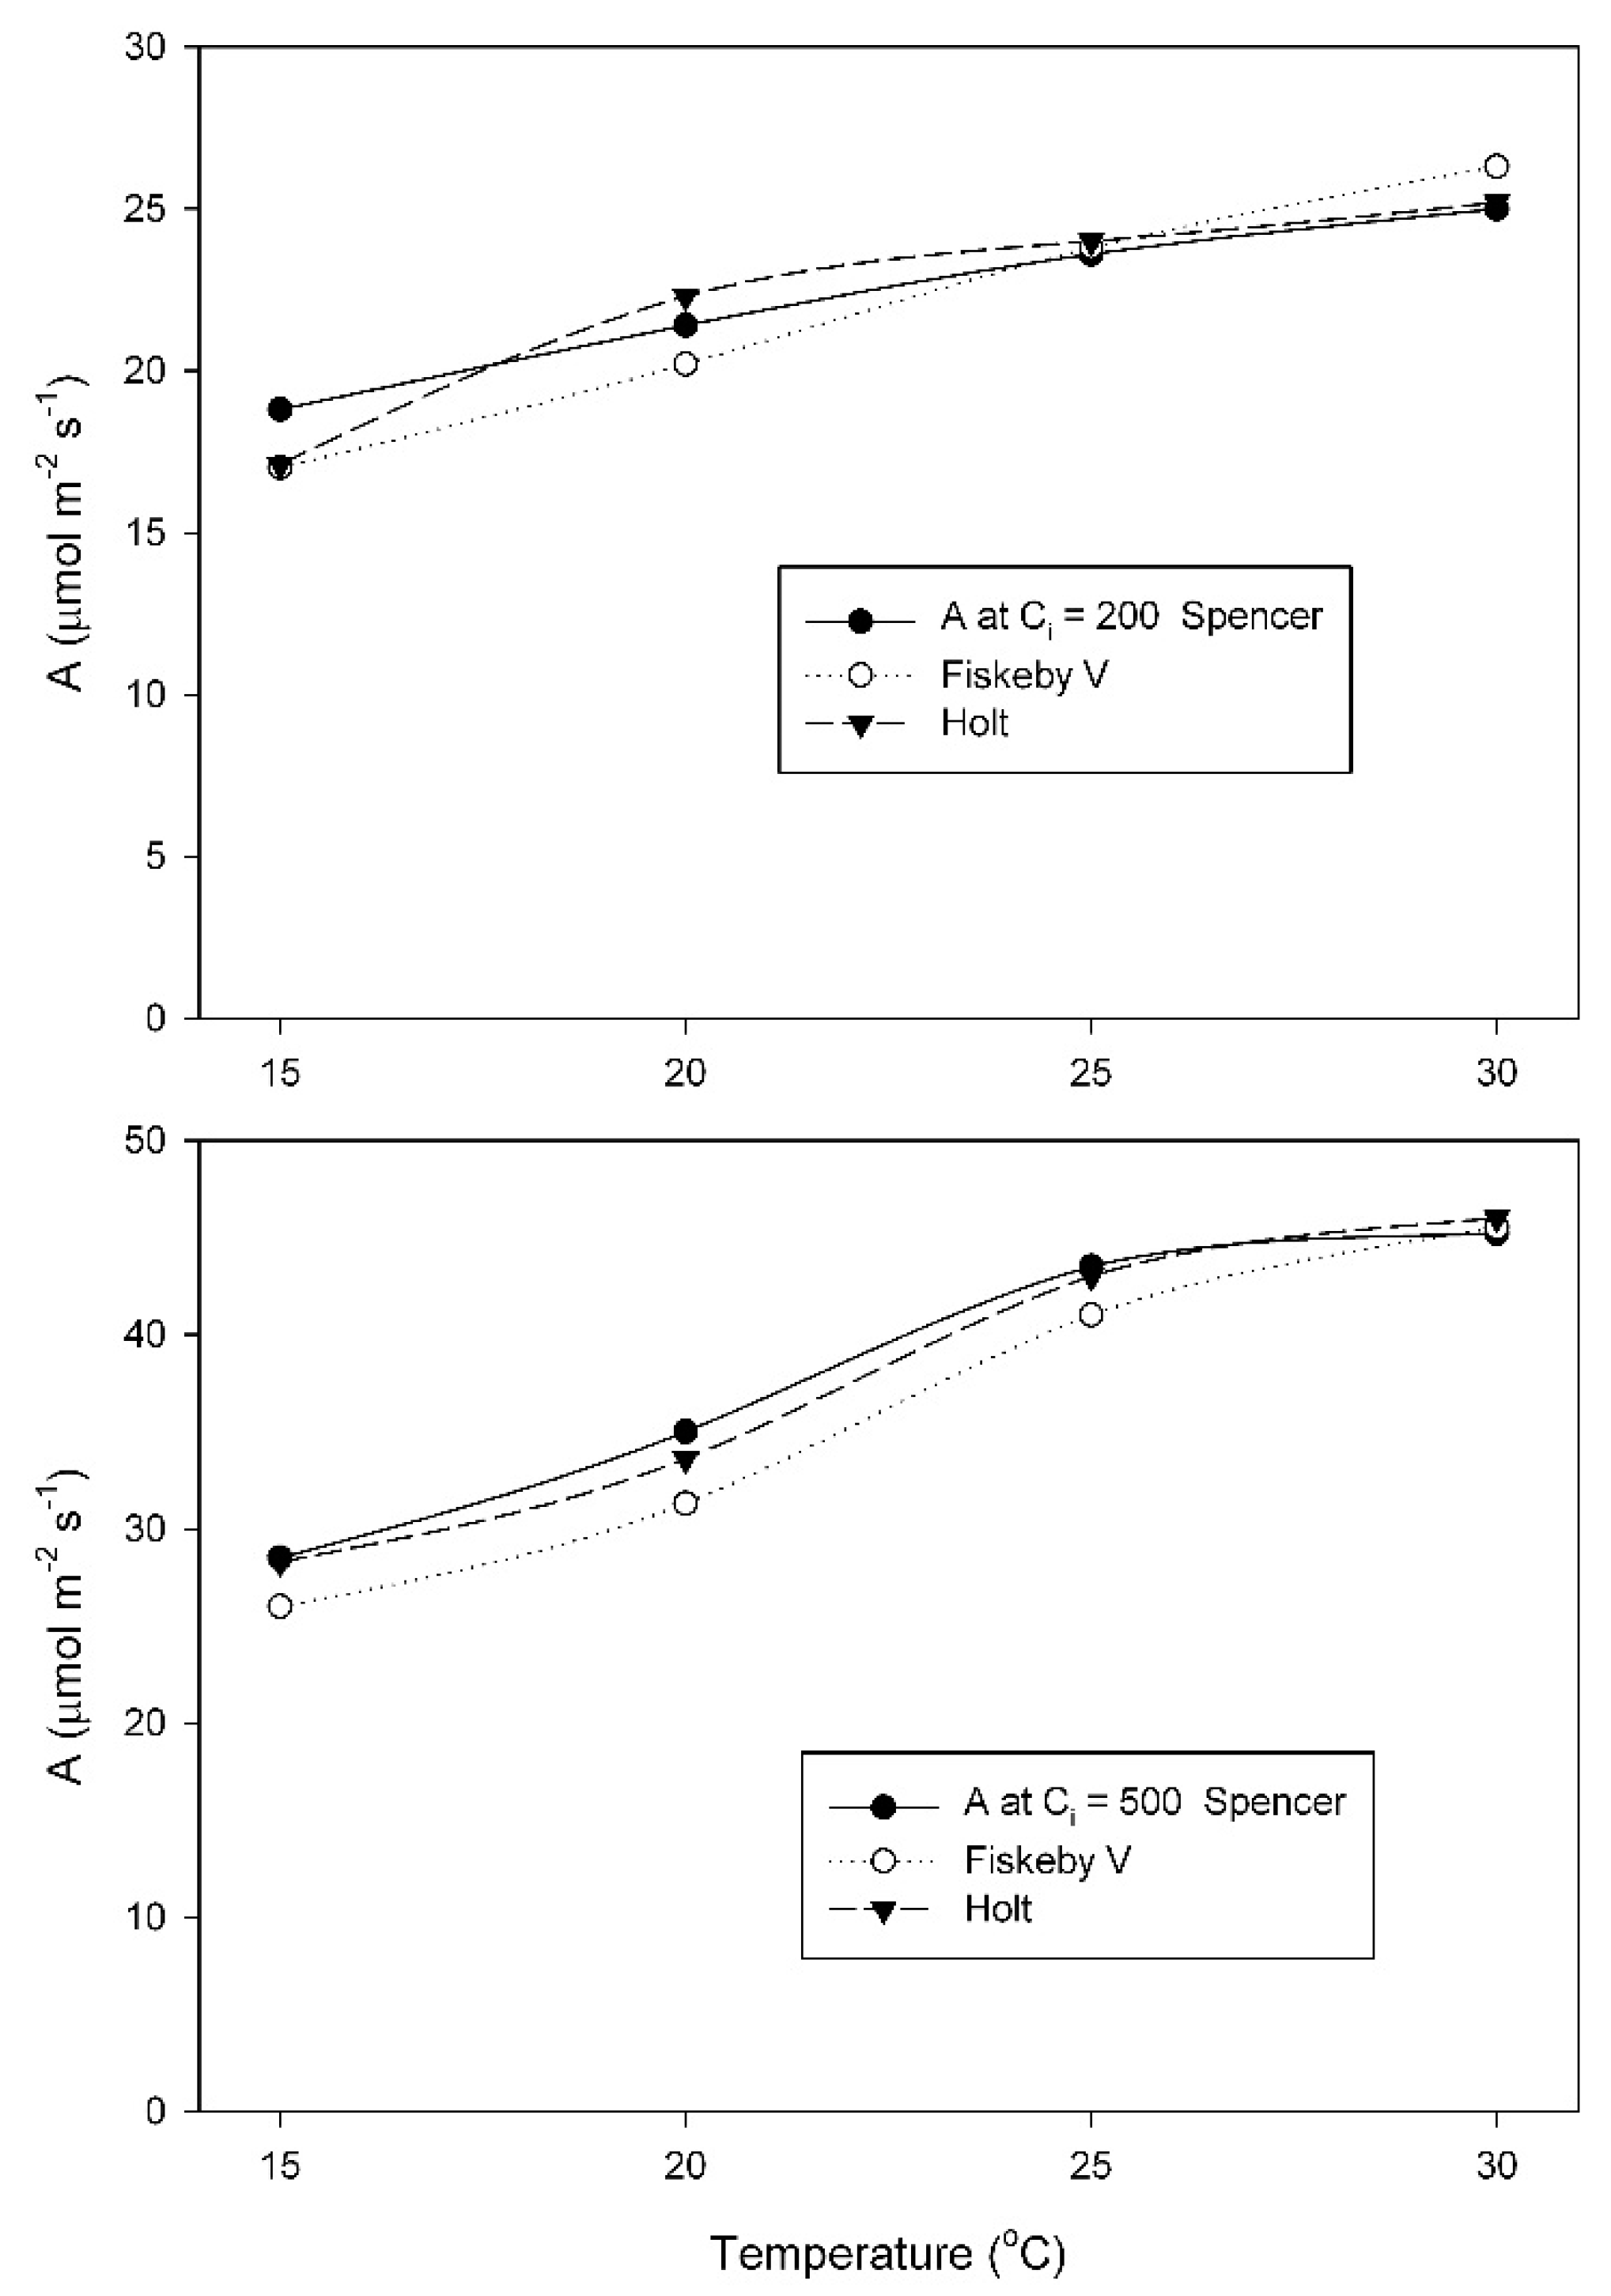
When grown at 20 °C, A did not differ between cultivars at any temperature or measurement CO
2 condition, and increased between 15 and 30 °C (
Figure 3). For each measurement CO
2 condition, two-way analysis of variance indicated a significant effect of measurement temperature, but no cultivar effects and no interaction effects (
Table A3 and
Table A4).
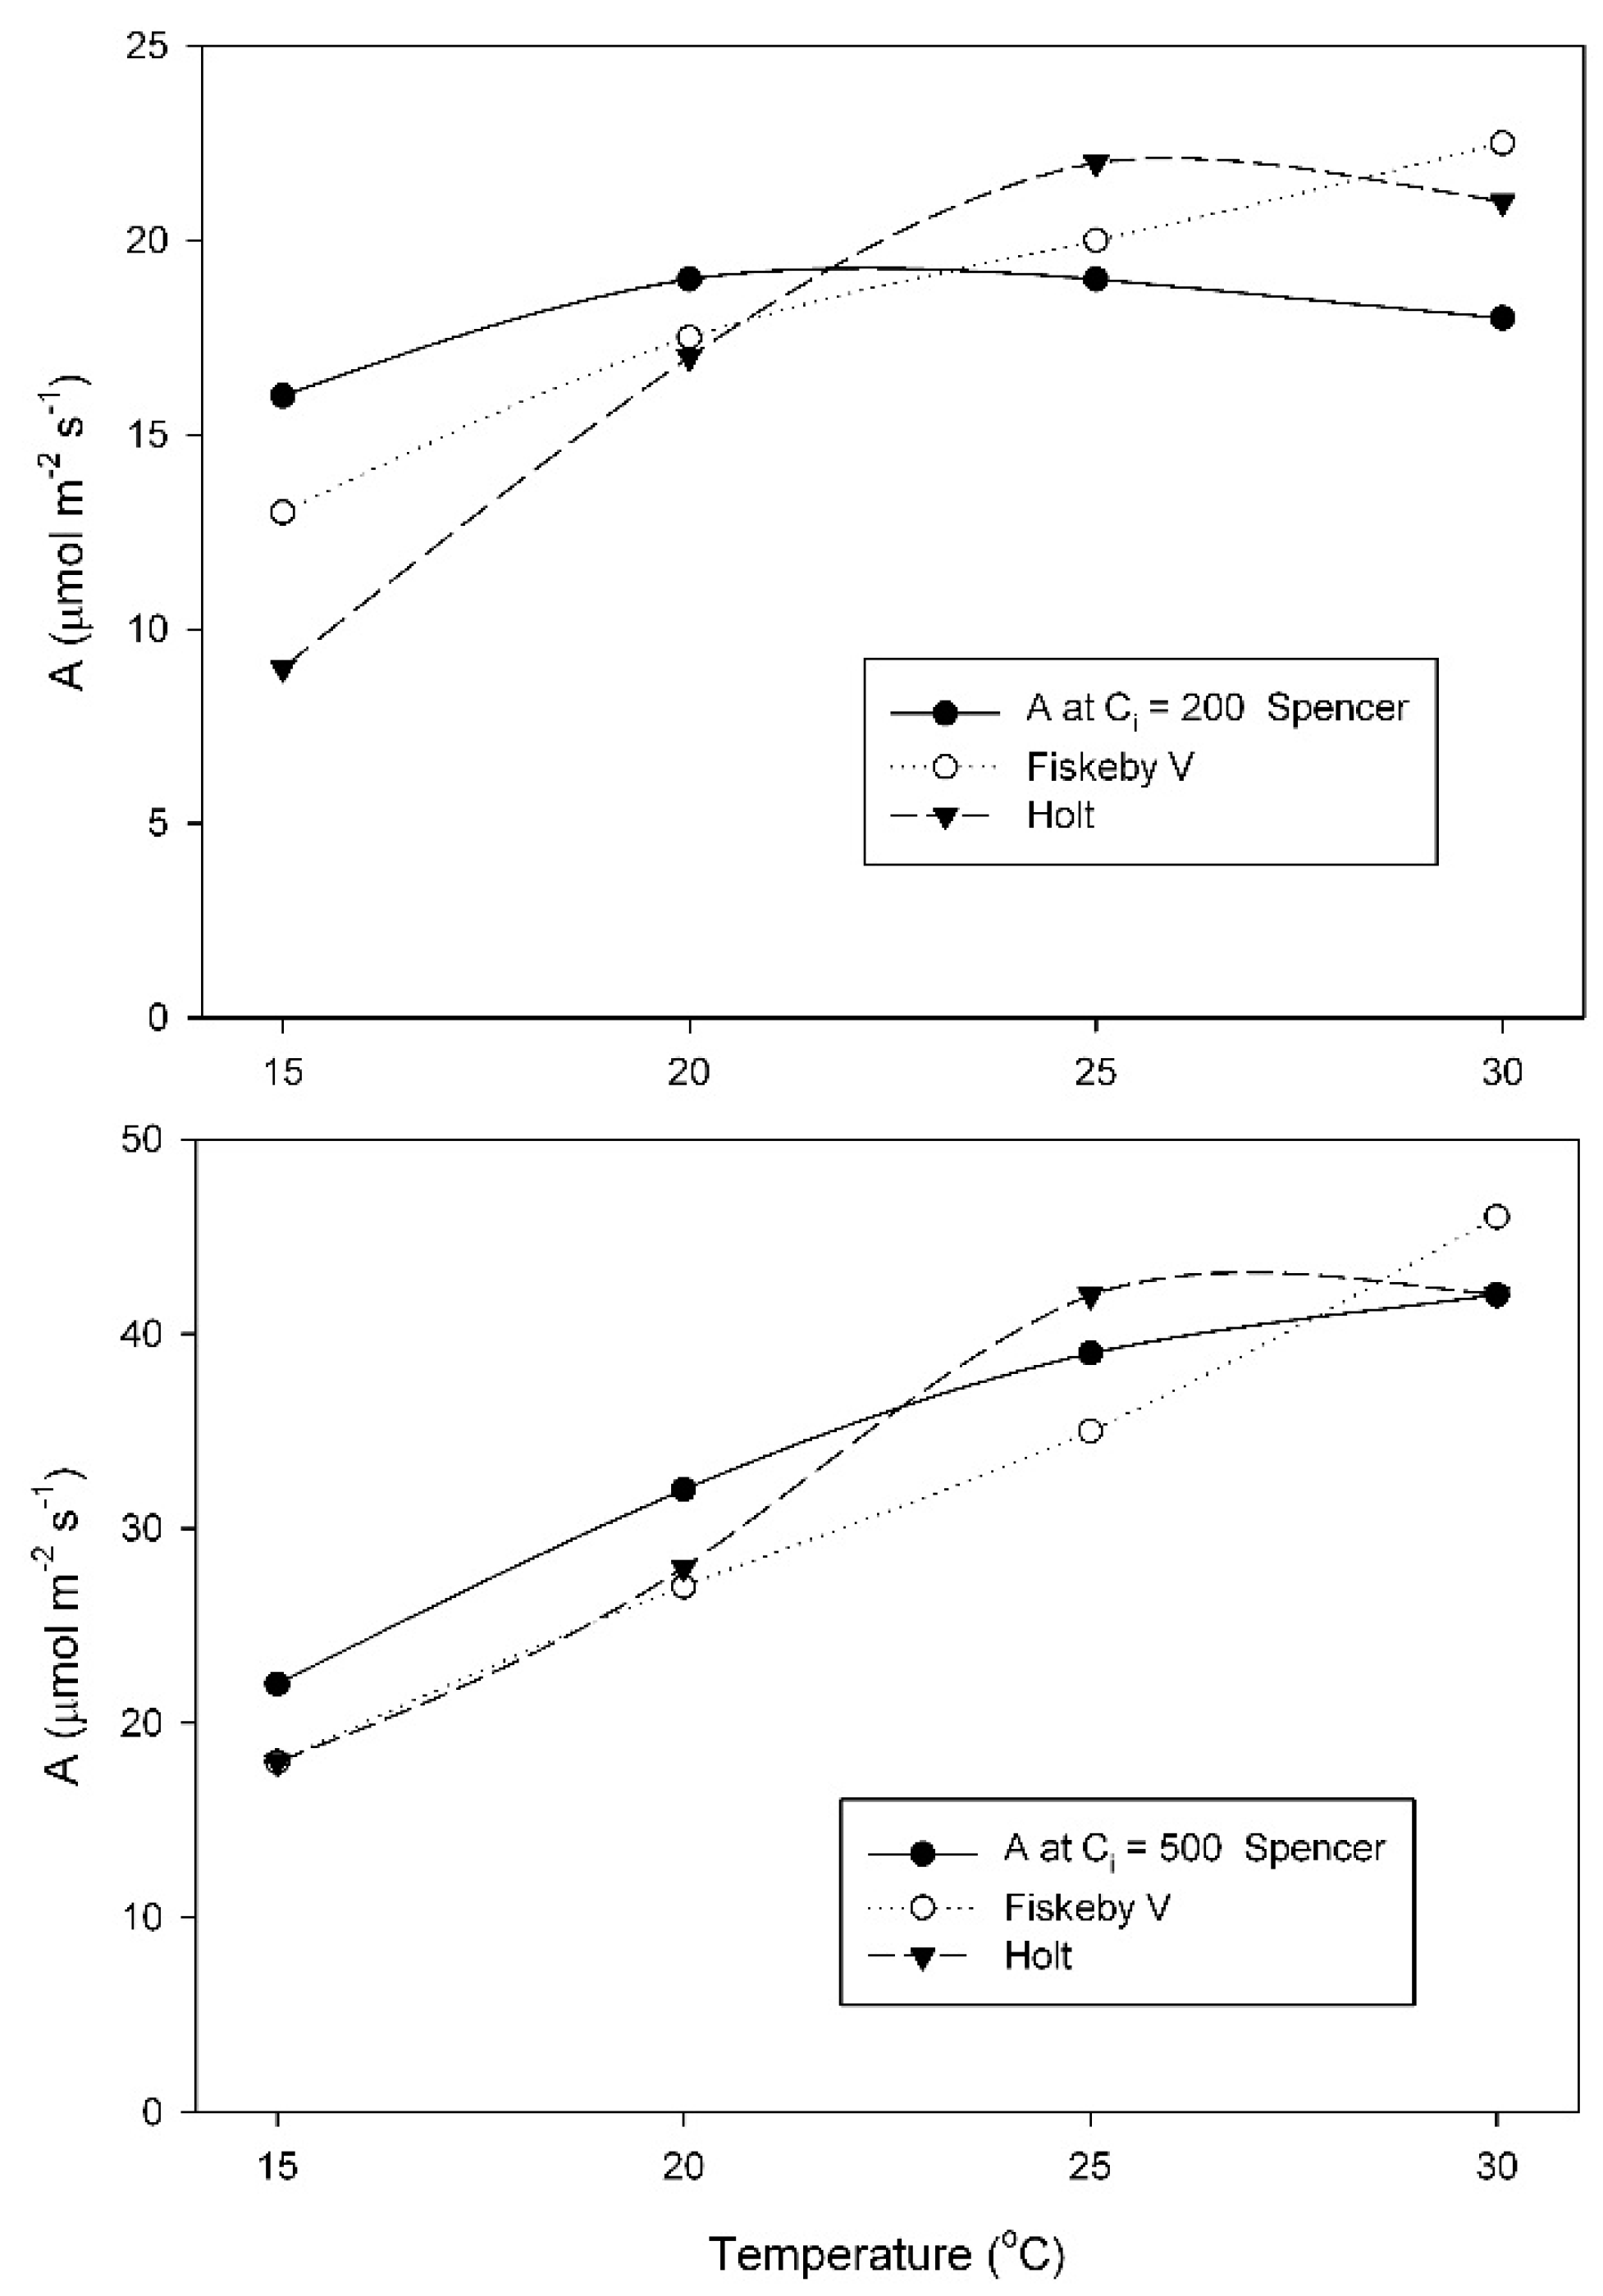
At the growth temperature of 25 °C, A at the measurement C
i = 200 μmol mol
−1 changed much less with temperature in Spencer than in Holt or Fiskeby V (
Figure 4). For measurements at C
i = 200 μmol mol
−1, effects of cultivar, temperature, and their interaction were all significant (
Table A5). At 500 μmol mol
−1 measurement C
i, all three cultivars had similar increases in A with temperature (
Figure 4), with only the effect of temperature being significant (
Table A6).
Mesophyll conductance did not vary substantially with either cultivar or growth temperature, but increased strongly with measurement temperature (
Table 1). Because mesophyll conductance did not vary among cultivars or with growth temperature, the values of respiration in the light (R
l) and CO
2 concentration at which carboxylation equals photorespiratory CO
2 release (Γ*), which were only used for the calculation of mesophyll conductance, are not shown.
The activation energy of the maximum carboxylation capacity of Rubisco (V
Cmax) was, in all cases, lower by 2 to 3 kJ mol
−1 when based on the CO
2 concentration at Rubisco (C
c) compared with C
i. The activation energy of V
Cmax based on C
i was consistently lower in Spencer than in the other cultivars (
Figure 5). The activation energy did not change substantially with growth temperature in Spencer, but increased at growth temperatures of 20 and 25 °C in Fiskeby V and Holt (
Figure 5).
3. Discussion
This work indicated a wide range of responses of photosynthesis to growth and measurement temperature within only three commercial cultivars of soybean. Photosynthetic rates at high light and at air levels of CO2 varied by at least a factor of 1.8 among the three cultivars at all measurement temperatures examined (15 to 30 °C), and the optimum temperatures for photosynthesis at air levels of CO2 ranged from at least 15 to 30 °C.
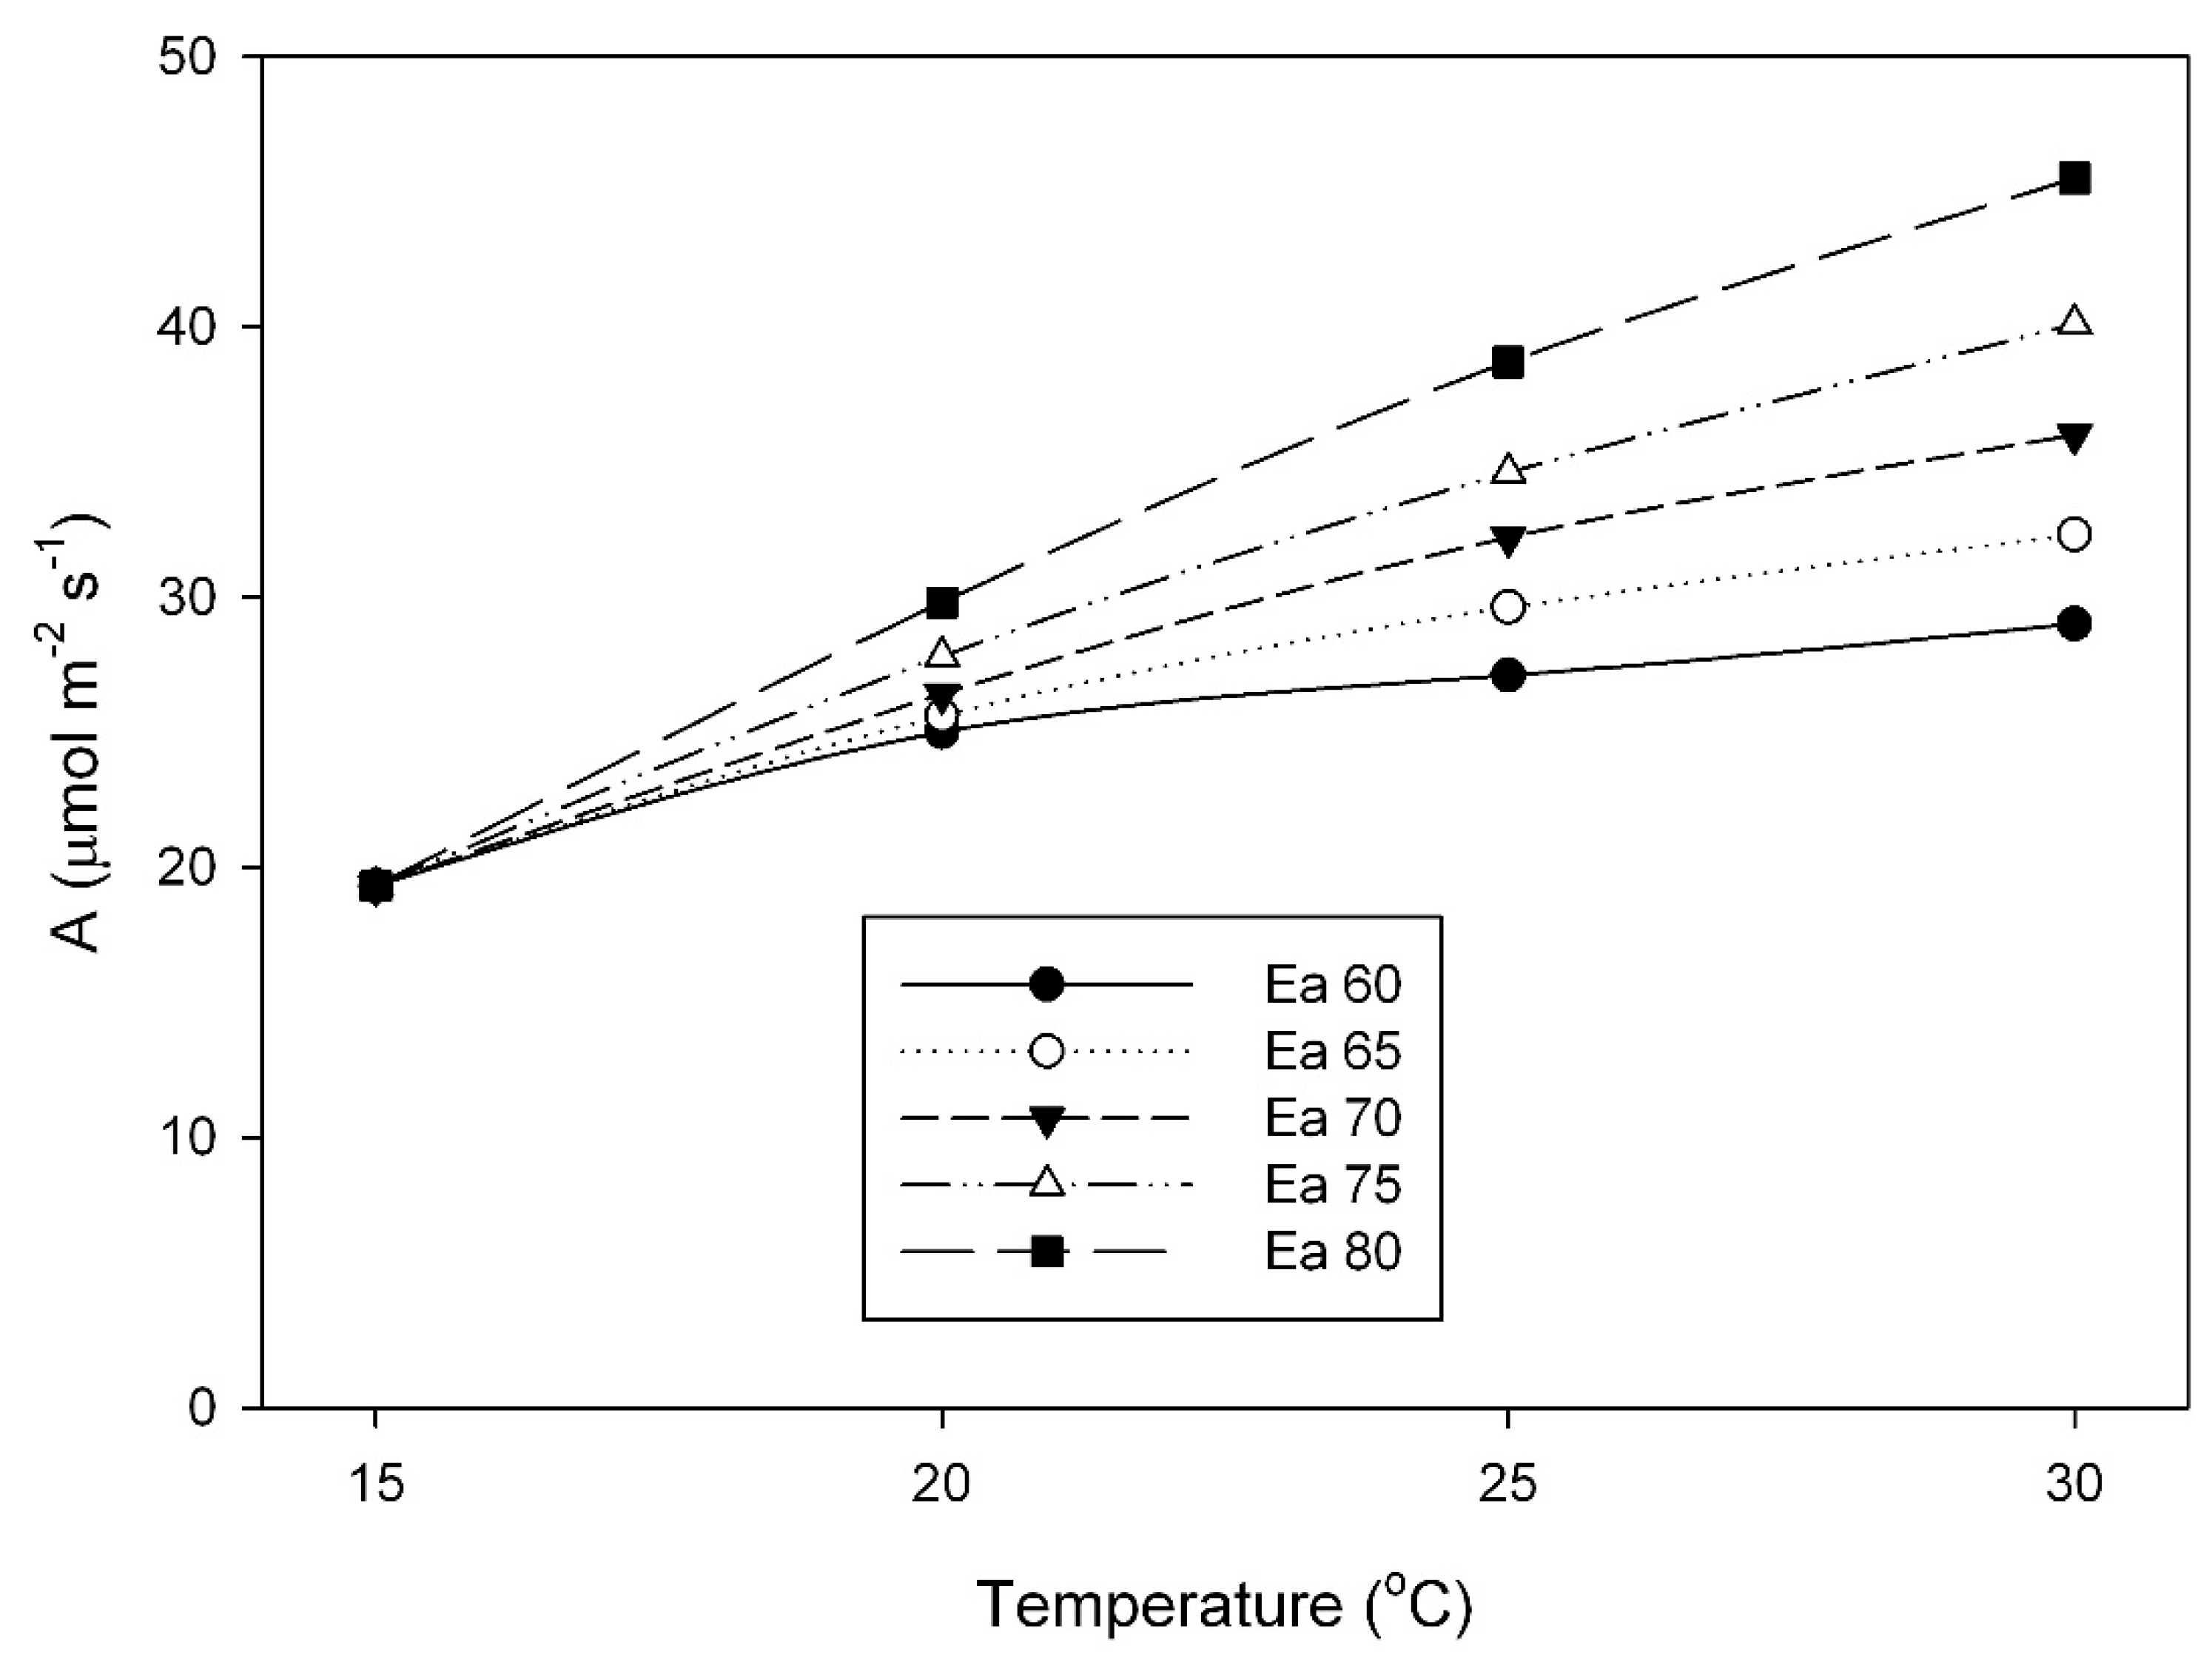
The large impact that differences in the activation energy of V
Cmax can have on responses of photosynthesis to temperature is illustrated in
Figure 6, which shows photosynthetic rates at a C
c of 250 μmol mol
−1 for a fixed value of V
Cmax at 15 °C, combined with different activation energies of V
Cmax. At 30 °C, a 1.33× range in activation energy (from 60 to 80 kJ mol
–1) would result in a 1.56× range in A. The range of activation energy values for V
Cmax (58 to 84 kJ mol
−1) observed in this study is comparable to the variation among herbaceous species found by Hikoska et al. [
10], and those reviewed by Kattge and Knorr [
17], and also to that reported from temperature acclimation experiments with quinoa [
18]. Others have also found variation in the activation energy of Rubisco among species from different climates [
14], within the Triticeae [
15] and within the Paniceae [
16].
In addition to differences in the response of the V
Cmax of Rubisco to measurement temperature among the soybean cultivars studied here, approximately two-fold variation in the value of V
Cmax measured at 15 °C also occurred among these three cultivars when grown at 15 and 25 °C (
Figure 2 and
Figure 4). Variation in the response of V
Cmax to growth temperature among species and ecotypes is well known [
3,
19], but the possibility of intraspecific variation in crop species has received little attention to date. The cultivar Spencer had the highest photosynthetic rates of the three cultivars at air levels of CO
2 when grown and measured at the lowest temperature, suggesting that it was well adapted to lower temperatures. The cost of this adaptation to low temperatures was presumably a larger investment in Rubisco protein per unit leaf area [
9,
11]. The other two cultivars could achieve as high rates of photosynthesis at high temperatures as Spencer despite presumably lower investment in Rubisco protein, because of their higher activation energies of V
Cmax of Rubisco. Among these soybean cultivars, intraspecific variation in the temperature dependence of V
Cmax was much larger than differences in the temperature dependence of maximum rates of electron transport J
max. Consequently, the ratio of V
Cmax to J
max varied substantially among the cultivars, and with growth and measurement temperature, rather than being relatively constant, as suggested by some studies [
20,
21]. The temperature dependence of photosynthesis at current air levels of CO
2 was much more closely related to V
Cmax than to J
max in these soybean cultivars, but that could change with rising atmospheric CO
2.
Based on photosynthetic rates measured at current air levels of CO2, the cultivar Spencer seemed the best adapted to cool growth and measurement temperatures, as it had the highest rates of the three cultivars when grown at 15 °C and measured at 15 and 20 °C. The cultivar Holt seemed the best adapted to warm temperatures, having the highest photosynthetic rate among the three cultivars when measured at 30 °C, for plants grown at 25 °C. It may be useful to consider photosynthetic adaptation to temperature as an additional criterion for developing soybean cultivars for different locations.
4. Materials and Methods
Seeds of three cultivars of soybean (Glycine max L. Merr.), Holt, Fiskeby V, and Spencer were obtained from the USDA germplasm collection, and were grown in indoor, controlled environment chambers. Seeds were sown in 15 cm diameter plastic pots filled with a medium grade of vermiculite. Pots were flushed daily with a complete nutrient solution containing 14.5 mM nitrogen. Plants were grown in two M-12 chambers made by Environmental Growth Chambers (Chagrin Falls, Ohio) equipped with metal halide and high pressure sodium lamps. Twelve hours per day had light at 1000 μmol m−2 s−1 photosynthetic photon flux density (PPFD). Air temperature was controlled at 15, 20, or 25 °C, with respective dew point temperatures of 8, 13, and 19 °C. Constant temperatures were chosen in order to avoid possibly stressful low night temperatures for the low temperature treatment. All three cultivars were grown together in each chamber, with temperatures randomly assigned to chambers in successive “runs”. Each “run” had three pots of each cultivar, with one plant per pot. A total of nine “runs” were grown in order to obtain data on all of the various photosynthetic parameters. Photosynthetic characterization was accomplished using third main stem trifoliolate leaves within a few days after those leaves had reached maximum area, when tests showed that photosynthetic properties were stable over several days.
Basic responses of photosynthesis to temperature were obtained by measuring responses of A to external CO
2 concentrations from 100 to 1200 μmol mol
−1 at temperatures of 15, 20, 25, and 30 °C. In all cases, 1200 μmol mol
−1 CO
2 was saturating to A. Higher temperatures, which could lead to deactivation of Rubisco [
22], were deliberately avoided. These measurements were made on three or four plants of each cultivar for each growth temperature. The small number of replicate plants was justified by the low leaf to leaf variation, as indicated by low values of residual mean squares (
Table A1,
Table A2,
Table A3,
Table A4,
Table A5 and
Table A6), as can also be seen in the example of an A vs. C
i curve in
Figure A1. Gas exchange measurements were made with a CIRAS-3 portable photosynthesis system (PPSystems, Amesbury MA) operated within a controlled environment chamber. During the gas exchange measurements, leaf temperature was controlled to ± 0.3 °C, the PPFD was 1500 μmol m
−2 s
−1, and the leaf to air water vapor pressure deficit ranged from about 0.9 kPa at 15 °C to about 1.4 kPa at 30 °C. The temperature of the controlled environment chamber was set to match the target leaf temperature, and the chamber PPFD was 1000 μmol m
−2 s
−1.
Responses of A to sub-stomatal CO
2 concentration (C
i) were determined using either traditional steady-state measurements at external CO
2 concentrations of 400, 100, 150, 200, 250, 300, 400, 500, 600, 800, 1000, and 1200 μmol mol
−1 sequentially, or transient measurements during linear ramping of CO
2 concentrations from 100 to 1200 μmol mol
−1 [
23]. The CO
2 ramping technique compares apparent CO
2 fluxes for an empty chamber with those when a leaf is present to obtain values of A at approximately 6 μmol mol
−1 CO
2 intervals. Because stomatal conductance did not change during the CO
2 ramping, values of C
i could be calculated for each value of A. Details of the CO
2 ramping method using the CIRAS-3 instrument, and examples comparing A vs. C
i curves obtained by ramping and by steady-state measurements are given in Bunce (2018) [
23]. The advantage of the CO
2 ramping method is that a complete A vs. C
i curve could be obtained in about 5 min, compared with about 30 min for a steady-state response curve. For each cultivar, growth temperature, and measurement temperature, comparisons were made of A vs. C
i curves obtained on the same leaf by the two methods to verify that photosynthetic parameters obtained by both methods did not differ substantially in this experiment.
Mesophyll conductance (g
m) for CO
2 movement from intercellular airspace to the site of fixation was measured for each growth and measurement temperature in all cultivars. Mesophyll conductance was determined from the oxygen sensitivity of photosynthesis in the Rubisco-limited region [
24]. Because that method of measuring g
m depends upon knowing values of respiration in the light (R
l) and the CO
2 concentration at which carboxylation equals photorespiratory CO
2 release (Γ*), R
l and Γ* were also measured. Γ* was measured from the intersection of A vs. C
i curves at high and low PPFD, using the precautions detailed by Walker and Ort (2015) [
25]. R
l was determined by extrapolating A vs. C
i curves measured at 2% O
2 to zero C
i. The values of R
l and Γ* measured for each leaf were then used to calculate g
m by the oxygen sensitivity method [
24]. Prior work in soybean indicated that g
m did not vary with C
i [
26]. The CO
2 concentration at Rubisco (C
c) was then calculated from A and C
i, using C
c = C
i – A/g
m for each set of values of A and C
i.
The maximum carboxylation capacity of Rubisco (V
Cmax) was then estimated from the initial slopes of A vs. C
i and A vs. C
c curves for each leaf, growth temperature, and measurement temperature, using the temperature response functions of Bernacchi et al. [
27]. The temperature dependencies of V
Cmax based on C
i and C
c were summarized by their activation energies over the range of 15 to 30 °C. Activation energy was calculated as the slope of 1/V
Cmax vs. 1/T (in °K). No deactivation term was used, since high temperatures causing deactivation were not used in this study.
Responses of photosynthesis to CO2 for each cultivar, growth temperature, and measurement temperature were summarized as A at an external CO2 (Ca) of 400 μmol mol−1, which is approximately the current atmospheric CO2, A at Ci = 200 μmol mol−1 as an indication of VCmax, and A at Ci = 500 μmol mol−1, as an indication of the electron transport-limited A (Jmax). These parameters were calculated for each leaf from the A vs. Ci response curves, and two-way ANOVA was used to test for effects of cultivar, temperature, and their interaction separately for the three growth temperatures, for each photosynthetic parameter.


