
IFGAN—A Novel Image Fusion Model to Fuse 3D Point Cloud Sensory Data

1
College of Information Technology, United Arab Emirates University, Al Ain P.O. Box 15551, United Arab Emirates
2
Emirates Center for Mobility Research, United Arab Emirates University, Al Ain P.O. Box 15551, United Arab Emirates
*
Author to whom correspondence should be addressed.
J. Sens. Actuator Netw. 2024, 13(1), 15; https://doi.org/10.3390/jsan13010015
Submission received: 16 November 2023
/
Revised: 8 December 2023
/
Accepted: 12 December 2023
/
Published: 7 February 2024
Abstract
:To enhance the level of autonomy in driving, it is crucial to ensure optimal execution of critical maneuvers in all situations. However, numerous accidents involving autonomous vehicles (AVs) developed by major automobile manufacturers in recent years have been attributed to poor decision making caused by insufficient perception of environmental information. AVs employ diverse sensors in today’s technology-driven settings to gather this information. However, due to technical and natural factors, the data collected by these sensors may be incomplete or ambiguous, leading to misinterpretation by AVs and resulting in fatal accidents. Furthermore, environmental information obtained from multiple sources in the vehicular environment often exhibits multimodal characteristics. To address this limitation, effective preprocessing of raw sensory data becomes essential, involving two crucial tasks: data cleaning and data fusion. In this context, we propose a comprehensive data fusion engine that categorizes various sensory data formats and appropriately merges them to enhance accuracy. Specifically, we suggest a general framework to combine audio, visual, and textual data, building upon our previous research on an innovative hybrid image fusion model that fused multispectral image data. However, this previous model faced challenges when fusing 3D point cloud data and handling large volumes of sensory data. To overcome these challenges, our study introduces a novel image fusion model called Image Fusion Generative Adversarial Network (IFGAN), which incorporates a multi-scale attention mechanism into both the generator and discriminator of a Generative Adversarial Network (GAN). The primary objective of image fusion is to merge complementary data from various perspectives of the same scene to enhance the clarity and detail of the final image. The multi-scale attention mechanism serves two purposes: the first, capturing comprehensive spatial information to enable the generator to focus on foreground and background target information in the sensory data, and the second, constraining the discriminator to concentrate on attention regions rather than the entire input image. Furthermore, the proposed model integrates the color information retention concept from the previously proposed image fusion model. Furthermore, we propose simple and efficient models for extracting salient image features. We evaluate the proposed models using various standard metrics and compare them with existing popular models. The results demonstrate that our proposed image fusion model outperforms the other models in terms of performance.
1. Introduction
It is proposed that autonomous vehicles (AVs) can significantly reduce the number of traffic accidents by minimizing the impact of human factors on collision probabilities. Real-time experiments related to AVs are conducted worldwide, and a recent survey performed by [1] predicts that by 2025, the US market will achieve a target of around 8 million customers who will be using AVs for their day-to-day activities. The use of AVs has many potential advantages like minimizing the number of road accidents; avoiding long waiting traffic jams caused by congestion of vehicles, thus saving energy to a great extent; reducing parking problems; and helping customers, who do not know how to drive a manual vehicle, to easily access the AV [2]. The same study also predicts that by the end of 2040, around 33 million people will be accustomed to using AVs, indicating the importance of AVs. Though the statistics provide the importance and need for AVs in the future, more analysis is required to ensure against safety hazards to the customers using AV.
To prevent accidents caused by AVs, these vehicles must make instant and accurate decisions when encountering roadside events. Contextual information that AVs see has to be unambiguous and precise to ensure accurate decision making. The systems that perceive their environment information need to be highly accurate, providing a comprehensive understanding of the surroundings and functioning effectively even in adverse conditions, in particular when specific sensors malfunction or break. The collection of environmental- and vehicle-related data relies on fully operational sensor systems. However, the data collected from various devices, including sensors, thermal cameras, and radars, exhibit heterogeneous multimodal features, posing challenges to achieving accurate perception. More consideration should be given to data preparation tasks like data cleansing and multimodal fusion to improve the contextual awareness of self-driving vehicles.
For environmental data collection and situational awareness [3], AVs depend on inside as well as outdoor sensors, including LiDAR, radar, ultrasonic, stereo, and thermal cameras to create the perceived perception of the AV. The gathered vehicle data, however, may be in various formats, including text, image, video, and audio, and may include errors like insignificant information, inaccurate information, anomalies, and repetitions. Images and audio data, for instance, may both contain fuzzily-defined information. Pre-processing the sensory input is essential as a result of increasing its accuracy. Although data cleaning has received a lot of attention, this proposal focuses on data fusion, the second step in the data pre-treatment process. A powerful architecture to integrate data must be designed and developed to combine disparate data into a solitary structure and improve its precision for additional analysis since sensory information can display multi-functional properties. This study primarily focuses on the information gathered from state-of-the-art sensors like RADAR, Velodyne, and LiDAR, with a specific emphasis on image fusion due to the predominance of visual data from these sensors. However, the upcoming research will solely concentrate on the proposed models for fusing text, audio, and video data.
Image fusion is a technique that creates a single image with more information than any of the individual images by combining data from various images of the same scene. Though extensive research and contributions are still in progress in this domain, indeed, there are a few challenges and drawbacks associated with the existing solutions. The datasets, evaluation metrics, and fusion methods utilized in image fusion research are not standardized. This makes evaluating the effectiveness of various fusion methods challenging. Numerous image fusion techniques in use today were developed for particular uses like remote sensing or medical imaging. Other applications, such as autonomous vehicles which need real-time processing and robustness to noise and other environmental conditions, might not be compatible with these techniques. A lot of image fusion methods concentrate on combining information from different sensors that belong to the same modality, such as different cameras or different heat sensors. However, the data from numerous sensors, including LiDAR, radar, and cameras, as well as sensors from other modalities, is often used by autonomous cars. It is necessary to use fusion approaches that can handle multimodal data. Many currently used image fusion algorithms may not be appropriate for real-time processing since they need a lot of computation [4]. This is a big barrier for autonomous vehicles since they need to evaluate sensor data quickly and effectively to make judgments in real time. Several fusion methods are not resistant to noisy or imperfect data. When it comes to autonomous vehicles, elements like weather or sensor failures may have an impact on the sensor data, resulting in noisy or missing data. We need fusion methods that can withstand such influences. Moreover, there has been minimal effort to integrate the multispectral environmental data collected from advanced sensing devices [5]. Adaptable architectures integrated with revolutionary algorithms and predictive modeling techniques are required to fuse multidimensional image data.
Given the disadvantages listed above, this study suggests a hybrid fusion paradigm, which combines an advanced deep residual network (ResNet) model that focuses on feature extraction and low-vision image restoration tasks, with the proposed advanced GAN model, collectively called Image Fusion GAN (IFGAN). In addition to capturing detailed spatial information to assist the generator in focusing on the foreground and background information of the images, the multiscale attention mechanism also seeks to limit the discriminators’ focus to the focused areas rather than the complete input picture. The IFGAN model is an advanced CNN model that consists of two important functional layers: one for obtaining the attention map of the images generated from the ResNet, and the other to fuse the collected images to obtain the actual information.
Additionally, this research has introduced adaptable kernel functions designed for all machine learning models utilized across various tasks. The GAN model has undergone customization of its layers, with Layer-1 dedicated to feature extraction, Layer-2 responsible for the initial fusion of 2D/3D images using the previously suggested Hybrid Image Fusion model [6], Layer-3 focused on transforming the fused 2D/3D data into a 3D point cloud data format, Layer-4 designed for executing discriminator tasks, and Layer-5 designated for the final stage of image fusion. Moreover, a novel loss function has been introduced to assess the accuracy of image fusion. Within the GAN model, two discriminators have been integrated to capture spatial and spectral information. The proposed IFGAN model employs a dual-fold fusion approach, combining the inherent features of the earlier proposed Hybrid Image Fusion model [6] with the novel IFGAN model, thereby aiming to enhance the precision of image fusion.
The rest of this paper is organized in the following manner: Section 2 provides an introduction to sensor technology, outlines the significance of data fusion in enhancing data accuracy, and presents an overview of the topic. Section 3 explores the existing literature in this field, highlighting its limitations that inspired our research proposal. Section 4 constitutes the central component of the paper, where detailed explanations are provided regarding the design, development, and implementation of the proposed models. The evaluation of these models and the resulting outcomes are discussed in Section 5. Finally, Section 6 concludes the paper by summarizing the overall findings, discussing their implications, and suggesting avenues for future research.
2. Background and Motivation—GAN and ResNet Models: State of the Art
The suggested research presents an effective GAN model designed to merge various image data formats, specifically focusing on 3D point cloud image sensor data. Due to the model’s reliance on extensive mathematical computations and sophisticated matrix and vector transformations, an in-depth understanding of GAN models is crucial. This paragraph emphasizes key aspects of essential features in advanced machine learning-driven image fusion models, notably GAN and ResNet. Hybrid transform-based image fusion algorithms, which combine both the spatial domain and transform domain, are becoming more and more prominent in the field of image fusion since picture distortion and insufficient spatial continuity are common problems with transform domain-based image fusion methods. As mentioned above, the proposed approach integrates two efficient models to fuse image data: one is ResNet to extract the image feature, and the other is an advanced GAN model to fuse the extracted feature. The upcoming paragraphs briefly describe the salient features of ResNet and GAN models. Researchers at Microsoft Research developed ResNet (Residual Network), a deep learning model, in 2015. It is designed to address the problem of vanishing gradients, which occurs when training very deep neural networks, by introducing a “shortcut” or “skip connection” that allows the gradient to flow directly through the network.
The ResNet architecture consists of a series of residual blocks, each containing one or more convolutional layers followed by shortcut connections that bypass the convolutional layers. These shortcut connections allow information to flow more easily through the network and enable the network to learn deeper and more complex features. On a variety of computer vision tasks, such as picture categorization, detecting objects, and segmentation using semantics, ResNet has demonstrated cutting-edge performance. The architecture has been extended and adapted in many ways, such as the introduction of “bottleneck” layers to make the model’s complex computations less difficult, and ResNeXt, which improves performance by introducing a new type of connectivity between residual blocks. Overall, ResNet models prove to be a robust resource in the realm of computer vision tasks, thanks to their adaptability and ability to scale, rendering them well suited for a broad range of intricate applications [7]. Convolutional neural networks (CNNs) have gained significant prominence in the field of image processing due to their adeptness at efficiently extracting crucial visual information [8]. While shallow networks can only learn basic local features, increasing the number of network layers enables the creation of detailed characteristics, like intricate surfaces, which has to be explored further. However, as the assortment of layers rises, deeper networks may become challenging to train, resulting in the issue of disappearing gradients and declining training performance. To address these issues, the profound remnant architect was proposed in the literature, which consists of residual blocks. This approach enables the learning of deep features while mitigating the issues related to disappearing slopes, further improving the model’s training performance. The layout of the remaining component is shown in Figure 1. Assuming that the underlying mapping that a CNN is expected to learn is denoted as , yet another assignment is fitted using stacked nonlinear layers. This changes the format of the connection to . The addition of this residue component to the system allows for improved visualization of networks while extending the network’s depth to achieve improved training outcomes. As a result, a residue component is integrated into the system to matriculate asymmetric pattern translation. The residue components’ structure is demonstrated in Figure 2. Many edge-maintaining filters, such as bilateral filters and guided filtering, have been proposed by many researchers. However, these filters frequently overlook the precise impact of scale illusion on the retention of picture edges. To tackle this challenge, Zhang and colleagues [9] introduced the concept of a rolling guidance filter. This innovative approach incorporates a multi-scale edge-preserving filter to safeguard the edges of an image, achieved by applying edge-preserving filters at various scales. Additionally, each iteration of the filter uses the image resulting from the previous filtering step as the guiding image. Owing to its impressive ability to preserve image edges, the rolling guidance filter has gained widespread adoption in the field of image fusion.
Generative Adversarial Networks, often termed as GAN, is another extension of the neural networks (NN) model. GAN has two parts, namely (i) Generator and (ii) Discriminator. The generator gains the ability to generate credible data, which the discriminator uses as negative training examples. The discriminator gains the skill to differentiate fabricated data from authentic data generated by the generator. It penalizes the generator for creating unrealistic outcomes. At the start of the training, the generator generates noticeably artificial data, prompting the discriminator to rapidly discern its falseness. As the training advances, the generator moves towards generating output that can deceive the discriminator. Ultimately, with successful generator training, the discriminator’s ability to differentiate between genuine and fake diminishes. It begins to classify fake data as real, leading to a decline in its accuracy. The generator and discriminator function as NN. The generator’s output directly links to the discriminator’s input. Utilizing backpropagation, the discriminator’s classification offers a signal used by the generator to adjust its weights [10,11].
Compared to fusing other data types, image fusion and audio fusion pose greater complexity. Image data fusion generally involves three levels: (i) pixel-level fusion, which provides detailed image data that cannot be obtained at any other level; (ii) feature-level fusion, serving as an intermediary for data caching and compression; and (iii) decision-level fusion, the most advanced and intricate level, relying less on the image registration process. A variety of techniques are commonly employed for image data fusion, including recurrent strategies, Multiplicative Algorithms, PCA, High Postfilter, the Brovey transform image fusion technique, the Color rotated technique, and the Discrete Wavelet Transformation. These techniques consider key image features such as color, corners, SIFT, SURF, blobs, and edges. Table 1 delineates the operational principles of prominent image fusion models based on machine learning, along with their advantages and disadvantages. The subsequent section delves deeper into the existing literature on this topic.
3. Related Work
A thorough investigation of the various picture, video, and audio data fusion strategies put forth by distinguished academics is provided to pinpoint their key contributions and any current shortcomings. The information acquired will serve as a springboard for developing this research further to close any gaps that may still exist.
3.1. Hybrid Image Fusion Models
B. Shahian Jahromi et al. [12] designed and developed an adaptable composite multi-sensor fusion pipeline framework, especially for self-driving cars. Road segmentation, obstacle recognition, and surveillance are just a few of the environment perception tasks that this architecture accomplishes. The fusion framework incorporates an encoder–decoder-based Fully Convolutional Neural Network (FCNx) and a standard Extended Kalman Filter (EKF) nonlinear state estimator approach. Additionally, the fusion system optimizes the camera, LiDAR, and radar sensors configured for each specific fusion strategy. The primary goal of this hybrid architecture is to create a cost effective, lightweight, adaptable, and resilient fusion system that can withstand sensor failures. While preserving real-time effectiveness on embedded processors for self-driving cars, the FCNx methodology used in this framework improves road recognition accuracy beyond the benchmark models. D. Jia et al. [13] introduced a hybrid Spatiotemporal Fusion (STF) method centered around a deep learning model called Hybrid Deep Learning-based Spatiotemporal Fusion Model (HDLSFM). This method aims to reliably fuse morphological and physiological data to better understand the physical properties of the Earth’s surface. The proposed technique combines regressive deep learning-based related radiometric normalization, deep learning-based super resolution, and linear-based fusion to handle radiation discrepancies among different satellite images. The HDLSFM framework demonstrates its ability to predict phenological and land-cover changes compared to the benchmark Fit-FC method. Moreover, HDLSFM stays resistant to emission differences between various images acquired from various satellite data and periods between prediction and baseline dates, guaranteeing its efficacy in merging data obtained from time series events.
Y. Wang et al. [14] have put forward an integrated fusion method that considers the geographical and temporal attributes of sensory data related to roadside events. They achieved this by employing Cmage, a notation based on images that encapsulate both physical and social data from sensors, specifying the state of specific visual concepts (e.g., “crowdedness”, “inhabitants parading”). The authors introduced a fusion model that integrates spatial relationships among sensor data and community information, event signals from multiple modalities, Bayesian methods, and incomplete sensor data using a Gaussian process based on the acquired Cmage representation. A. V. Malawade et al. [15] have developed an architecture for targeted sensor fusion called HydraFusion that learns to understand the driving context in use before combining the right combination of sensing devices to increase resilience without reducing economy. To change both how and when fusion is used, HydraFusion is the initial way to propose continuous switching within an early fusion, late fusion, and variants in between. The authors demonstrate that HydraFusion outperforms both initial and final fusion approaches by 13.66% and 14.54%, respectively, using the industry-standard Nvidia Drive PX2 AV hardware platform without raising computational complexity or energy usage. The authors suggest and assess both fixed and deep-learning-based context detection techniques.
The advancement of these techniques signifies a transition from supervised to unsupervised approaches, with a continued emphasis on generating precise logical maps. Liu et al. [16] made use of a CNN model to distinguish between zones with and without focus, creating an integrative judgment map to fuse the data. They used a personally generated judgment map as reference data for supervised training, which is important to note, aiming to improve classification accuracy. Du et al. [17] introduced an innovative strategy for multi-focus image fusion using image segmentation, where decision map detection involves segmenting the source images into focused and defocused regions. While this fragmenting approach enhances the efficiency of the decision map’s boundary lines, to some extent it might cause impairment in specifics. Guo et al. [18] suggested the use of conditional GAN for multi-focus image fusion, but this method still requires labeled images for supervised training of the network. Ma et al. [19] introduced an unsupervised network that creates the fusion judgment map to overcome the above-mentioned challenge. However, even with ground truth available for reference, these approaches may not produce an optimal decision map solely relying on the ANN’s capacity to acquire knowledge. Therefore, they often require post-processing techniques like consistency verification or guided filtering, which do not fully exploit the potential of NNs. Contrarily, our suggested IFGAN is an unsupervised approach that eliminates the need for post-processing.
Multi-focus blending of image techniques now in use have advanced significantly; however, additional progress is needed to improve their performance. Firstly, current approaches often rely on manually created guidelines for fusion and intensity measuring, which reduces their efficiency as it is challenging to account for all pertinent elements in a single manual approach. Secondly, many methods treat multi-focus image fusion as a classification problem focused on sharpness detection and decision map generation. However, accurately classifying regions of focus and defocus that are close to the boundaries remains a challenge for these methods. Thirdly, while creating decision maps, the majority of deep learning-based techniques demand additional processing activities like coherence tests, which adds complexity to the methods. Additionally, these methods often use human decision map generation as the basis for network training, which further limits their application.
3.2. Feature Extraction Models (Image Data)
P. Tiede et al. [20] have introduced an innovative method called Variational Image Domain Analysis (VIDA) for universal image feature extraction in a broad spectrum of VLBI image reconstructions. VIDA can be used for any picture reconstruction, regardless of the order, in contrast to earlier methods. This strategy provides valuable insights into effectively extracting essential picture attributes such as color and edges. The utilization of CNN as a feature extraction tool for images is preferred since it is difficult to successfully combine classifiers and imagery. The primary advantage of CNNs as feature extractors lies in their ability to acquire a greater number of distinctive attributes in comparison to alternative approaches. In their study, Govindaswamy et al. [21] investigated the use of a CNN for predicting physician gaze. The authors specifically focused on comparing hand-crafted features with features extracted by a CNN, and they also examined the impact of completely connected layers over the feature selection strategy of the model.
Similarly, Wang et al. [22] put forth a proposal to integrate the CNN and the extreme learning machine (ELM) algorithm for the recognition of synthetic aperture radar (SAR) images. The CNN model was employed as the feature extractor, leveraging its remarkable ability to extract intricate features from images while maintaining invariance to various forms of image deformation. On the other hand, the ELM served as the recognizer. The experimental findings illustrated that this model efficiently alleviated the problem of overfitting, thus accelerating the convergence of the network, leading to a reduction in the total experimentation time. Liu et al. [23] utilized a dataset consisting of 61 COVID-19 and 27 general pneumonia CT images. A total of 34 quantitative textural traits were retrieved and compared to the performance of the Ensemble-based bagged trees classification model with four eminent classifiers: Linear Regression, Support Vector Machine, Decision Tree, and k-Nearest Neighbors (KNN). The classification accuracy reached its peak at 94.16% with the ensemble of bagged tree classifiers. Ozkaya et al. [24] employed the same dataset as the previous study [6] and divided it into two subsets: Subset-1 (16 × 16) and Subset-2 (32 × 32). They utilized a convolutional neural network architecture to extract features from the images and classified them using SVM. Subset-2 yielded an accuracy of 98.27%. In the research conducted by Kassani et al. [25], a method was proposed for feature extraction using various pre-trained deep learning networks. For classification, they employed Random Forest, XGBoost, Decision Tree, AdaBoost, LightGBM, and Bagging Classifiers. Employing features collected with DenseNet121 and categorized with the Bagging tree classifier, the best accuracy of 99% was attained.
While CNN-based edge detection models have shown significant advancements in computer vision tasks, they are not without their drawbacks. Some of the limitations of CNN-based edge detection models are described in the following paragraph. CNN models heavily rely on large and diverse datasets for training. Without a sufficiently diverse and representative dataset, the model may struggle to generalize well to different edge detection scenarios. CNN models can be sensitive to noise, variations in lighting conditions, and other distortions in the input image. These factors can lead to false positives or missed edges, reducing the overall robustness of the model. CNNs typically operate on fixed-size image patches or windows, which makes it challenging to handle scale variations in edge detection. Detecting edges at different scales requires additional processing steps or modifications to the network architecture. CNN models for edge detection often involve deep architectures with numerous layers. This complexity can make training and inference computationally expensive, requiring significant computational resources. CNNs focus on local image patches and lack extensive contextual understanding. As a result, they may struggle to accurately detect edges in complex scenes with occlusions or overlapping objects. CNN-based edge detection models may be biased towards detecting specific types of edges that are prevalent in the training dataset. Consequently, they may not perform well in detecting unseen or rare edge types. CNN models are often considered black-box models due to their complex architecture and large number of parameters. Interpreting and explaining the decision-making process of CNN-based edge detection models can be challenging. It is important to consider these drawbacks and potential limitations when applying CNN-based edge detection models in practical applications. This research suggests a general data fusion engine to combine various data formats as well as cutting-edge techniques for gathering the key elements of audio and visual data. The work is motivated by the holes that have been discovered.
4. Proposed Study
4.1. Proposed Framework
This segment provides a detailed explanation of the design and execution aspects of the suggested models. In Section 4.2, the focus is on implementing the edge and color detection models, while Section 4.3 expands on the comprehensive design and execution of the proposed IFGAN model. The proposed framework’s overall functionality is depicted in Figure 3. At the outset, a variety of sensors gather raw sensory data, which is subsequently subjected to preprocessing to rectify issues like extraneous data, data gaps, duplications, anomalies, and interference. The information is then categorized based on the file’s type as well as the information type. The designed attribute extraction approach is then used to gather the necessary characteristics. This study has organized the fusion strategies into two distinct stages. In the initial stage, following the extraction of features from various individual data formats, the individual data sources are initially combined to enhance their accuracy. Subsequently, in the second phase, a decision-level fusion process is executed. Before initiating the decision-level fusion, the modalities originating from different data formats are sequentially ordered, with each modality required to meet the proposed hypothesis before being integrated. Furthermore, a precise context is constructed using the fused data, from which immediate decision rules are derived for autonomous vehicles to make suitable decisions [26]. As discussed earlier, the major emphasis of this study is focusing on enhancing the previously proposed feature extraction and hybrid image fusion model [6]. Further modifications of the specified models help to handle all formats of image data, specifically 3D point cloud data, efficiently for advanced processing. Since most of the sensory data collected from advanced sensors are in the 3D point cloud data format, contributions achieved in this work play a vital role in optimizing the enhanced feature extraction models, along with the image fusion model, to efficiently fuse 3D point cloud data.
4.2. Proposed Feature Extraction Models
To enable efficient fusion, the study intends to extract four crucial aspects from the image data: color, edge, height, and width. For this purpose, two different models—one for recognizing edges and the other for identifying the color of the objects—have been devised. These models offer creative methods for precisely and successfully extracting the relevant image information.
4.2.1. Proposed Edge Detection Method
The research introduces a novel, tailored edge detection model based on the VGG-16 CNN. Along with the model, the research has proposed kernel functions for activating the model for detecting an edge in an image. The proposed VGG-16 model has five layers, of which one is the convolutional block, which contains four layers to perform various activities related to edge detection. The different colors in the arrow represent different activities assigned to the layers of the edge detection model. The initial red arrow signifies the inaugural layer responsible for translating image details into their respective grey-level representations. Subsequently, the green arrow, denoted by its green color, embodies the second layer, overseeing the filtering process. Moving forward, the blue and yellow arrows symbolize the third and fourth layers, dedicated to executing the edge detection task through the prescribed kernel function. Finally, the concluding brown-colored layer consolidates the outcomes, encapsulating the detected edge information gleaned from the input images. The initial step involves providing the 3D image as input to the model. Within the first layer, a Kalman Filter is utilized to normalize the image data. The normalized data is then passed on to the next subsequent layer, which incorporates the proposed kernel function to generate the edge response maps. The generated maps are up-sampled to the original image structure using bi-linear interpolation methods in the third layer. Contextual vertices are derived by performing a K-channel 1 × 1 convolution on the fourth layer, with each channel representing a binary edge map for a specific category. Figure 4 illustrates the mechanism behind the suggested edge identification architect. The mechanism behind the edge detection and the identification of semantic edges are explained in the paragraph below.
Our novel network adeptly integrates fine details from the lower layers with semantic information from the upper layers. The experimental results substantiate our approach’s ability to address conflicts stemming from various deep supervision methods. Unlike CASENet, our semantic classification at Layer-4 can be optimized without encountering any divergence issues. The binary edges generated by the lower layers aid Layer-3 in capturing fine details, ultimately enhancing the localization quality of the fused semantic edges. We use single-pixel wide logical borders to regulate Layers 1 through 4 and substantial conceptual limits to oversee Layer-4 and the final fused edges. If a pixel fits inside the conceptual parameters of any class, it is considered an edge. By calculating the variance amongst an image pixel and its surrounding pixels in the ground-truth semantic division, thick semantic borders are generated, following a similar approach to CASENet [27]. A tagged pixel, namely (k), is clarified as the class limit (k) if a minimum of one neighbor is present with a label (where ).
In our proposed approach, all the layer’s attributes are denoted as Z. Consider an input image that features a representation of a binary edge map, say . The image segmentation is performed using the following Equation (1).
where we have and and represent edge and non-edge ground-truth label sets. Let represent the expected activation value at pixel (i) for the side. The activation value produced by the model at pixel (i) is denoted as , where corresponds to the standard sigmoid function.
In the next operation from the segmented images, the edges of the images and their corresponding maps are identified and generated using Equation (2)
where is the activation value of the category of pixel (i). If the output of this function is equal to or greater than one, the corresponding pixel signifies an edge within a segmented image. Now, the map that represents the skeleton of edges associated with an image is generated using Equation (3). This is obtained by fusing Equations (1) and (2). The map is resized to match the dimensions of the original image via the use of the bilateral interpolation method. In a later stage, the resized map is compared with the original image to cross check whether the edges determined coincide with the original image. The difference indicates the accuracy of the edge detected.
In the next stage of the study, the semantic information of the edges has to be determined. This is performed using the following proposed mathematical functions. Each attribute of an edge is assigned a class label of the image, say . The detected edge is compared with the identified edge classes and, accordingly, the semantic information of the edge is determined. Apart from identifying the edge of an image, this strategy estimates the importance and meaning of the identified edge. The following Equations help to achieve this task. In the first task, the class label of the edge is identified using Equation (4). Figure 5 depicts the flow of the proposed edge detection and validation model.
In the next task, the actual meaning of the identified class label is estimated using Equation (5)
The actual semantic information is obtained by merging the identified class information related to the label with its position in the image. Equation (6) illustrates the above-mentioned operation
4.2.2. Proposed Color Detection Model
Figure 6 exemplifies how the suggested color-detecting approach works in practice. The focus is on a pivot pixel and the values of nearby pixels are contrasted to the gradient value, which is calculated using Equation (7). If the neighboring pixel value of the pivot element is equal to or greater than the gradient, the source value of the pixel is changed to one. Otherwise, if it is less than the gradient, the initial pixel info is changed to a value of 0. The pivot pixel’s true color value is provided by the ensuing digital bit sequences acquired from the submatrix. It is worth noting that the majority of RGB color values fall within the numeric range of 0–255.
The proposed edge detection approach is employed to determine the dimensions of the source image. The height of the picture can be determined by observing the starting and ending vertices which intersect at the image matrix column. The width of the picture can be estimated from the start and end vertex information, representing image matrices’ row information.
4.3. Proposed IFGAN Image Fusion Model
This section provides a summary of the initial efforts undertaken in our prior research, which served as the inspiration and driving force behind the advancement of the proposed IFGAN model’s development. The IFGAN model introduced in this paper integrates feature extraction and image fusion elements from previous studies [6]. In the forthcoming sections, we will underscore the significant concepts employed in this study to enhance the overall effectiveness of the IFGAN model. Figure 7 illustrates the image fusion model’s process employed in our previous research [6]. The first step involves normalizing the acquired 2D sentinel model using the weight mean filter method, which transforms two-dimensional pixel information into a three-dimensional representation. The 2D image is then further transformed into a 3D representation using sophisticated vector translations and matrix transforms. This study utilizes the QR() breakdown strategy to obtain the inverted matrix value of the multidimensional image data representing the actual source 3D image. The spectral strength of each wavelength is eliminated from the 2D sentinel and 3D pictures before starting the fusing process. The weighted mean filter method is used to find the average wavelength of intensity for both pictures, which serves as a global optimization operator to filter images while minimizing the edge blur. This operator swaps out the present pixel in the current frame with the weighted median of nearby pixels. As discussed above, key matrix and vector computations including projection, transformation, and transposition are used in the proposed hybrid fusion paradigm.
Figure 8 demonstrates the suggested enhanced image fusion model’s overall architecture. The previously suggested hybrid image fusion model [6] must be coupled with (ML) models to handle huge quantities of data collected from different sensors to make insightful conclusions. To achieve this objective, this extended work proposes a versatile GAN model, namely Image Fusion GAN (IFGAN). The model employs Equation (8) in conjunction with extended calculations as a kernel function to fuse the input image frames, trains the model using the fused results, and subsequently tests it to improve the precision of the acquired data. Ref. [6] discusses the detailed derivation of Equation (8). The IFGAN model is structured with five distinct layers. The initial layer is dedicated solely to the extraction of features. Subsequently, the second layer is geared towards the integration of standard 2D or 3D images using the previously proposed Hybrid Image Fusion model. Moving on, the third layer serves a dual purpose, either converting the fused 2D or 3D images into 3D point cloud data or concentrating on the fusion of 3D point cloud sensory data. Following this, the fourth layer focuses on discriminator tasks, while the fifth layer is responsible for executing the ultimate fusion tasks. The subsequent section elaborates on the specific final fusion activities carried out within Layer 5 of the IFGAN model. The primary objective of the extended approach is to enhance fusion accuracy to the point where there is a negligible distinction between the fused and source images. The proposed IFGAN model has two discriminators and one generator block. In the generator block, we design two multiscale attention blocks: one for the first image frame, and the other for the next successive image frame. The procedure repeats until we encounter an end-of-frame status. The multiscale attention blocks create image maps using the extracted image features. Further, they also help to obtain the foreground and background information of the collected image frames. Information collected from the multiscale attention blocks is fused in the Fusion Network block using the proposed kernel functions. The study includes two discriminators, discriminator_mage_frame_1 and discriminator_mage_frame_n, to calculate the image difference between the source image frames and the fused image frames. The difference measures the accuracy of the fused images.
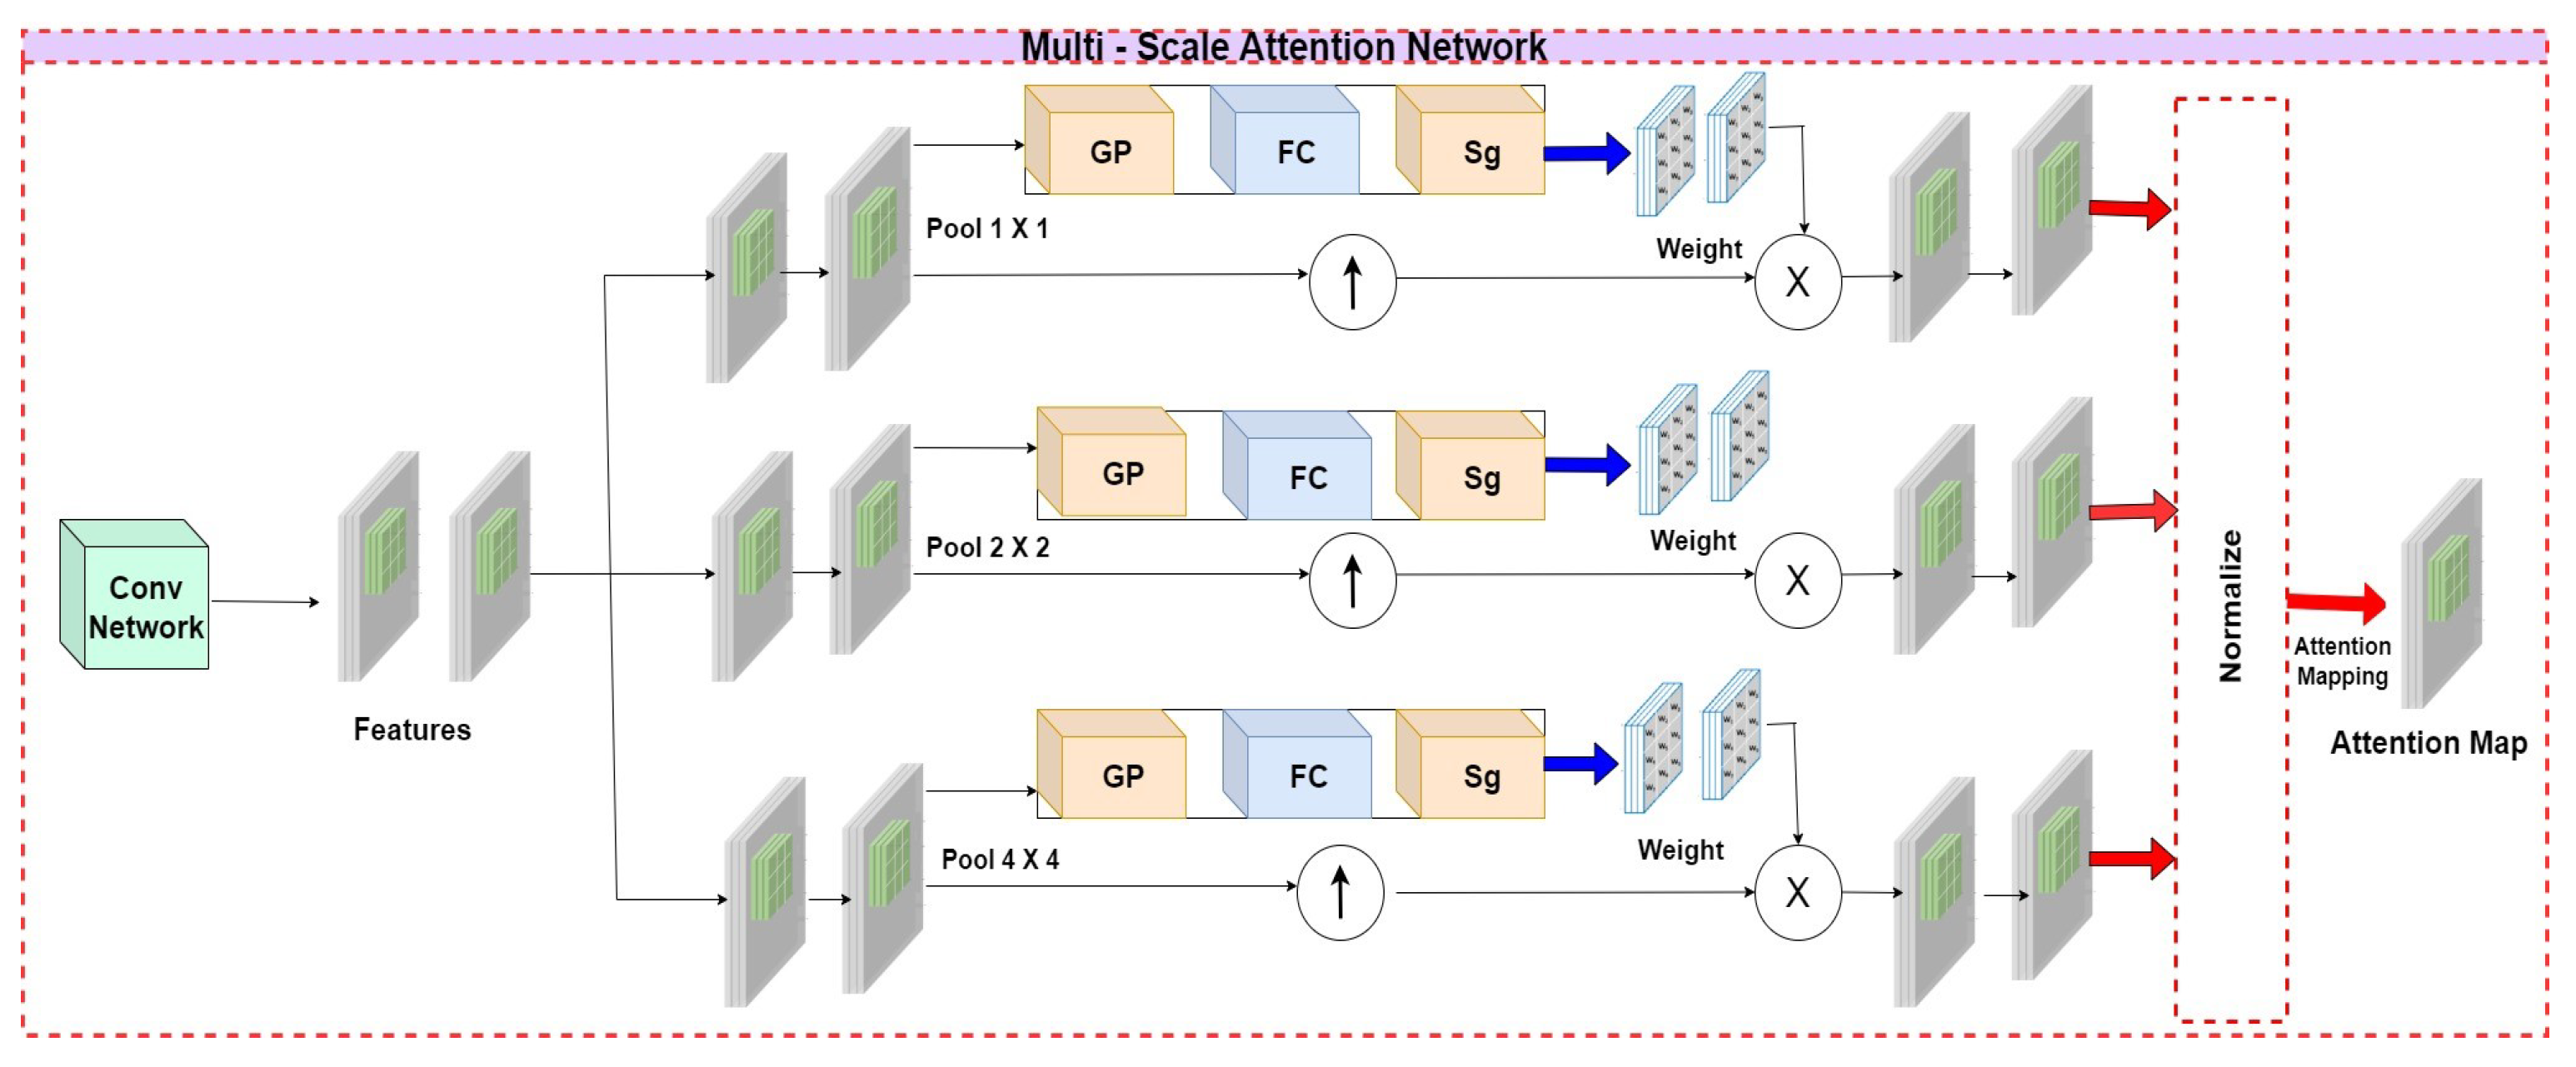
4.3.1. Architect of the Proposed Multi-Scale Attention Network and the Role of the New Innovative Loss Function
The objective of the Multi-scale attention network is to calculate an attention map that aids the generator and discriminators in emphasizing discriminative regions. Figure 9 illustrates the architecture of the multi-scale attention network. This network is integrated with the CNN model to extract features from the input images, with the last two activation maps selected as the deep features. Furthermore, as the source image often contains deformations of large objects, relying on a single-scale feature is insufficient for capturing all necessary spatial information. To address this, we introduce a multi-scale mechanism that captures features at various scales by using different kernel sizes and performing a generic average blending of features acquired at different stages. Additionally, this study does not solely emphasize the fusion of image data but also places significant emphasis on the fusion of alphanumeric, audio, and video data, individually. As a result, there is a need for a versatile model capable of accommodating and scaling all the diverse features extracted from various sources within autonomous vehicles. However, this causes a lot of distinct characteristics to appear after each grouping procedure, requiring a method to carefully emphasize significant traits while ignoring insignificant characteristics. Therefore, we encourage the network to discern how to adjust the weight of each feature representing different data modalities according to its extensive knowledge. The global information is obtained via a global receptive field after the global average pooling operation. The multiscale attention network is trained using Equation (9), where is the weight for the feature of of the pooling scale.
Let represent the results of the operation to pool worldwide averages on feature map . Subsequently, the weight is computed using the sigmoid function () and a layer that is fully connected . The dimensions of are , which indicates the mean value calculated across various modalities based on the feature that represents each distinct modality. By capturing the weight , we initially use an amplification operation on the multi-scale features to ensure their size matches that of the input. Following this, a channel-wise amplification is performed among and the features from an increased sample size, emphasizing highly prioritized attributes while disregarding the least prioritized. In light of this, we determine the value of the reweighted feature in each spatial location within a layer, considering the channel dimension, using Equation (10)
Through this process, the attention maps for each scale feature are computed using a normalization operation. To capture comprehensive spatial attention, the attention maps from different scales are concatenated along the channel dimension. Subsequently, we apply the max selection strategy to prioritize discriminative spatial locations during the attention mapping operation, resulting in the calculation of the final attention map.
Furthermore, in this study, a novel hybrid loss function is introduced to assess the information gain achieved by the IFGAN fusion method represented in Equation (11). Here, N denotes the total pixel count, represents the specific pixel value of the fused image, and denotes the individual pixel value of the source image in the first part of the equation. In the second part, represents the distance metric for the pixel value in the fused image, while signifies the distance metric for the pixel value in the source image. Further, () represents an adjustment parameter; through many trials, the adjustment parameter is assigned a value of 0.65, and , and denote the height and width of the image, respectively. This unique loss function combines elements from both FusionGAN and WGAN fusion models. FusionGAN employs the Jensen–Shannon convergence method, while WGAN utilizes the Wasserstein distance method to estimate the loss in fusion quality. The comprehensive hybrid loss function, as presented in Equation (11), comprises two distinct components. The initial segment of the equation pertains to the novel FusionGAN loss function, which measures the difference between the fused image’s pixel values and those of the source images. On the other hand, the second component introduces a fresh approach, the newly proposed Jensen–Shannon convergence method, which gauges the divergence between the pixels of the fused image and those of the source images. In the ideal scenario, where image fusion is executed successfully, both components should yield a difference of zero. Consequently, under these conditions, a difference of zero signifies that the source images have been effectively and accurately fused.
4.3.2. Architecture of the Discriminators
The proposed architecture of the Discriminators is illustrated in Figure 8. The primary discriminator seeks to identify the merged outcome from the initial picture frame, whereas the other discriminator aims to separate the combined outcomes obtained from its subsequent image frame. Although both discriminators possess the same network architecture, they have separate parameters. The discriminators should pay closer attention to the data contained in their attention zones during training. This is accomplished by introducing a multi-scale attention mechanism that directs the discriminators to concentrate on specific regions under evaluation as opposed to the entire picture fed as input. To create an attention map, the source image is specifically sent via the multi-scale attention network. This attention map is then concatenated with the input image along the channel dimension, aiding the discriminator in focusing on the most discriminative contents.
To improve the efficacy of the approach, the Wasserstein Generative Adversarial Network (WGAN) is employed to compute the Wasserstein difference between the original photos and the combined image. Unlike traditional GANs used for binary classification, WGAN treats the difference calculation as a regression problem and removes the logarithm function and the last sigmoid layer in the discriminator. The discriminator structure is presented in Table 2.
5. Experimental Analysis
5.1. Brief Overview about the Datasets
The study uses five major datasets, namely NuScenes, KITTI, TNO, the Bristol Eden Project Multi-Sensor Dataset (BEPM dataset), and the OSU Color Thermal dataset, to evaluate the proposed models. The NuScenes dataset [28] is a large-scale dataset specifically designed for autonomous driving research. It provides a comprehensive collection of sensor data, including LiDAR and camera images, along with accurate annotations for a wide range of driving scenarios. The dataset includes information gathered from several sites, taking into account various climatic conditions and different hours of the day. The KITTI dataset [29] is a popular benchmark dataset for computer vision and autonomous driving research. It stands for “Karlsruhe Institute of Technology and Toyota Technological Institute,” the institutions responsible for collecting and curating the dataset. The KITTI dataset focuses on various aspects of autonomous driving, including object detection, tracking, 3D scene understanding, and visual odometry. The dataset contains a diverse set of sensor data captured from a moving vehicle, including grayscale and color camera images, LiDAR point clouds, and GPS/IMU measurements. It covers different driving scenarios, such as urban environments, highways, and rural areas, and includes challenging conditions like occlusions, varying lighting conditions, and weather effects. Researchers and developers commonly use the KITTI dataset to train and evaluate algorithms for tasks like object detection, tracking, and 3D reconstruction in the context of autonomous driving. Its availability and established benchmark status make it a valuable resource for advancing computer vision and autonomous driving research. The TNO Image Fusion Dataset [30] comprises nighttime imagery captured in multispectral form, focusing on various military scenarios. These images are recorded using different multiband camera systems and are carefully aligned. The BEPM dataset [31] consists of two videos that feature a person dressed in camouflage walking through dense foliage. These videos include both infrared and visible footage and were generously supplied by the Rochester Institute of Technology (RIT) in the United States. On the other hand, the OSU dataset [32] contains a sequence of grayscale infrared images alongside corresponding colorful visible images.
5.2. Overall Analysis
Table 3 provides an overview of the software and tools utilized for the implementation and evaluation of the proposed models. The evaluation of the proposed models involved various categories of comparisons and Table 4 provides the primary criteria used to evaluate the effectiveness of the suggested image fusion models as well as other popular models. For training the proposed IFGAN model, 32 images from the KITTI dataset were initially selected. This dataset on its own lacked the necessary volume to effectively train a resilient model. To overcome this limitation related to dataset size, we augmented the dataset by applying a cropping operation to each image with a stride of 15, resulting in sub-images of size 240 × 240. This approach yielded a total of 25,200 images for training. During the training process of IFGAN, the discriminator was trained until optimality. A well-trained discriminator contributes to higher-quality gradients that are utilized to train the generator, ultimately enhancing the overall performance of the model.
To ensure a comprehensive evaluation of the fused results, a combination of qualitative and quantitative methods was employed. The qualitative evaluation methods rely on human visual perception to evaluate the blended image’s sharpness, focusing on factors such as goal comprehensiveness, average variance, and specific statistics. Conversely, the quantitative assessment procedures provide an objective assessment of image quality. To comprehensively assess the effectiveness of our approach, multiple metrics were assessed for all the fusion methods. Four representative metrics, namely mutual information (MI), entropy (EN), standard deviation (SD), and peak signal-to-noise ratio (PSNR), were selected. These metrics collectively provide a comprehensive assessment of the performance of our method.
5.2.1. Qualitative Analysis
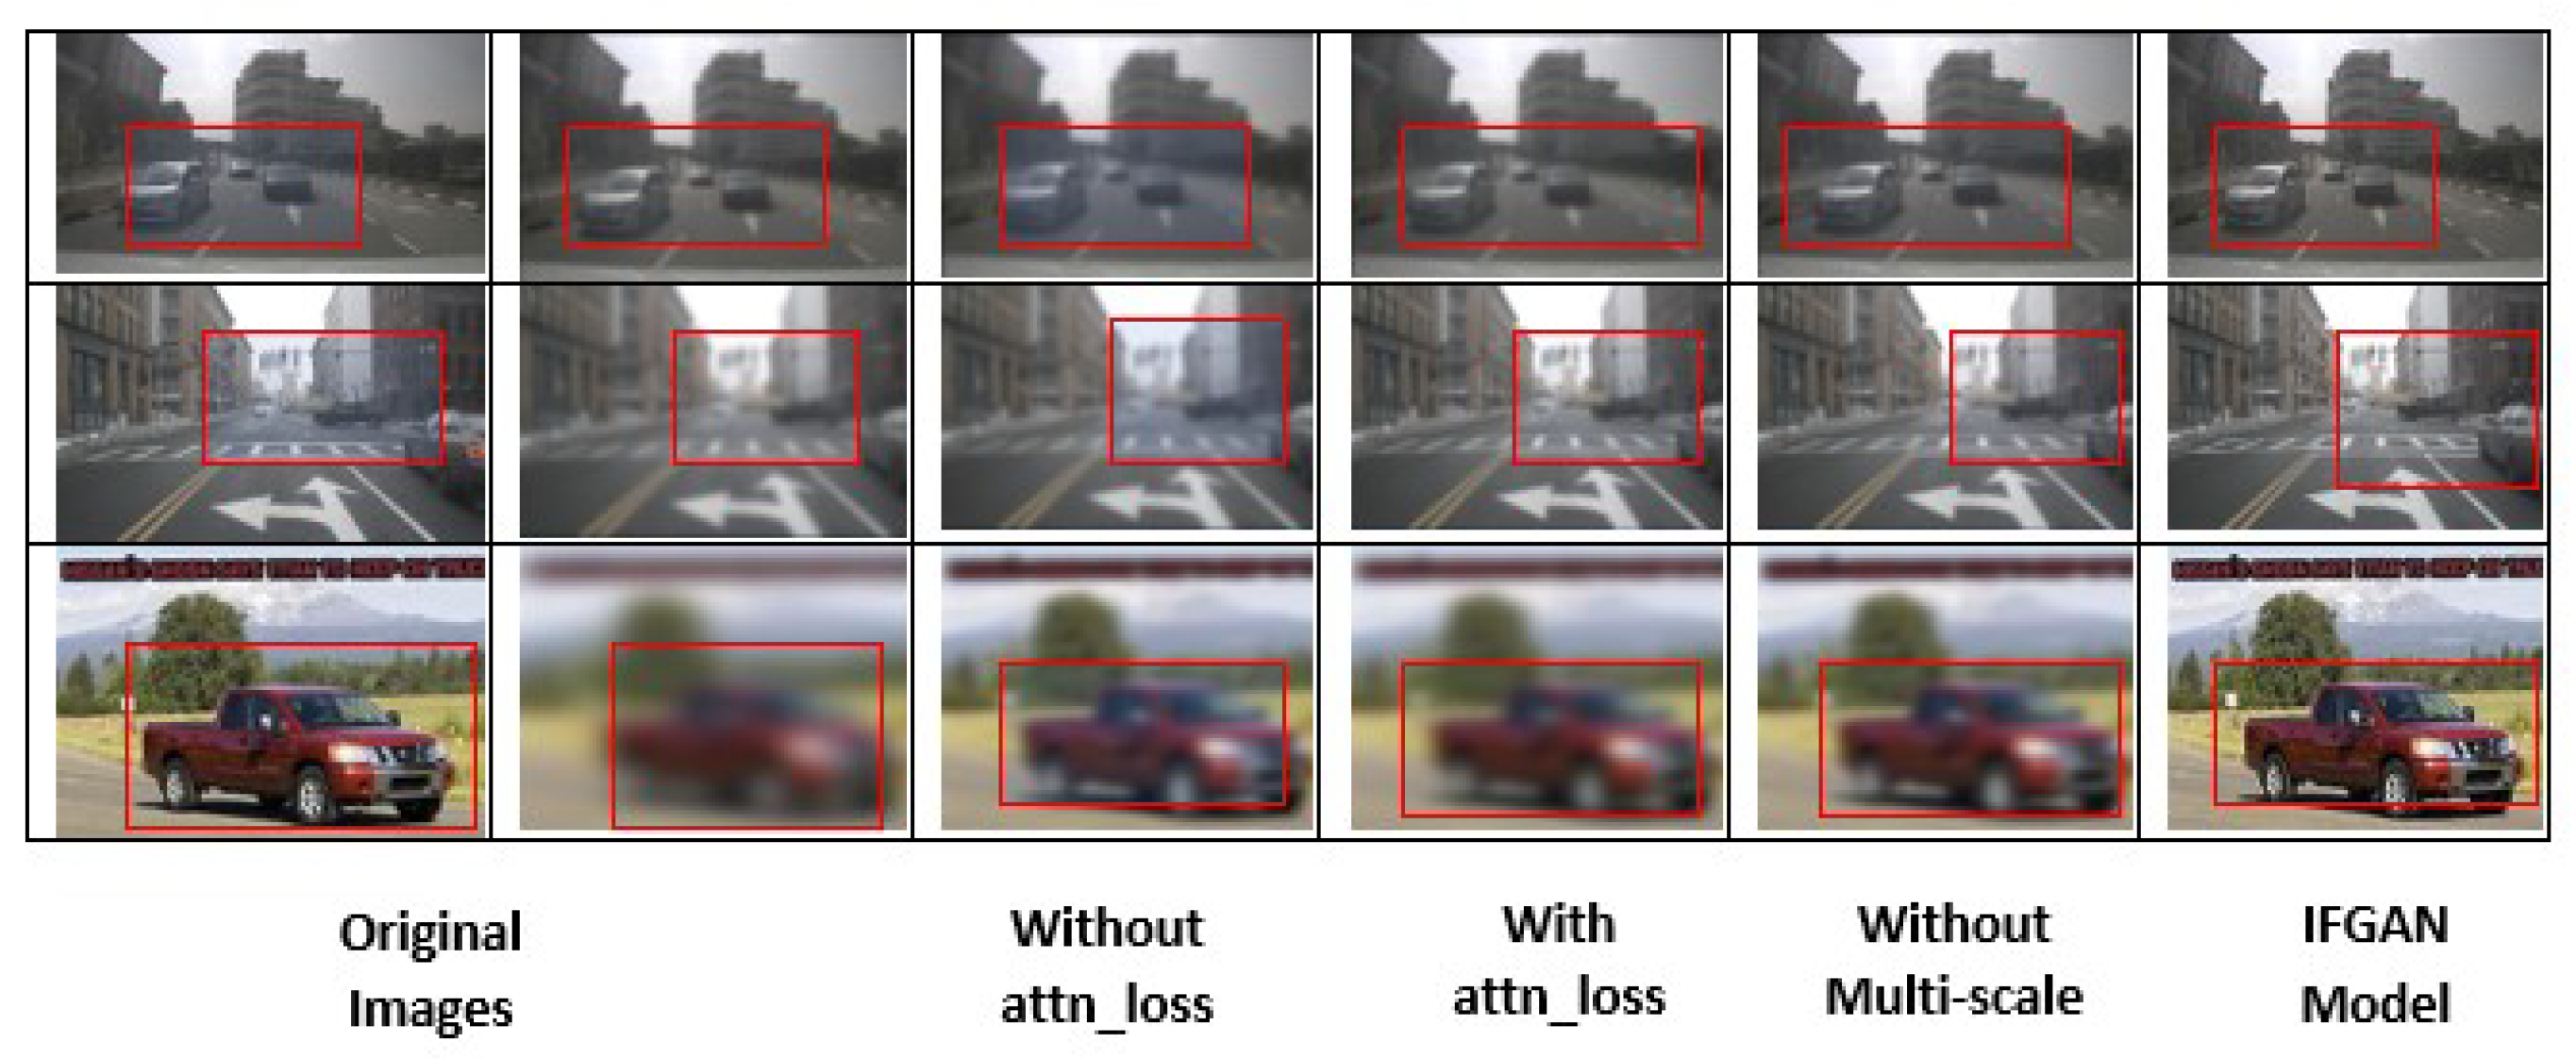
The proposed IFGAN image fusion model performance was evaluated under four categories, namely (i) without_attn_loss, (ii) Without_attn, (iii) Without_multiscale, and (iv) our full-fledged model, which includes all the categories. According to the results, our suggested method retains additional data from the source photos than the combined images. Moreover, the proposed approach preserves both foreground and background image information. Specifically, the results obtained using the Without_mutiscale option to fuse the images produce blurred the fused images, highlighting the importance of the proposed multi-scale mechanism of the IFGAN model. Nevertheless, there is an existing drawback in the method where attention regions are not adequately considered. For instance, the image contrast in the compared results is lower compared to our fused results. Contrarily, our approach maintains the general coherence of the objects while simultaneously enhancing the image’s dazzling areas. This observation demonstrates the performance of the multi-scale attention mechanism present in our discriminators. Figure 10 depicts the outcome of the merged images produced by integrating the proposed Multi-Scale Attention concepts. Sample images were taken from the OSU dataset to evaluate the same.
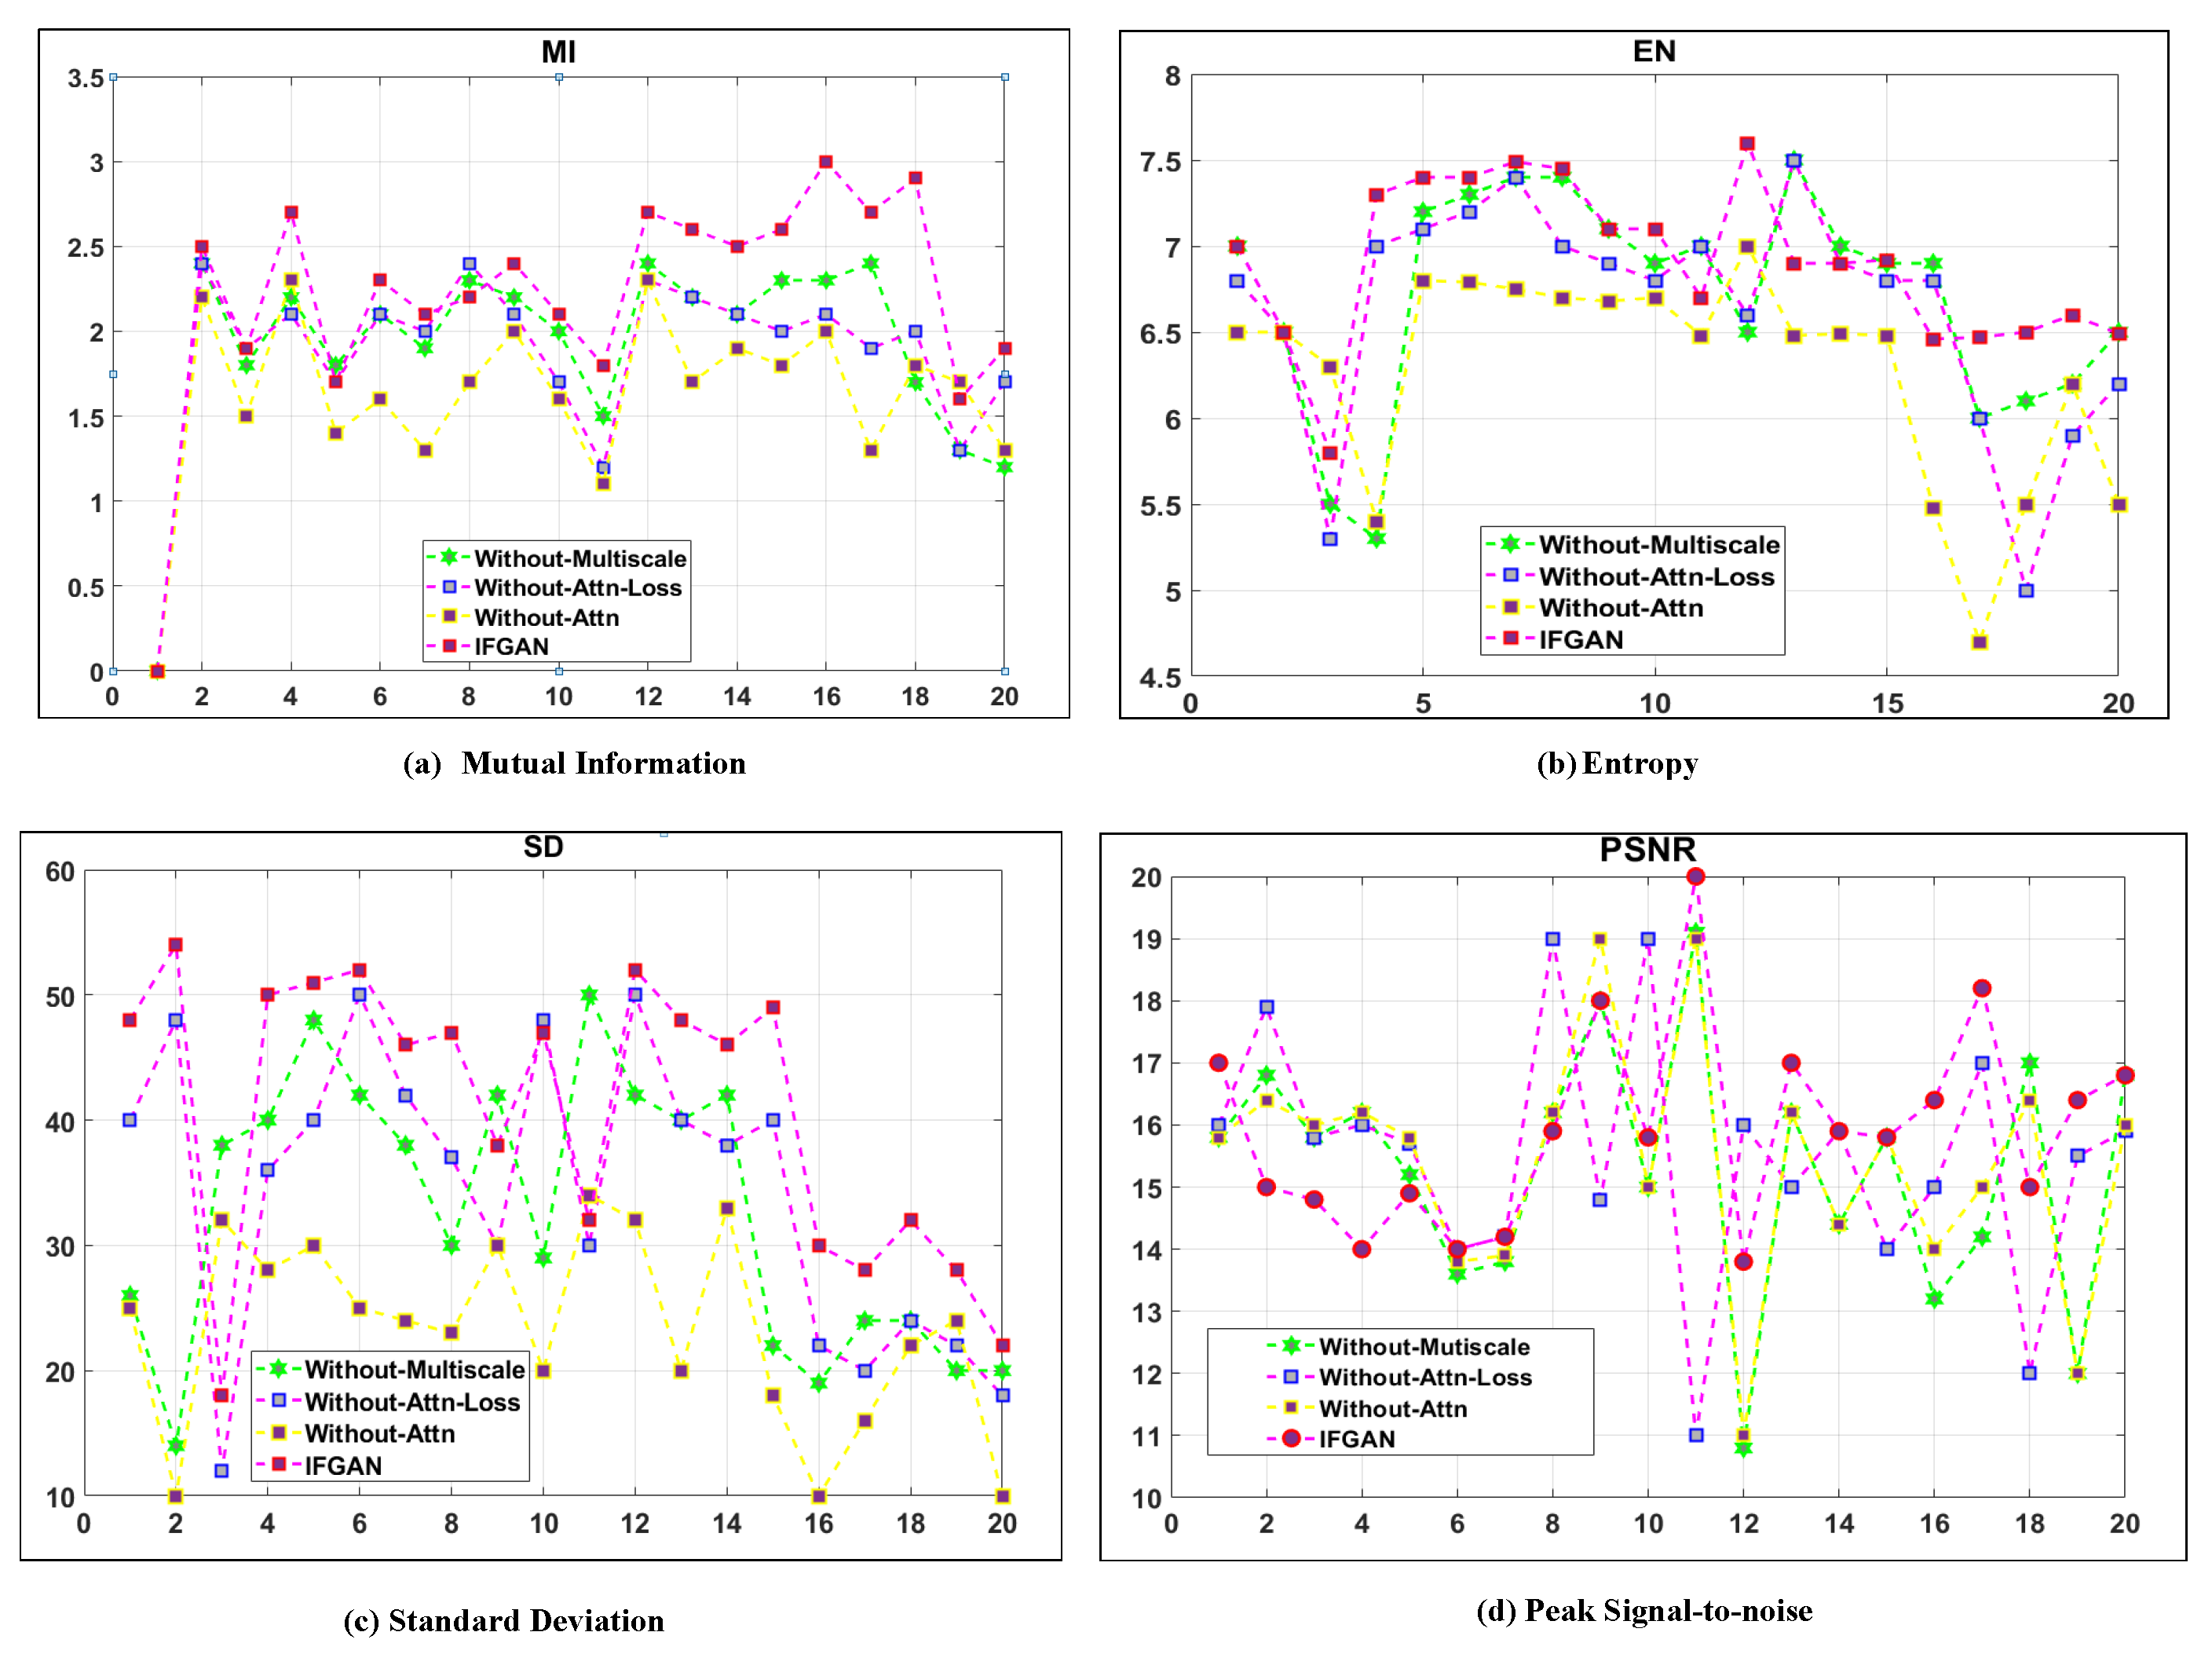
5.2.2. Quantitative Analysis
We have also conducted a quantitative comparison between our method and four ablation experiments. The results of this analysis can be seen in Figure 11. In terms of evaluation metrics, our method consistently outperforms the fusion models Without_att_loss, Without_att, and Without_multiscale, as indicated by the higher average values. This illustrates that our approach not only performs admirably in qualitative analysis but also produces superior outcomes in quantitative analysis. Hence, the qualitative and quantitative analyses of the ablation experiments confirm the importance of each component in our method, including the attention loss function, multi-scale operation, and multi-scale attention mechanism.
Qualitative Analysis with BEPM and KITTI Datasets
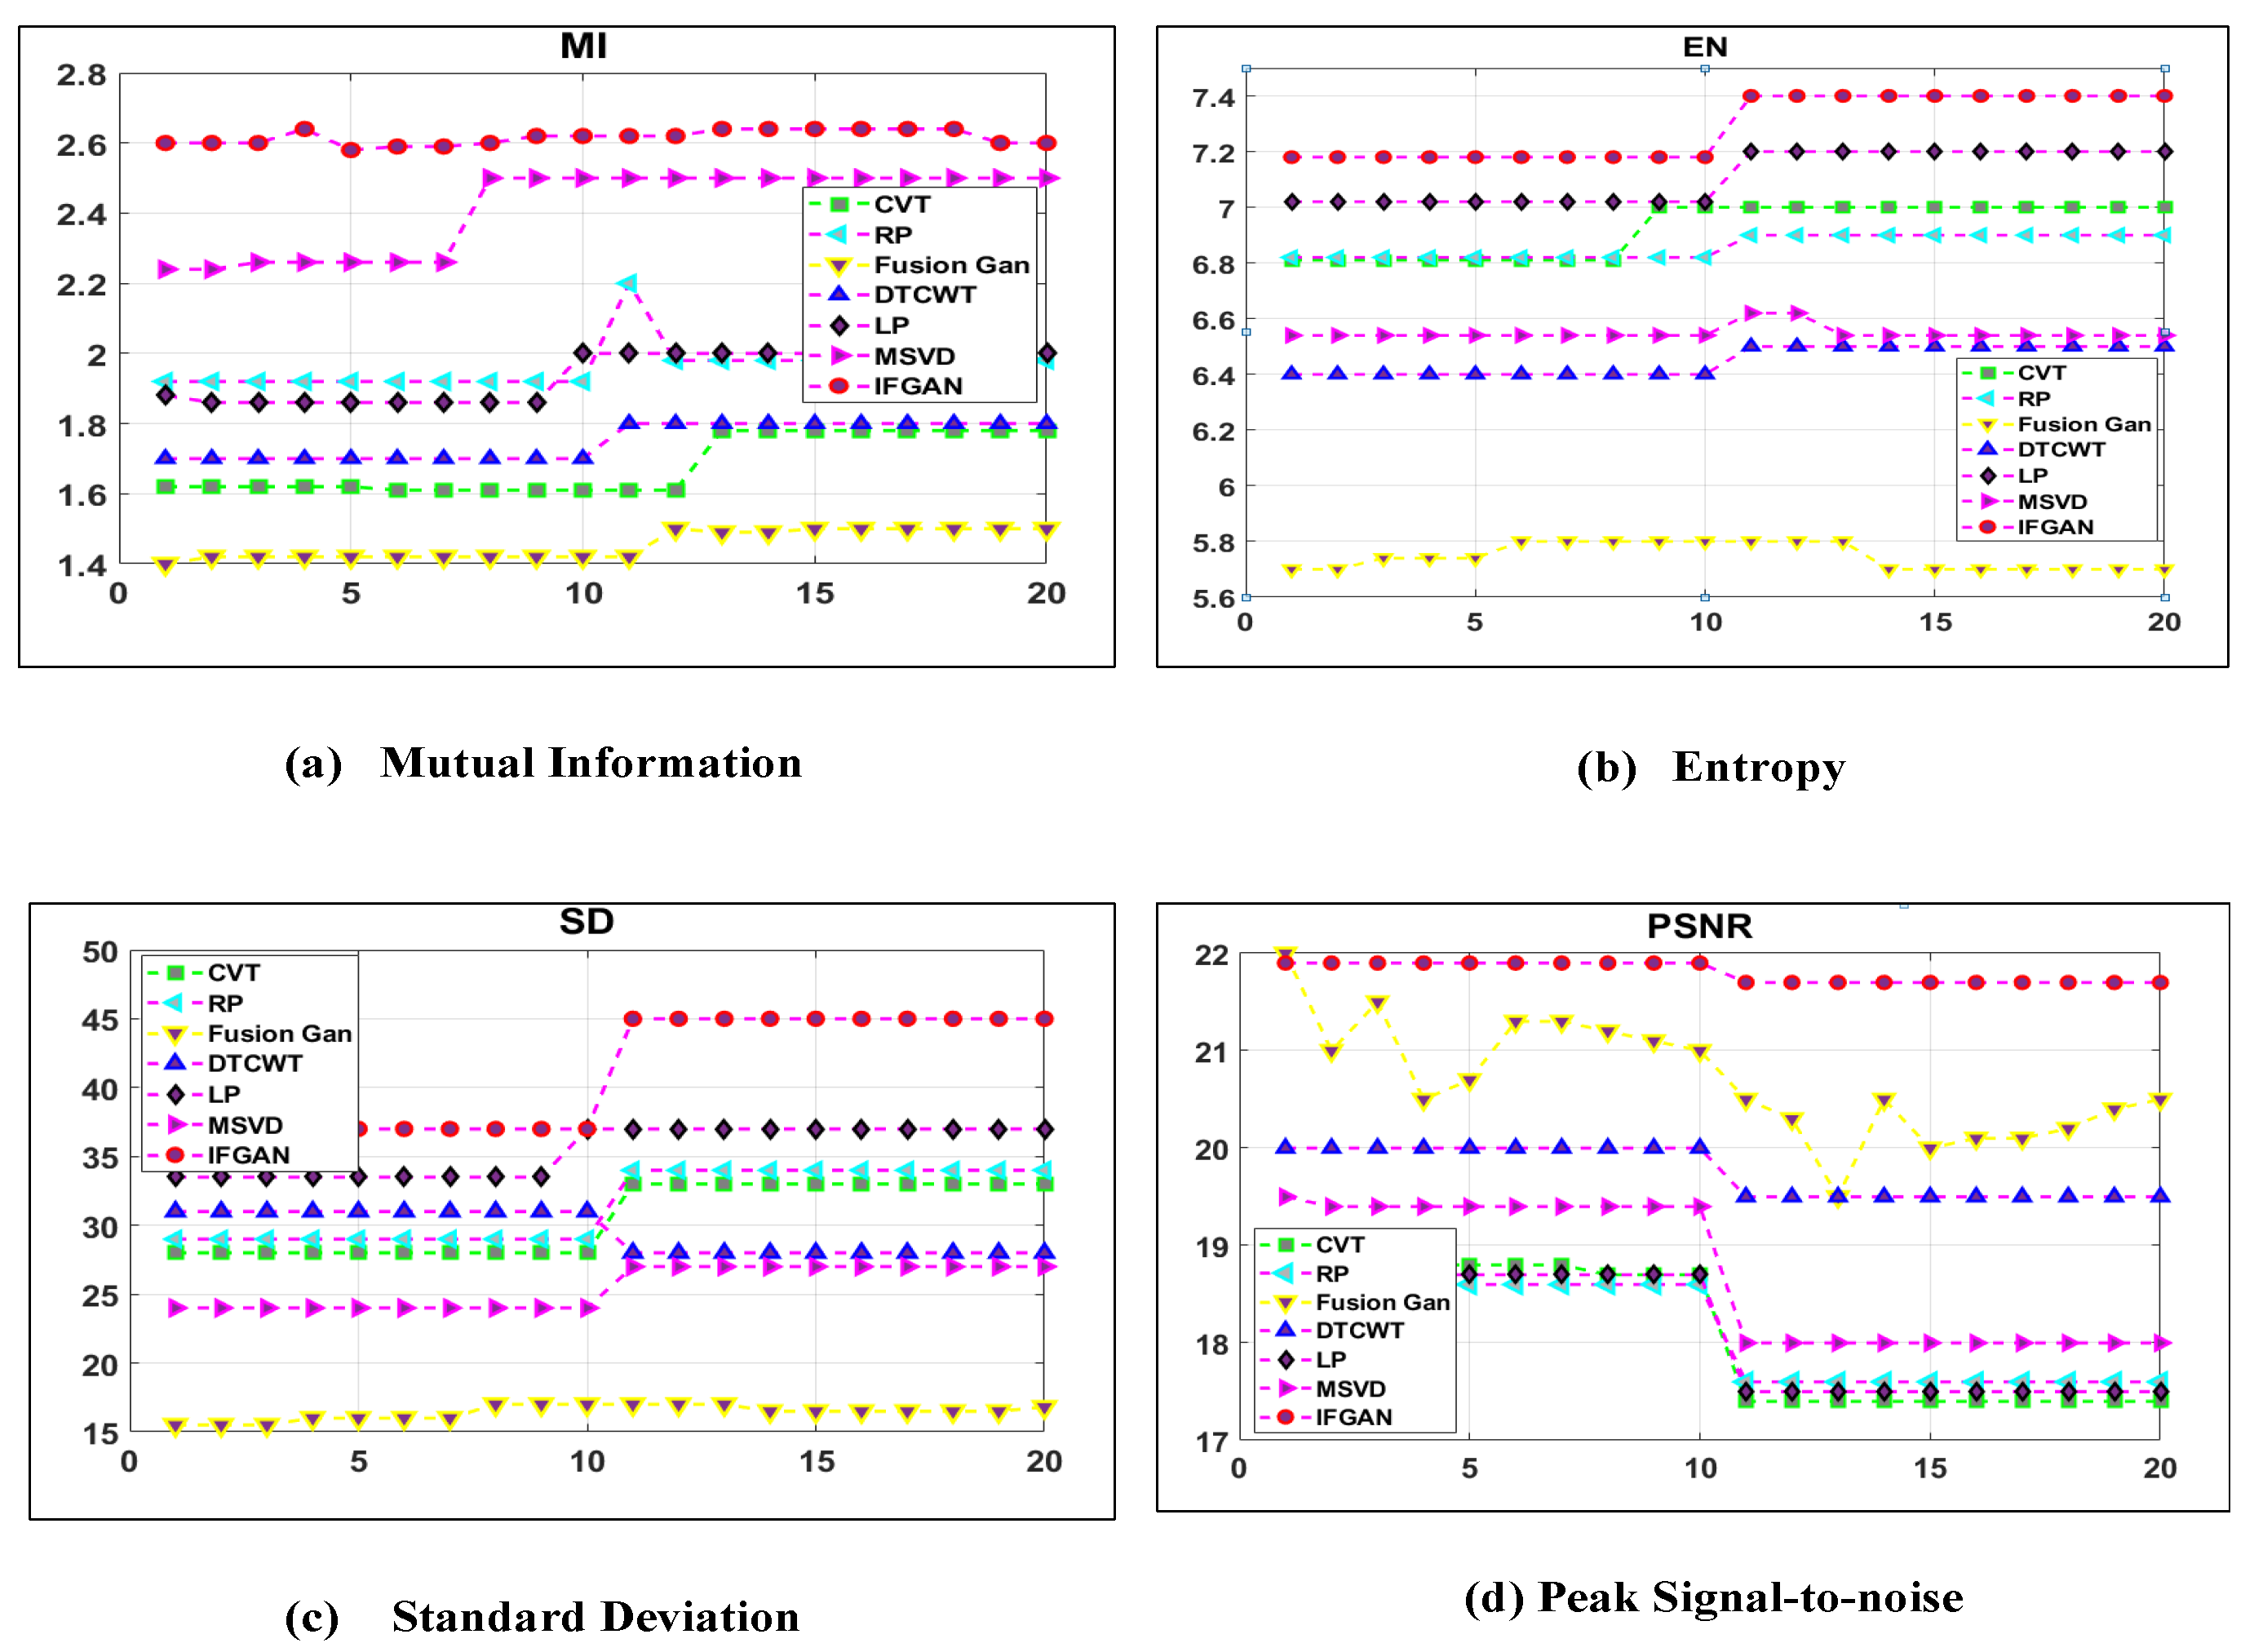
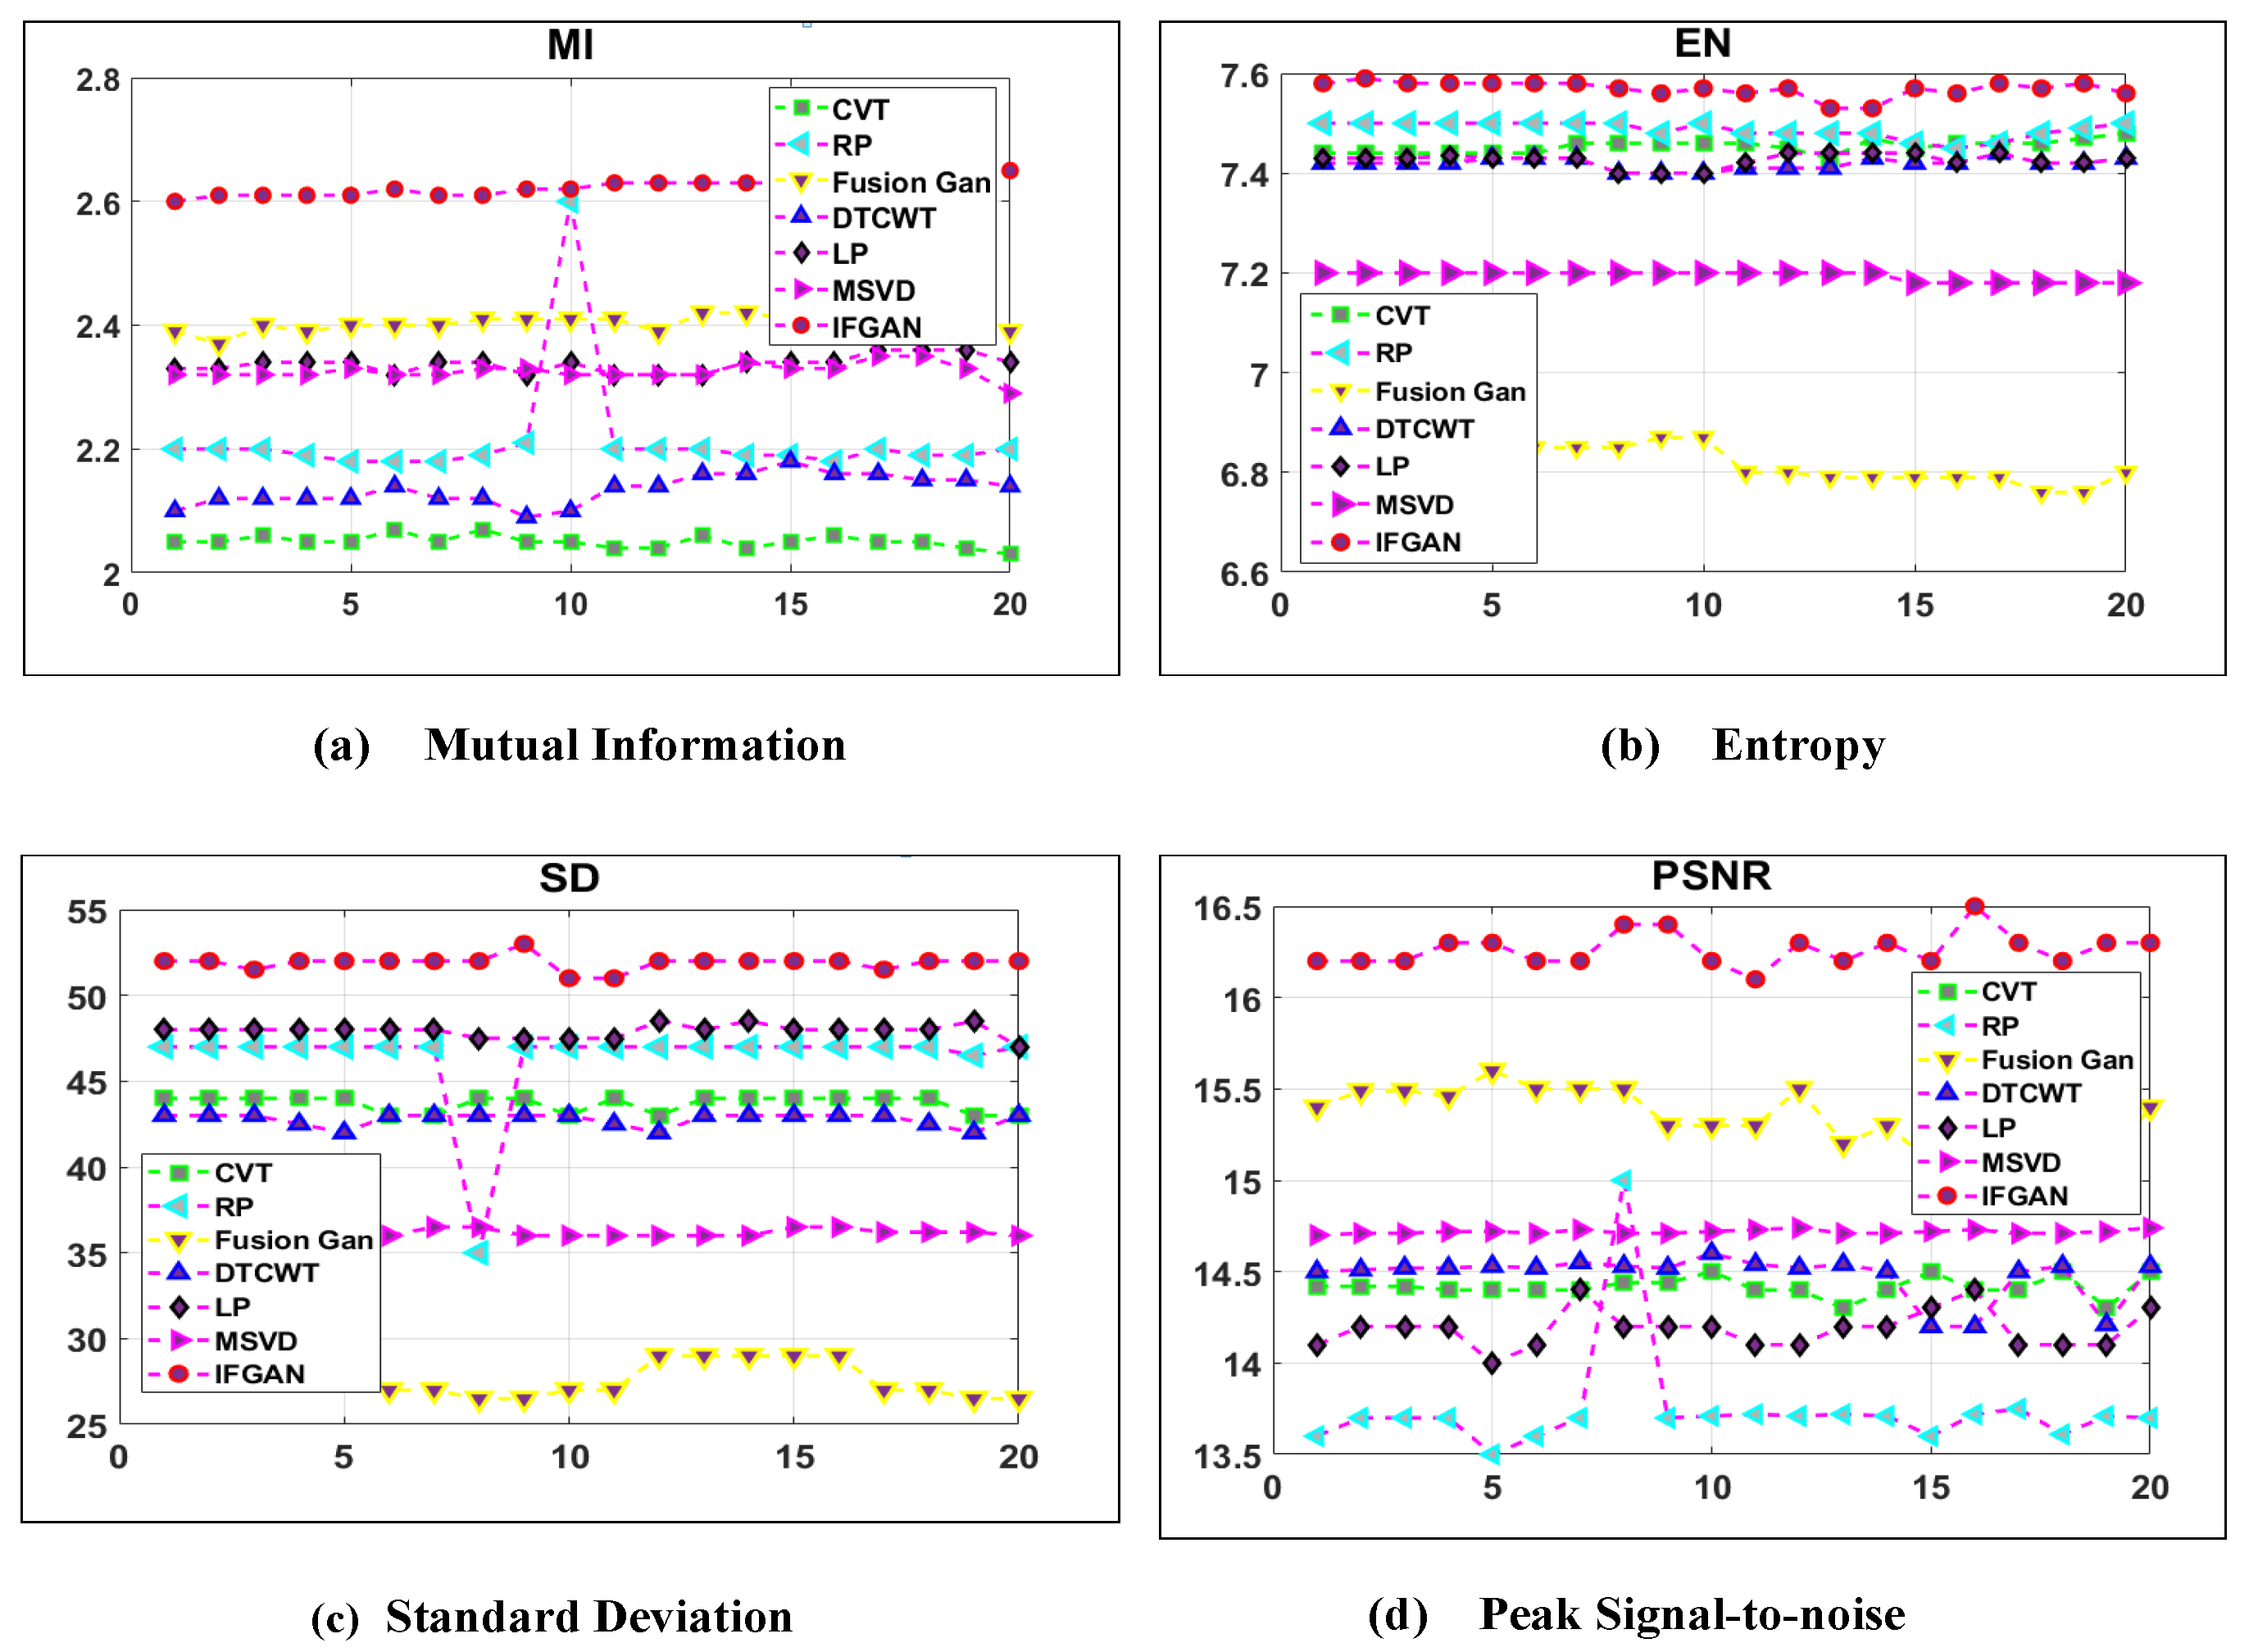
Our study further compared the performance of various image fusion models based on the four main metrics, namely (i) MI, (ii) EN, (iii) SDV, and (iv) PSNR, using sample images obtained from the BEPM and KITT datasets. Figure 12 depicts the superior performance of our method in terms of EN and SD, with only a slight deviation from the MSVD method in terms of MI. The quantitative analysis displayed in Figure 12 showcases our method’s enhanced visual effects, primarily attributed to its highest SD value. Moreover, the results exhibited in Figure 12 demonstrate our method’s capability to preserve a greater amount of information from the selected images. Additionally, Figure 13 illustrates our method’s improved performance in MI, EN, SD, and PSNR. Based on the observations, the proposed IFGAN model outperforms the other studies in terms of producing more accurate fused images.
5.2.3. Performance of IFGAN Model with Other Related Studies
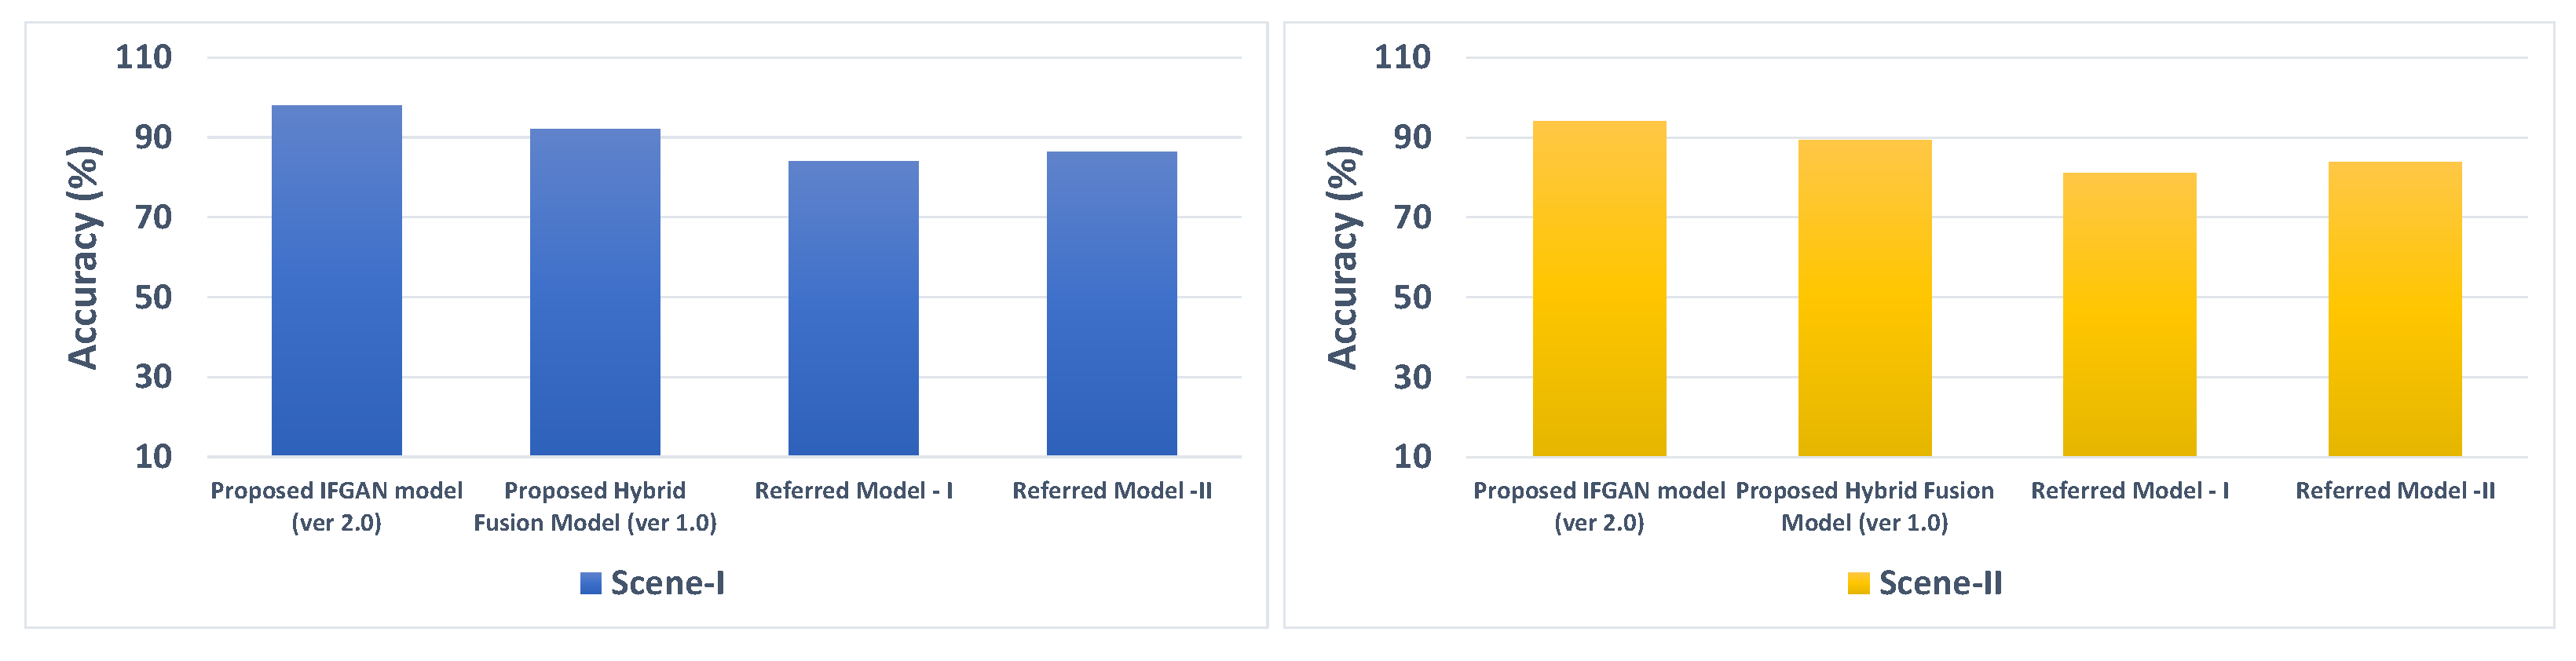
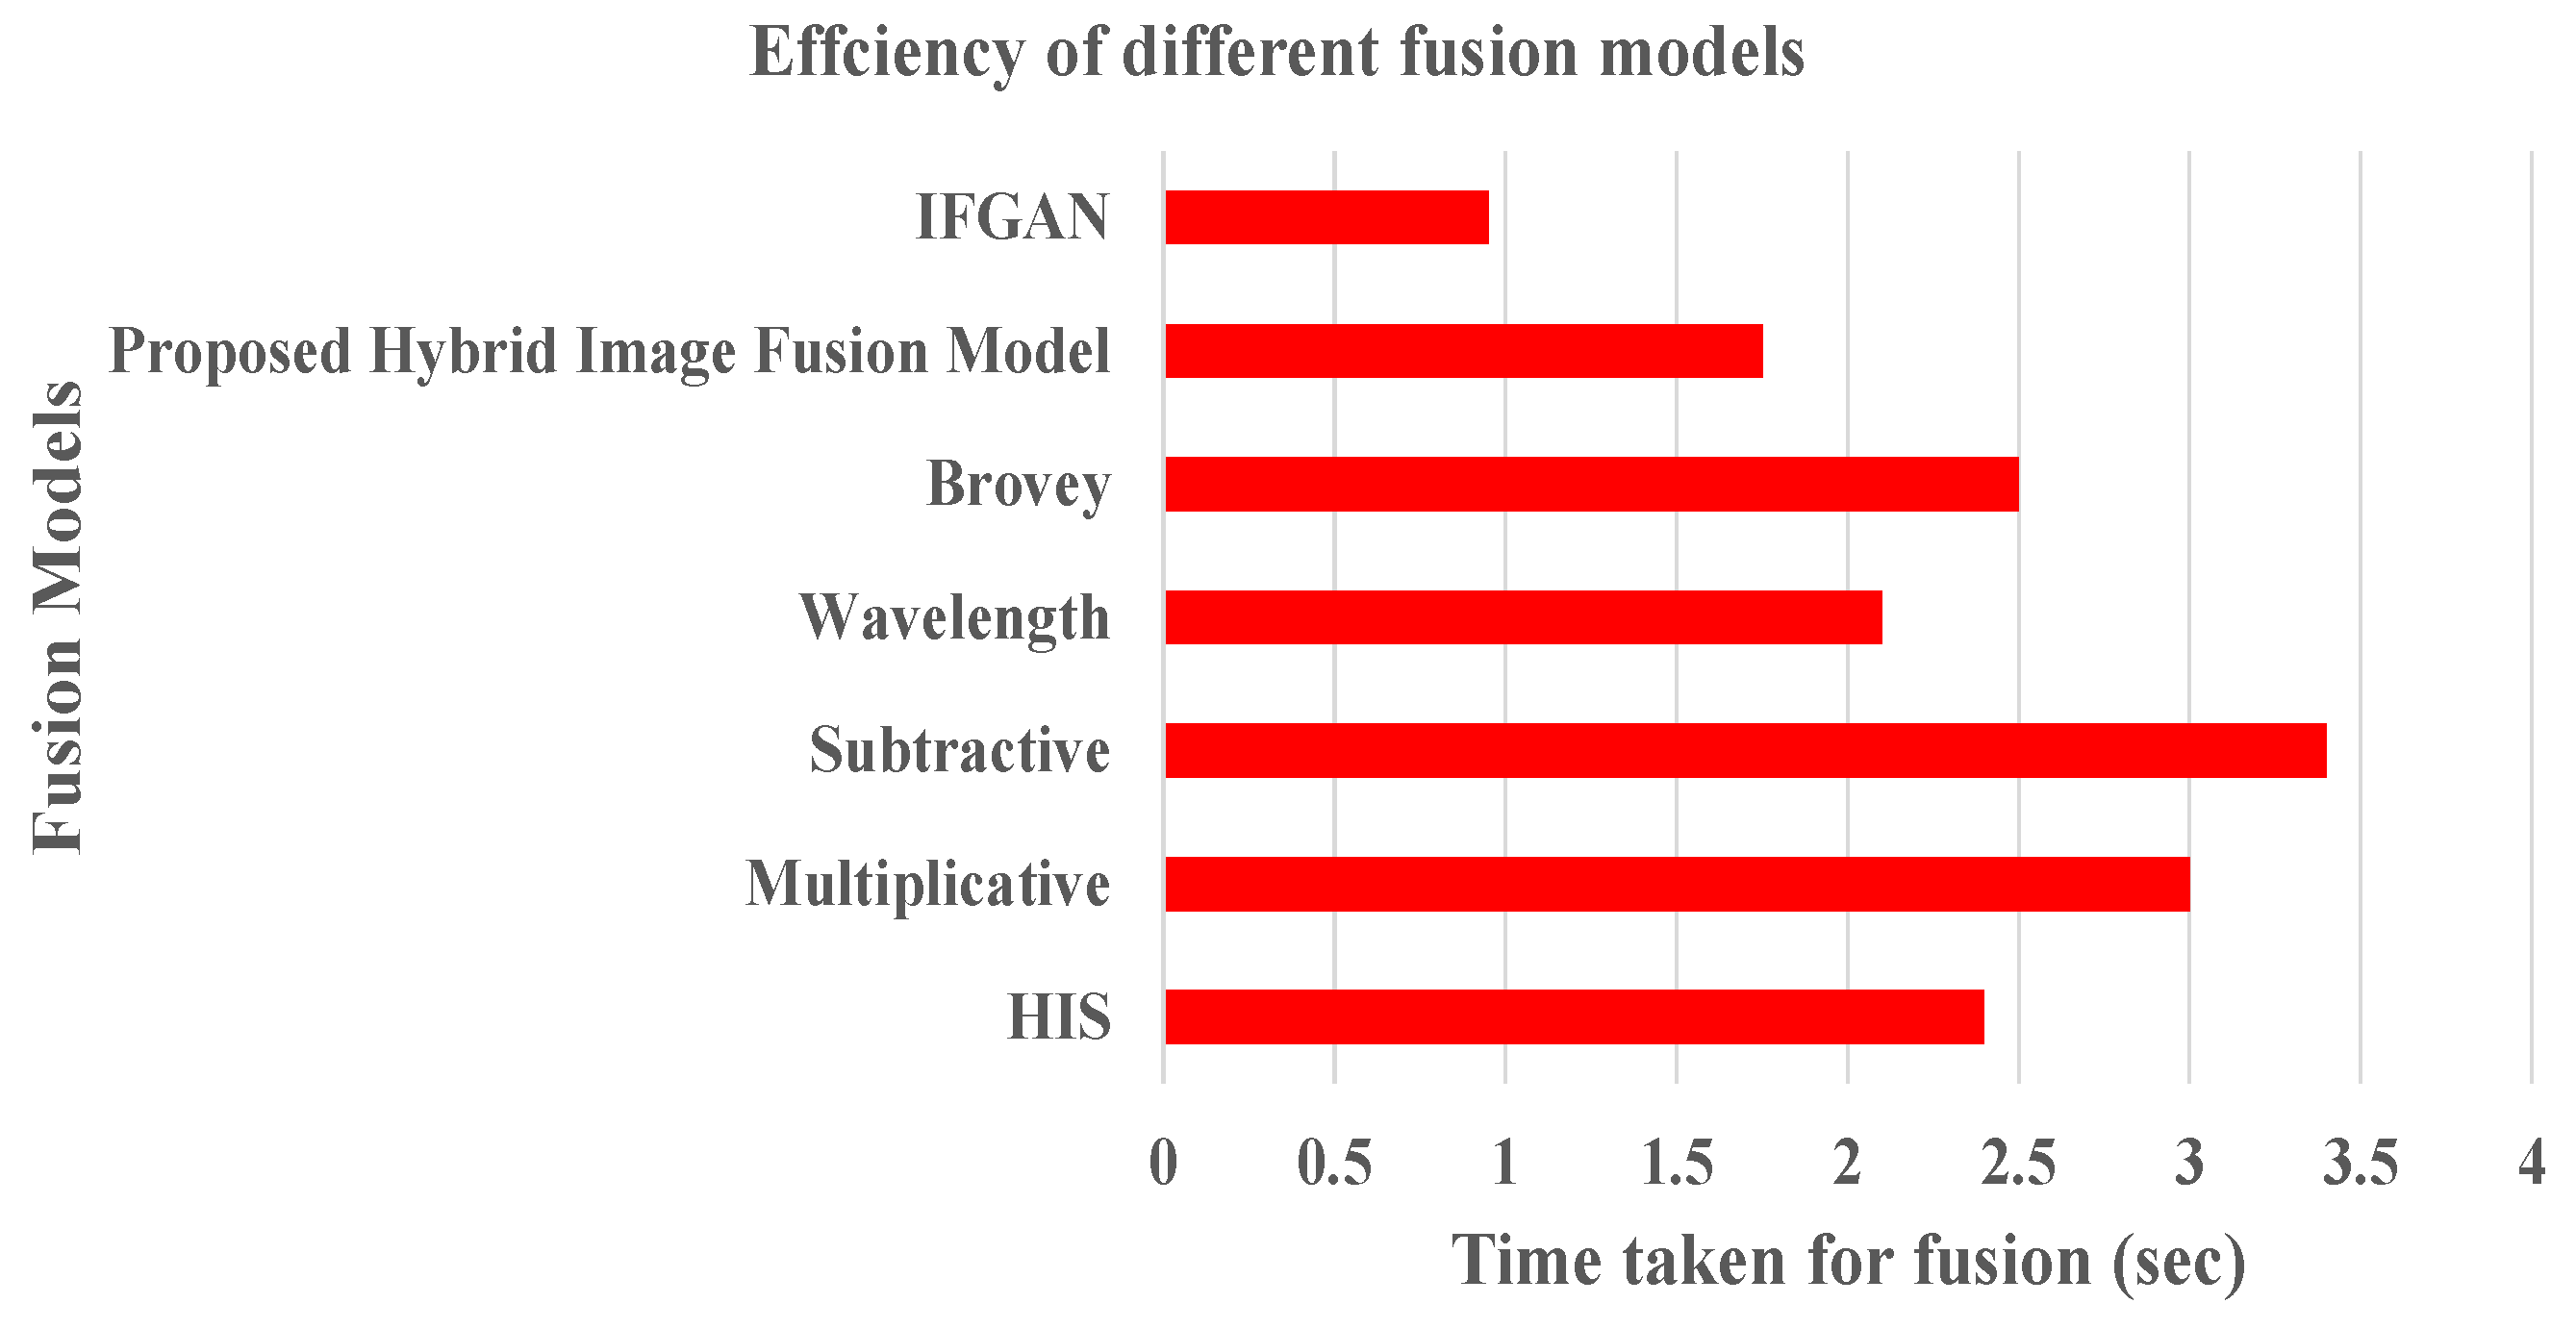
Furthermore, we conducted a comparative analysis between the proposed IFGAN model and the previously introduced Hybrid image fusion model [6], analyzing their findings in conjunction with those of other pertinent investigations such as Barrero et al. [33] and Talal et al. [34], which have employed hybrid methods to combine image data. Accuracy and efficiency metrics were used to evaluate the performance of the models. The accuracy metric is estimated with the help of Equation (12). Similarly, we evaluated the effectiveness of the fusion models by quantifying the CPU time necessary for image fusion. This assessment was performed for the IFGAN model, the initially proposed hybrid image fusion model [6], as well as for numerous other popular image fusion models. The outcomes, depicted in Figure 14 and Figure 15, clearly demonstrate that the proposed IFGAN model achieves higher accuracy and efficiency compared to the previously proposed hybrid image fusion model [6] and other popular fusion models. The proposed IFGAN model achieves accuracy levels exceeding 98% when fusing images with low resolution and clarity. Moreover, the IFGAN model exhibits faster execution times on the CPU for image fusion compared to the other referenced fusion models.
5.2.4. Performance Comparison of IFGAN with Other Image Fusion Models
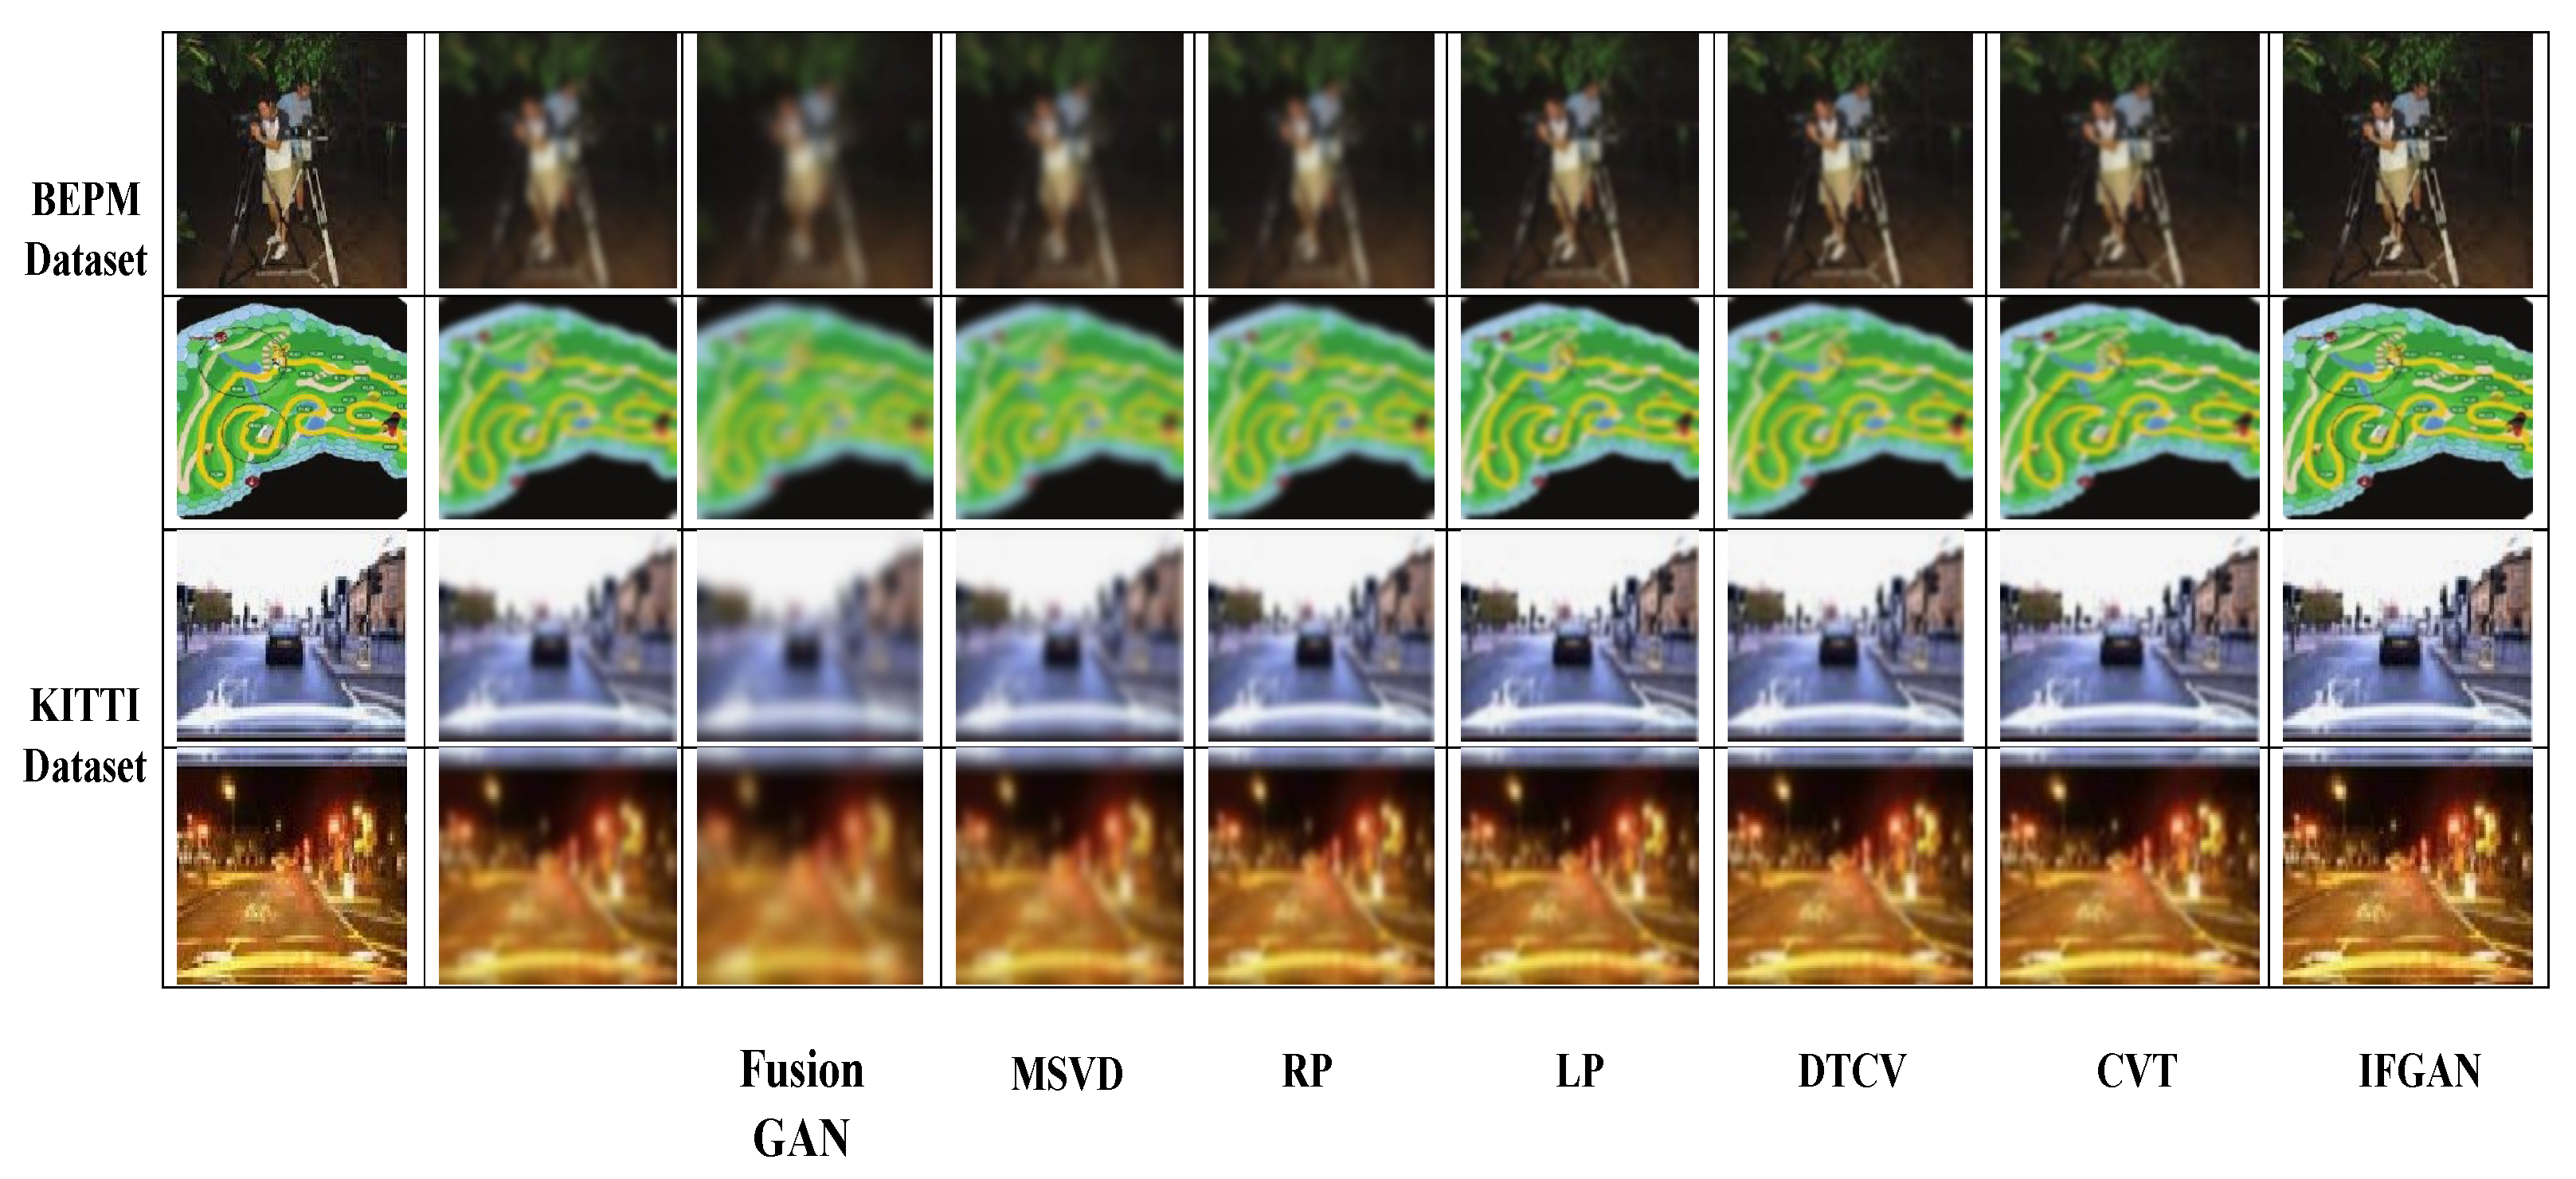
In the subsequent evaluation, we assessed the efficacy of several image fusion models in comparison to the IFGAN fusion model we put forth. Images were obtained from two popular datasets, namely the BEPM and OSU datasets. The fused results were obtained using CVT [35], DTCWT [36], LP [37], RP [38], MSVD [39], FusionGAN [40], and our proposed IFGAN. Based on the observations made in Figure 16, it becomes evident that our approach excels at preserving comprehensive details and distinctive characteristics derived from the viewable picture. Consequently, our analysis exhibits an unobscured backdrop enriched with textural details, as exemplified by the foliage details in the initial pair of two fused results and the facts about the campus’s terrain in the final two fused outcomes. Furthermore, our approach effectively retains the thermal radiation while enhancing the visibility of targets present in the sample images, as illustrated by the improved depiction of the individual in the images. These findings serve as evidence of the advantages offered by our IFGAN, as it succeeds in retaining a greater amount of destination details and capturing the common backdrop information and attributes originating from the original pictures. From Figure 16, it is evident that the proposed IFGAN model has outperformed the performance of other referred models in terms of both accuracy and efficiency.
Using well-known measures like AG, SF, and CC (refer Table 4), the results of the suggested and referenced picture fusion methods were assessed. For evaluation, three samples of combined images obtained from various image fusion models were chosen. Metrics that were not used in the initial evaluation were employed to assess the performance of various image fusion models. The IFGAN model showcased superior performance when compared to other widely-used fusion models, as well as the hybrid image fusion model introduced in our previous research, as shown in Table 5. The visual manifestation of these parameters is observed in Figure 17. The time taken by each method was calculated to assess the computational challenge of the strategy. Table 6 presents the average time consumption across five datasets. Our method and FusionGAN were executed on a GPU, while the other comparative methods were executed on a CPU. From the results portrayed in Table 6, it is abundantly obvious that, in terms of time efficiency, the suggested IFGAN model performs better than any other image fusion model.
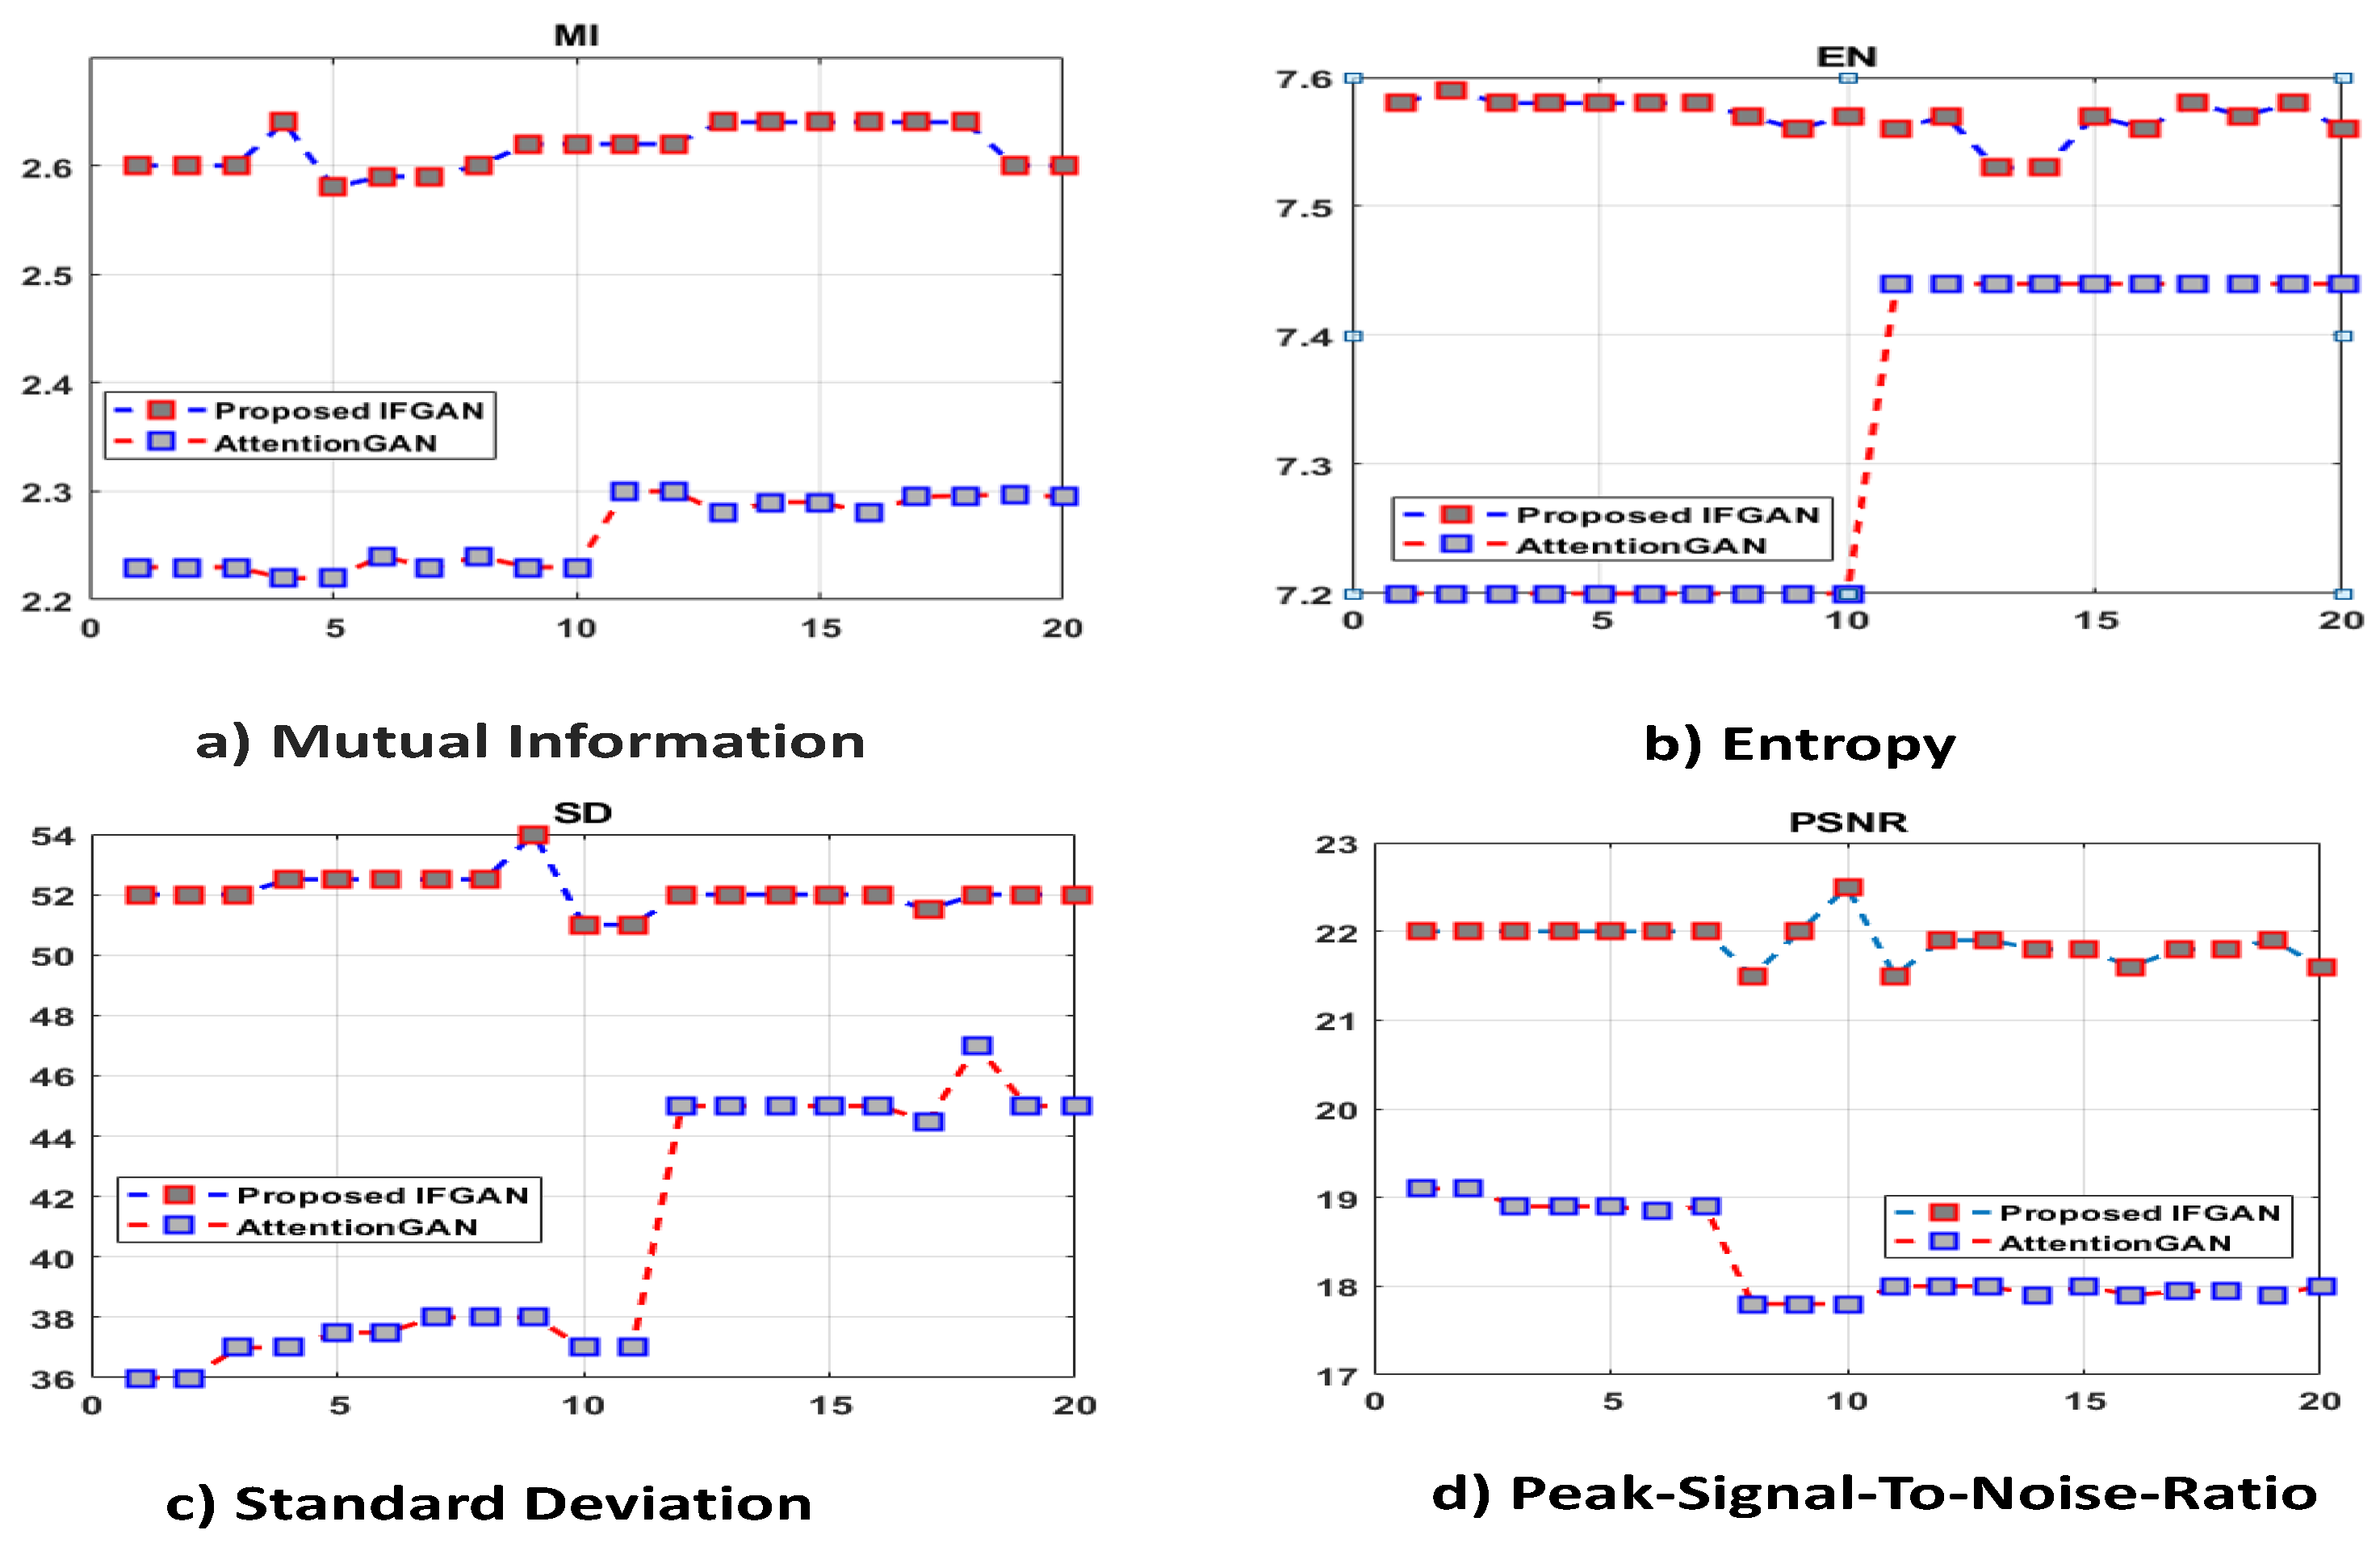
Similarly, we conducted a quantitative performance analysis, comparing our IFGAN model to the AttentionGAN model introduced by [41], using a subset of 20 images collected from the OSU dataset. We assessed their performance based on four metrics: Mutual Information (MI), Entropy (EN), Standard Deviation (SD), and Peak signal-to-noise ratio (PSNR). The results of our investigation indicate that the IFGAN model outperforms the AttentionGAN model in terms of image fusion quality. The graphical representation of these results can be seen in Figure 18.
5.2.5. Performance of Proposed Edge Detection Model
To assess the effectiveness of the novel edge detection methodology that has been proposed, a comprehensive set of experiments was conducted. Initially, four sample images were selected from the nuScenes dataset and various widely used edge detection models were applied to detect the edges of specific objects, such as cars, people, and trees. The accuracy and efficiency of the edge detection models were evaluated using the F-measure score, which quantifies the precision of edge estimation. The FScore values for the selected images obtained from different edge detection models are presented in Table 7. The suggested edge identification approach was also contrasted with other widely employed models that integrate important characteristics of KFA (Kalman Filtering) and Sobel and Prewitt. To assess accuracy, the root mean square error (RMSE) information of the pictures generated after edge identification was estimated. Higher picture restoration efficiency is demonstrated by reduced RMSE scores. The proposed edge detection model exhibited superior accuracy when compared to the previously suggested edge detection model [6] and various well-known edge detection models. The RMSE values, computed using Equation (13), are provided in Table 8 for various images. The results substantiate the claimed edge detection model achieved lower RMSE values, indicating enhanced precision in image reconstruction compared to other prevalent edge identification techniques. Overall, these findings highlight the superior performance of the proposed approach in generating high-quality images compared to the previously proposed edge detection model [6] and other prevalent edge identification techniques.
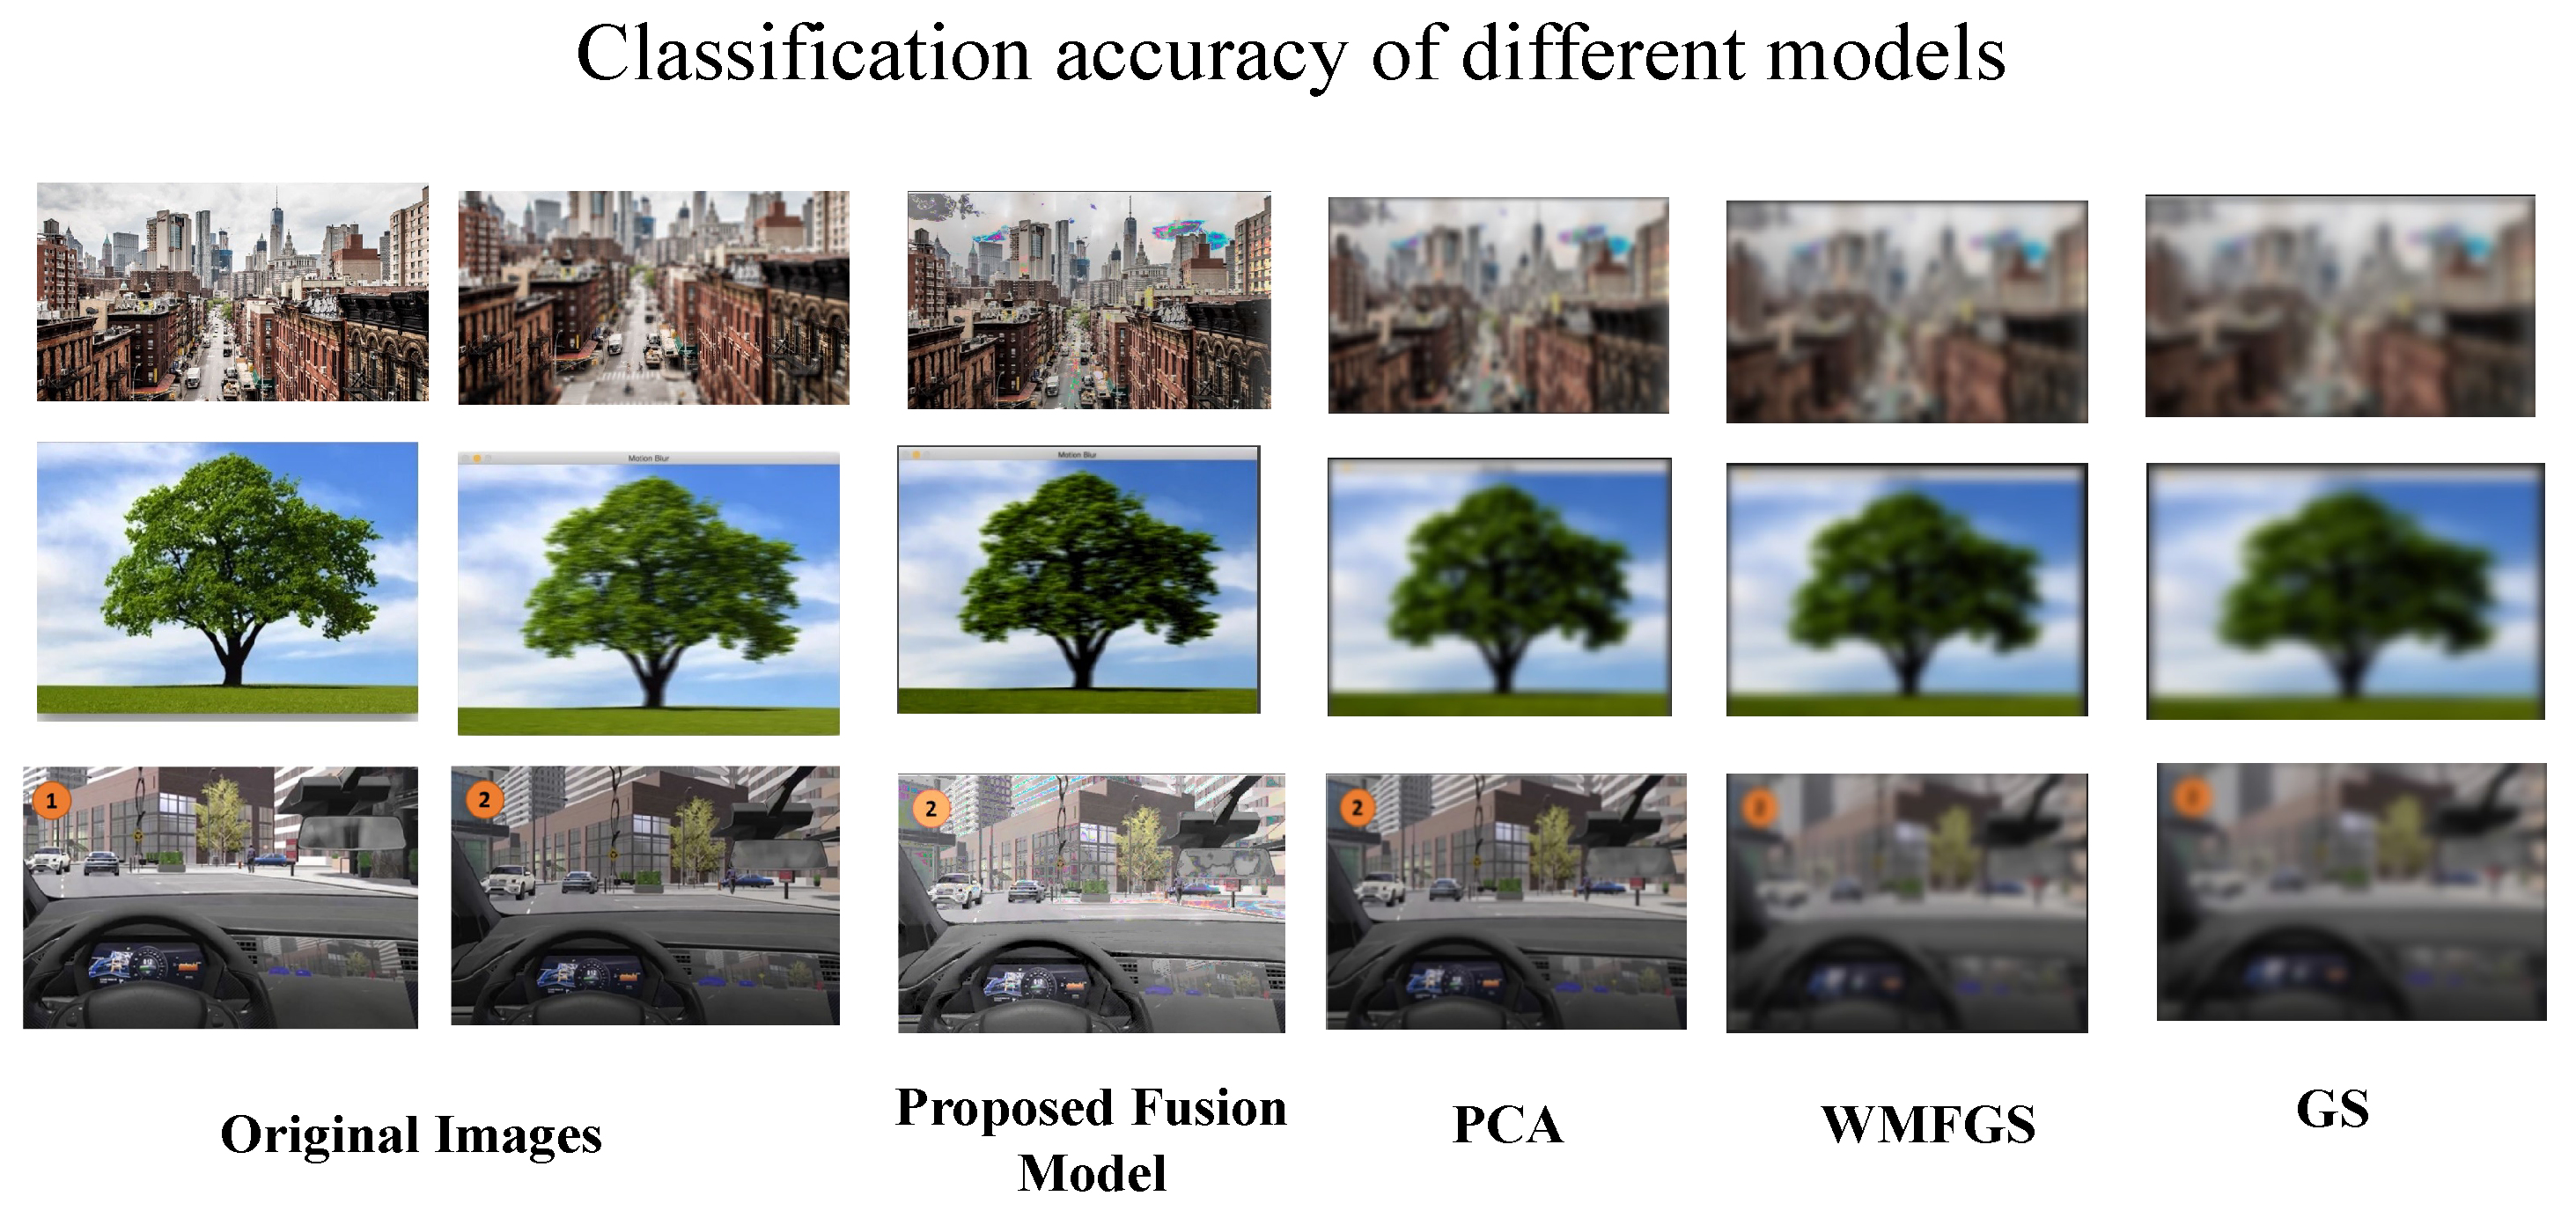
To assess the classification accuracy of fused images generated by different fusion models (PCA, WMFGS, GS, and the proposed approach), advanced machine learning models were employed. Figure 17 provides a visual representation of the distinct classifications obtained. To identify the combined pictures acquired by executing the four fusion models, an advanced CNN model utilizing the Random Forest (RF) classification technique was used. The CNN model has three unique layers to perform three vital tasks, namely data pre-processing, image fusion, and categorization. The suggested edge detection approach and hybrid image fusion architect are transformed into appropriate kernel functions, which are subsequently executed within the first two levels of the CNN model. The Random Forest classification model, known for its effectiveness in handling alphanumeric data, was chosen for evaluation purposes. A sample dataset of one thousand fused images was used, considering seven hundred samples for training and three hundred samples reserved for testing the RF model. The following procedures were taken to construct the CNN model’s infrastructure: gathering information, and then preliminary processing of data. Subsequently, the RF classification model was implemented using Python packages (sklearn and NumPy) for modeling and evaluating the fused results obtained from the above-specified image fusion models.
The correctness of categorization is evaluated using a confusion matrix. Various trained fusion models were employed to test the correctness of the combined images, and the results showed that the suggested IFGAN model performed more accurately than other fusion approaches. Table 9 shows the outcomes that were achieved.
6. Conclusions
Researchers focusing on innovative AV solutions prioritize user safety and security. This proposal presented a comprehensive analysis of the reasons behind the failures of currently available fully autonomous vehicles, despite extensive trials and research. The study identified inaccurate and inappropriate decision-making policies as a significant factor contributing to these failures, resulting from the vehicles’ limited perception of environmental information. Therefore, much emphasis was placed on data preprocessing, specifically data cleaning and fusion of the sensory data collected by AVs. To address this issue, a generic data fusion engine was proposed, capable of merging various data formats such as text, image, video, and audio, which exhibit multimodal characteristics. The initial stage of the research focused on image fusion, as modern sensors like LiDAR and Velodyne generate data in the form of point cloud-based image frames. Previous research [6] proposed a hybrid image fusion model for multispectral data, which required enhancement and integration with machine learning models to accurately and efficiently fuse large volumes of sensory data. To accomplish this, an innovative image fusion model named IFGAN was introduced in this study. IFGAN employed a sophisticated Multi-Scale Attention mechanism to enhance the precision and efficiency of the fusion process. Incorporating the newly proposed kernel functions for the IFGAN model alongside the kernel functions utilized in the Hybrid Image Fusion model [6] led to an improvement in the accuracy of the fusion outcomes. The feature extraction model employed in IFGAN is trained using a CNN model and integrated with the proposed Multi-Scale mechanism, thereby improving feature extraction and reducing the burden on the IFGAN model. The IFGAN model presented in this study can manage extensive amounts of sensory data, maintain RGB color intensity in merged images, and effectively carry out image modifications. The efficacy of the hybrid image data fusion model introduced in this study was assessed using datasets including nuScenes, KITTI, BEPM TNU, and OSU. Standard image metrics were utilized for benchmarking its performance against established data fusion models. The proposed image fusion model outperformed other models in terms of both accuracy and efficiency. Future work involves fine-tuning and evaluating the proposed fusion model using different datasets which could look into enhancing its performance. Additionally, ongoing work could incorporate video and audio fusion models into the proposed framework.
Author Contributions
Conceptualization, H.A.I., H.E.-S. and S.B.; Methodology, H.A.I. and S.B.; Software, H.A.I.; Validation, H.A.I.; Formal analysis, H.A.I., H.E.-S. and S.B.; Investigation, H.A.I., H.E.-S. and S.B.; Writing—original draft, H.A.I.; Writing—review & editing, S.B.; Supervision, H.E.-S. and S.B.; Project administration, H.E.-S.; Funding acquisition, H.E.-S. All authors have read and agreed to the published version of the manuscript.
Funding
This paper was supported by the Emirates Center for Mobility Research of the United Arab Emirates University (grant 31R271) and the ASPIRE Award for Research Excellence, Project Reference AARE20-368.
Data Availability Statement
This research exclusively uses existing datasets like nuScenes, KITTI, TNO, the Bristol Eden Project Multi-Sensor(BEPM dataset), and the OSU Color Thermal dataset. No new dataset has been created.
Conflicts of Interest
The authors declare no conflict of interest. The funders had no role in the design of the study; in the collection, analyses, or interpretation of data; in the writing of the manuscript; or in the decision to publish the results.
References
- Litman, T. Autonomous Vehicle Implementation Predictions: Implications for Transport Planning; The National Academies of Sciences, Engineering, and Medicine: Washington, DC, USA, 2020. [Google Scholar]
- Fagnant, D.J.; Kockelman, K. Preparing a nation for autonomous vehicles: Opportunities, barriers and policy recommendations. Transp. Res. Part A Policy Pract. 2015, 77, 167–181. [Google Scholar] [CrossRef]
- Ignatious, H.A.; El-Sayed, H.; Khan, M.A.; Mokhtar, B.M. Analyzing Factors Influencing Situation Awareness in Autonomous Vehicles—A Survey. Sensors 2023, 23, 4075. [Google Scholar] [CrossRef] [PubMed]
- Kaur, H.; Koundal, D.; Kadyan, V. Image fusion techniques: A survey. Arch. Comput. Methods Eng. 2021, 28, 4425–4447. [Google Scholar] [CrossRef] [PubMed]
- Vargas, J.; Alsweiss, S.; Toker, O.; Razdan, R.; Santos, J. An overview of autonomous vehicles sensors and their vulnerability to weather conditions. Sensors 2021, 21, 5397. [Google Scholar] [CrossRef] [PubMed]
- Ignatious, H.A.; El-Sayed, H.; Khan, M.A.; Kulkarni, P. A Generic Framework for Enhancing Autonomous Driving Accuracy through Multimodal Data Fusion. Appl. Sci. 2023, 13, 10749. [Google Scholar] [CrossRef]
- Biswas, S.; Bianchini, M.; Shaw, R.N.; Ghosh, A. Prediction of traffic movement for autonomous vehicles. In Machine Learning for Robotics Applications; Springer: Berlin/Heidelberg, Germany, 2021; pp. 153–168. [Google Scholar]
- Amin-Naji, M.; Aghagolzadeh, A.; Ezoji, M. Ensemble of CNN for multi-focus image fusion. Inf. Fusion 2019, 51, 201–214. [Google Scholar] [CrossRef]
- Zhang, Q.; Liu, T.; Zhang, Z.; Huangfu, Z.; Li, Q.; An, Z. Unmanned rolling compaction system for rockfill materials. Autom. Constr. 2019, 100, 103–117. [Google Scholar] [CrossRef]
- Zhou, T.; Li, Q.; Lu, H.; Cheng, Q.; Zhang, X. GAN review: Models and medical image fusion applications. Inf. Fusion 2023, 91, 134–148. [Google Scholar] [CrossRef]
- Chatterjee, S.; Hazra, D.; Byun, Y.C.; Kim, Y.W. Enhancement of Image Classification Using Transfer Learning and GAN-Based Synthetic Data Augmentation. Mathematics 2022, 10, 1541. [Google Scholar] [CrossRef]
- Shahian Jahromi, B.; Tulabandhula, T.; Cetin, S. Real-time hybrid multi-sensor fusion framework for perception in autonomous vehicles. Sensors 2019, 19, 4357. [Google Scholar] [CrossRef]
- Jia, D.; Cheng, C.; Song, C.; Shen, S.; Ning, L.; Zhang, T. A hybrid deep learning-based spatiotemporal fusion method for combining satellite images with different resolutions. Remote Sens. 2021, 13, 645. [Google Scholar] [CrossRef]
- Wang, Y.; Von Der Weth, C.; Zhang, Y.; Low, K.H.; Singh, V.K.; Kankanhalli, M. Concept based hybrid fusion of multimodal event signals. In Proceedings of the 2016 IEEE International Symposium on Multimedia (ISM), San Jose, CA, USA, 11–13 December 2016; pp. 14–19. [Google Scholar]
- Malawade, A.V.; Mortlock, T.; Faruque, M.A.A. HydraFusion: Context-Aware Selective Sensor Fusion for Robust and Efficient Autonomous Vehicle Perception. arXiv 2022, arXiv:2201.06644. [Google Scholar]
- Liu, Y.; Chen, X.; Peng, H.; Wang, Z. Multi-focus image fusion with a deep convolutional neural network. Inf. Fusion 2017, 36, 191–207. [Google Scholar] [CrossRef]
- Du, C.; Gao, S. Image segmentation-based multi-focus image fusion through multi-scale convolutional neural network. IEEE Access 2017, 5, 15750–15761. [Google Scholar] [CrossRef]
- Li, J.; Guo, X.; Lu, G.; Zhang, B.; Xu, Y.; Wu, F.; Zhang, D. DRPL: Deep regression pair learning for multi-focus image fusion. IEEE Trans. Image Process. 2020, 29, 4816–4831. [Google Scholar] [CrossRef] [PubMed]
- Xu, H.; Ma, J.; Yuan, J.; Le, Z.; Liu, W. Rfnet: Unsupervised network for mutually reinforcing multi-modal image registration and fusion. In Proceedings of the IEEE/CVF Conference on Computer Vision and Pattern Recognition, New Orleans, LA, USA, 18–24 June 2022; pp. 19679–19688. [Google Scholar]
- Tiede, P.; Broderick, A.E.; Palumbo, D.C. Variational Image Feature Extraction for the Event Horizon Telescope. Astrophys. J. 2022, 925, 122. [Google Scholar] [CrossRef]
- Govindaswamy, A.G.; Montague, E.; Raicu, D.S.; Furst, J. CNN as a feature extractor in gaze recognition. In Proceedings of the 2020 3rd Artificial Intelligence and Cloud Computing Conference, Kyoto, Japan, 18–20 December 2020; pp. 31–37. [Google Scholar]
- Wang, P.; Zhang, X.; Hao, Y. A method combining CNN and ELM for feature extraction and classification of SAR image. J. Sens. 2019, 2019, 6134610. [Google Scholar] [CrossRef]
- Liu, C.; Wang, X.; Liu, C.; Sun, Q.; Peng, W. Differentiating novel coronavirus pneumonia from general pneumonia based on machine learning. Biomed. Eng. Online 2020, 19, 66. [Google Scholar] [CrossRef]
- Özkaya, U.; Öztürk, Ş.; Barstugan, M. Coronavirus (COVID-19) classification using deep features fusion and ranking technique. In Big Data Analytics and Artificial Intelligence against COVID-19: Innovation Vision and Approach; Springer: Berlin/Heidelberg, Germany, 2020; pp. 281–295. [Google Scholar]
- Kassania, S.H.; Kassanib, P.H.; Wesolowskic, M.J.; Schneidera, K.A.; Detersa, R. Automatic detection of coronavirus disease (COVID-19) in X-ray and CT images: A machine learning based approach. Biocybern. Biomed. Eng. 2021, 41, 867–879. [Google Scholar] [CrossRef]
- Ignatious, H.A.; El-Sayed, H.; Kulkarni, P. Multilevel Data and Decision Fusion Using Heterogeneous Sensory Data for Autonomous Vehicles. Remote Sens. 2023, 15, 2256. [Google Scholar] [CrossRef]
- Yu, Z.; Feng, C.; Liu, M.Y.; Ramalingam, S. Casenet: Deep category-aware semantic edge detection. In Proceedings of the IEEE Conference on Computer Vision and Pattern Recognition, Honolulu, HI, USA, 21–26 July 2017; pp. 5964–5973. [Google Scholar]
- nuScenes. 2019. Available online: https://www.nuscenes.org/nuscenes (accessed on 19 July 2019).
- KITTI. 2019. Available online: https://paperswithcode.com/dataset/kitti (accessed on 19 July 2019).
- TNO. 2019. Available online: https://figshare.com/articles/TNO_Image_Fusion_Dataset/1008029 (accessed on 19 July 2019).
- BPEM. 2019. Available online: http://www.cis.rit.edu/pelz/scanpaths/data/bristoleden.htm (accessed on 19 July 2019).
- OSU. 2019. Available online: http://vcipl-okstate.org/pbvs/bench/ (accessed on 19 July 2019).
- Barrero, O.; Perdomo, S.A. RGB and multispectral UAV image fusion for Gramineae weed detection in rice fields. Precis. Agric. 2018, 19, 809–822. [Google Scholar] [CrossRef]
- Talal, T.M.; Attiya, G.; Metwalli, M.R.; El-Samie, A.; Fathi, E.; Dessouky, M.I. Satellite image fusion based on modified central force optimization. Multimed. Tools Appl. 2020, 79, 21129–21154. [Google Scholar] [CrossRef]
- Zhang, Y.; Zhang, C.; Li, H.; Chen, Q. An online detection method for capacitor voltage transformer with excessive measurement error based on multi-source heterogeneous data fusion. Measurement 2022, 187, 110262. [Google Scholar] [CrossRef]
- Ayoup, A.M.; Khalaf, A.A.; Alraddady, F.; El-Samie, F.E.A.; El-Shafai, W.; Eldin, S.M.S. Cancelable Multi-biometric Template Generation Based on Dual-Tree Complex Wavelet Transform. Intell. Autom. Soft Comput. 2022, 33, 1289–1304. [Google Scholar] [CrossRef]
- Jiang, Q.; Jin, X.; Cui, X.; Yao, S.; Li, K.; Zhou, W. A lightweight multimode medical image fusion method using similarity measure between intuitionistic fuzzy sets joint laplacian pyramid. IEEE Trans. Emerg. Top. Comput. Intell. 2023, 7, 631–647. [Google Scholar] [CrossRef]
- Salmanpour, M.R.; Hosseinzadeh, M.; Modiri, E.; Akbari, A.; Hajianfar, G.; Askari, D.; Fatan, M.; Maghsudi, M.; Ghaffari, H.; Rezaei, M.; et al. Advanced survival prediction in head and neck cancer using hybrid machine learning systems and radiomics features. In Proceedings of the Medical Imaging 2022: Biomedical Applications in Molecular, Structural, and Functional Imaging, San Diego, CA, USA, 20–22 February 2022; Volume 12036, pp. 314–321. [Google Scholar]
- AlFawwaz, B.; AL-Shatnawi, A.; Al-Saqqar, F.; Nusir, M.; Yaseen, H. Face recognition system based on the multi-resolution singular value decomposition fusion technique. Int. J. Data Netw. Sci. 2022, 6, 1249–1260. [Google Scholar] [CrossRef]
- Wang, H.; Wang, M.; Che, Z.; Xu, Z.; Qiao, X.; Qi, M.; Feng, F.; Tang, J. Rgb-depth fusion gan for indoor depth completion. In Proceedings of the IEEE/CVF Conference on Computer Vision and Pattern Recognition, New Orleans, LA, USA, 18–24 June 2022; pp. 6209–6218. [Google Scholar]
- Li, J.; Huo, H.; Li, C.; Wang, R.; Feng, Q. AttentionFGAN: Infrared and visible image fusion using attention-based generative adversarial networks. IEEE Trans. Multimed. 2020, 23, 1383–1396. [Google Scholar] [CrossRef]
Figure 1.
ResNet Architecture.

Figure 2.
Residual Structure of ResNet Architecture.

Figure 3.
Proposed Framework.

Figure 4.
Proposed Edge Detection Model.

Figure 5.
Flow of proposed Edge Detection and Evaluation Model.

Figure 6.
Proposed Color Estimation Technique.

Figure 7.
Proposed Hybrid Fusion Framework [6].
Figure 7.
Proposed Hybrid Fusion Framework [6].

Figure 8.
Proposed IFGAN Image Fusion Model.

Figure 9.
Mechanism behind proposed Muti-Scale Attention Network.

Figure 10.
Qualitative performance of proposed Muti-Scale Attention Network.

Figure 11.
Quantitative performance of IFGAN Fusion model.

Figure 12.
Performance of the proposed IFGAN Image Fusion Model with BEPM dataset.

Figure 13.
Performance of the proposed IFGAN Image Fusion Model with KITTI dataset.


Figure 15.
Efficiency Comparison.

Figure 16.
Performance of the proposed IFGAN Image Fusion Model.

Figure 17.
Classification accuracy of different models.

Figure 18.
Performance of the proposed IFGAN with AttentionGAN [41].
Figure 18.
Performance of the proposed IFGAN with AttentionGAN [41].


Table 1.
Overall Analysis of Machine Learning-based Image Fusion Models.
| Method | Advantages | Disadvantages |
|---|---|---|
| Curvelet Transform (CVT) | Multiscale and Multidirectional representation | Computational Complexity |
| Sparse representation | Steel Learning curve | |
| Sensitive to Noise | ||
| Dual-Tree Complex Wavelet Transform (DTCWT) | Improved Directional Selectivity | Increased Computational Complexity |
| Reduces Boundary Effects | Increased Memory Requirements | |
| Complex-Valued Representation | Limited Availability | |
| The Laplacian Pyramid Transform (LP) | Multiresolution Representation | Aliasing |
| Energy Compaction | Discrete Nature | |
| Efficient Reconstruction | Sensitivity to Image Content | |
| Edge Preservation | Parameter Selection | |
| Low Pass Pyramid (RP) | Multiresolution Representation | Loss of High-Frequency Details |
| Efficient Compression | Limited Directional Sensitivity | |
| Progressive Reconstruction | Sensitivity to Noise | |
| Reduced Computational Complexity | Fixed Decomposition Levels | |
| Multi-Resolution Singular Value Decomposition (MSVD) | Multiresolution Representation | Loss of Fine Details |
| Energy Concentration | Computational Complexity | |
| Compression Efficiency | Block Artifacts | |
| Transcoding | Parameter Selection | |
| FusionGAN | Image Fusion Quality | Training Data Requirements |
| Information Integration | Computational Complexity | |
| End-to-End Learning | Mode Collapse and Quality Variability | |
| Data Augmentation | Interpretability and Control |
Table 2.
Discriminator Network Architect, I—Input, O—Output, KS—Kernel Size, SS—Stride Size, PS—Padding Size.
Table 2.
Discriminator Network Architect, I—Input, O—Output, KS—Kernel Size, SS—Stride Size, PS—Padding Size.
| Layer | Discriminator Network | ||||||
|---|---|---|---|---|---|---|---|
| I | O | KS | SS | PS | |||
| L1 | Conv | 1 | 64 | 4 | 1 | 0 | LeakyReLU |
| L2 | Conv | 64 | 64 | 4 | 2 | 0 | LeakyReLU |
| L3 | Conv | 64 | 128 | 4 | 1 | 0 | LeakyReLU |
| L4 | Conv | 128 | 128 | 4 | 2 | 0 | LeakyReLU |
| L5 | Conv | 128 | 256 | 4 | 1 | 0 | LeakyReLU |
| L6 | Conv | 256 | 256 | 4 | 2 | 0 | LeakyReLU |
Table 3.
Various tools used for evaluation.
| S.No | Tools | Version | Description |
|---|---|---|---|
| 1 | Python | 3.10.4 | Development of the models |
| 2 | MATLAB | R2021a | Developing applications |
| 3 | Mogo DB | 5.0 | Database |
| 4 | Linux | 5.4. 0 –26 | Operating System |
| 5 | Weka | 3.0 (GPLv3) | Preprocessing |
| 6 | Dataset | nuScenes, KITTI, TNO, OSU, BEPM | To evaluate the proposed image fusion models. |
Table 4.
Key metrics used in the research to evaluate image fusion models.
| Metric Name | Purpose |
|---|---|
| Accuracy (Acc) | To estimate accuracy of proposed models |
| Efficiency (Eff) | To assess the models’ effectiveness |
| Standard Deviation (SD) | To calculate the difference |
| Average Gradient (AG) | To convey minute details, variation in contrast and texture, and clarity of image |
| Spatial Frequency (SF) | To gauge the image’s overall degree of activity |
| Peak Signal-to-Noise Ratio (PSNR) | To calculate the perceived difference between the starting picture and the fused image |
| Correlation Coefficient (CC) | To determine whether the original and the combined image are similar |
| Mutual Information (MI) | To measure the dependence between two random variables. It quantifies the amount of information that one random variable contains about another random variable |
| ENtropy (EN) | To measure uncertainty |
| F-measure | To estimate the accuracy of the detected object |
Table 5.
Overall performance of proposed IFGAN image fusion model with other popular image fusion models.
Table 5.
Overall performance of proposed IFGAN image fusion model with other popular image fusion models.
| Images | Model | AG | SF | CC |
|---|---|---|---|---|
| 1 | GS | 10.4444 | 72.0375 | 0.7908 |
| HIS | 10.5403 | 147.8691 | 0.8078 | |
| Subtractive | 10.4150 | 143.5344 | 0.8107 | |
| Proposed Hybrid Image Fusion (version 1.0) [6] | 10.2148 | 135.6382 | 0.9472 | |
| Proposed IFGAN (version 2.0) | 11.2148 | 155.6382 | 0.9872 | |
| 2 | GS | 10.6105 | 79.5329 | 0.7040 |
| HIS | 10.7290 | 187.7829 | 0.7077 | |
| Subtractive | 11.4368 | 188.6462 | 0.7360 | |
| Proposed Hybrid Image Fusion (version 1.0) [6] | 11.4976 | 180.5643 | 0.8235 | |
| Proposed IFGAN (version 2.0) | 12.4976 | 190.5643 | 0.9235 | |
| 3 | GS | 11.5363 | 141.9687 | 0.8434 |
| HIS | 11.8526 | 142.6416 | 0.8313 | |
| Subtractive | 10.9434 | 130.6161 | 0.8344 | |
| Proposed Hybrid Image Fusion (version 1.0) [6] | 11.2145 | 123.6213 | 0.6543 | |
| Proposed IFGAN (version 2.0) | 12.3145 | 143.6213 | 0.9543 |
Table 6.
Runtime Comparison of IFGAN with other Fusion Models.
| Fusion Model | nuScenes | KITTI | BEPM | TNO | OSU |
|---|---|---|---|---|---|
| CVT | 0.7862 | 0.6742 | 0.6814 | 0.7267 | 0.8567 |
| DTCWT | 0.1465 | 0.0954 | 0.0925 | 0.1497 | 0.1695 |
| LP | 0.1336 | 0.1528 | 0.1624 | 0.1425 | 0.1523 |
| RP | 0.1566 | 0.1738 | 0.1956 | 0.1865 | 0.1975 |
| MSVD | 0.1102 | 0.1321 | 0.0968 | 0.1745 | 0.1945 |
| FusionGAN | 0.2378 | 0.3216 | 0.2487 | 0.3654 | 0.3854 |
| IFGAN | 0.0057 | 0.0072 | 0.0087 | 0.0064 | 0.0092 |
Table 7.
F scores of various Edge Detecting Models.
| Method | Img_1 | Img_2 | Img_3 | Img_4 | Img_5 | ||||||||||
|---|---|---|---|---|---|---|---|---|---|---|---|---|---|---|---|
| Car | Person | Tree | Car | Person | Tree | Car | Person | Tree | Car | Person | Tree | Car | Person | Tree | |
| CASENet | 74.5 | 59.7 | 73 | 67 | 78 | 67 | 76 | 69 | 82 | 56 | 72 | 80 | 65 | 81 | 59 |
| SEAL | 79 | 65.8 | 76 | 68.5 | 78.6 | 66.2 | 75 | 68 | 79 | 58.5 | 73.5 | 79 | 64 | 79 | 58 |
| STEAL | 78.2 | 66 | 74.2 | 69 | 77 | 67.8 | 72.3 | 67.4 | 78.2 | 57.4 | 74 | 78.5 | 63.2 | 78 | 61 |
| Gated-SCNN | 79 | 65.4 | 73 | 65 | 75.2 | 68 | 74 | 65 | 77 | 59 | 72.5 | 77 | 65 | 76 | 62 |
| DDS-R | 79.4 | 70.2 | 68.4 | 64.7 | 76 | 68.5 | 78 | 64.3 | 76.2 | 58.5 | 75 | 79.5 | 67 | 77 | 63.4 |
| DFF | 79.8 | 75.3 | 72 | 68 | 8.5 | 69 | 78 | 66.5 | 75 | 52.3 | 74 | 81 | 65 | 78.5 | 64 |
| Proposed | 82 | 80 | 78.3 | 73 | 83 | 74 | 82 | 72 | 84 | 62 | 77 | 84 | 69 | 84 | 70 |
Table 8.
RMSE scores of different edge detection models.
| Model Name | Image Info | RMSE Value |
|---|---|---|
| Proposed IFGAN Model | Image 1 | 0.0934 |
| Proposed IFGAN Model | Image 2 | 0.0828 |
| Proposed Hybrid Image Fusion Model [6] | Image 1 | 0.1330 |
| Proposed Hybrid Image Fusion Model [6] | Image 2 | 0.1295 |
| KFA | Image 1 | 0.3895 |
| KFA | Image 2 | 0.2522 |
| Sobel–Prewitt | Image 1 | 0.4831 |
| Sobel–Prewitt | Image 2 | 0.3187 |
Table 9.
Accuracy of different image fusion models.
| Models | Proposed IFGAN | PCA | WMFGS | GS |
|---|---|---|---|---|
| True positives (TP) | 15 | 130 | 140 | 120 |
| True negatives (TN) | 130 | 120 | 120 | 110 |
| False positives (FP) | 12 | 28 | 25 | 40 |
| False negatives (FN) | 8 | 22 | 15 | 30 |
| Accuracy (%) | 93 | 83 | 86 | 77 |
Disclaimer/Publisher’s Note: The statements, opinions and data contained in all publications are solely those of the individual author(s) and contributor(s) and not of MDPI and/or the editor(s). MDPI and/or the editor(s) disclaim responsibility for any injury to people or property resulting from any ideas, methods, instructions or products referred to in the content. |
© 2024 by the authors. Licensee MDPI, Basel, Switzerland. This article is an open access article distributed under the terms and conditions of the Creative Commons Attribution (CC BY) license (https://creativecommons.org/licenses/by/4.0/).
Share and Cite
MDPI and ACS Style
Ignatious, H.A.; El-Sayed, H.; Bouktif, S. IFGAN—A Novel Image Fusion Model to Fuse 3D Point Cloud Sensory Data. J. Sens. Actuator Netw. 2024, 13, 15. https://doi.org/10.3390/jsan13010015
AMA Style
Ignatious HA, El-Sayed H, Bouktif S. IFGAN—A Novel Image Fusion Model to Fuse 3D Point Cloud Sensory Data. Journal of Sensor and Actuator Networks. 2024; 13(1):15. https://doi.org/10.3390/jsan13010015
Chicago/Turabian StyleIgnatious, Henry Alexander, Hesham El-Sayed, and Salah Bouktif. 2024. "IFGAN—A Novel Image Fusion Model to Fuse 3D Point Cloud Sensory Data" Journal of Sensor and Actuator Networks 13, no. 1: 15. https://doi.org/10.3390/jsan13010015
Note that from the first issue of 2016, this journal uses article numbers instead of page numbers. See further details here.