Article

Dynamic and Distributed Intelligence over Smart Devices, Internet of Things Edges, and Cloud Computing for Human Activity Recognition Using Wearable Sensors

1
Computer Engineering Department, College of Information Technology and Computer Engineering, Palestine Polytechnic University, Hebron P.O. Box 198, Palestine
2
Department of Information Technology, Faculty of Computers and Information, Menoufia University, Gamal Abdel Nasser Street, Shebin El Kom P.O. Box 32511, Egypt
*
Author to whom correspondence should be addressed.
J. Sens. Actuator Netw. 2024, 13(1), 5; https://doi.org/10.3390/jsan13010005
Submission received: 5 December 2023 / Revised: 28 December 2023 / Accepted: 29 December 2023 / Published: 2 January 2024

Abstract

:
A wide range of applications, including sports and healthcare, use human activity recognition (HAR). The Internet of Things (IoT), using cloud systems, offers enormous resources but produces high delays and huge amounts of traffic. This study proposes a distributed intelligence and dynamic HAR architecture using smart IoT devices, edge devices, and cloud computing. These systems were used to train models, store results, and process real-time predictions. Wearable sensors and smartphones were deployed on the human body to detect activities from three positions; accelerometer and gyroscope parameters were utilized to recognize activities. A dynamic selection of models was used, depending on the availability of the data and the mobility of the users. The results showed that this system could handle different scenarios dynamically according to the available features; its prediction accuracy was 99.23% using the LightGBM algorithm during the training stage, when 18 features were used. The prediction time was around 6.4 milliseconds per prediction on the smart end device and 1.6 milliseconds on the Raspberry Pi edge, which can serve more than 30 end devices simultaneously and reduce the need for the cloud. The cloud was used for storing users’ profiles and can be used for real-time prediction in 391 milliseconds per request.

1. Introduction

The Internet of Things (IoT) has revolutionized the way we interact with our environment, enabling the connection of things to the internet [1,2]. One application of the IoT is human activity recognition (HAR), where smart devices can monitor and recognize human activities for various purposes. HAR is essential in a number of industries, including the sport [3,4], healthcare [5,6,7], and smart environment industries [8,9,10,11]; information about human activities has been collected using smartphones and wearable sensor technologies [12,13,14,15,16].
Machine learning (ML) plays a significant role in HAR systems [11]. ML automatically identifies and classifies different activities performed by individuals based on sensor data or other input sources. Feature extraction has been used to extract relevant features from raw sensor data, such as accelerometer or gyroscope readings, to represent different activities. ML models can be trained on labeled data to recognize patterns, make predictions, and classify activities based on the extracted features. ML models can be deployed to perform real-time activity recognition, allowing for immediate feedback or intervention. Feature fusion can be used by combining information from different sources to improve the accuracy and robustness of activity recognition systems [17,18,19].
Cloud computing offers virtually unlimited resources for data storage and processing, making it an attractive option for HAR applications. In the context of HAR, using wearable sensors, cloud computing can be utilized. The integration of edge and cloud computing offers promising solutions to address the challenges associated with processing wearable sensor data. Edge computing provides low-latency and privacy-preserving capabilities, while cloud computing offers scalability and storage advantages [20,21,22].
To combine the benefits of both edge and cloud computing, researchers have proposed hybrid architectures that combine the strengths of both paradigms [21,22]. These architectures aim to achieve a balance between real-time processing at the edge and the scalability and storage capabilities of the cloud. Authors of different publications demonstrated improved recognition accuracy and reduced response times compared to a solely cloud-based approach [23,24,25].
Distributed intelligence methods that make use of cloud and edge computing have shown promise in addressing these issues [26,27]. The concept of distributed intelligence has emerged, leveraging the power of multiple interconnected devices to perform complex tasks. This paper explored the application of distributed intelligence in the IoT for human activity recognition, specifically focusing on the use of Raspberry Pi as a platform. Healthcare systems using wearable sensors are an emerging field that aims to understand and classify human activities based on data collected from sensors integrated into wearable devices. These sensors can include accelerometers, gyroscopes, magnetometers, heart rate monitors, blood pressure monitors, and other medical sensors [8,12,27]. Here, only accelerometers and gyroscopes were used.
Healthcare applications have been improved by combining wearable and mobile sensors with IoT infrastructure, and medical device usability has been improved by combining mobile applications with IoT technology. The IoT has been expected to have a particularly significant impact on healthcare, with the potential to improve people’s quality of life in general. The authors of [28] presented a “Stress-Track” system using machine learning. Through measurements of body temperature, perspiration, and movement rate during exercise, their device was intended to monitor an individual’s stress levels. With a high accuracy percentage of 99.5%, this suggested model demonstrated its potential influence on stress reduction and better health.
Wearable sensors and computer vision were employed to recognize activities. Wearable sensors are made to be worn by individuals, allowing for activity recognition in indoor and outdoor environments. Wearable sensors can also offer portability and continuous data collection, enabling long-term monitoring and analysis. In order to provide more contextual information for activity recognition, computer vision algorithms can capture a wider perspective of the environment, including objects, scenes, and interactions with other people. Sufficient lighting and clear perspectives are required for precise computer vision-based activity recognition.
HAR has been implemented with different types of motion sensors; one of them is the MPU6050 inertial measurement unit (IMU) sensor, which included a tri-axial gyroscope and a tri-axial accelerometer [16,29]. This small sensor module, with a size of 21.2 mm in length, 16.4 mm in width, and 3.3 mm in height, along with a weight of 2.1 g, is a cheap and popular choice for capturing motion data under different applications, including HAR systems [7,16], sports [30,31], and earthquake detection [29]. MPU6050 can be used for HAR, and achieving high accuracy requires careful consideration of sensor placement, feature extraction, classification algorithms, training data quality, and environmental factors [32].
Also, smartphones have become increasingly popular as a platform for HAR due to their availability, built-in sensors, computational power, and connectivity capabilities. Smartphone sensors have been widely used in machine learning; they have been used to recognize different categories of daily life activities. In recent research, several papers used smartphone sensors and focused on enhancing prediction accuracy and optimizing algorithms to speed up processing [14,15,32].
The orientation of these sensors should be considered according to the place of their installation, the nature of movements, and the dataset being used for training [17,33,34]. In this study, an MPU6050 module connected to an ESP32 microcontroller was vertically installed on the shin; another module connected to Raspberry Pi version 3 was installed horizontally on the waist, and a smartphone was vertically placed inside the pocket on the thigh. Under the vertical installation, the +Y component direction of the accelerometer is upward, and in the horizontal installation, the +X component direction is upward. The directions of the MPU6050 module are explained in Figure 1a,b, and the smartphone direction is explained in Figure 1c [32,35].
This study proposed an architecture that uses several devices to collect motion sensor signals from three different human body positions in order to recognize four different human activities. Four primary components were utilized:
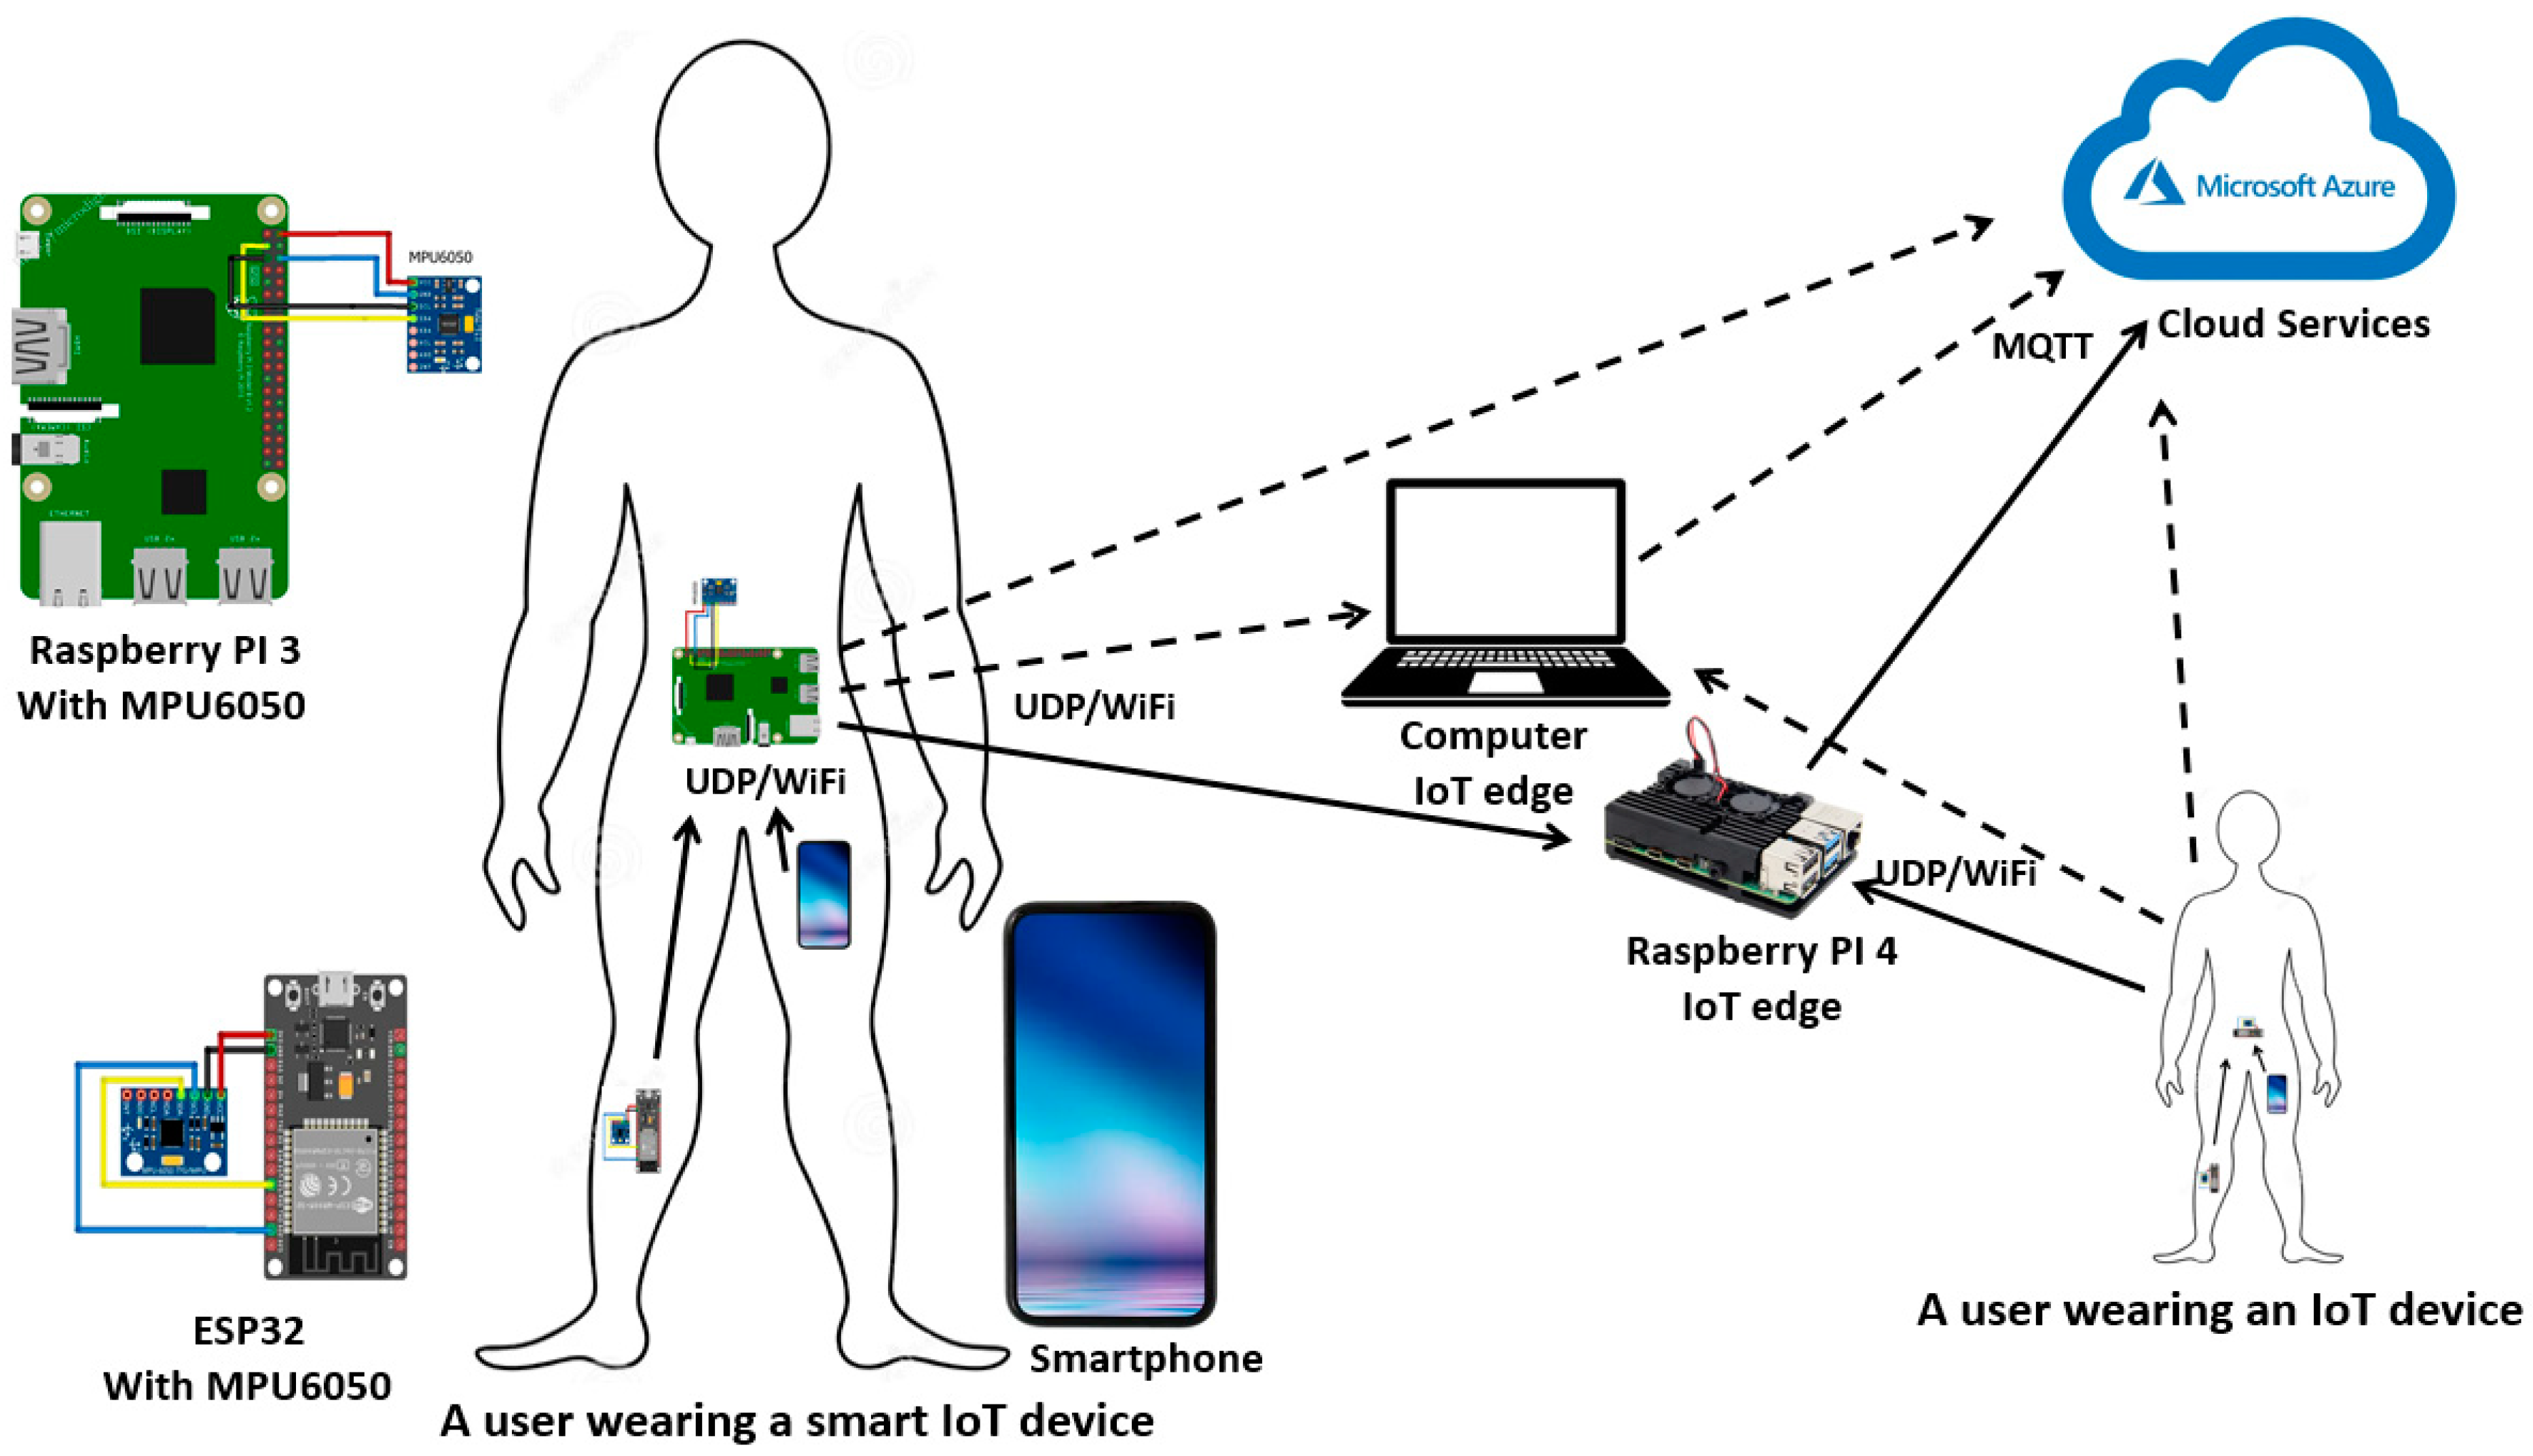
  • A smart IoT device with machine learning models was mounted on the waist and wirelessly collected readings from the attached sensor and from the shin and the thigh.
  • Some users may have used simple IoT sensor devices on their waists with no machine learning.
  • Edge devices with machine learning models were used to serve the IoT sensor devices, aggregate their results, and send updates to the cloud.
  • The Microsoft Azure cloud system (Microsoft Corporation, Redmond, WA, USA) was used for training models, online prediction, storage, and analyses.
Four models were trained on the smart end device, the edge, and the cloud. This system was scalable and dynamic in gathering the necessary values based on the availability and connectivity between devices. The accuracy for recognizing four different human activities approached 99.23% when all the features were used, with an average prediction time of less than 2 milliseconds per prediction if the Raspberry Pi 4 edge was used.
The remainder of this article will discuss the literature review, the suggested architecture, and the devices that were used. After that, an explanation of the extracted datasets, the training results, and the machine learning models will be outlined. Then, the real-time experiments will be demonstrated. In the discussion and conclusions, we will analyze our findings and compare the results with those of related articles.

2. Literature Review

In recent years, researchers have used public and private datasets that have been used for HAR using wearable sensors and feature fusion to recognize various movements. Two smartphones were used by the authors of [8] with the WISDM public dataset. Applications in healthcare have used this dataset, which contains three-dimensional inertia signals of thirteen time-stamped human activities, including walking, writing, smoking, and other activities. A HAR system was used based on effective hand-crafted features and random forest as a classifier. These authors conducted sensitivity analyses of the applied model’s parameters, and the accuracy of their model reached 98.7% on average using two devices on the hand’s wrist and in the pocket.
The authors of [16] used a deep learning algorithm and employed three parallel convolutional neural networks for local feature extraction to establish feature fusion models of varying kernel sizes to increase the accuracy of HAR. Two datasets were used: the UCI dataset and a self-recorded dataset comprising 21 participants wearing devices on their waists and performing six activities in their laboratory. The accuracy of the activities in the UCI dataset and in the self-recorded dataset was 97.49% and 96.27%, respectively.
In the study published by the authors of [35], the authors used waist sensors and two graphene/rubber sensors for the knees to detect falls in elderly people. They used one MPU6050 sensor located at the waist to monitor the attitude of the body. The rubber sensors were used to monitor the movements of their legs by monitoring their tilt angles in real time. They recorded four activities of daily living and six fall postures. Four basic fall-down postures can be identified with the MPU6050 sensor integrated with rubber sensors. The accuracy results for the activities of daily living recognition were 93.5%, and for fall posture identification, they were 90%.
It was proposed to use a smart e-health framework to monitor the health of the elderly and disabled people in the study published by the authors of [36]. The authors generated notifications and performed analyses using edge computing. Three MPU9250 sensors were positioned on the body, on the left ankle, right wrist, and chest, using the MHEALTH dataset. The MPU9250 sensor integrates a magnetometer, a gyroscope, and a 3-axis accelerometer. A random forest machine learning model was used for inertial sensors in HAR. Two levels of analyses were considered; the first level was carried out using scalar sensors embedded in wearable devices, and cameras were only used as the second level if inconsistencies were identified at the first level. A video-based HAR and fall detection module achieved an accuracy of 86.97% on the DML Smart Actions dataset. The authors deployed the proposed HAR model with inertial sensors under a controlled experimental environment and achieved results with an accuracy of 96%.
A smart system for the quality of life of elderly people was proposed by the authors of [37]. These authors proposed an IoT system that uses large amounts of data, cloud computing, low-power wireless sensing networks, and smart devices to identify falls. Their technology gathered data from elderly people’s movements in real time by integrating an accelerometer into a wearable device. The signals from their sensor were processed and analyzed using a machine learning model on a gateway for fall detection. They employed sensor positioning and multiple channeling information changes in the training set, using the MobiAct public dataset. Their system achieved 95.87% accuracy, and their edge system was able to detect falls in real time.
The majority of these studies focused on improving algorithms, employing different datasets, or adding new features to increase accuracy. Occasionally, specialized hardware was added to improve efficiency and assist with classification. Wearable technology employs sensors installed on humans to gather data from their sensors. Comfort and mobility should be taken into account when gathering data from sensors positioned at various body locations.
This study proposed an architecture and used different types of sensor nodes, smart IoT devices, and edge computing in collaboration with cloud computing to monitor a group of people using wearable sensors. The process of prediction is dynamic and depends on the nature of the device, available features, and connectivity. Different scenarios were tested, accuracy was measured in training and real time, and prediction time was recorded for the machine learning models on different devices. In this article’s conclusion, a comparison between this proposal and related articles has been given, along with an overview of the main components, datasets, and performance.

3. The Proposed Architecture

In this proposal, two different Raspberry Pi microcomputer types were used. The first was a Raspberry Pi 3 device connected to an MPU6050 module worn as a smart IoT end device, horizontally mounted on the waist. The other was an edge device that made use of a Raspberry Pi 4 device to gather telemetry data from nearby devices to predict activity and transfer data to the cloud. The quad-core ARM Cortex-A72 CPU in the Raspberry Pi 4 device has eight gigabytes of RAM, whereas the quad-core ARM Cortex-A53 processor in the Raspberry Pi 3 device has one gigabyte of RAM. This will obviously impact performance.
The proposed architecture, as shown in Figure 2, clarifies the used hardware and the connectivity between these parts; the solid lines denote the default connections, while the dashed lines are the alternatives, as explained later in the dynamic connectivity scenarios.
The following points outline the types of IoT end devices, edge devices, and the IoT cloud that were used:
  • A smart IoT device, which was a Raspberry Pi 3 device with a machine learning model at the waist, was used. This wearable microcomputer was equipped with trained models and wired to the MPU6050 module. The values from this module were processed locally; the rest of the values came from the shin and the thigh wirelessly. The other MPU6050 module was located on the shin, where the movement of the leg was measured during performing activities. The ESP32 microcontroller read the values and sent them via Wi-Fi to the Raspberry Pi device on the waist. The smartphone in the pant pocket at the thigh has several functions: it measures the accelerometer and gyroscope coordinates using the built-in sensor, sends them to the Raspberry Pi device, and provides internet connectivity to support mobility in case the user is out of the range of the wireless LAN.
  • An IoT end device without machine learning, the ESP32, was used instead of the Raspberry Pi 3 device. It collected the values from the waist, the shin, and the thigh and sent them to either the IoT edge or the cloud.
  • A smart IoT edge using the Raspberry Pi 4 device was employed. With its high performance, this microcomputer can predict behaviors, handle traffic from several devices, and send logs to the cloud. This device is necessary for other IoT devices that do not use machine learning. It is compact, lightweight, and may be powered by a battery or power bank, making it portable. To handle more requests and users, the edge may skip predictions for the requests coming from the smart IoT device and forward aggregated predictions to the cloud.
  • A stationary IoT edge personal computer device was also used in this study. It provides an optional alternative for nearby users; the priority between the two edges may be changed on demand based on the location of the users.
  • Azure cloud services: This cloud was used to train models, store data, create profiles for different users, and provide real-time predictions for several requests. The received predictions and telemetry data may be analyzed on the cloud for further decisions based on monitoring users for long periods of time.
With the help of a wide belt, the Raspberry Pi device and the MPU sensor could be worn around the waist and powered by a small power bank. With adjustable straps or bands, the ESP32 and the MPU sensor can be fastened to the shin and powered by small batteries. Elastic fasteners are frequently used on these straps to hold the sensor firmly in place. The ESP32 and the smartphone were configured to send updates every 50 milliseconds. The updates were received on the waist and stored temporarily until the next prediction process commences. After tuning the update time on these devices, we were able to handle new updates every cycle if all the devices were online.
The procedure on the smart end device includes managing sensing through the MPU6050 module, receiving shin and thigh parameters, performing predictions locally, and sending them to the next device. There are some cases of missing parameters from the shin, thigh, or both, but the end device can still perform predictions with the available parameters using the pre-trained models deployed on the smart end device. Its connectivity also depends on its mobility and network coverage; the default is through the Raspberry Pi 4 IoT edge; another option was to send to a stationary personal computer with edge capability or send directly to the cloud if there was no reachable IoT edge at that time. The procedure for running a smart IoT device can be summarized as follows:
  • Initialize the MPU sensor
  • Loop
  •   Read the MPU sensors
  •   Wait for sensor values from the shin
  •   Wait for sensor values from the thigh
  •   If all values arrived, then use Model-18wst
  •   Else, if values from the shin only arrived, then use model-12ws
  •   Else, if values from the thigh only arrived, then use model-12wt
  •   Else, use model-6w
  •   Perform prediction
  •   If Raspberry Pi 4 is reachable, send to Raspberry Pi 4 IoT edge
  •   Else, if PC is reachable, send to PC IoT edge
  •   Else, send to the Azure cloud
The traditional IoT end device does not have a prediction model, so after receiving the available parameters, it will pass them onto the available edge in sequence or to the cloud. The Raspberry Pi 4 IoT edge and the PC will perform the following procedure:
  • Loop
  •   Wait for requests
  •      If all values arrived, then use Model-18wst
  •      Else, if values from the shin only arrived, then use model-12ws
  •      Else, if values from the thigh only arrived, then use model-12wt
  •      Else, use model-6w
  •   Aggregate values and predictions
  •   Send aggregated results to the Azure cloud

4. Datasets

In the context of HAR, there are considerations regarding the use of public datasets versus private datasets. Several popular public datasets for activity recognition include UCI HAR, WISDM, ActivityNet, and other datasets. Public datasets often come with standardized evaluation protocols, enabling a fair comparison of different algorithms and techniques. Private datasets, on the other hand, could record activities and situations that are particular to certain domains or uses. The Discussion section provides some articles where these datasets were used. In this proposal, we used a public dataset and focused on using distributed intelligence with different scenarios rather than focusing on accuracy.
This research used a public dataset, Realworld HAR, that was created by recording a wide range of daily activities [38]. This dataset from Manheim University covers more than seven activities. This dataset’s features include acceleration, GPS, gyroscope, light, magnetic field, and sound level data of the activities of climbing stairs, jumping, lying, standing, sitting, running/jogging, and walking of fifteen subjects. For each activity, the researchers simultaneously recorded the parameters of the body positions: chest, forearm, head, shin, thigh, upper arm, and waist. A smaller version of this dataset with selected features and positions was extracted to make it possible for the IoT devices to perform.
From the hardware side, the smartphone and the MPU6050 sensor covered the acceleration and the gyroscope, respectively. These parameters were deemed to be sufficient to predict activities from three positions for four selected activities: walk, run, lie, and climb, with an accuracy that exceeded 99%. The selected positions were the waist, the shin using the MPU6050 modules, and the thigh using a smartphone in the holder’s pocket. Choosing the locations of these sensors depended on the nature of our target group of activities and the ability of the devices to be worn or held comfortably by the user. The waist movement distinguishes many body behaviors; the waist was chosen in different research studies [16,26] to be the most used place to install these sensors. The shin was used to detect movements of the legs during motion activities, and the thigh is a common place to carry a smartphone and can detect motion as well.
Different versions of the extracted datasets were used in this work. The main dataset used eighteen features from three positions and one output that recognized the activity among the four possible activities. The number of entries for this dataset was 164,000; seventy percent of the dataset was used for training, and the remainder was used for testing. The number of entries in each category is listed in Table 1. The features comprised the following:
  • Ax1, Ay1, Az1, Gx1, Gy1, and Gz1—from the accelerometer and gyroscope on the waist.
  • Ax2, Ay2, Az2, Gx2, Gy2, and Gz2—from the accelerometer and gyroscope on the shin.
  • Ax3, Ay3, Az3, Gx3, Gy3, and Gz3—from the accelerometer and gyroscope on the thigh.

5. Experiments and Results

5.1. Training Experiments

In this section, experiments were conducted to train the models in the cloud and the local network and test their performance, including accuracy for different algorithms and datasets.

5.1.1. Training Algorithms

Five algorithms were used to compare performance, including decision trees, extra trees, support vector machines (SVMs), random forests, and the light gradient-boosting machine (LightGBM). Decision trees are relatively fast and have a low computational cost during training, but decision trees can be prone to overfitting, especially when the trees become deep and complex. They may capture irrelevant features, leading to reduced generalization performance. Extra trees can be effective in capturing complex relationships in the data due to the randomness introduced during tree construction. They reduce overfitting by averaging predictions from multiple trees [5,17].
The LightGBM is a gradient-boosting framework that is designed to be efficient and scalable. It uses a technique called gradient boosting, which combines multiple models into a strong predictive model. The LightGBM is faster and more memory-efficient, making it suitable for large-scale datasets. In human activity recognition, LightGBM can be trained on diverse features and activity labels, enabling accurate classification of human activities. Support vector machines (SVMs) and random forests were also considered, and both also produced a lower level of accuracy than the LightGBM as shown in Table 2. The LightGBM was used in the rest of this work for training and real-time experiments.

5.1.2. Confusion Matrix

The confusion matrix measures how frequently the predicted classes were confused with one another when the trained model was tested. After training the model using the LightGBM, the confusion matrix was generated, as shown in Table 3. It shows the confusion between the four categories in 30% of the dataset utilized for testing. The results showed that, in comparison to other categories, there was almost no confusion between the lie category and other categories and little confusion between other categories. The percentages of confusion between the walk, climb, and run categories were slightly higher, but they were still relatively small. For example, the confusion between the run and walk categories occurred 128 times among more than 24,000 entries for these two categories.

5.1.3. Training Reduced Datasets

The resources of IoT devices are typically limited; large datasets demand fast processors and large memory. Smaller datasets can greatly speed up the inference process, especially for complex models with high volumes of input. Smaller datasets require less memory to process and store. This may lead to increased inference efficiency since the model will need to load and transform less data, which will speed up execution times. In our approach, the reduced datasets used fewer entries with the same number of features; the 40,000-entry dataset was enough to capture the required characteristics of the dataset with adequate accuracy. Other researchers, such as the authors of [39], proposed reduced datasets for activity recognition with fewer features and entries, and they achieved 96.36% accuracy using only half the size of the dataset, compared to 98.7% when all the features and entries were used.
This architecture employed restricted devices for their price and availability. With less than 25% of the total entries, the accuracy difference was only 0.04%, yet the accuracy was still quite excellent at 99.19%. It was clear from this experiment that an accurate model may be extracted from the reduced dataset. Furthermore, it was seen that the smaller dataset had faster prediction times for the edge and smart end devices; instead of 8.33 milliseconds for each prediction for the Raspberry Pi 3 end device, it took 6.38 milliseconds, and for the Raspberry Pi 4 edge device, it took 1.62 milliseconds instead of 2.44 milliseconds for the larger dataset. This was another reason for choosing the smaller dataset of the two kits.
Under real-time prediction, numerous factors could prevent these features from being available. For instance, the smartphone might not work, or the shin-wearable sensor might have connectivity issues or problems with operation. In the case of missing features, we considered the waist-worn smart device with its sensor module as the primary component, and the other two positions were deemed to be optional. The sensor at the waist will be necessary for the system to function. We noted that some papers that have been listed in the references only used the waist. Therefore, as indicated in Table 4, three more datasets were employed to train additional optional models: one with the waist and shin (model-12ws), one with the waist and thigh (model-12wt), and the last only with the waist (model-6w).
According to the accuracy results that have been presented in Table 4, the more features present in a model (model-18wst), the more accurate the system will be; however, even when some of the features were missing, the device was still able to operate fairly. Twelve features out of the eighteen produced more than 95% accuracy, and six features from the waist produced 86% accuracy. Table 4 further demonstrates that combining the waist and shin produced better results than combining the waist and thigh. This was because the movements we predicted primarily relied on the shin’s movement, which made it easier to identify how walking, running, and climbing affected the sensed values that were located there.

5.2. Real-Time Experiments

After the models were trained, they were deployed on different devices to predict activities in real time. In this section, response times and real-time accuracy were measured. The dynamic selection of models was tested on the smart end device and the edge. Dynamic connectivity to the edges was tested on the end devices, and scalability was calculated by gradually increasing the number of users.

5.2.1. Prediction Time

Table 5 illustrates the prediction time on the smart devices for the four models explained earlier. It was noted that the fewer the parameters, the faster the response time, but the difference was not significant on the same device. The prediction time was measured using a sample of one thousand requests for each value in the table.
The smart IoT device was the slowest among other devices; it took 6.38 milliseconds per request on average for model-18wst, but this device only serves one user, and the arrival rate of requests was one every 50 milliseconds, which makes it adequate to handle all the requests for this user even if the arrival rate becomes one request every 10 milliseconds. The Raspberry Pi 4 edge was used to serve more users, so it received requests from a group of users and executed predictions. If one request took 1.62 milliseconds on this edge and the arrival rate was one every 50 milliseconds from each user, then it would serve about 30 users. For users with mobility requirements, the Raspberry Pi 4 edge was deemed to be the ideal option due to its portability. The personal computer edge was found to be faster than the Raspberry Pi 4; it took around 1 millisecond per prediction. Since the hardware components like memory and CPU for computers are normally higher than those for microcomputers, this will enable the PC edge to serve more users at a time.

5.2.2. Real-Time Accuracy

Real-time accuracy measures how accurate the results are while running on the device after being trained; the reference in this case was the model with the dataset before reduction, which was located on the Azure cloud using a cloud web service. As mentioned earlier, the training accuracy for this dataset using the LightGBM was 99.23%, which made it ideal to compare the results of other models with this model since it gave the best accuracy among the others. Here, the configuration was to predict activities on two models at a time, the models on the edge against the model on the cloud, and compare their results. Model-18wst produced 93.5% accuracy, Model-12ws came next with 91.2%, Model-12wt with 89.6%, and finally Model-6w with 82.4%, as illustrated in Table 6.
The results of the real-time accuracy were not as high as they were in training, but they are still sufficient for a wide range of applications. Some reasons include the MPU6050 sensor’s accuracy, which is affected by calibration, noise, and sensor orientation. The smartphone has a number of similar issues with reading sensor values, and the synchronization between the different devices during motion also affects their results.
The cloud service in this case was used for real-time prediction, but the time consumed was around 391 milliseconds, from request to the cloud, to the prediction process in the cloud, and back to the IoT device. The cloud’s time was around 240 times that of the Raspberry Pi 4 edge and 61 times that of the Raspberry Pi 3 smart end device. The transmission delay between the local devices and the cloud took up the majority of the time, which made it unrealistic to send all the requests to be processed there. The other option was to send frequent updates to the cloud to update users’ profiles to be used for analyses and recommendations and to assure the results coming from the edge and end devices.

5.2.3. Dynamic Model Deployment

Dynamic decisions were used in two cases: the first in the model selection for the smart IoT device and the IoT edge when performing predictions, and the second for the end device in the connection to the suitable edge or cloud based on the connectivity status. According to the procedure previously outlined in the section on the proposed architecture, both cases operated successfully.
In the first case, the normal scenario was that the sensors were capturing signals and sending frequent updates every 50 milliseconds. But sometimes the smartphone in the pocket is not connected, missing, or out of battery; in that case, the device on the waist will detect the missing features and use a suitable model. A similar situation occurs when the shin device does not send features for similar reasons. For several applications, it is better to send the available features and obtain less accurate results than to stop the operation. Table 7 describes the cases where all the features, or a smaller number of features, are present and the reaction of the system in each case on the smart end device. The same applied for the edge, but the prediction time was better than the smart end device, and all the models were also available there. The default case is when all the features arrive; this will produce the best accuracy; the next priority was when two out of three sensors worked, and the minimum was when the waist only worked, as described in Table 7.
In the second case, the scenarios were tested according to the available connection, where the smart end and the IoT sensor devices periodically checked the connection status to the edge device. Since the UDP is connectionless, these devices should use other network protocols, like the Internet Control Message Protocol (ICMP), to test the connection between the device and the edge from time to time. The following scenarios were tested, and the reactions were executed successfully:
  • In the first scenario, when the Raspberry Pi 4 edge device is online, the device sends data to the Raspberry P4 edge. Here, the edge supports aggregation, mobility, and fast responses.
  • In the second scenario, when the Raspberry Pi 4 edge is offline and the edge PC is online, the device sends data to the PC edge. Here, the edge supports aggregation and fast responses but does not provide mobility.
  • In the third scenario, when the connection with both edges is not available, the end device can directly communicate with the cloud.
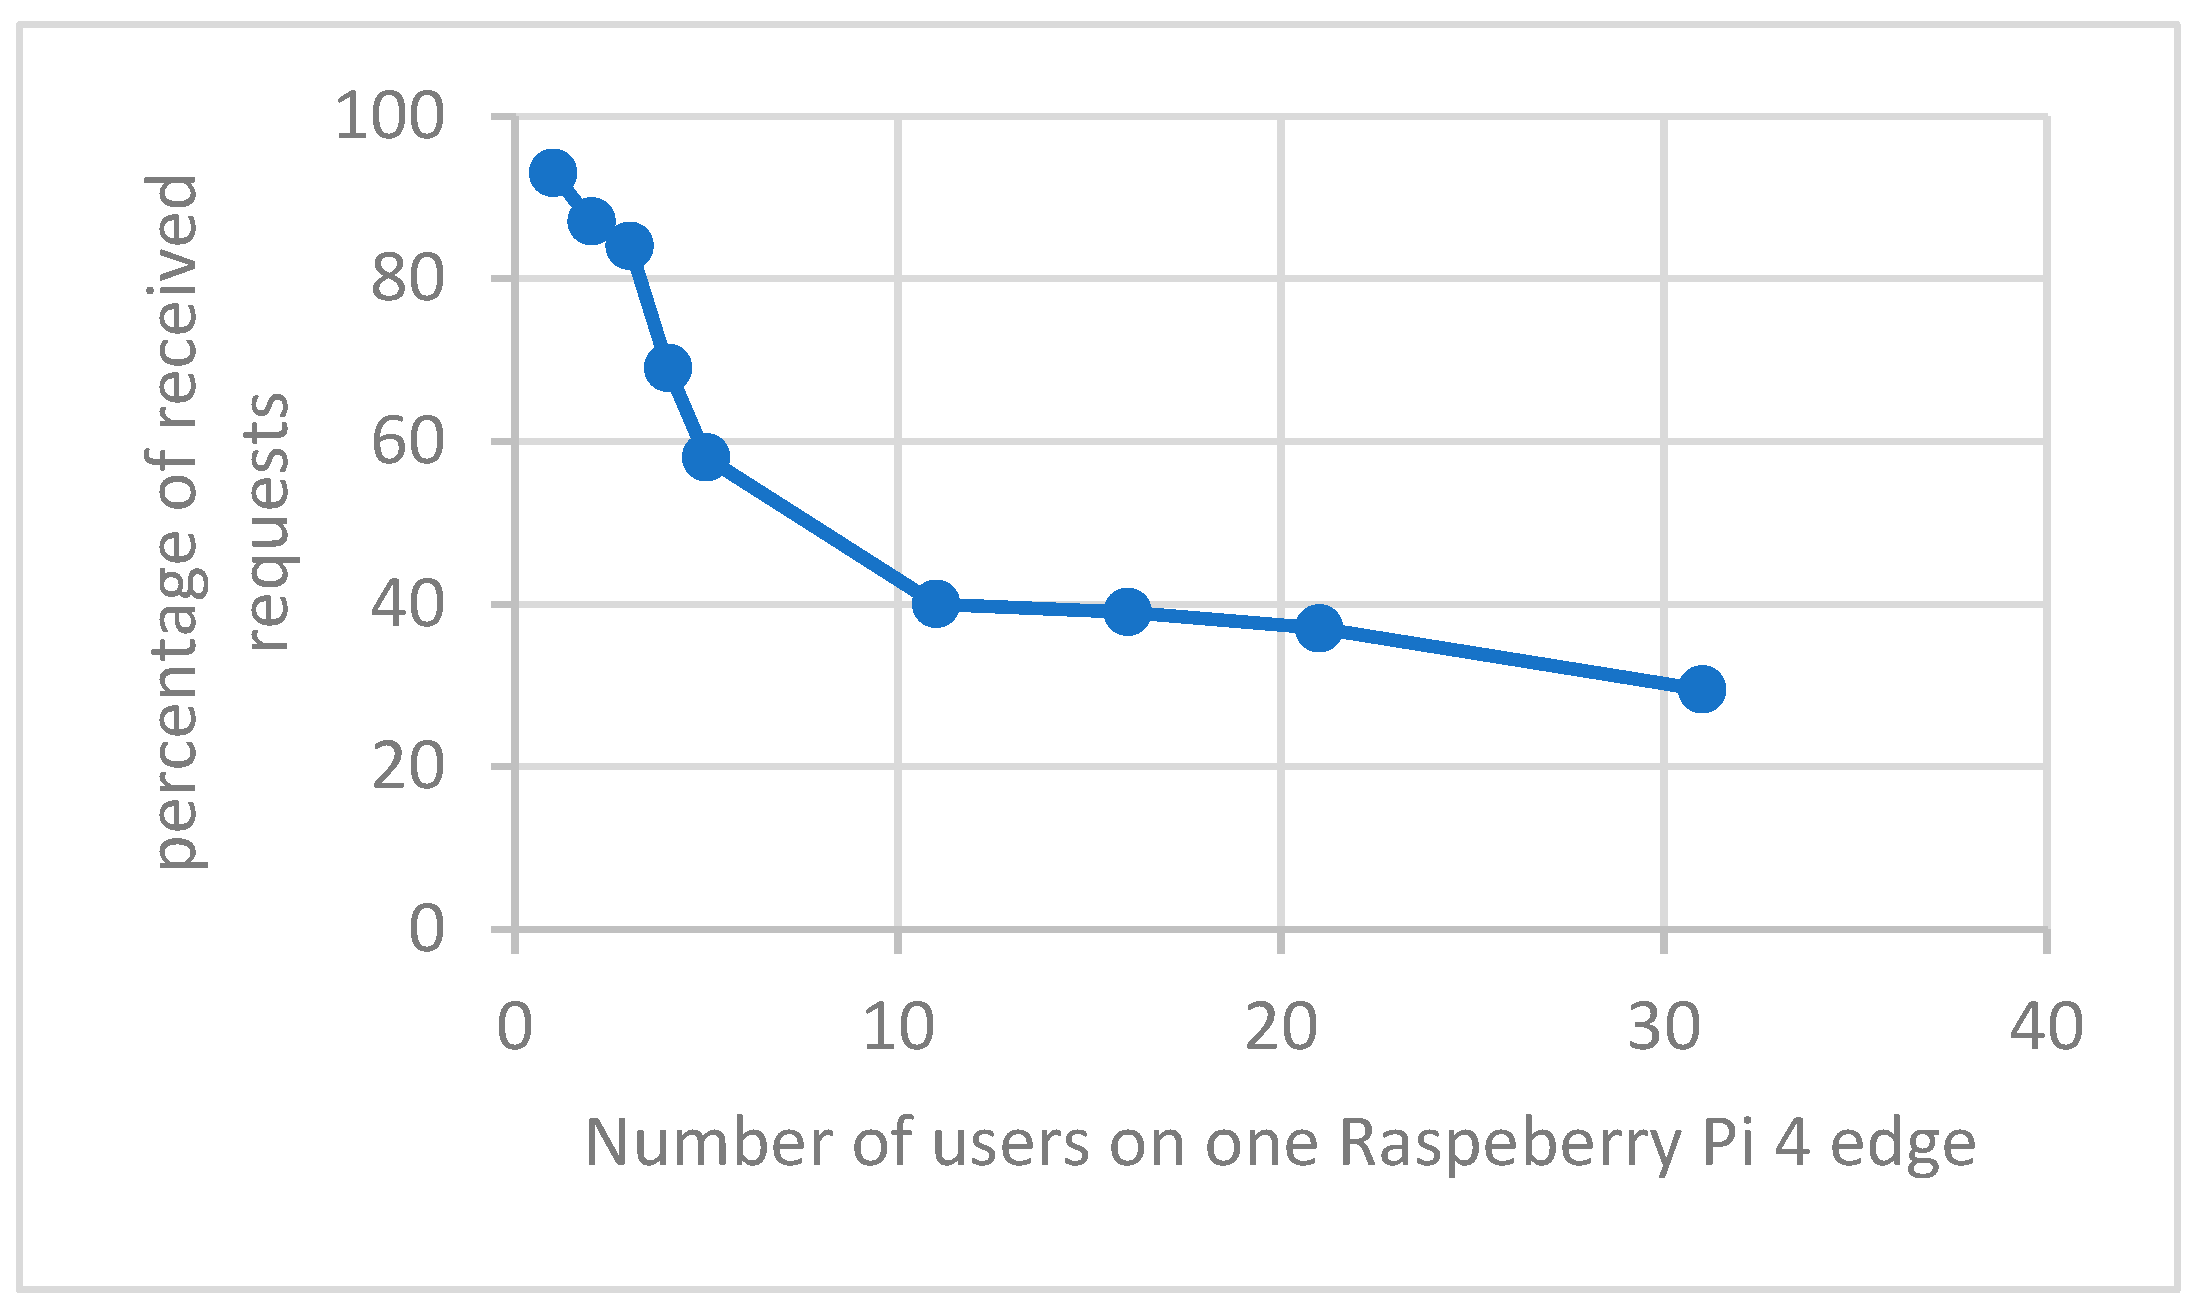
5.2.4. Scalability

The choice of transport protocol inside the wireless LAN, such as the Transmission Control Protocol (TCP) or the User Datagram Protocol (UDP), for sending telemetry IoT data in a local environment depends on the required application [40,41]. The UDP is connectionless, faster, and more effective at transmitting short, frequent data packets, as it has less protocol overhead. Compared to the UDP, the TCP offers enhanced security, a three-way handshake, error detection, retransmission in case of a transmission failure, and network congestion avoidance. The UDP can result in lower latency for real-time or time-sensitive applications like HAR. The UDP does not have the built-in mechanisms for acknowledging and retransmitting lost packets; it is often described as best-effort delivery. There could be fewer requests delivered if some requests are dropped in the UDP, but HAR can still work with fewer requests but with fewer frequent updates.
The Message Queuing Telemetry Transport (MQTT) protocol is based on the TCP and is used by the Azure cloud. The MQTT protocol is a lightweight messaging protocol designed for efficient communications between devices and the cloud. Due to its low bandwidth and low power consumption requirements, which make it appropriate for devices with limited resources, it is widely used in the IoT [42]. The communication between the devices and Azure is encrypted to ensure the confidentiality and integrity of the data transmitted [1,40].
In this architecture, MQTT was used between the local network and the cloud, and the UDP was employed inside the local network. Table 8 shows that an increasing number of users and requests produced a lower percentage of requests received. Sending 20 requests every one second from each user using the UDP produced fewer received requests, some of which were dropped via congestion, buffer overflow, or timeout. The more users send to the same edge, the fewer requests are received. Theoretically, if the arrival rate is one request every 50 milliseconds from each user and the edge can serve one request in 1.62 milliseconds on average, then the edge can serve around 30 users without dropping any request, but since the behavior of the UDP is connectionless and other devices and applications are using the network, this will cause a lower delivery rate.
The number of active users in a wireless LAN affects the number of requests that are received at the edge; request delivery also depends on network capacity, the number of active devices, and usage. Figure 3 shows that as more users produce more requests, one user may face drop messages since the network is being used for different network connections. This figure showed that when there are 11 active end devices, only 40% of the requests are being delivered in one second; this means that 8 requests per second will arrive instead of 20 requests for one user, and 12 requests are dropped. This amount can still recognize the user behavior for some applications, like sports, for example, but not for other applications like healthcare or time-sensitive applications, and this may cause a problem. This figure also demonstrated that this architecture was scalable by handling more than 30 users with around 6 requests per second from each user, and if we need to add more users or increase the successful delivered requests, we may add more edge devices.

6. Discussion

A number of recent research studies were discussed in the literature review [8,16,35,36,37]. These studies were published between the years of 2019 and 2023. The authors developed systems to recognize human activity and detect falls using a variety of sensor types and datasets that were both publicly available and self-recorded. The primary elements and results of these articles are listed in Table 9. The listed publications did not mention cases where loss of features or abnormal conditions occurred. Most of the solutions focused on a single user, and some of them used special types of sensors. Some of these sensors were reportedly neither easy nor comfortable to wear.
The architecture in this proposal used accelerometer and gyroscope readings from each of the three positions. A public dataset was utilized to identify four different activities. The retrieved datasets were deployed on cloud, edge, and smart devices with varying numbers of features. Potential cases in local network and cloud scenarios were used to measure performance. Real-time testing showed the accuracy was still high with 93.5%, and dynamic selection worked efficiently, even with one sensor on the waist with more than 82.4% and more than 90% with two active sensors. The system also managed to connect dynamically with the suitable edge and send information to the cloud. Finally, the scalability was measured in real time, and the edges were able to handle a reasonable number of users with the same accuracy but with fewer requests.
The employed dataset is a portion of a larger dataset; these smaller datasets were used on devices with limited resources without lowering the accuracy. The types of sensors and other wearable hardware elements in this proposal are small or typically available, like the smartphone in a pocket. This architecture offers mobility by employing portable edge devices and smart end devices.

7. Conclusions

Wearable sensors are being used to monitor human activities and detect falls using machine learning techniques, and datasets are available to train systems and architectures. This paper proposes an architecture to monitor a group of people and recognize their behavior. This system was distributed over various devices, including sensor devices, smart IoT devices, edge devices, and cloud computing. The architecture used different machine learning models with different numbers of features to be able to handle scenarios where not all the sensors are available. The smart IoT device used a simple version of the Raspberry Pi microcomputer that was configured to run predictions locally. The Raspberry Pi 4 IoT edge could serve IoT devices and then run predictions and aggregate results in the cloud. The cloud process requests achieved an accuracy of 99.23% in training, while the edge and smart end devices achieved 99.19% accuracy with smaller datasets. The accuracy under real-time scenarios was measured and achieved 93.5% when all the features were available. The smart end device could process every request in 6.38 milliseconds on average, and the edge could process faster with 1.62 milliseconds on average and serve a group of users with a sufficient number of predictions per user, and the system is capable of serving more people using more edges or smart end devices. The architecture used distributed intelligence to be dynamic, accurate, and support mobility.
In addition to its great performance, this proposal provided the following features:
  • Integration and cooperation between the devices were efficient.
  • The achieved accuracy was 99.19% in training and 93.5% in real time.
  • The prediction time was efficient using the smart end and IoT edge devices.
  • Dynamic selection worked efficiently in the case of connectivity with the edges.
  • Dynamic selection of models worked efficiently in the case of feature availability.
  • The architecture is scalable and serves more than 30 users per edge.

Author Contributions

Conceptualization, A.W. and T.G.; methodology, A.W.; software, A.W.; validation, A.W. and T.G.; formal analysis, A.W.; investigation A.W., T.G., N.S. and K.A.; resources, N.S.; data curation, A.W.; writing—original draft preparation, A.W.; writing—review and editing, A.W. and T.G.; visualization, A.W.; supervision, T.G.; project administration, K.A. All authors have read and agreed to the published version of the manuscript.

Funding

This research received no external funding.

Data Availability Statement

The raw data supporting the conclusions of this article will be made available by the authors on request.

Conflicts of Interest

The authors declare no conflicts of interest.

References

  1. Esposito, M.; Belli, A.; Palma, L.; Pierleoni, P. Design and Implementation of a Framework for Smart Home Automation Based on Cellular IoT, MQTT, and Serverless Functions. Sensors 2023, 23, 4459. [Google Scholar] [CrossRef] [PubMed]
  2. Franco, T.; Sestrem, L.; Henriques, P.R.; Alves, P.; Varanda Pereira, M.J.; Brandão, D.; Leitão, P.; Silva, A. Motion Sensors for Knee Angle Recognition in Muscle Rehabilitation Solutions. Sensors 2022, 22, 7605. [Google Scholar] [CrossRef] [PubMed]
  3. Zhuang, Z.; Xue, Y. Sport-Related Human Activity Detection and Recognition Using a Smartwatch. Sensors 2019, 19, 5001. [Google Scholar] [CrossRef] [PubMed]
  4. Zhou, E.; Zhang, H. Human action recognition toward massive-scale sport sceneries based on deep multi-model feature fusion. Signal Process. Image Commun. 2020, 84, 115802. [Google Scholar] [CrossRef]
  5. Zhang, S.; Li, Y.; Zhang, S.; Shahabi, F.; Xia, S.; Deng, Y.; Alshurafa, N. Deep Learning in Human Activity Recognition with Wearable Sensors: A Review on Advances. Sensors 2022, 22, 1476. [Google Scholar] [CrossRef] [PubMed]
  6. Bianchi, V.; Bassoli, M.; Lombardo, G.; Fornacciari, P.; Mordonini, M.; De Munari, I. IoT Wearable Sensor and Deep Learning: An Integrated Approach for Personalized Human Activity Recognition in a Smart Home Environment. IEEE Internet Things J. 2019, 6, 8553–8562. [Google Scholar] [CrossRef]
  7. Abdel-Basset, M.; Hawash, H.; Chakrabortty, R.K.; Ryan, M.; Elhoseny, M.; Song, H. ST-DeepHAR: Deep Learning Model for Human Activity Recognition in IoHT Applications. IEEE Internet Things J. 2021, 8, 4969–4979. [Google Scholar] [CrossRef]
  8. Issa, M.E.; Helmi, A.M.; Al-Qaness, M.A.A.; Dahou, A.; Elaziz, M.A.; Damaševičius, R. Human Activity Recognition Based on Embedded Sensor Data Fusion for the Internet of Healthcare Things. Healthcare 2022, 10, 1084. [Google Scholar] [CrossRef]
  9. Qu, Y.; Tang, Y.; Yang, X.; Wen, Y.; Zhang, W. Context-aware mutual learning for semi-supervised human activity recognition using wearable sensors. Expert Syst. Appl. 2023, 219, 119679. [Google Scholar] [CrossRef]
  10. Gulati, N.; Kaur, P.D. An argumentation enabled decision making approach for Fall Activity Recognition in Social IoT based Ambient Assisted Living systems. Future Gener. Comput. Syst. 2021, 122, 82–97. [Google Scholar] [CrossRef]
  11. Nasir, M.; Muhammad, K.; Ullah, A.; Ahmad, J.; Baik, S.W.; Sajjad, M. Enabling automation and edge intelligence over resource constraint IoT devices for smart home. Neurocomputing 2022, 491, 494–506. [Google Scholar] [CrossRef]
  12. Hong, Z.; Hong, M.; Wang, N.; Ma, Y.; Zhou, X.; Wang, W. A wearable-based posture recognition system with AI-assisted approach for healthcare IoT. Future Gener. Comput. Syst. 2022, 127, 286–296. [Google Scholar] [CrossRef]
  13. Khan, I.U.; Afzal, S.; Lee, J.W. Human Activity Recognition via Hybrid Deep Learning Based Model. Sensors 2022, 22, 323. [Google Scholar] [CrossRef] [PubMed]
  14. Tanigaki, K.; Teoh, T.C.; Yoshimura, N.; Maekawa, T.; Hara, T. Predicting Performance Improvement of Human Activity Recognition Model by Additional Data Collection. Proc. ACM Interact. Mob. Wearable Ubiquitous Technol. 2022, 6, 142. [Google Scholar] [CrossRef]
  15. Khalid, A.M.; Khafaga, D.S.; Aldakheel, E.A.; Hosny, K.M. Human Activity Recognition Using Hybrid Coronavirus Disease Optimization Algorithm for Internet of Medical Things. Sensors 2023, 23, 5862. [Google Scholar] [CrossRef] [PubMed]
  16. Yen, C.-T.; Liao, J.-X.; Huang, Y.-K. Feature Fusion of a Deep-Learning Algorithm into Wearable Sensor Devices for Human Activity Recognition. Sensors 2021, 21, 8294. [Google Scholar] [CrossRef] [PubMed]
  17. Qiu, S.; Zhao, H.; Jiang, N.; Wang, Z.; Liu, L.; An, Y.; Zhao, H.; Miao, X.; Liu, R.; Fortino, G. Multi-sensor information fusion based on machine learning for real applications in human activity recognition: State-of-the-art and research challenges. Inf. Fusion 2022, 80, 241–265. [Google Scholar] [CrossRef]
  18. Islam, M.M.; Nooruddin, S.; Karray, F.; Muhammad, G. Multi-level feature fusion for multimodal human activity recognition in Internet of Healthcare Things. Inf. Fusion 2023, 94, 17–31. [Google Scholar] [CrossRef]
  19. Chen, J.; Sun, Y.; Sun, S. Improving Human Activity Recognition Performance by Data Fusion and Feature Engineering. Sensors 2021, 21, 692. [Google Scholar] [CrossRef]
  20. Tuli, S.; Basumatary, N.; Gill, S.S.; Kahani, M.; Arya, R.C.; Wander, G.S.; Buyya, R. HealthFog: An ensemble deep learning based Smart Healthcare System for Automatic Diagnosis of Heart Diseases in integrated IoT and fog computing environments. Future Gener. Comput. Syst. 2020, 104, 187–200. [Google Scholar] [CrossRef]
  21. Aazam, M.; Zeadally, S.; Flushing, E.F. Task offloading in edge computing for machine learning-based smart healthcare. Comput. Netw. 2021, 191, 108019. [Google Scholar] [CrossRef]
  22. Ghosh, A.M.; Grolinger, K. Edge-Cloud Computing for Internet of Things Data Analytics: Embedding Intelligence in the Edge With Deep Learning. IEEE Trans. Ind. Inform. 2021, 17, 2191–2200. [Google Scholar] [CrossRef]
  23. Agarwal, P.; Alam, M. A Lightweight Deep Learning Model for Human Activity Recognition on Edge Devices. Procedia Comput. Sci. 2020, 167, 2364–2373. [Google Scholar] [CrossRef]
  24. Bourechak, A.; Zedadra, O.; Kouahla, M.N.; Guerrieri, A.; Seridi, H.; Fortino, G. At the Confluence of Artificial Intelligence and Edge Computing in IoT-Based Applications: A Review and New Perspectives. Sensors 2023, 23, 1639. [Google Scholar] [CrossRef] [PubMed]
  25. Shaik, T.; Tao, X.; Higgins, N.; Li, L.; Gururajan, R.; Zhou, X.; Acharya, U.R. Remote patient monitoring using artificial intelligence: Current state, applications, and challenges. WIREs Data Min. Knowl. Discov. 2023, 13, e1485. [Google Scholar] [CrossRef]
  26. Mwase, C.; Jin, Y.; Westerlund, T.; Tenhunen, H.; Zou, Z. Communication-efficient distributed AI strategies for the IoT edge. Future Gener. Comput. Syst. 2022, 131, 292–308. [Google Scholar] [CrossRef]
  27. Tang, Y.; Zhang, L.; Wu, H.; He, J.; Song, A. Dual-Branch Interactive Networks on Multichannel Time Series for Human Activity Recognition. IEEE J. Biomed. Health Inform. 2022, 26, 5223–5234. [Google Scholar] [CrossRef]
  28. Al-Atawi, A.A.; Alyahyan, S.; Alatawi, M.N.; Sadad, T.; Manzoor, T.; Farooq-i-Azam, M.; Khan, Z.H. Stress Monitoring Using Machine Learning, IoT and Wearable Sensors. Sensors 2023, 23, 8875. [Google Scholar] [CrossRef]
  29. Duggal, R.; Gupta, N.; Pandya, A.; Mahajan, P.; Sharma, K.; Angra, P. Building structural analysis based Internet of Things network assisted earthquake detection. Internet Things 2022, 19, 100561. [Google Scholar] [CrossRef]
  30. Mekruksavanich, S.; Jitpattanakul, A. Sport-related activity recognition from wearable sensors using bidirectional gru network. Intell. Autom. Soft Comput. 2022, 34, 1907–1925. [Google Scholar] [CrossRef]
  31. Tarafdar, P.; Bose, I. Recognition of human activities for wellness management using a smartphone and a smartwatch: A boosting approach. Decis. Support Syst. 2021, 140, 113426. [Google Scholar] [CrossRef]
  32. Liu, Y.; Li, Z.; Zheng, S.; Cai, P.; Zou, X. An Evaluation of MEMS-IMU Performance on the Absolute Trajectory Error of Visual-Inertial Navigation System. Micromachines 2022, 13, 602. [Google Scholar] [CrossRef]
  33. Dong, D.; Ma, C.; Wang, M.; Vu, H.T.; Vanderborght, B.; Sun, Y. A low-cost framework for the recognition of human motion gait phases and patterns based on multi-source perception fusion. Eng. Appl. Artif. Intell. 2023, 120, 105886. [Google Scholar] [CrossRef]
  34. Krupitzer, C.; Sztyler, T.; Edinger, J.; Breitbach, M.; Stuckenschmidt, H.; Becker, C. Beyond position-awareness—Extending a self-adaptive fall detection system. Pervasive Mob. Comput. 2019, 58, 101026. [Google Scholar] [CrossRef]
  35. Xu, T.; Sun, W.; Lu, S.; Ma, K.; Wang, X. The real-time elderly fall posture identifying scheme with wearable sensors. Int. J. Distrib. Sens. Netw. 2019, 15, 1550147719885616. [Google Scholar] [CrossRef]
  36. Yazici, A.; Zhumabekova, D.; Nurakhmetova, A.; Yergaliyev, Z.; Yatbaz, H.Y.; Makisheva, Z.; Lewis, M.; Ever, E. A smart e-health framework for monitoring the health of the elderly and disabled. Internet Things 2023, 24, 100971. [Google Scholar] [CrossRef]
  37. Kulurkar, P.; Dixit, C.K.; Bharathi, V.C.; Monikavishnuvarthini, A.; Dhakne, A.; Preethi, P. AI based elderly fall prediction system using wearable sensors: A smart home-care technology with IOT. Meas. Sens. 2023, 25, 100614. [Google Scholar] [CrossRef]
  38. Mannheim University. Germany—Research Group Data and Web Science, DataSet—RealWorld (HAR). Available online: https://sensor.informatik.uni-mannheim.de/#dataset_realworld (accessed on 30 October 2023).
  39. Ray, S.; Alshouiliy, K.; Agrawal, D.P. Dimensionality Reduction for Human Activity Recognition Using Google Colab. Information 2021, 12, 6. [Google Scholar] [CrossRef]
  40. Jain, V.; Liu, K. Hybrid IoT System for Emergency Responders. In Proceedings of the 2023 11th IEEE International Conference on Mobile Cloud Computing, Services, and Engineering (MobileCloud), Services, Athens, Greece, 17–20 July 2023; pp. 59–66. [Google Scholar] [CrossRef]
  41. Qi, W.; Wang, N.; Su, H.; Aliverti, A. DCNN based human activity recognition framework with depth vision guiding. Neurocomputing 2022, 486, 261–271. [Google Scholar] [CrossRef]
  42. Gemirter, C.B.; Şenturca, Ç.; Baydere, Ş. A Comparative Evaluation of AMQP, MQTT and HTTP Protocols Using Real-Time Public Smart City Data. In Proceedings of the 2021 6th International Conference on Computer Science and Engineering (UBMK), Ankara, Turkey, 15–17 September 2021; pp. 542–547. [Google Scholar] [CrossRef]
Figure 1. Accelerometer and gyroscope directions in the MPU6050 module and smartphones, (a,b) shows MPU6050 directions, and (c) shows the smartphone directions [32,35].
Jsan 13 00005 g001
Figure 2. Distributed intelligence architecture for human activity recognition.
Jsan 13 00005 g002
Figure 3. Percentage of received requests per user for different numbers of users.
Jsan 13 00005 g003
Table 1. Number of entries in the dataset.
CategoryNumber of Entries
Climb39,000
Lie41,000
Run40,000
Walk44,000
Total164,000
Table 2. Accuracy of five algorithm trainings.
ModelTraining Accuracy (%)
LightGBM99.23
Extra trees98.03
Decision trees96.56
SVM97.68
Random forest91.8
Table 3. The confusion matrix of the model with the LightGBM.
Predicted Category
ClimbLieRunWalk
True categoryClimb11,482024144
Lie212,26474
Run18011,937100
Walk5502813,138
Table 4. Four models using the LightGBM with different numbers of features.
ModelFeaturesAccuracy (%)
Model-18wstWaist: Ax1, Ay1, Az1, Gx1, Gy1, and Gz1
Shin: Ax2, Ay2, Az2, Gx2, Gy2, and Gz2
Thigh: Ax3, Ay3, Az3, Gx3, Gy3, and Gz3
99.19
Model-12wsWaist: Ax1, Ay1, Az1, Gx1, Gy1, and Gz1
Shin: Ax2, Ay2, Az2, Gx2, Gy2, and Gz2
97.66
Model-12wtWaist: Ax1, Ay1, Az1, Gx1, Gy1, and Gz1
Thigh: Ax3, Ay3, Az3, Gx3, Gy3, and Gz3
95.46
Model-6wWaist: Ax1, Ay1, Az1, Gx1, Gy1, and Gz185.97
Table 5. Average prediction time for different models in milliseconds on three devices.
RoleDeviceModel-18wstModel-12wsModel-12wtModel-6w
Smart IoT deviceRaspberry Pi 36.385.635.415.20
Portable IoT edgeRaspberry Pi 41.621.511.521.48
Stationary IoT edgePC1.170.920.910.86
Table 6. Real-time accuracy using the four models.
Model-12wstModel-12wsModel-12wtModel-6w
93.5%91.2%89.6%82.4%
Table 7. Smart IoT end device scenarios.
ScenarioReactionPrediction Time (ms)Real-Time Accuracy (%)
IoT device received parameters from all three sensorsUse Model-18wst6.3893.5
IoT device received parameters from the waist and shinUse Model-12ws5.6391.2
IoT device received parameters from the waist and thighUse Model-12wt5.4189.6
IoT device only received parameters from the waistUse Model-6w5.2082.4
Table 8. Number of senders and received requests at the edge.
Number of UsersPercentage of Received Requests per User (%)Average Number of Received Requests
193.4718.7
287.317.46
38416.8
468.9213.78
558.6911.74
1140.168.03
1638.757.75
2137.517.5
3129.55.9
Table 9. Related publication comparisons.
Ref., YearDatasetSensorsPerformance
[8], 2022WISDMTwo smartphones in the pocket and on the handHAR accuracy: 98.7%
[16], 2021UCI and self-recordedMPU6050HAR using the UCI dataset: 97.49%
HAR using the self-recorded dataset: 96.27%
[35], 2019No dataset—the system used tilt angle and accelerationMPU6050 and graphene/rubber sensorsDaily living detection: 93.5%
Fall posture identification: 90%
[36], 2023MHEALTH dataset
DML Smart Actions dataset
ECG sensors, MPU9250, and multimedia sensorsHAR training accuracy: 96%
Video-based HAR and fall detection: 86.97%
[37], 2022MobiActFive sensors from the LSM6DS0 accelerometerHAR training: 95.87%
This paperRealworld HARTwo modules of MPU6050 and one smartphone, accelerometers, and gyroscopesHAR training accuracy: 99.23%
HAR real-time accuracy: 93.5%
Edge prediction time: 1.62 milliseconds
IoT device prediction time: 5.83 milliseconds
Dynamic model selection
Dynamic edge selection
Scalable number of users
Disclaimer/Publisher’s Note: The statements, opinions and data contained in all publications are solely those of the individual author(s) and contributor(s) and not of MDPI and/or the editor(s). MDPI and/or the editor(s) disclaim responsibility for any injury to people or property resulting from any ideas, methods, instructions or products referred to in the content.

