
Low-Cost Internet of Things Solution for Building Information Modeling Level 3B—Monitoring, Analysis and Management


Faculty of Geodesy and Cartography, Warsaw University of Technology, Politechniki Square 1, 00-661 Warsaw, Poland
J. Sens. Actuator Netw. 2024, 13(2), 19; https://doi.org/10.3390/jsan13020019
Submission received: 26 January 2024
/
Revised: 23 February 2024
/
Accepted: 27 February 2024
/
Published: 29 February 2024
Abstract
:The integration of the Internet of Things (IoT) and Building Information Modeling (BIM) is progressing. The use of microcontrollers and sensors in buildings is described as a level 3B maturity in the use of BIM. Design companies, contractors and building operators can use IoT solutions to monitor, analyze or manage processes. As a rule, solutions based on original Arduino boards are quite an expensive investment. The aim of this research was to find a low-cost IoT solution for monitoring, analysis and management, and integrate it with a BIM model. In the present study, an inexpensive NodeMCU microcontroller and a temperature and pressure sensor were used to study the thermal comfort of users in a single-family home. During the summer season, analysis of the monitored temperature can contribute to installation (HVAC) or retrofit work (for energy efficiency). The article presents a low-cost solution for studying the thermal comfort of users using a digital twin built-in BIM. Data obtained from sensors can support both the design and management processes. The main contribution of the article enables the design, construction and use of low-cost circuits (15.57 USD) even in small developments (single-family houses, semi-detached houses, terraced houses, atrium buildings). Combining IoT sensor telemetry with BIM (maturity level 3C) is a challenge that organizations will face in the near future.
1. Introduction
The acronym BIM (Building Information Modeling) is variously developed and understood in the broader AECOO (Architecture, Engineering, Construction, Owner Operator) industry. Generally, researchers or organizations try to reduce BIM to a single understanding [1]. The organization buildingSMART has taken a slightly different approach [2]. It breaks down the acronym BIM into three separate concepts and defines each separately. BIM developed as the Building Information Model is understood as files (often in unique formats) that can be extracted, exchanged, or combined to support decision-making involving a building or other facilities. BIM developed as Building Information Modeling is a process involving the generation and management of digital representations of a building’s physical and functional features. BIM developed as Building Information Management is understood as the organization and control of investment processes by using the parameters of a digital building model to exchange information about assets throughout the investment cycle. However, the synthesis of all these definitions boils down to the same thing: a relational database accompanying a building asset throughout its lifecycle [3], which can be used for various purposes (not just decision-making). At the same time, BIM is a process by which a digital twin of an existing or planned construction object can be created. The process involves gathering all the information in a model that aims to reflect reality as closely as possible. Typically, at the design stage, the BIM model is used to conduct various analyses, simulate construction, and to plan the renovations or ongoing maintenance of already-existing buildings [4]. The idea behind BIM is that the model accompanies the building throughout its lifecycle and, as far as possible, should faithfully represent the actual state of the building. Any planned change (modernization, reconstruction) in the facility should first be simulated in the BIM model, and only after proper verification and validation can the renovation or reconstruction process itself be launched. BIM modeling allows for the design of more efficient and effective architecture along with the ability to predict the performance of the facility, which in turn provides the ability to manage this information at a later stage [5]. All the useful data and information that make up the building model are contained in a relational database that can be used in the operational phase. Digital twins, on the other hand, is a broader concept that includes virtual copies of actual manufactured or planned facilities. At the same time, such a digital twin is an active model, developed and changed during the life of the building facility. Energy efficiency or carbon footprints can be studied using BIM [6]. Tests and simulations can be carried out on the virtual model, which saves time and money, resulting in increased efficiency and productivity [7]. The digital twin enables the control of the construction process and monitoring of all project activities, reducing the risk of design, execution, or use errors [8]. A good, reliable, and up-to-date BIM model can be an example of a digital twin that will generate value for various stakeholders in the investment process. However, achieving complex digital twins often requires the coordination of technologies and paradigms [9].
The adoption of BIM is growing [10] and is increasingly applied to facility management (FM) during operation [11]. Using BIM for this purpose improves the management of a building’s floor space, returning at least up-to-date data on rooms and the arrangement of equipment in them. With a BIM model, the project manager has the ability to manage pedestrian or vehicular traffic, such as administering changes in the location of users and adjusting any infrastructure to meet their needs. The BIM model can be helpful in managing renovations (estimating costs, scheduling, or monitoring construction work), as well as in the ongoing maintenance of the facility, taking into account, for example, the wear and tear of fixed assets or equipment. Thanks to BIM, it is possible to monitor energy, water, and heat consumption, but also track the carbon footprint or calculate any energy indicators. BIM finds its application in sunlight analysis, e.g., shading or shadowing. Performing them at the design or construction stage of a project later allows for an optimal design of artificial lighting inside the building. BIM can support decisions on locating off-road equipment or playgrounds. A major advantage of BIM technology is the ability to perform simulations. Having access to all the necessary information about a building is useful for managing crisis situations such as evacuation, and with the help of previously conducted simulations on the BIM model, evacuation can be carried out effectively and quickly, in case the lives of building occupants are threatened. However, the aforementioned analysis and simulations can be made even richer by using sensors as part of the so-called Internet of Things (IoT). The idea is to read data from sensors implemented in equipment and/or machines, as well as independently occurring sensors [12]. The data obtained from them can be used to create an even more sophisticated analysis [13]. The use of IoT in BIM is often considered a high level of so-called maturity [14].
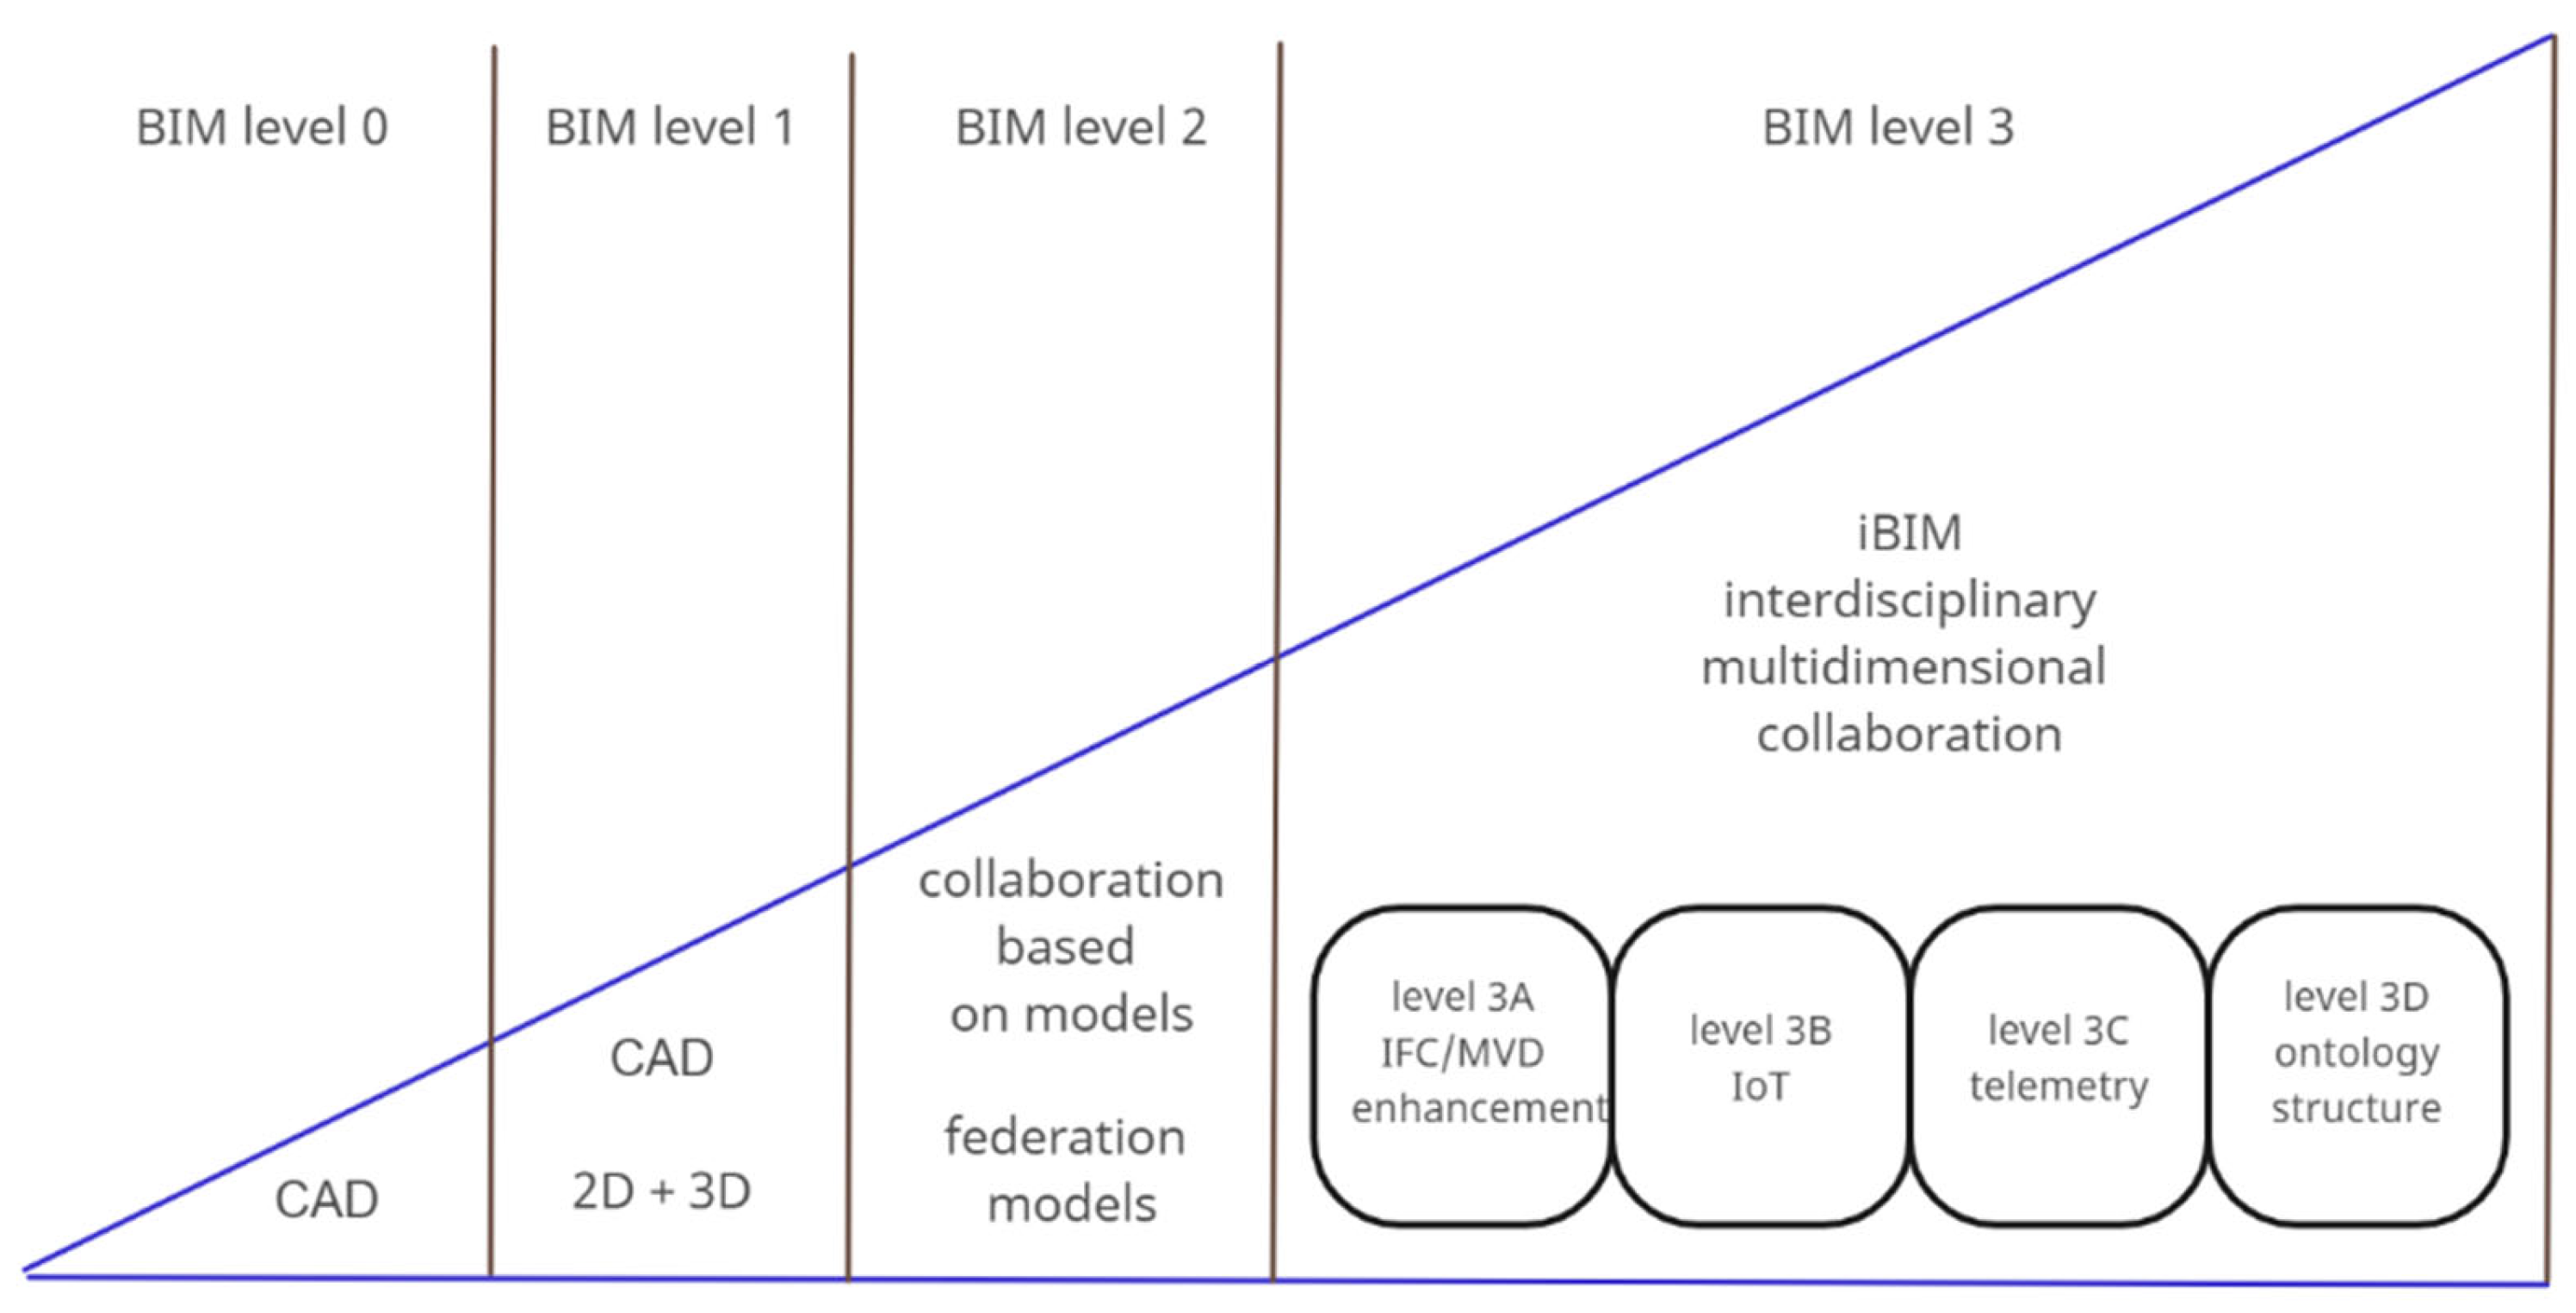
The level of BIM development an organization is at is represented by the so-called Bew–Richards ramp (Figure 1). BIM Level 0 does not involve collaboration of the project team, but only the creation of flat CAD drawings, where work is carried out in stages and communication through a one-way integrated management system. At this level, constant communication with each stakeholder is required, as it is difficult to keep track of all changes, resulting in a higher probability of error, especially since the basis for communication is paper documentation. BIM Level 1 is characterized by project team collaboration, where cooperation is based on files in 3D CAD and/or BIM environments, which allows for the better management of project work. Collaboration is generally within a particular industry (models are not federated), which provides a better method of developing, organizing, and managing information for the construction industry, with strict policies related to the codification of nomenclature. BIM Level 2 sets a standard in which everyone works on their own model in a 3D environment and takes advantage of opportunities to collaborate with other team members and other trades. At this level, a CDE (Common Data Environment) is used to serve as the primary repository and main channel of communication between stakeholders. New forms of collaboration and documentation are emerging at this level, such as the EIR (Exchange Information Requirements), BEP (BIM Execution Plan), or BIM responsibility matrix. Everything is aimed at the so-called integrated investment process IPD (Integrated Project Delivery), which is expected to provide benefits and advantages for all parties. BIM Level 3 implies open integration of data from various sources, which enables centralized collaboration and project management not only in cooperation with other industries, but also financial and building lifecycle management. This level assumes interoperability at every level. Continuous change notifications are enabled by open IFC or BCF formats. Level 3 is often referred to as an anticipated iBIM. The connotations and relationships between the different levels are abstract and difficult to define. Hence, sub-levels are beginning to be distinguished at Level 3. Recent research suggests that improving information exchange with the help of open standards is Level 3A. Level 3B is additionally referred to as direct connection to sensors of devices and machines (IoT). The use of IoT reduces human involvement [15] and gives space for the use of ML (machine learning) and AI (artificial intelligence). Algorithms are already reducing data processing times to as little as a few seconds, while eliminating the risk of error [16]. Real-time sensor data transfer (telemetry) is Level 3C. Monitoring the status of devices and their potential failures thus brings us closer to the idea of a digital twin. The highest level is 3D, where the framework and structure of the ontology, i.e., the codification of everything in BIM, are additionally defined. Thus, there should be no problems in communication, and its degree of efficiency is at the highest possible level. However, perfect interoperability may never happen [17].
Level 3A is often achieved by project enterprises, general contractors, or consortia of companies. Nevertheless, despite various ontology-level solutions, designers are still often forced to iteratively fix interoperability failures [19]. Level 3B is a similar challenge. Despite the many IoT-BIM solutions, the construction industry is still not adopting any solution on a larger scale. Hence, the aim of this research was to find a low-cost IoT solution for monitoring, analysis and management, and integrate it with a BIM model. This study uses an inexpensive NodeMCU microcontroller and a temperature and pressure sensor to study the thermal comfort of occupants in a single-family home. The article thus contributes to the ever-present technological challenge of integrating IoT and BIM toward a DT.
2. Literature Review
IoT is strongly emerging and people’s interest in it is increasingly growing [20]. By using IoT–BIM connectivity, buildings can become “smart”, able to collect, analyze, and respond to data in real time [21]. The integration of IoT–BIM systems allows for the acquisition of telemetry information from various sensors and devices in a building. These data can then be used to optimize building management and condition monitoring. IoT sensors can monitor a building’s energy consumption, which allows for the optimization of energy use [22]. However, most research applications involve very simple and individual DIY use cases with limited use in industrial applications [23]. IoT provides a higher degree of security, as sensors can prevent disasters [24] or detect accidents [25], fires [26], air pollution [27], etc. IoT can enhance occupant comfort, while BMS (Building Management System) systems can adjust indoor conditions (e.g., temperature, lighting, humidity, or air quality) according to occupants’ needs. Various types of sensors are installed in buildings, such as infrared, temperature, humidity, pressure, carbon dioxide or carbon monoxide, camera sensors [28], sensors related to lighting, or air pollution. IoT-BIM consists of three layers, namely the physical layer, the network layer, and the application layer. In each layer, security must be ensured by applying appropriate security countermeasures to the IoT-BIM system [29], which, despite the current state of the art, is not that simple.
The use of BIM in facility management (FM) is currently limited because BIM applications have been implemented mainly in the design and construction phases. It is beneficial to enable BIM models to provide real-time information through the monitoring process. Monitoring can take place both during the construction phase [30] of the project and the subsequent use phase. This will allow facility managers to interact with the built environment in real time and provide a better user interface than traditional thermal condition monitoring. Such a move will bring us closer to the idea of a digital twin. Digital twin should first be implemented precisely in the O&M (Operation and Maintenance) phase, which is extremely important from the perspective of building owners [31]. The integration of IoT–BIM through a custom-designed database and modules developed in a visual programming environment [32] provides effective visualization of office spaces related to temperature levels, humidity, pressure, etc., in rooms. Storing related data in the cloud can provide interested decision makers with relevant and timely access to thermal comfort data remotely via their wireless devices, leading to greater efficiency in monitoring building spaces. In the BIM approach, the most up-to-date and accurate building models are stored in shared central databases during the design and construction of a project, and increasingly in the post-construction stages. Increasingly popular GIS (Geographic Information System)-based city monitoring/management applications require a combination of information obtained from all these resources—BIM, GIS, and IoT [33].
The high energy demand in residential and commercial buildings is determining a great deal of interest in the research community for opportunities to improve the sustainability, rating, energy efficiency and overall performance of buildings. Information systems provide the ability to monitor the condition, substance and behavior of a building and artificial intelligence provides methods to predict the energy efficiency of buildings [34]. Monitoring energy efficiency is one of the basic tenets of the anticipated circular economy [35]. Among various energy-efficient solutions, the European Union is developing directives for near-zero energy buildings, as well as smart technologies for future smart cities [36]. A comfortable indoor thermal environment is critical to occupant well-being and productivity. The need for resource-saving systems and technologies has been proven in studies [37]. A BMS is typically used to monitor the thermal conditions of buildings [38]. However, this generally applies to larger developments where users can afford a BMS. In smaller developments, where cost is a major consideration, budget solutions can be tried. Unfortunately, the low availability of information on current building parameters causes serious difficulties in planning appropriate interventions. IoT sensors provide a large amount of data on the energy consumption and internal conditions of an existing building, which can influence the selection of retrofit interventions [39]. The microcontroller unit (MCU) used in IoT is a small computer on a single chipset. Popular for remote machine control purposes are the Arduino Uno and Arduino Yun, which use Wi-Fi modules [40]. When it comes to studying the thermal comfort of users [41], investments based on Arduino Uno [42] or Arduino Yun [43] are quite expensive, in the order of tens or hundreds of dollars. For smaller budgets, one can opt for NodeMCU microcontrollers [44], which are cheap and provide Wi-Fi connectivity. To date, very little research has been carried out on single-family buildings [45], which is encouraging (Table 1).
Hence, the purpose of this study was to develop a low-cost temperature testing circuit to investigate thermal comfort during the summer months. This could help in making decisions about HVAC installations or undertaking retrofit work.
3. Methodology
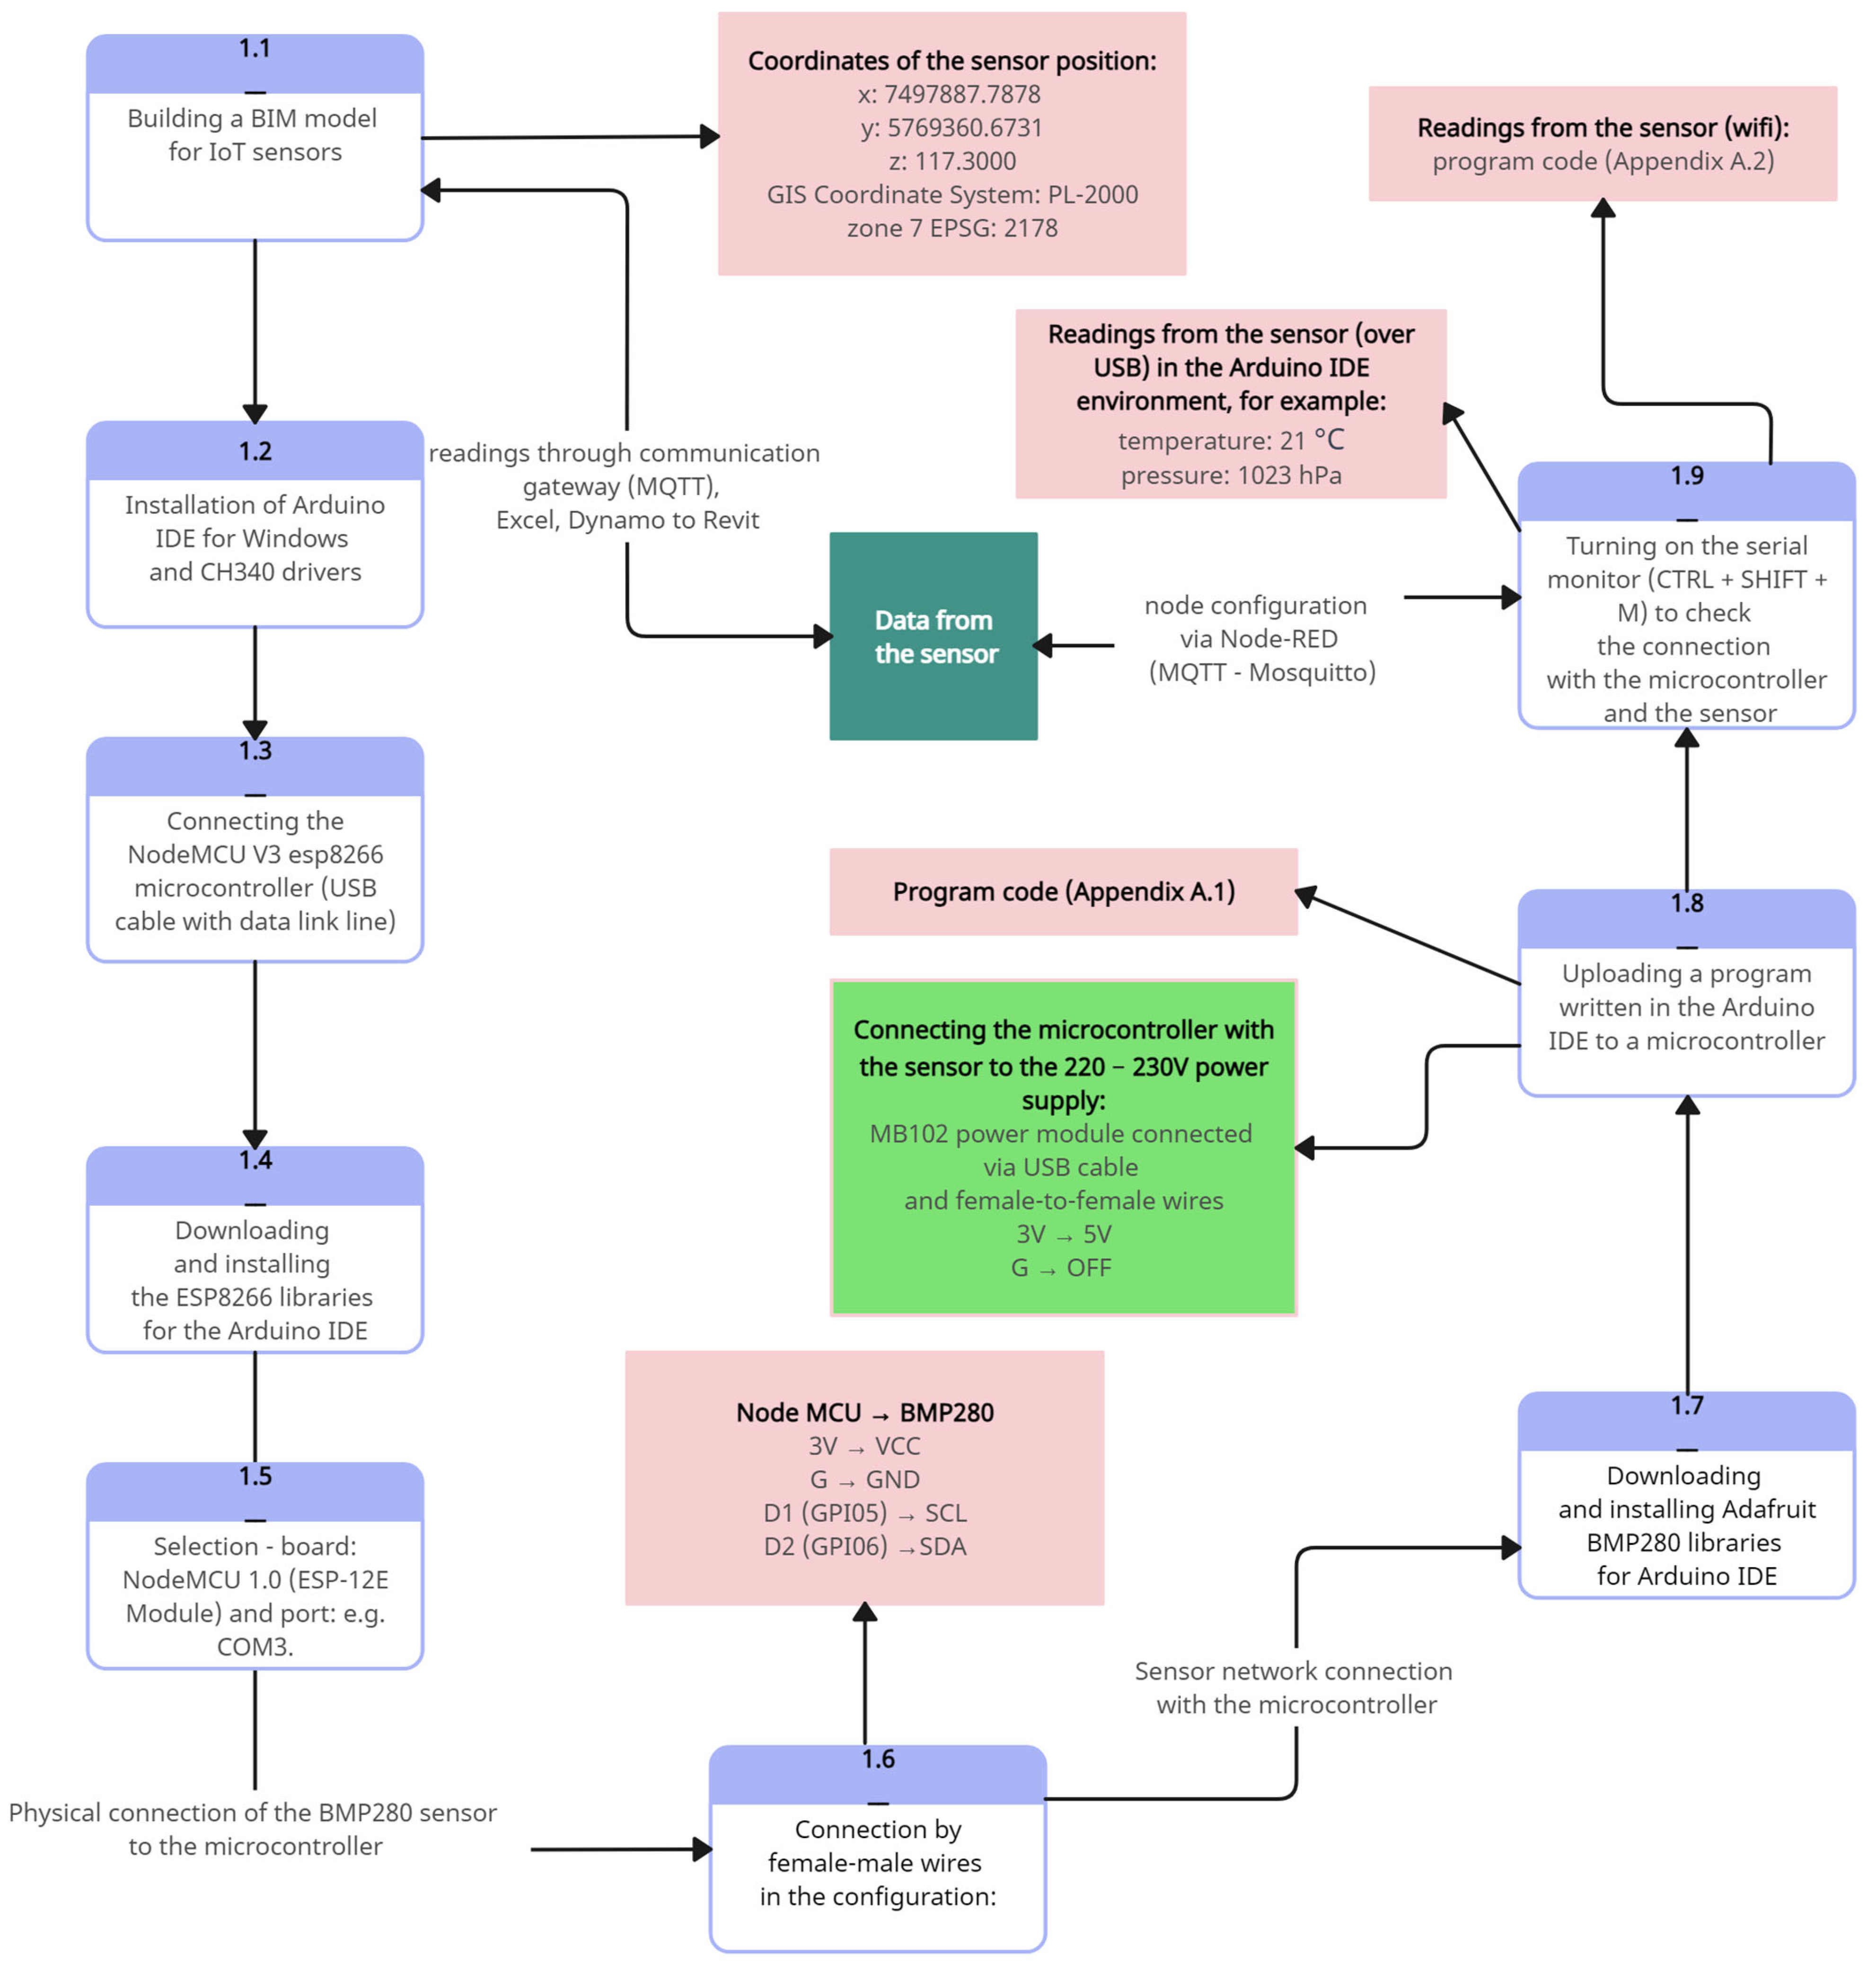
The research used the Arduino IDE environment (v1.8.19) [51,52], a microcontroller, a sensor and accompanying hardware. Arduino is a well-known open-source hardware, also supporting the NodeMCU V3 microcontroller, providing basic input and output interfaces for analog and digital signals. The Arduino system is relatively simple and convenient, as it can be easily connected to various sensors, servo motors and other electronic components [53]. Microcontrollers can easily connect to multiple sensors through multiple digital and analog I/O interfaces, which provides great scalability [42]. The general idea is to subscribe to the sensor data in the BIM model via the MQTT protocol (Figure 2). MQTT (Message Queue Telemetry Transport) is a lightweight protocol that works well with low bandwidth and low power consumption. Built based on the TCP/IP protocol, MQTT operates on a publish/subscribe model that provides reliable data transfer or message transmission at a low cost in a low-performance network environment [54]. These features make it ideal for IoT and mobile communication environments with a low bandwidth and limited computing power, so the protocol has been widely used in the IoT field and is also widely used in M2M (Machine to Machine) communication between embedded devices [42]. The research developed a prototype system running on a microcontroller, in the “Arduino programming language”, based on the C/C++ language, with the task of acquiring data from connected sensors and transmitting the data to a server. As part of the construction of the system, Node-RED was used to publish the sensor readings to an MS Excel 2023 file via an MQTT broker. As a broker, Mosquitto 2.0.18 was used, which is an open-source service program written in C that implements the MQTT protocol, so it can be used as a message communicator that listens and sends messages.
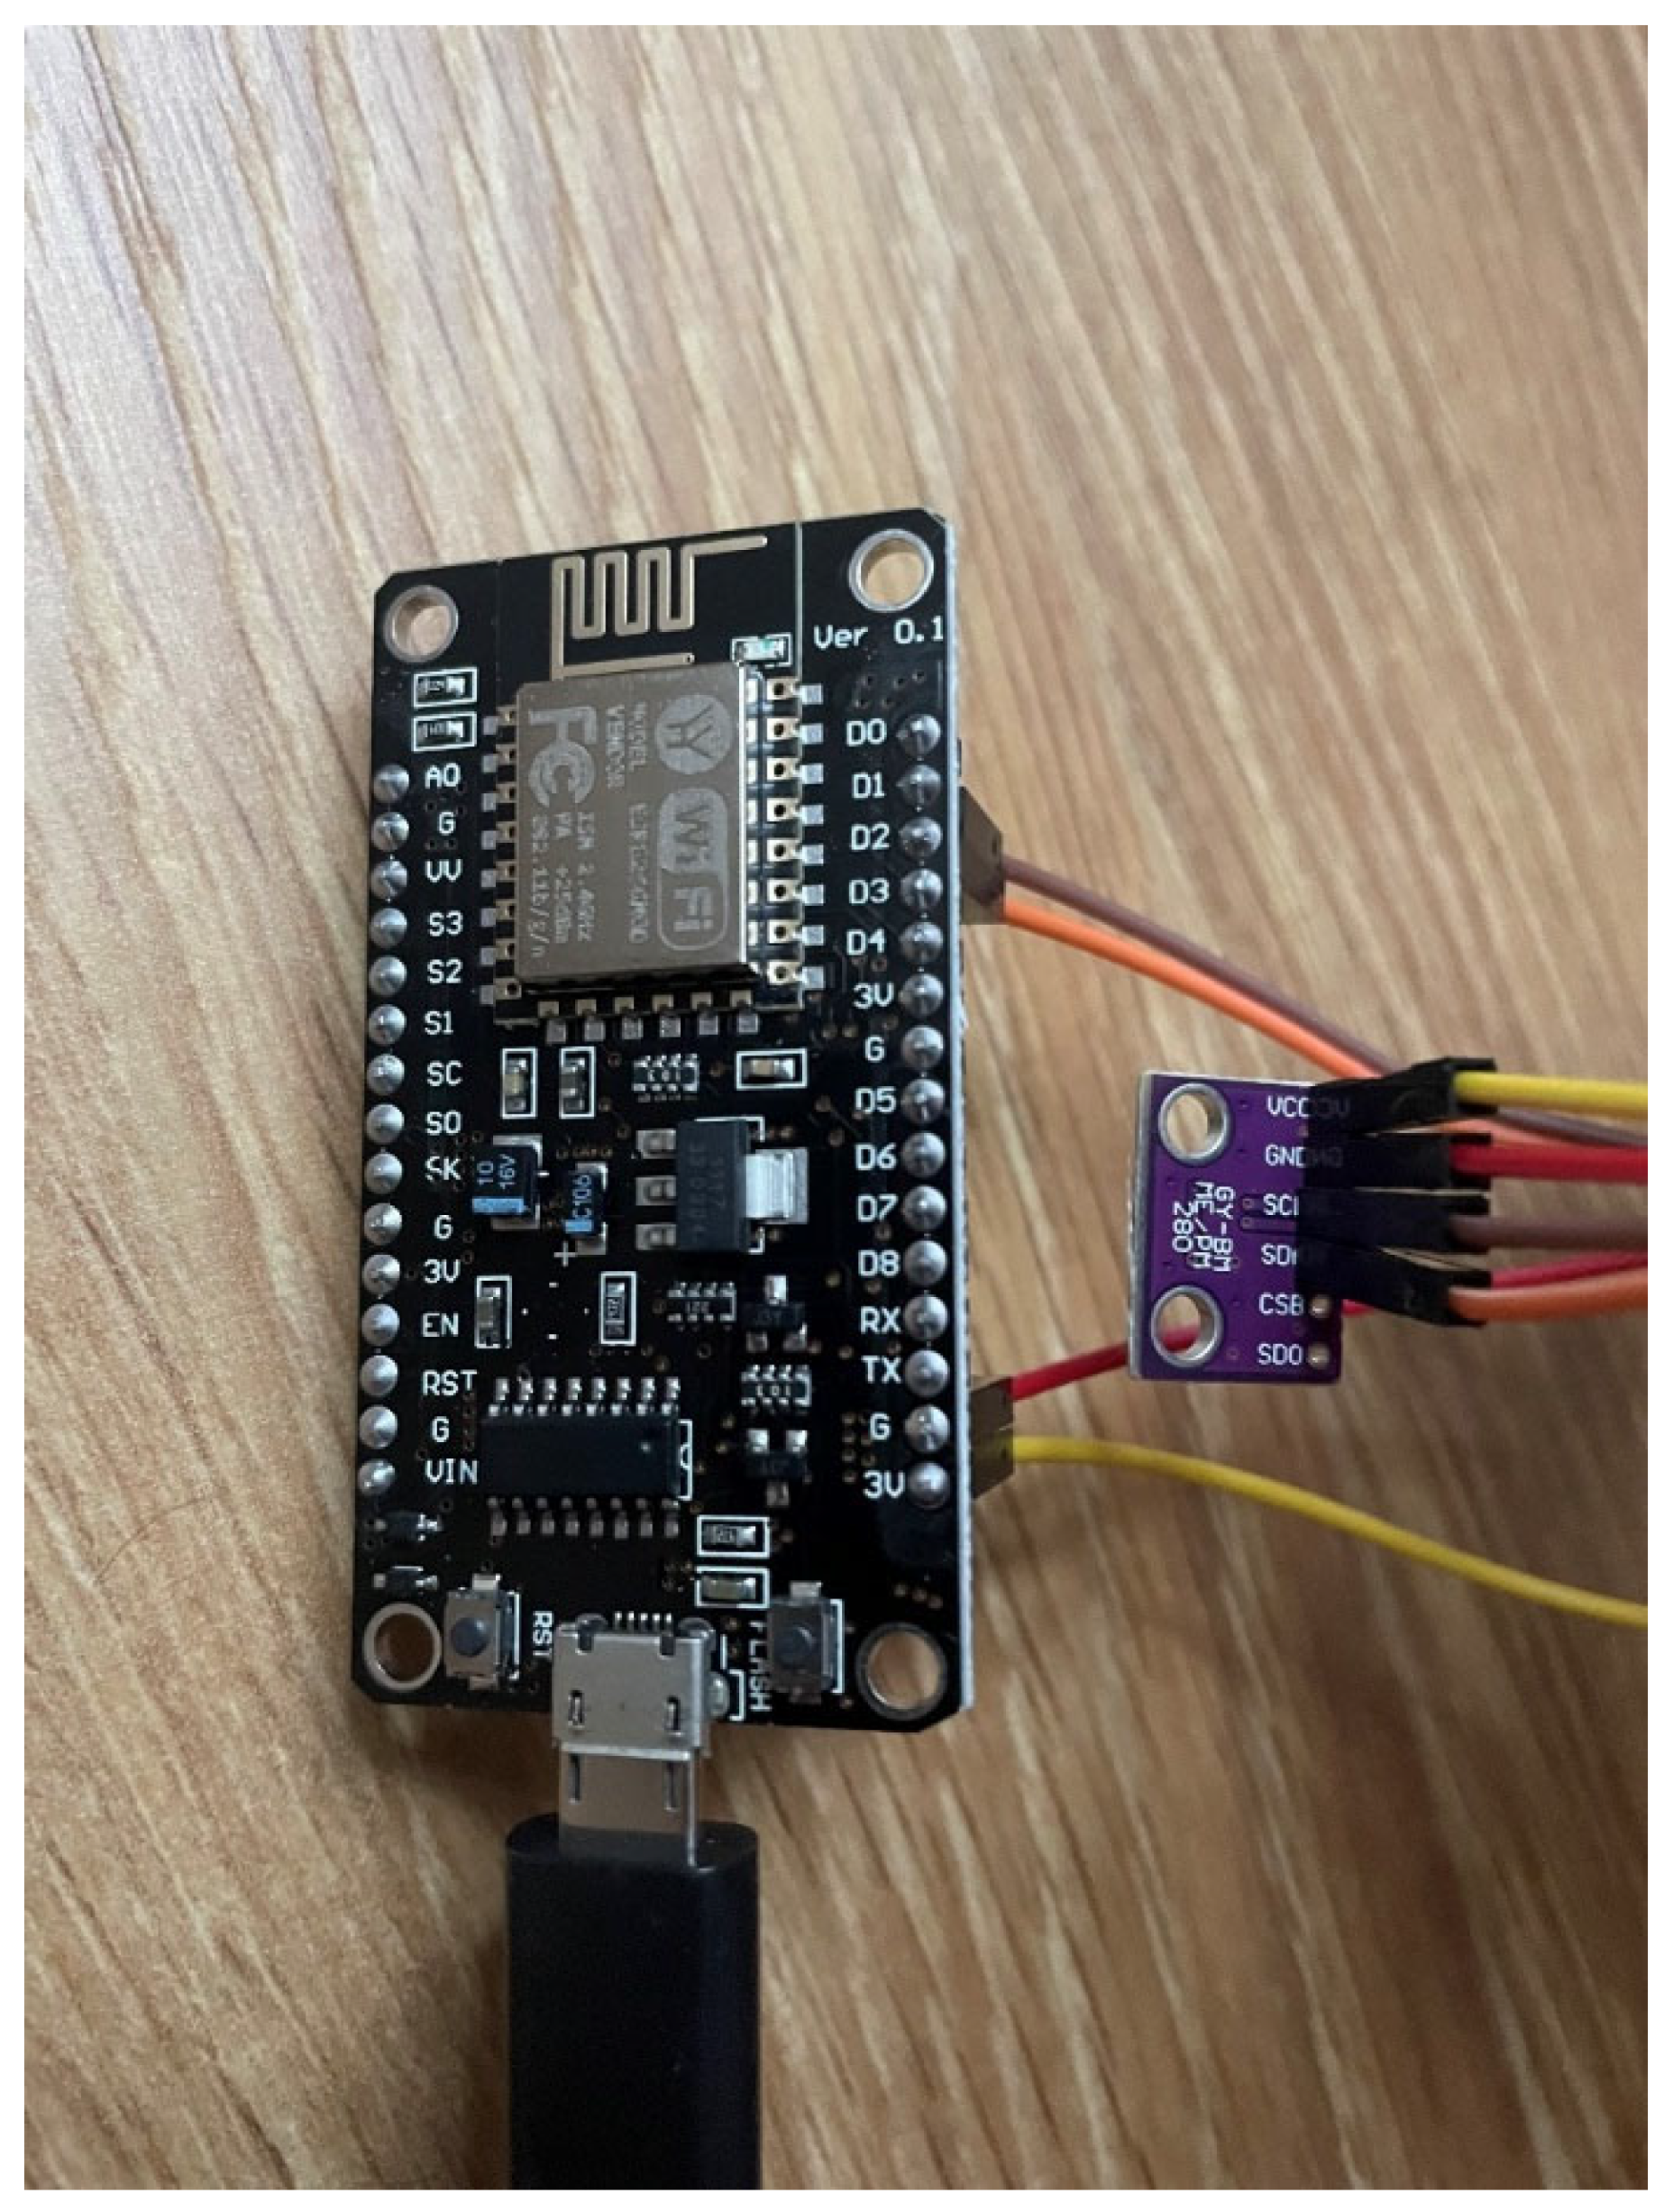
First, a BIM model was developed for the installation of a temperature and pressure sensor. The model was georeferenced, obtaining precise x,y,z coordinates and a GIS layout of the sensor’s position. Before connecting the sensor to the microcontroller, the Arduino IDE environment for Windows was installed. Then, the CH340 drivers were downloaded to access and read data from the USB ports. Next, the NodeMCU V3 microcontroller was connected using a microUSB (m)–USB-A (m) cable with a data link line. Subsequently, ESP8266 libraries were downloaded and installed to read the board from the respective serial port. While working in the Arduino IDE, all antivirus and firewalls (Windows Defender Firewall) were disabled. Next, NodeMCU 1.0 (ESP-12E Module) was selected as the board, and COM3 was selected as the port. Subsequently, the sensor was connected to the microcontroller with female–male wires (Figure 3).
The BMP280 sensor chosen for the study has numerous advantages. The small dimensions allow for the sensor to be installed in control cabinets and small enclosures of portable measuring instruments. The sensor features a wide pressure measurement range, as well as a temperature measurement function with a high accuracy, so these data can be tracked. To read the data from the BMP280 sensor, it is necessary to download and install the Adafruit BMP280 libraries in the Arduino IDE environment. After that, the source code of the program (Appendix A.1) was uploaded to the microcontroller, previously verifying the correctness of its operation. In the code, attention should be paid to the “baud rate” (data transfer rate in serial communication)—9600 in this case, and the data reading frequency—2 s.
After uploading the program, the serial monitor was started to check the results of the reading data from the sensor. If the serial port cannot be connected, it should be checked if another application, firewall, or antivirus is blocking access to the port. The correct operation allowed for further connection to the BIM model via the Node-RED application and the MQTT protocol.
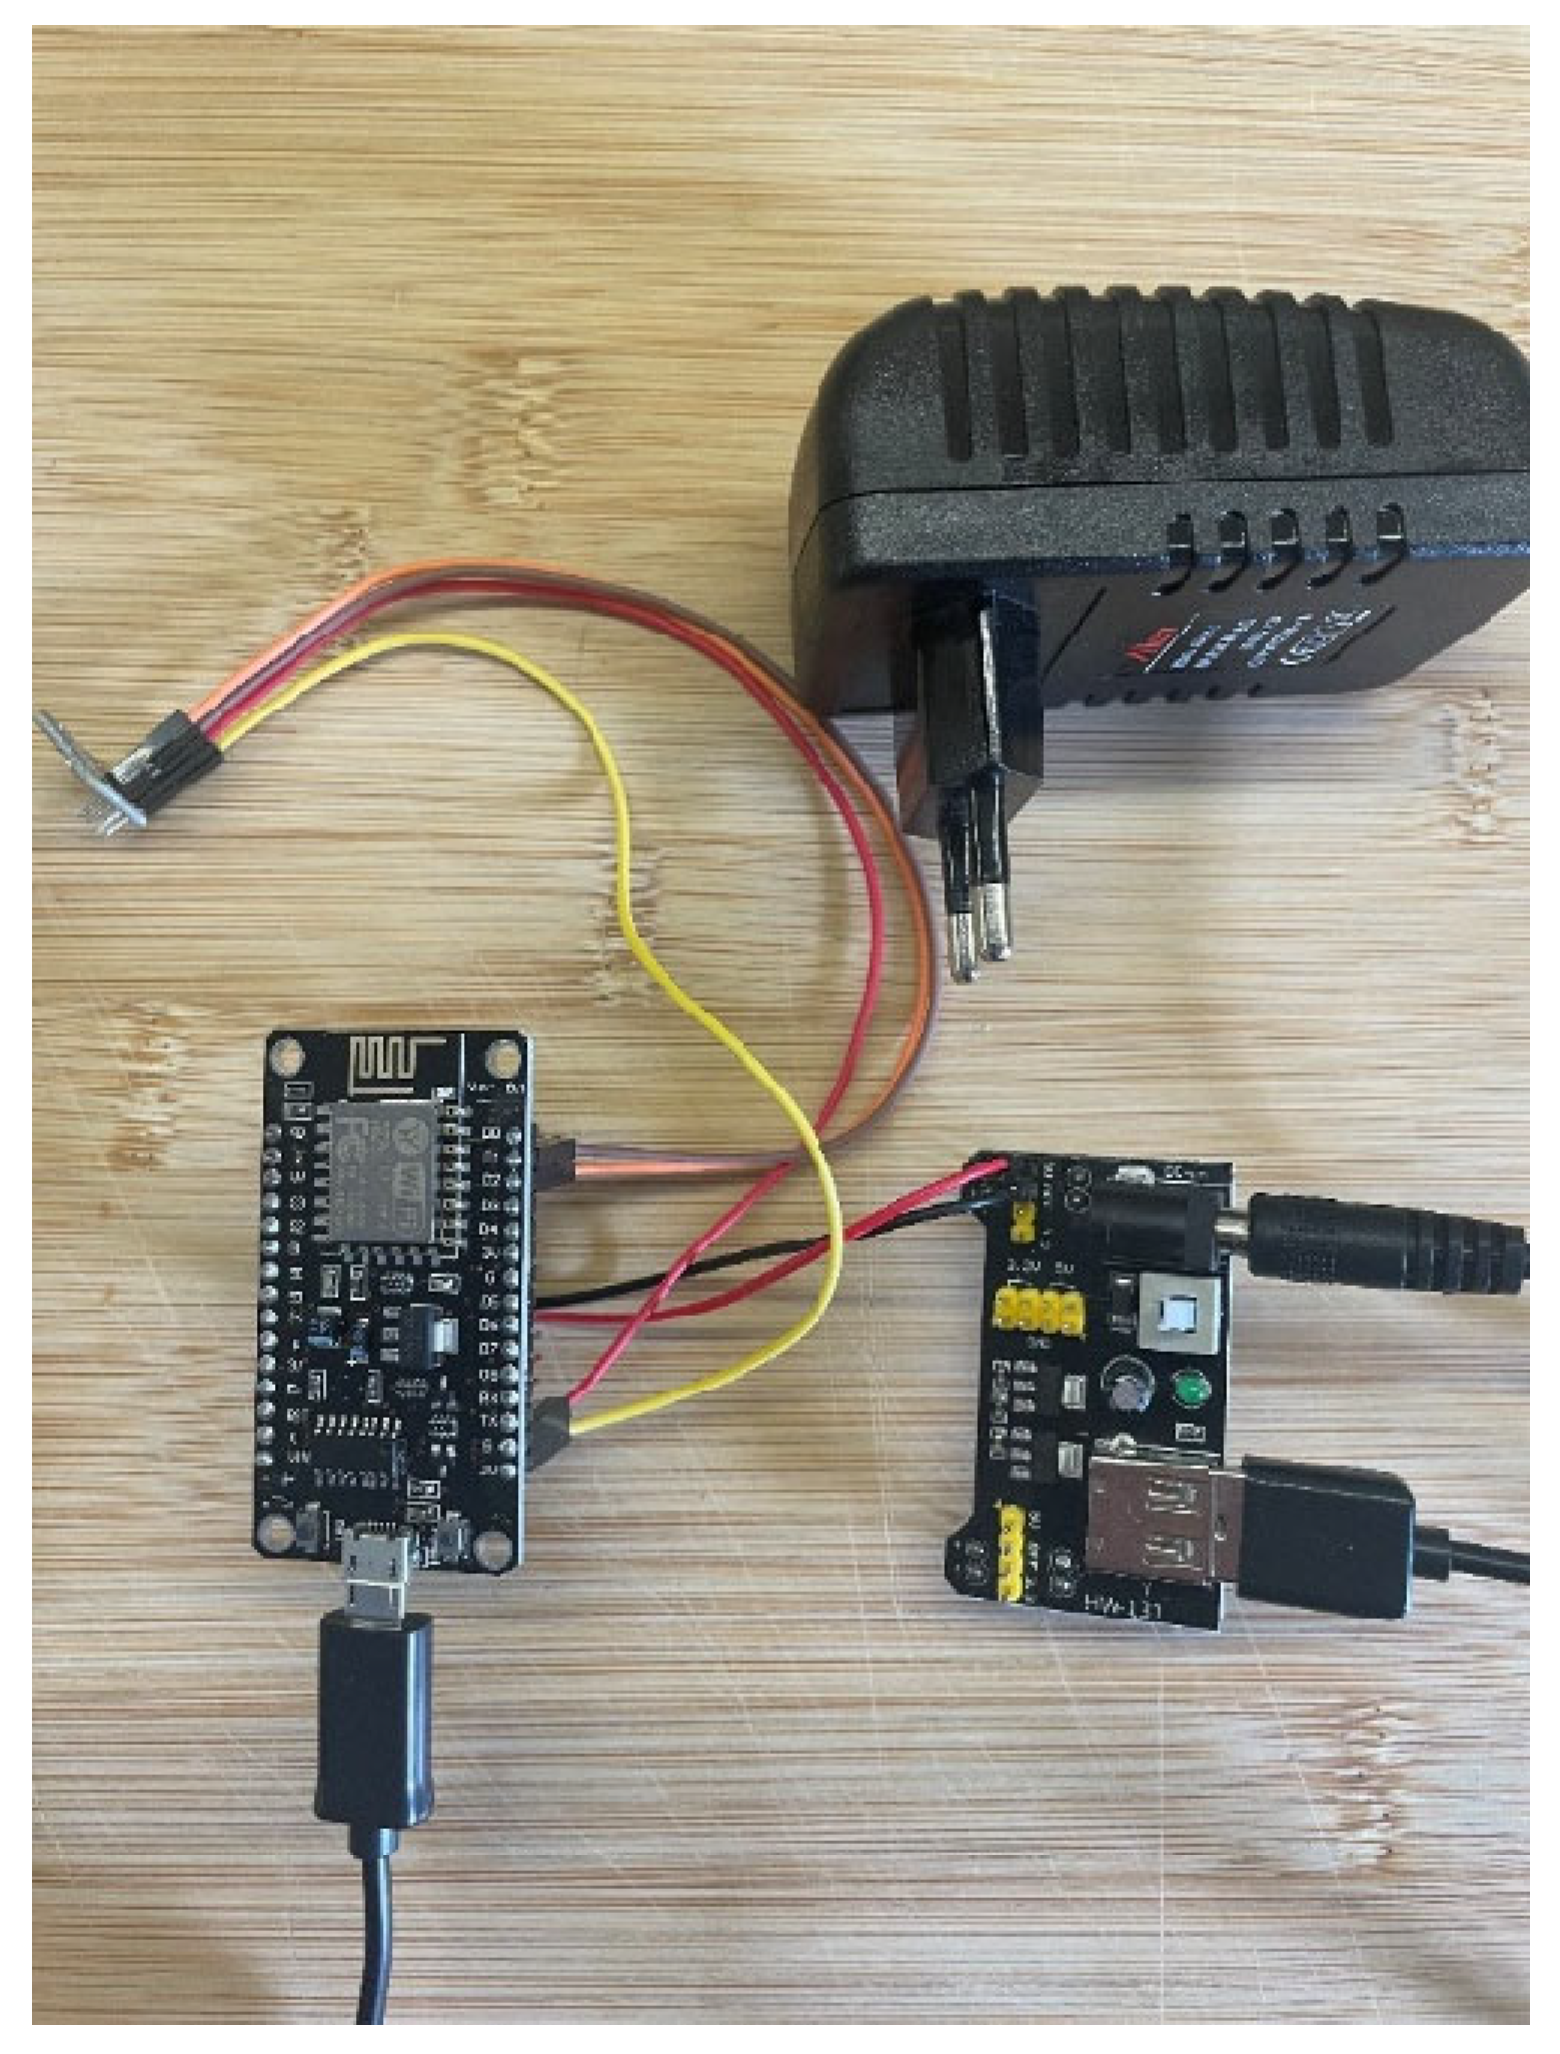
In order to continuously read data from the sensor, the microcontroller had to be permanently connected to the power supply. In order not to use a computer/server, the microcontroller was connected to the MB102 power module. This module is permanently connected to a power source, mainly 220–230 V, through the DC input with a 1 W 1000 mA charger. The microcontroller is connected to the power module with a microUSB-B (m)–USB-A (m) cable and two female-to-female cables (Figure 4). The connection to the sensor will be through the Wi-Fi module and a program preloaded into the microcontroller. The whole kit is low-cost (Table 2), so it can be used even in small investments.
There are many other sensors similar to the BMP280 that are inexpensive and serve different purposes: DHT11—a cheap temperature and humidity sensor; DHT22 (AM2302)—a bit more expensive and more accurate than DHT11; MQ-2—a gas sensor that can detect LPG, i-butane, propane, methane, alcohol, hydrogen, and smoke; MQ-135—an air quality sensor, which can detect ammonia, nitrites, benzene, and smoke; HC-SR04—ultrasonic sensor for distance measurement; PIR (Passive Infrared Sensor)—detects motion based on the change in infrared radiation. These are just a few popular low-cost sensors available on the market. The choice of a suitable sensor depends on the project requirements and the assumed accuracy. Before connecting the built set to the network, a program (Appendix A.2) was uploaded to connect to the Wi-Fi network. In this case, attention should be paid to the name and password of the network and server.
4. Results
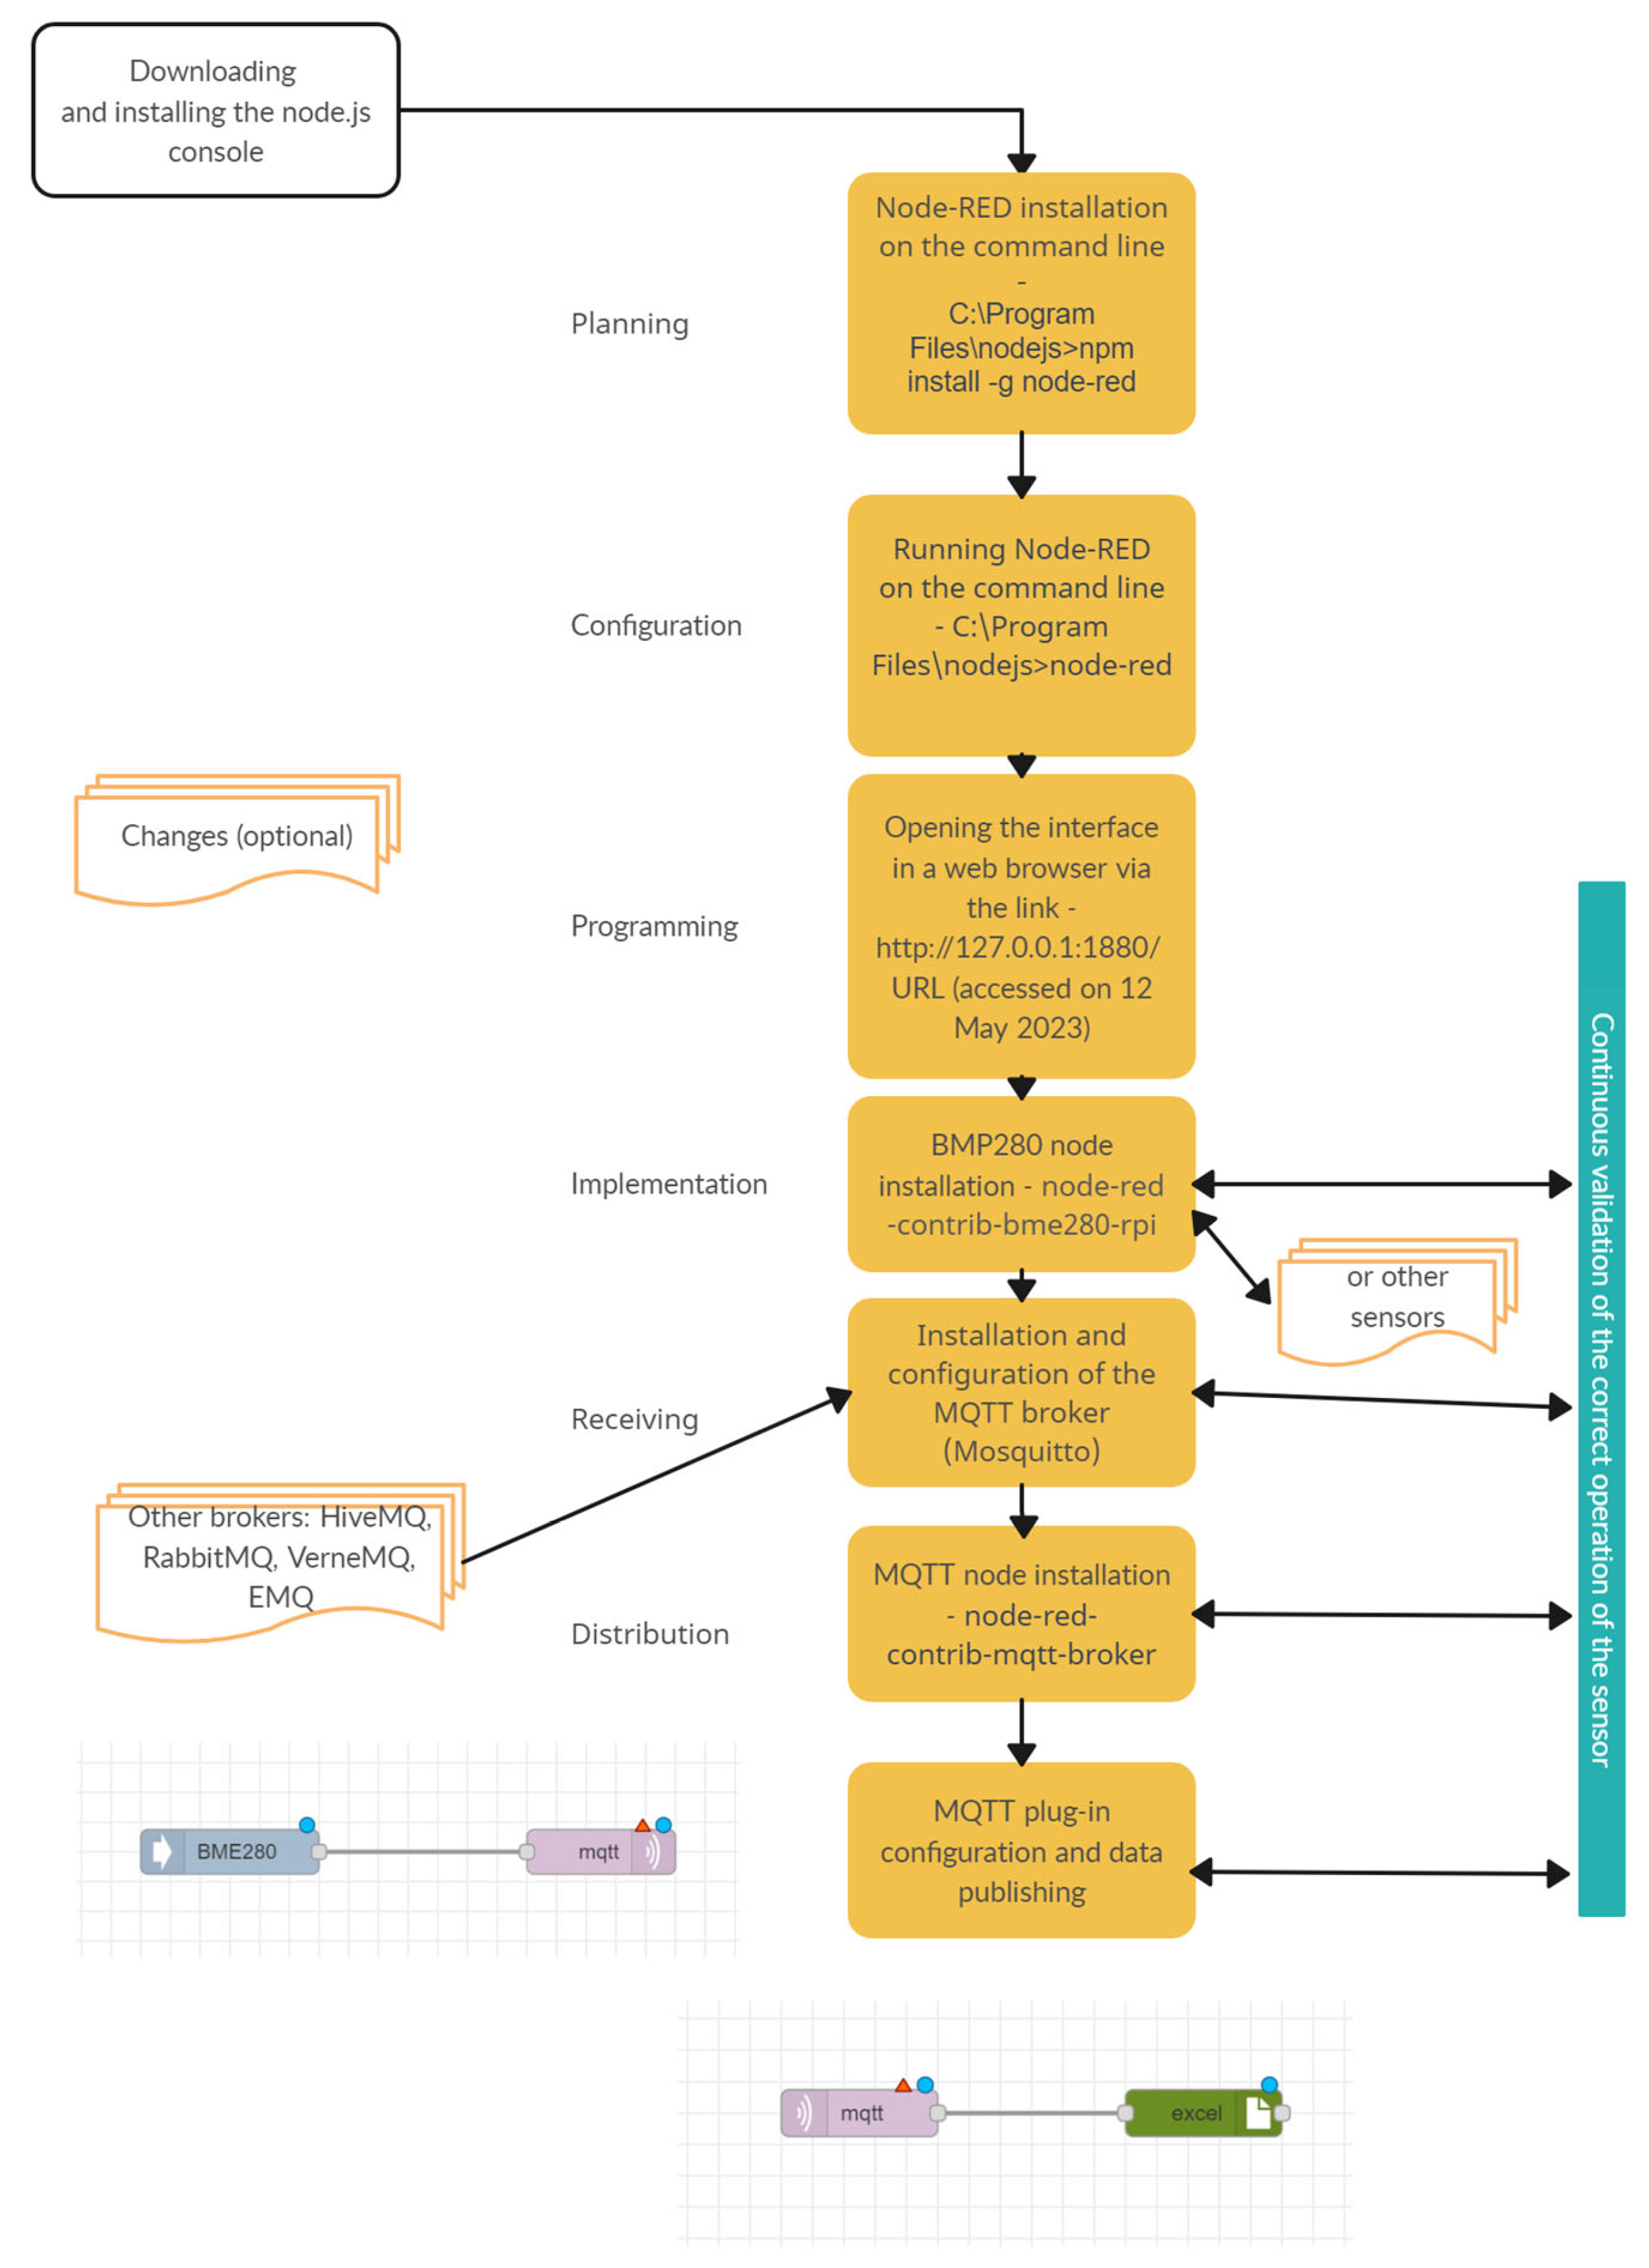
After validating the correctness of reading the results from the sensor over the Wi-Fi network, we proceeded to work with Node-RED (Figure 5). To connect Node-RED to Revit via MQTT, two main components are needed: an MQTT broker (server) and an MQTT plug-in for Node-RED. First, node.js was downloaded and installed. Node.js is an execution platform for JavaScript code that runs on the server side [55]. Node-RED was then installed using the command line available on Windows. After running it (on the command line), you can open the program’s interface in a web browser. Next, libraries were installed to add BME280 nodes (it also reads BMP280), configure MQTT, and publish results to .xlsx. Then, the nodes were connected by relationships and the connection to the previously created Mosquitto server was configured.
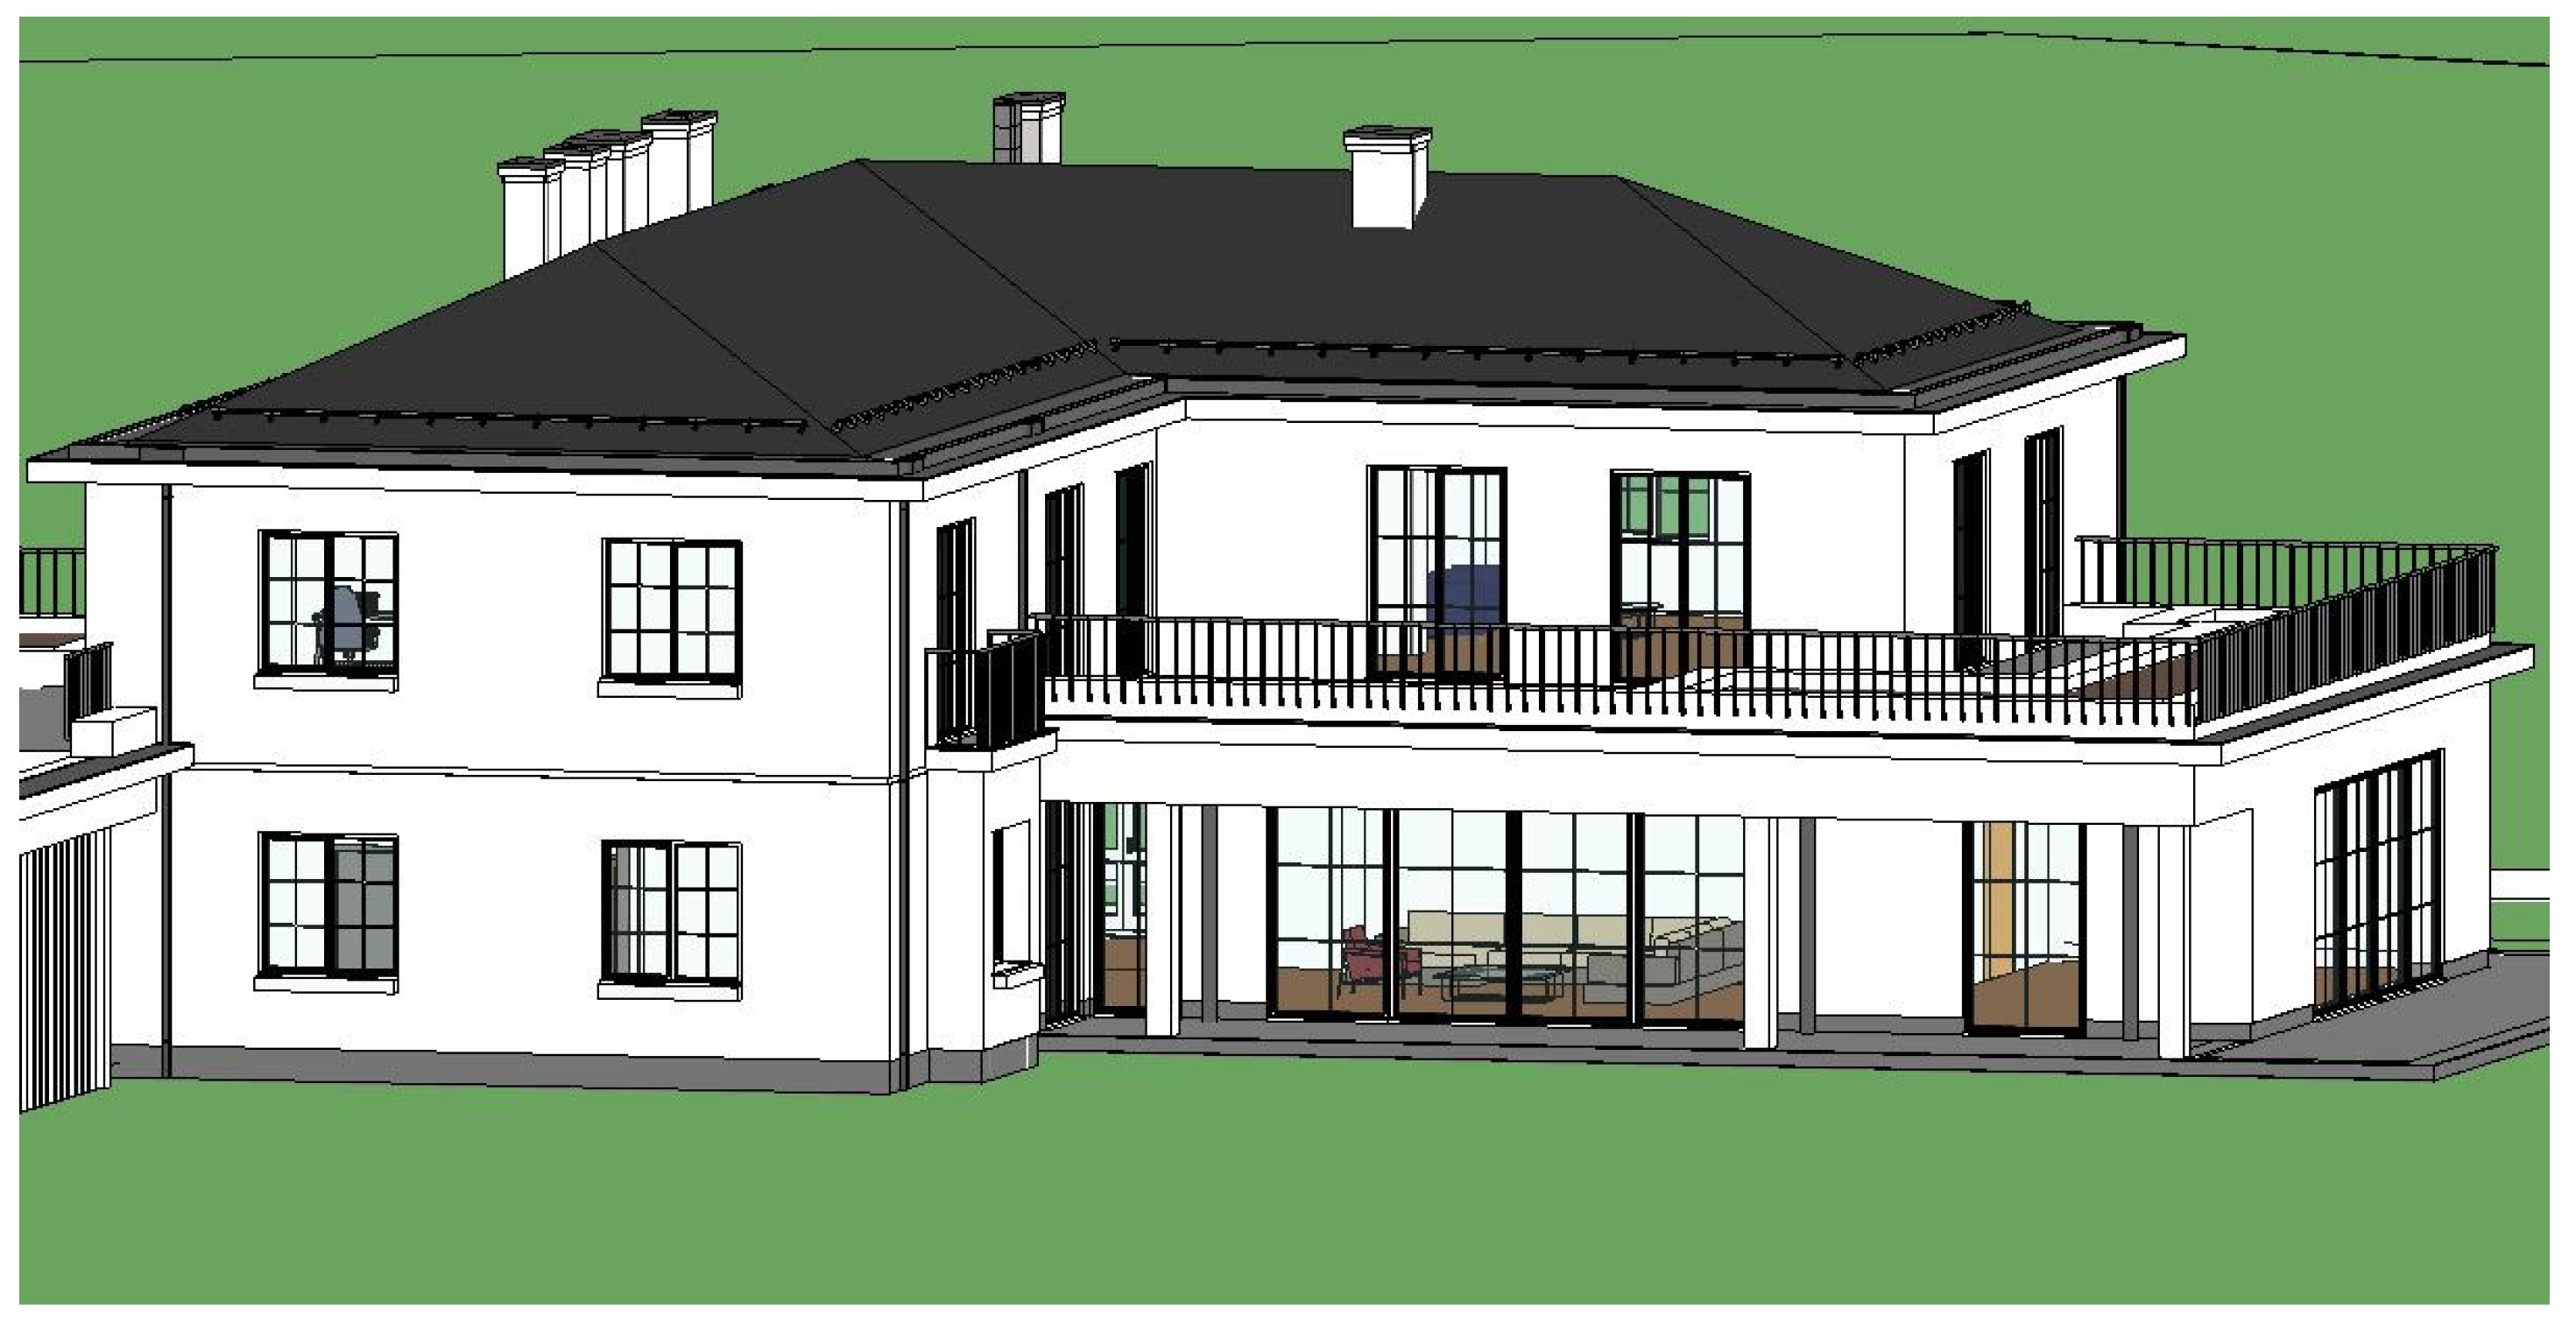
BIM is characterized by so-called semantic richness, i.e., the model can be detailed in terms of both geometry and non-graphical information [56]. The developed BIM model was produced in Autodesk Revit at a high level of geometric detail (Figure 6). In the foreground, the large glazing on the ground floor can be seen along with the living room. A large proportion of the library facilities are characterized by their richness in non-graphical data, and sensor and actuator families can be similarly fleshed out. Parameters derived from sensors can be occurrence, type, or shared parameters.
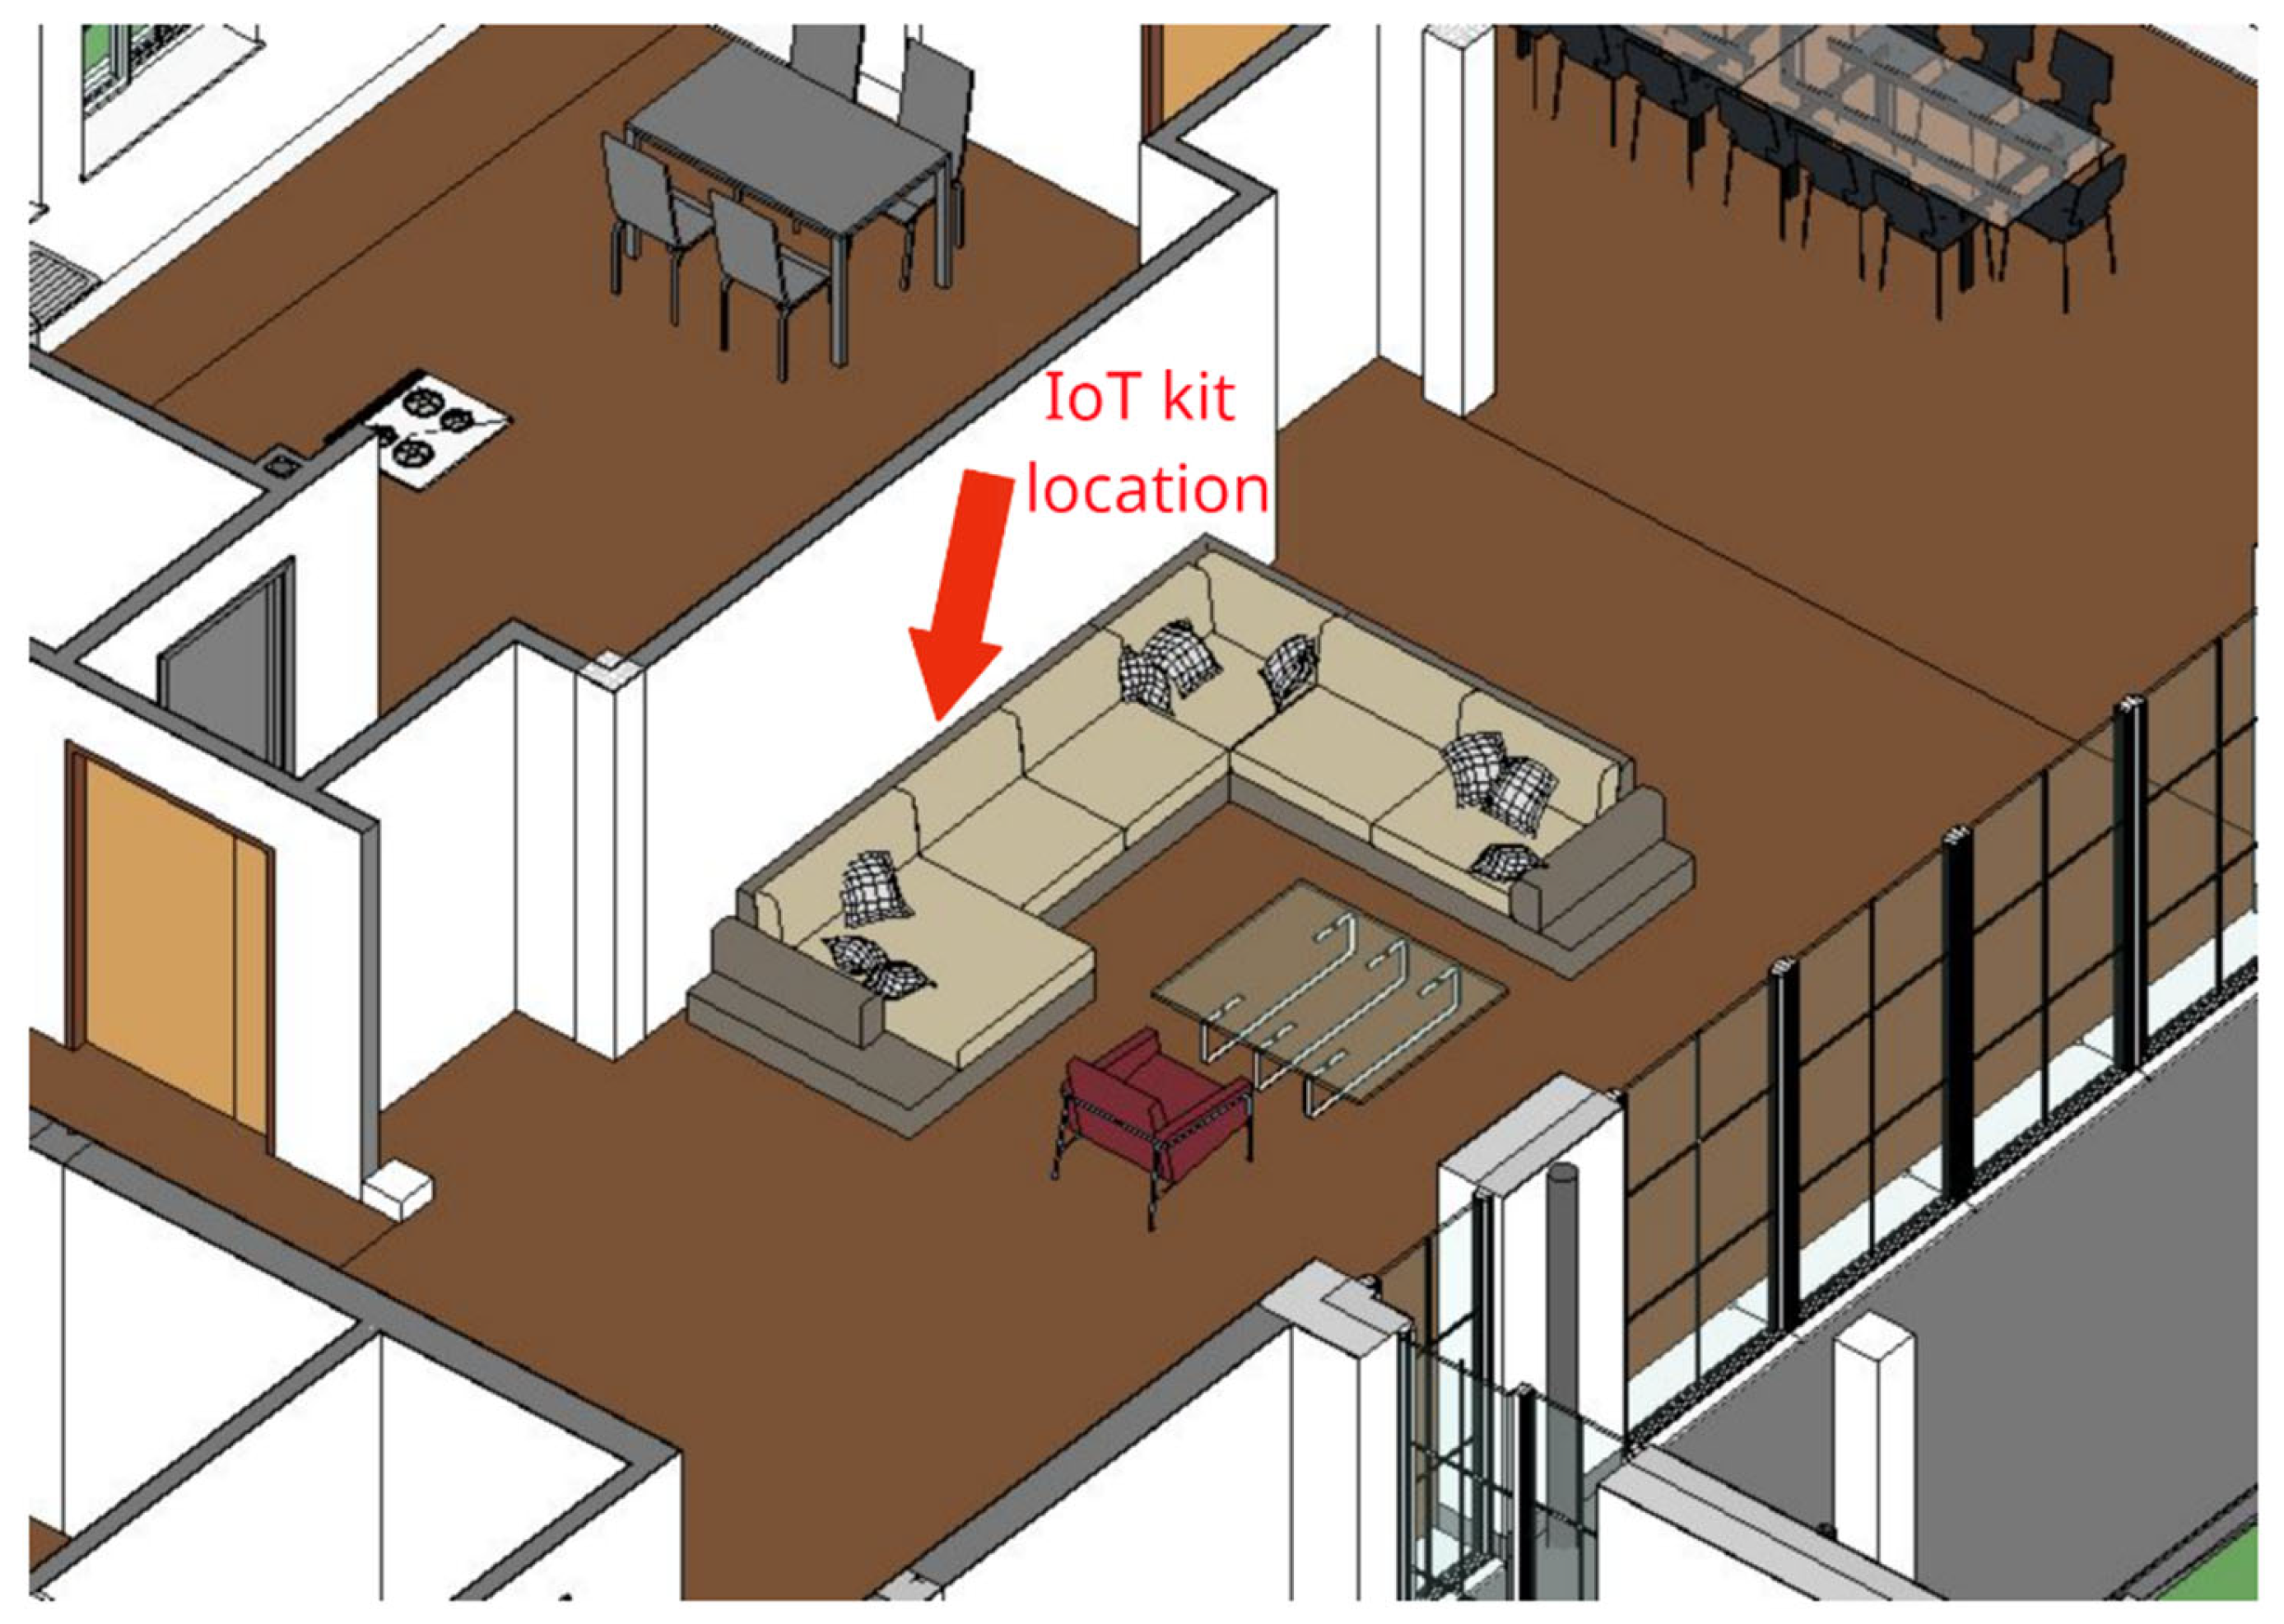
After validating the correct operation of the sensor, the MQTT server and the connection to the BIM model, the sensor was placed in a room of a detached single-family house (Figure 7). The sensor continuously measured the temperature and pressure in the “Living Room”. Due to the large glazing, the owners, wanting to decide on the installation of air conditioning or retrofit work, want to analyze the results of the measurements during the summer season.
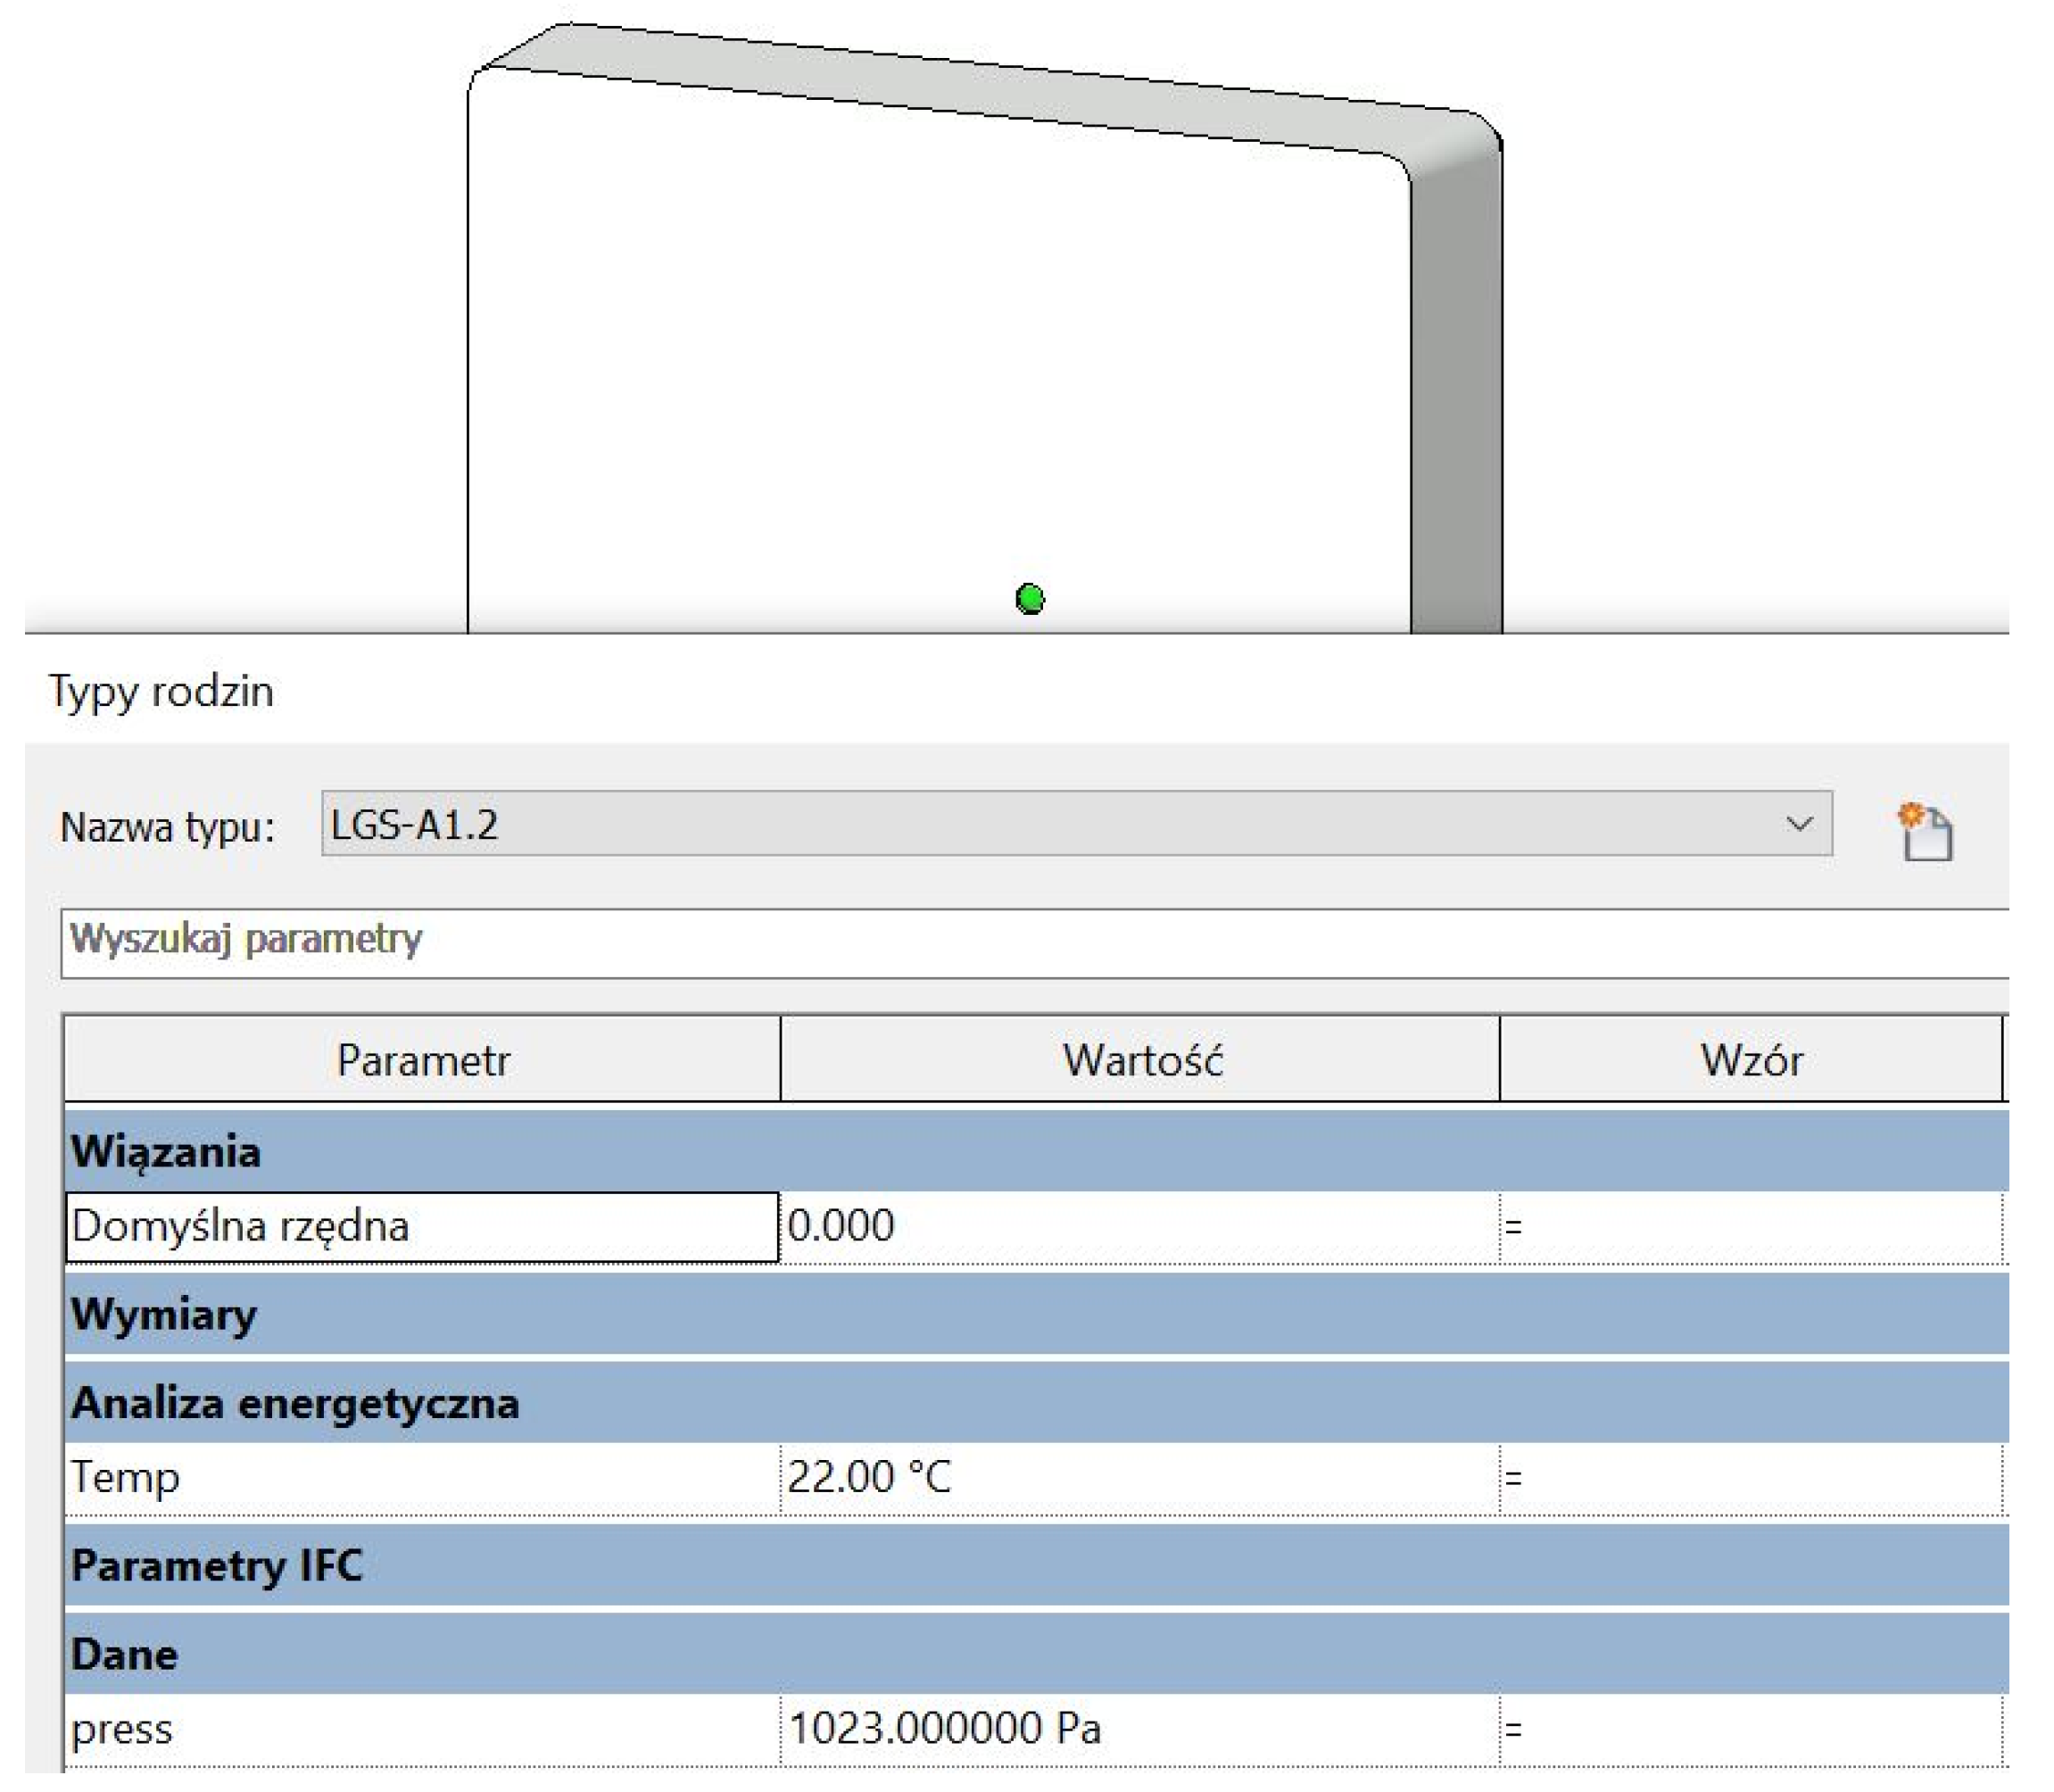
The entire prototype kit was placed in a white case, leaving the power LED on top. It was then connected to the network and started monitoring temperature and atmospheric pressure. For analysis and simulation purposes, a family in (.rfa) format corresponding to the prototype kit was modeled and the parameters (temperature, pressure) were added. The results were then imported via Dynamo into the family (Figure 8), which was placed in the model (.rvt) behind the sofa in the living room, according to the actual setting. Users can access the real-time values of IoT sensors embedded in the BIM in the properties panel or by going into the type parameters [57]. Depending on the pre-set frequency, the parameter refreshes its value. In theory, with more sensors in a room, visualization of the results in the form of, for example, a temperature distribution map can be undertaken. Visual programming in Dynamo (HeatMaps algorithm on GitHub) can be used for this purpose.
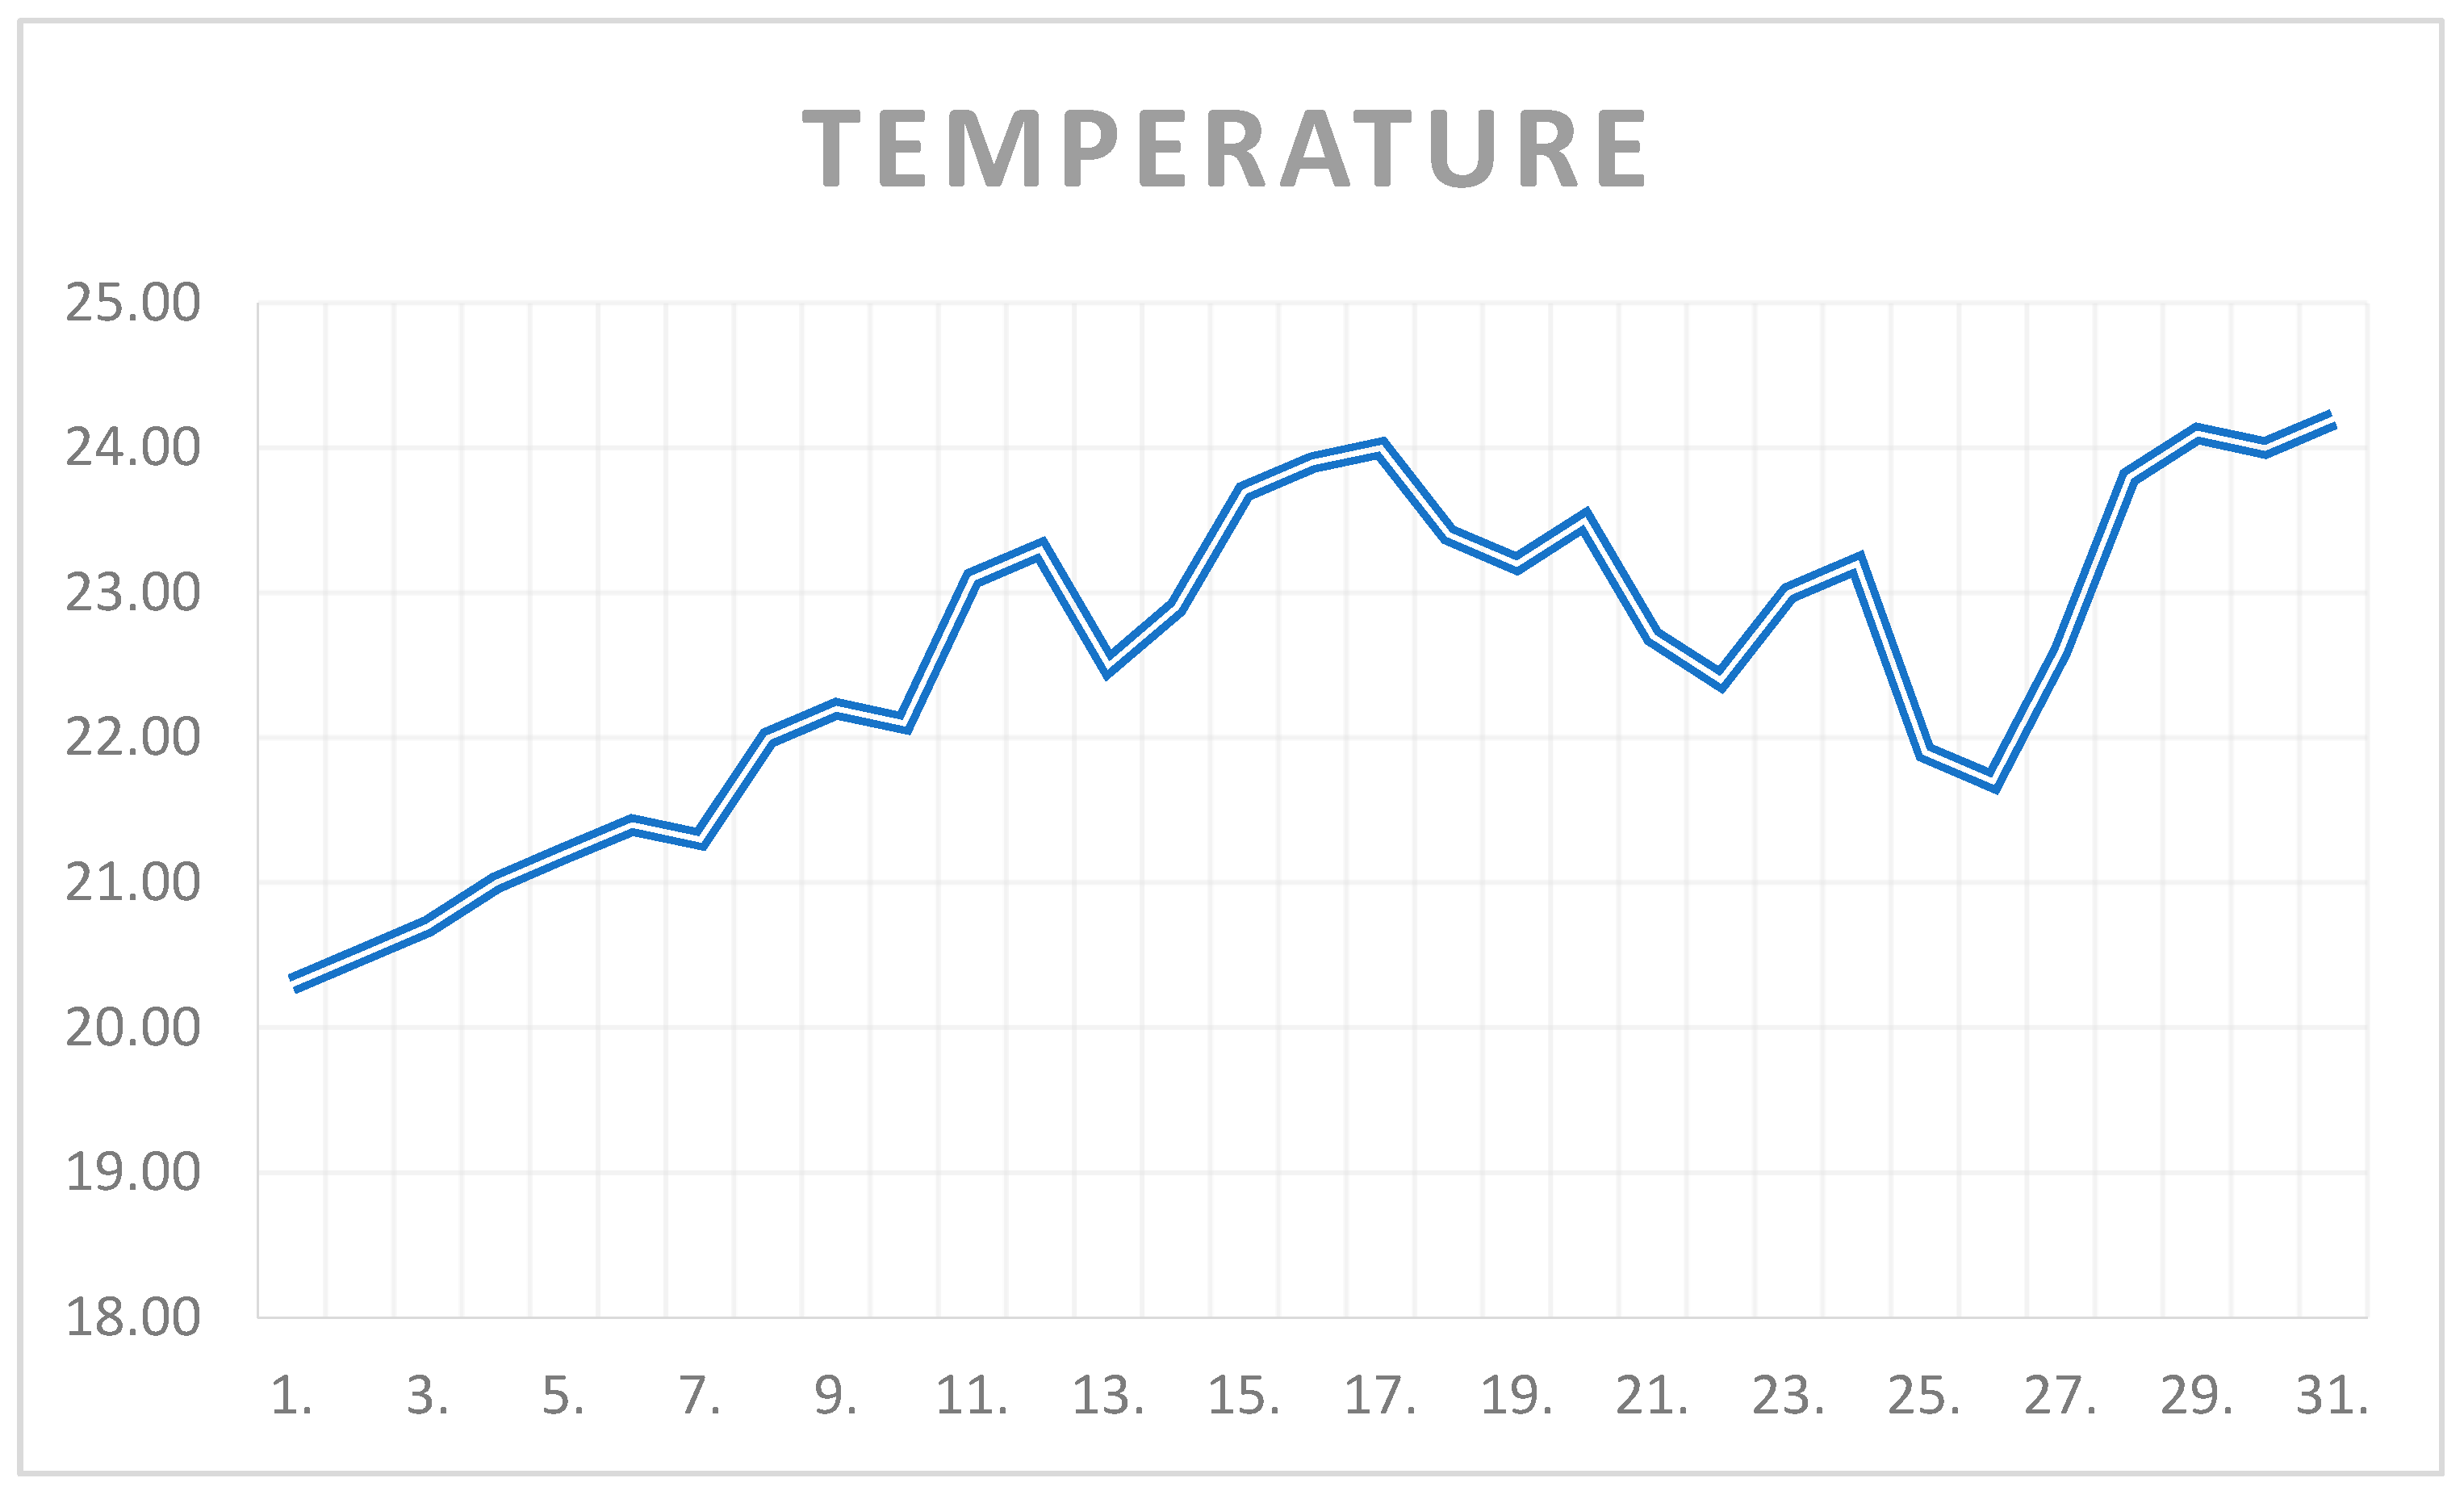
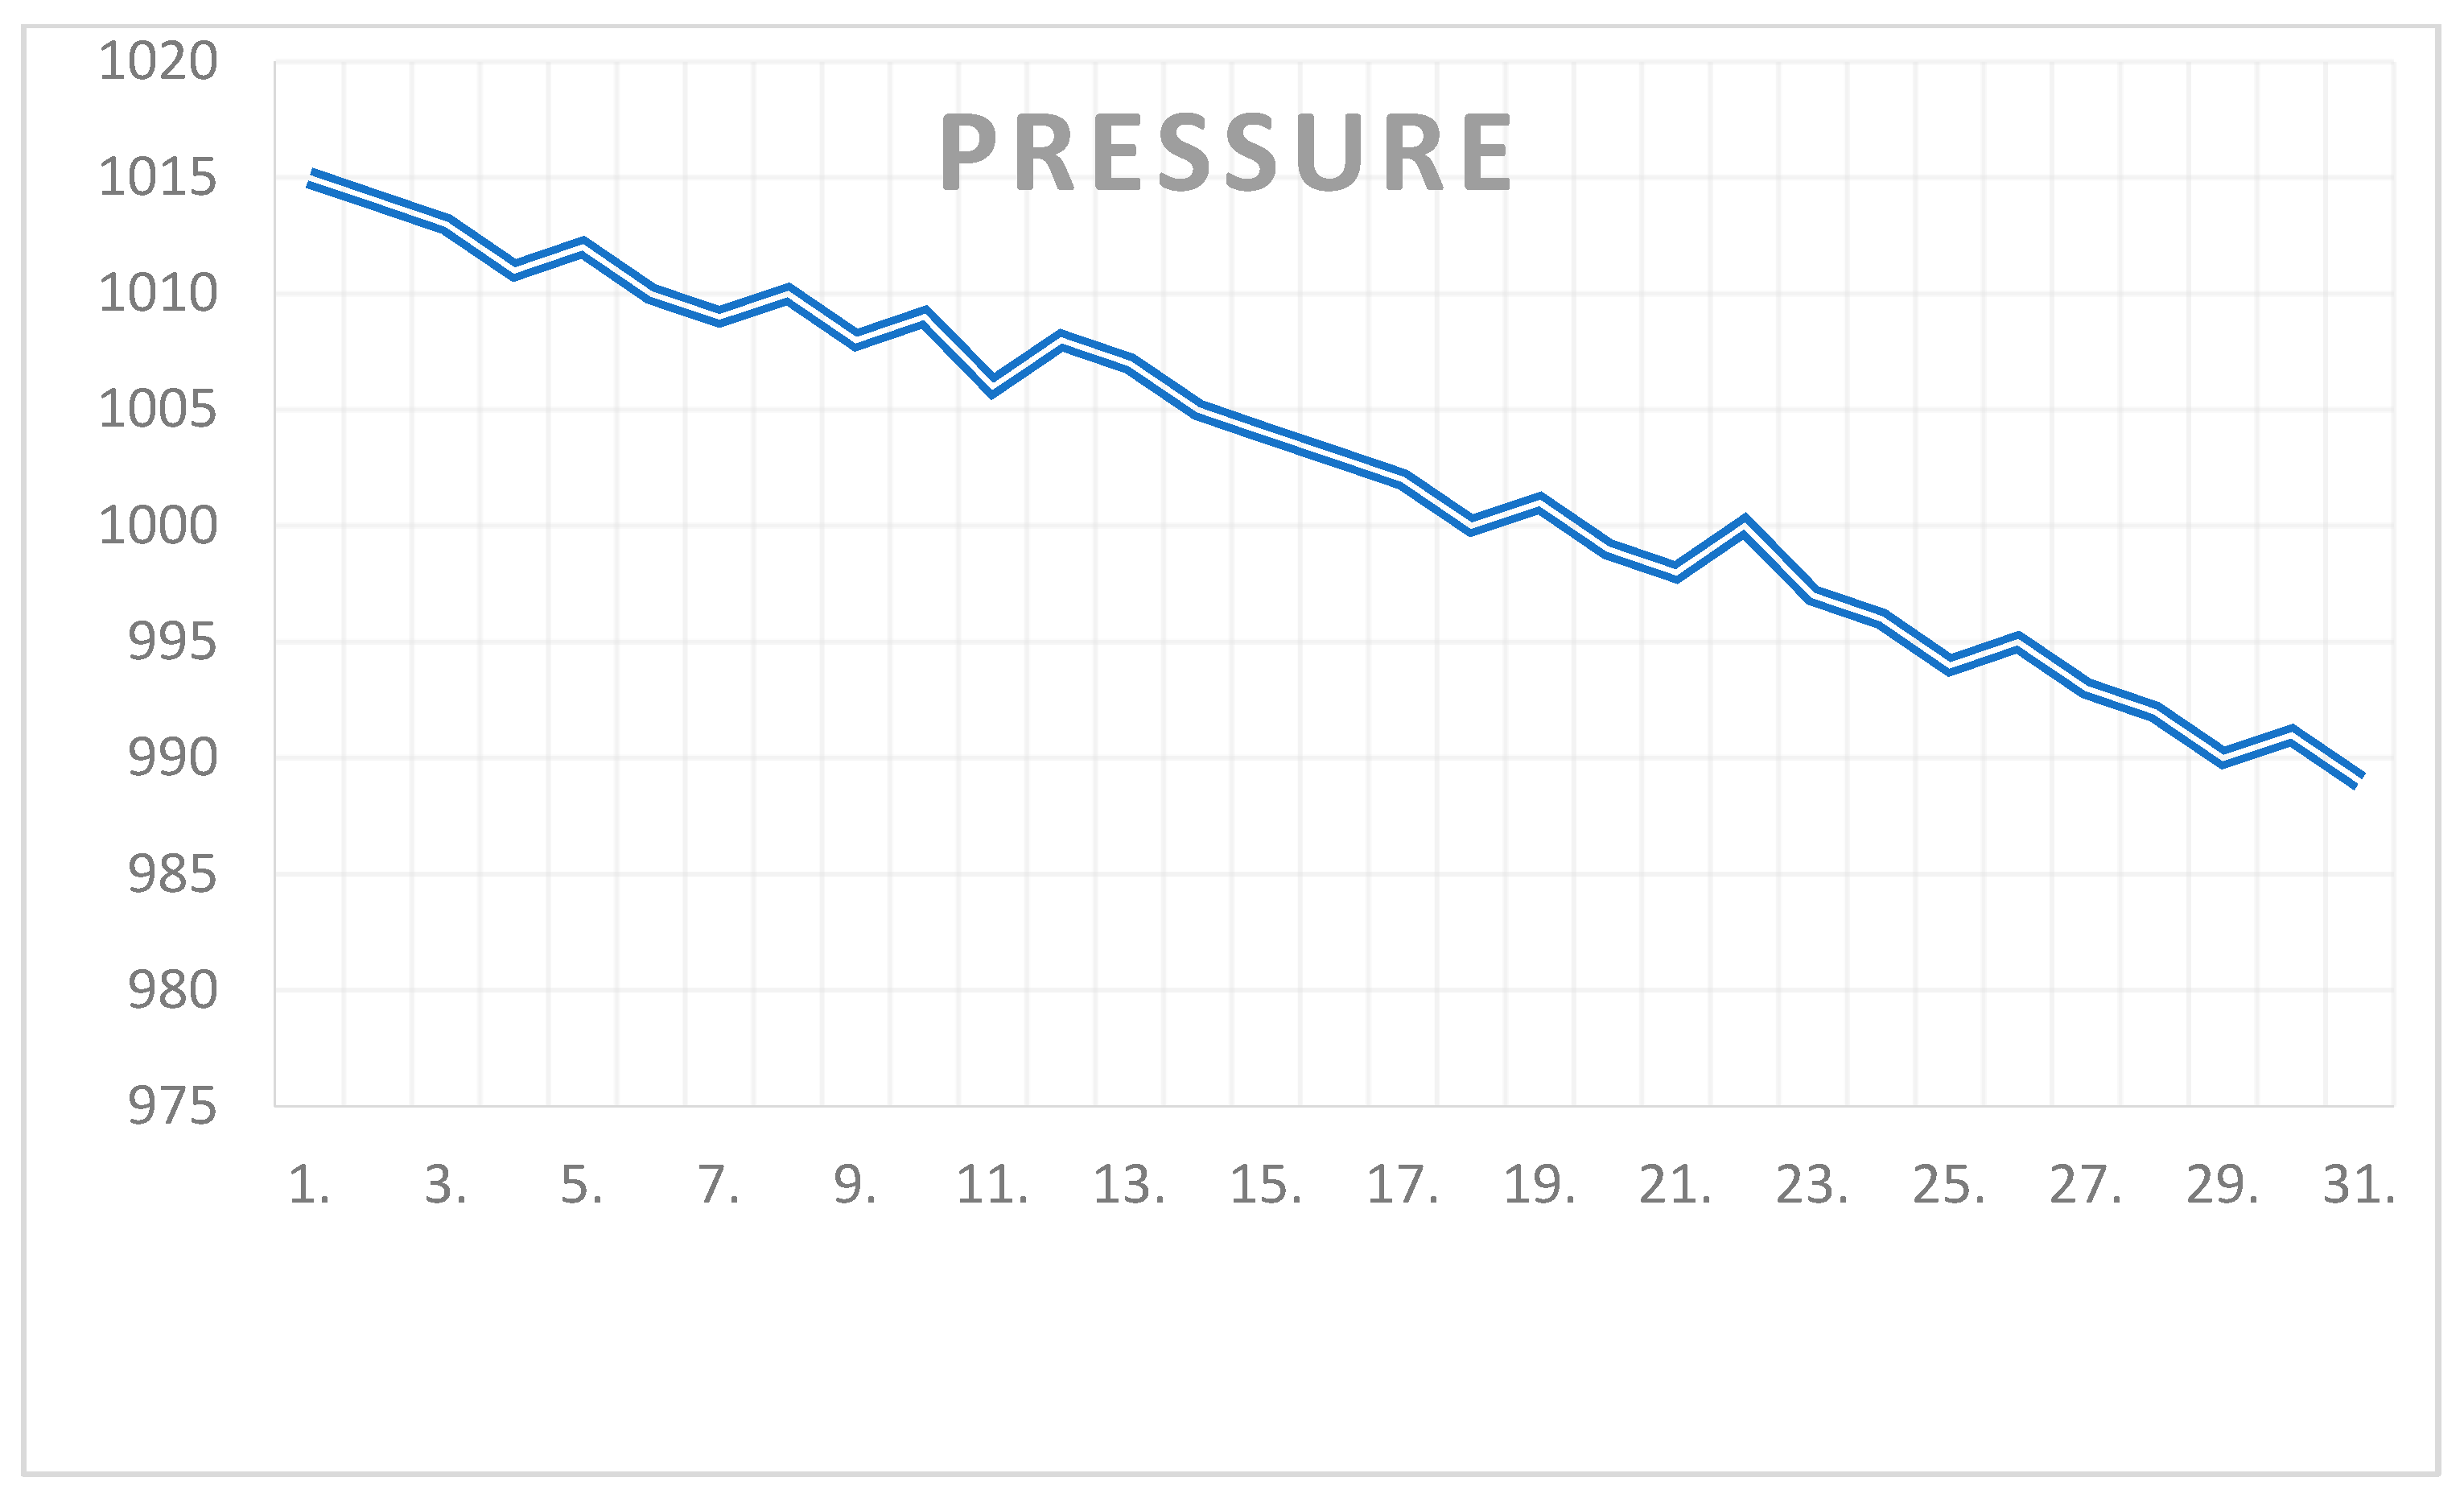
For one month, the results were collected into .xlsx sheets. The results were then averaged for each day. The data from the spreadsheets were imported into a BIM (Revit) through Dynamo. Dynamo 2.1 is open-source software that allows for visual programming using nodes [58]. Dynamo used a node (from an Excel package) to load data from an .xls file. Once the data were imported into Dynamo, the data were processed and manipulated as needed. Once the data were processed in Dynamo, parameters were entered into the Revit model. In the case of more sensors, for example, if the MQTT data represents temperature values at different locations in the building, the data can be used to change the colors or properties of different elements in the BIM model [59]. The results for the entire month of July 2023 were summarized in a line graph (Figure 9). The same was performed with atmospheric pressure (Figure 10).
The charts show a rather high temperature in the latter part of the month of July, which caused thermal discomfort for residents. As the temperature increased, atmospheric pressure decreased, which is more or less in line with common knowledge. Despite the good insulation of the walls, the large glazing causes the first floor of the single-family house to heat up considerably. The living room is where most of the time is spent; hence, based on the results, the decision to install air-conditioning equipment is likely to be made.
The suggested system can be used in a variety of contexts. It can be used in small developments (detached houses, semi-detached houses, terraced houses, atrial buildings), but also in larger developments if the number of sensors is increased and the building itself is zoned. The increased number of sensors and actuators will require visualization of the results in the form of temperature distribution simulations with heating and cooling reports (possible in a Building Energy Modeling (BEM) environment), and control actions can be taken from both BIM applications and more sophisticated solutions. The research indicates that BIM can provide an excellent input for analyses and simulations performed in other IT solutions [38,60].
5. Limitations and Future Research Directions
Some limitations were identified during the design and implementation work. The limitations were based on the author’s experience and feedback from the building owners. The first limitation observed relates to the Arduino IDE environment. Depending on the version, it may not work with the NodeMCU V3 microcontroller. During the network work, it was limited to free and open-source solutions in order to reduce research costs. A major limitation during implementation work was the availability of owners in the building during power failures. However, the failures that occurred were brief and did not significantly interfere with the sensor’s averaged temperature and pressure measurements. However, in the future, one may think about replacing the power supply with a battery. Data were collected continuously and supervised. For low-budget solutions, it is important to also keep in mind the potential cost of protecting the three layers of IoT: application, network, and physical. Each of these should be protected in its own way.
IoT protection and security may be a direction for further research, especially in the context of low-cost solutions. Perhaps the advantages of Blockchain technology can be leveraged for this purpose [61,62]. Alternatively, the development of an integrated IoT–BIM framework can be undertaken with the intention of providing the basic structure of a digital twin for the advanced and sustainable quality control and management of building facilities [63]. The direction of further research could be IoT application domains, validation methods, contribution aspects, or simulations [64]. Types of research, e.g., similar solutions, experimental articles, evaluation studies, validation studies, and opinion articles, can increase research attention toward IoT and its application in BIM. The evolution of BIM is ongoing, and we can see its progressive integration with other systems and technologies [65].
6. Conclusions
IoT–BIM integration is a progressive trend in the broader AECOO industry. Low-cost solutions (15.57 USD), like those presented in the paper, can support decision-making processes even in small developments like single-family homes. Prototyping, installing, commissioning, and using similar IoT solutions is not as difficult as it might seem. The limitations observed were related to the Arduino IDE environment and the availability of owners in the building during power failures. However, both limitations can be overcome in subsequent empirical studies. With Arduino-based systems, there are many possibilities and potential benefits. BIM with IoT sensors can be the basis of smart buildings or anticipated digital twins. Using IoT in BIM is a high level of maturity (3b), and moving toward the next level (3c) relating to telemetry is an interesting direction. The efforts of practitioners and researchers should focus on ensuring the security of the telemetry connection on the IoT–BIM line. Undoubtedly, IoT–BIM integration offers a wide range of opportunities in the processes of monitoring, analyzing, and managing construction sites.
This work can support further experimental work in combining IoT kits with BIM models. At this point, the study has only combined the IoT set with BIM, but only future studies will show whether it is possible to manage this AI-enabled data from, for example, a management application (Autodesk Tandem). Two-way telemetric data exchange is an anticipated direction for such research. Efforts to date can be used for further empirical work using MQTT, Dynamo, or the Python programming language. Combining physical sets with virtual models over networks is a challenge, as each layer must be secure yet capable of further processing and development.
Funding
This research received no external funding.
Data Availability Statement
Data are contained within the article.
Conflicts of Interest
The author declares no conflicts of interest.
Appendix A
Appendix A.1. Program Code for Reading Data from the BMP280 Sensor—Source: Own Elaboration

Appendix A.2. The Code for the Program That Connects the Wi-Fi to the Network and the Sensor—Source Own Elaboration

References
- Doan, D.; Ghaffarianhoseini, A.; Naismith, N.; Zhang, T.; Tookey, T. What is BIM?: A need for a unique BIM definition. MATEC Web Conf. 2019, 266, 05005. [Google Scholar] [CrossRef]
- buildingSMART. Available online: https://www.buildingsmart.org/standards/bsi-standards/ (accessed on 8 June 2023).
- Kensek, K.M. Building Information Modeling; Routledge Taylor and Francis Group: New York, NY, USA, 2014; 285p. [Google Scholar]
- Holzer, D. The BIM Manager’s Handbook: Guidance for Professionals in Architecture, Engineering, and Construction; John Wiley & Sons Ltd.: West Sussex, UK, 2016; 214p. [Google Scholar]
- Kumar, B. A Practical Guide to Adopting BIM in Construction Projects; Whittles Publishing: Glasgow, UK, 2015; 128p. [Google Scholar]
- Henry, A.F.; Elambo, N.G.; Tah, J.H.M.; Fabrice, O.E.; Blanche, M.M. Embodied energy and CO2 analyses of mud-brick and cement-block houses. AIMS’s Energy 2014, 2, 18–40. [Google Scholar] [CrossRef]
- Sharma, A.; Kosasih, E.; Zhang, J.; Brintrup, A.; Calinescu, A. Digital Twins: State of the art theory and practice, challenges, and open research questions. J. Ind. Inf. Integr. 2022, 30, 1. [Google Scholar] [CrossRef]
- Nour El-Din, M.; Pereira, P.F.; Poças Martins, J.; Ramos, N.M.M. Digital Twins for Construction Assets Using BIM Standard Specifications. Buildings 2022, 12, 2155. [Google Scholar] [CrossRef]
- Robles, J.; Martín, C.; Díaz, M. OpenTwins: An open-source framework for the development of next-gen compositional digital twins. Comput. Ind. 2023, 152, 104007. [Google Scholar] [CrossRef]
- Heaton, J.; Parlikad, A.K.; Schooling, J. Design and development of BIM models to support operations and maintenance. Comput. Ind. 2019, 111, 172–186. [Google Scholar] [CrossRef]
- Eastman, C.M.; Eastman, C.; Teicholz, P.; Sacks, R.; Liston, K. BIM Handbook: A Guide to Building Information Modeling for Owners, Managers, Designers, Engineers and Contractors; John Wiley & Sons: Hoboken, NJ, USA, 2011; 626p. [Google Scholar]
- Baghalzadeh Shishehgarkhaneh, M.; Keivani, A.; Moehler, R.C.; Jelodari, N.; Roshdi Laleh, S. Internet of Things (IoT), Building Information Modeling (BIM), and Digital Twin (DT) in construction industry: A review, bibliometric, and network analysis. Buildings 2022, 12, 1503. [Google Scholar] [CrossRef]
- Tang, S.; Shelden, D.R.; Eastman, C.M.; Pishdad-Bozorgi, P.; Gao, X. A review of building information modeling (BIM) and the internet of things (IoT) devices integration: Present status and future trends. Autom. Constr. 2019, 101, 127–139. [Google Scholar] [CrossRef]
- Chamari, L.; Petrova, E.; Pauwels, P. A web-based approach to BMS, BIM and IoT integration: A case study. In Proceedings of the 14th REHVA HVAC World Congress, CLIMA, Rotterdam, The Netherlands, 22–25 May 2022. [Google Scholar]
- Anosike, A.; Alafropatis, K.; Garza-Reyes, J.A.; Kumar, A.; Luthra, S.; Rocha-Lona, L. Lean manufacturing and internet of things—A synergetic or antagonist relationship? Comput. Ind. 2021, 129, 103464. [Google Scholar] [CrossRef]
- Leń, P.; Maciąg, M.; Maciąg, K. Design of an Automated Algorithm for Delimiting Land Use/Soil Valuation Classes as a Tool Supporting Data Processing in the Land Consolidation Procedure. Sustainability 2023, 15, 8486. [Google Scholar] [CrossRef]
- Turk, Ž. Interoperability in construction—Mission impossible? Dev. Built Environ. 2020, 4, 100018. [Google Scholar] [CrossRef]
- Esser, S.; Vilgertshofer, S.; Borrmann, A. A reference framework enabling temporal scalability of object-based synchronization in BIM Level 3 systems, European Conference on Computing in Construction. In Proceedings of the 40th International CIB W78 Conference Heraklion, Crete, Greece, 10–12 July 2023. [Google Scholar]
- Sobhkhiz, S.; Zhou, Y.C.; Lin, J.R.; El-Diraby, T.E. Framing and evaluating the best practices of IFC-Based automated rule checking: A case study. Buildings 2021, 11, 456. [Google Scholar] [CrossRef]
- Barrios, P.; Danjou, C.; Eynard, B. Literature review and methodological framework for integration of IoT and PLM in manufacturing industry. Comput. Ind. 2022, 140, 103688. [Google Scholar] [CrossRef]
- Ruiz-Zafra, A.; Benghazi, K.; Noguera, M. IFC+: Towards the integration of IoT into early stages of building design. Autom. Constr. 2022, 136, 104129. [Google Scholar]
- Wu, I.C.; Liu, C.C. A visual and persuasive energy conservation system based on BIM and IoT technology. Sensors 2019, 20, 139. [Google Scholar] [CrossRef] [PubMed]
- Schraven, M.H.; Droste, K.; Carducci, C.G.C.; Müller, D.; Monti, A. Open-Source Internet of Things Gateways for Building Automation Applications. J. Sens. Actuator Netw. 2022, 11, 74. [Google Scholar] [CrossRef]
- Scianna, A.; Gaglio, G.F.; La Guardia, M. Structure monitoring with BIM and IoT: The case study of a bridge beam model. ISPRS Int. J. Geo-Inf. 2022, 11, 173. [Google Scholar] [CrossRef]
- Peng, S.; Su, G.; Chen, J.; Du, P. Design of an IoT-BIM-GIS based risk management system for hospital basic operation. In Proceedings of the 2017 IEEE Symposium on Service-Oriented System Engineering (SOSE), San Francisco, CA, USA, 6–9 April 2017; pp. 69–74. [Google Scholar]
- Chen, H.; Hou, L.; Zhang, G.K.; Moon, S. Development of BIM, IoT and AR/VR technologies for fire safety and upskilling. Autom. Constr. 2021, 125, 103631. [Google Scholar] [CrossRef]
- Shen, Y.T.; Yang, C.E.; Lu, P.W. The integration of BIM and IoT for air quality monitoring and visualization. In Proceedings of the HCI International 2019-Posters: 21st International Conference, HCII 2019, Orlando, FL, USA, 26–31 July 2019; Proceedings, Part II 21. Springer International Publishing: Berlin/Heidelberg, Germany, 2019; pp. 515–520. [Google Scholar]
- Hussein, Z.; Banimelhem, O. Energy-Efficient Relay Tracking and Predicting Movement Patterns with Multiple Mobile Camera Sensors. J. Sens. Actuator Netw. 2023, 12, 35. [Google Scholar] [CrossRef]
- Mohammed, B.H.; Husairi, A.; Sallehudin, H.; Alaba, F.A.; Safie, N. A Conceptual Framework for Securing IoT-BIM. In Proceedings of the 2022 Applied Informatics International Conference (AiIC), Serdang, Malaysia, 18–19 May 2022; pp. 68–71. [Google Scholar]
- Arif, F.; Khan, W.A. Smart progress monitoring framework for building construction elements using videography—MATLAB—BIM integration. Int. J. Civ. Eng. 2021, 19, 717–732. [Google Scholar] [CrossRef]
- Megahed, N.A.; Hassan, A.M. Evolution of BIM to DTs: A Paradigm Shift for the Post-Pandemic AECO Industry. Urban Sci. 2022, 6, 67. [Google Scholar] [CrossRef]
- Kochański, Ł.; Borkowski, A.S. Automating the conceptual design of residental areas using visual and generative programming. J. Eng. Des. 2024, 35, 195–216. [Google Scholar] [CrossRef]
- Isikdag, U. BIM and IoT: A synopsis from GIS perspective. Int. Arch. Photogramm. Remote Sens. Spat. Inf. Sci. 2015, 40, 33–38. [Google Scholar] [CrossRef]
- Izonin, I.; Tkachenko, R.; Mitoulis, S.A.; Faramarzi, A.; Tsmots, I.; Mashtalir, D. Machine learning for predicting energy efficiency of buildings: A small data approach. Procedia Comput. Sci. 2024, 231, 72–77. [Google Scholar] [CrossRef]
- Dzhengiz, T.; Miller, E.M.; Ovaska, J.P.; Patala, S. Unpacking the circular economy: A problematizing review. Int. J. Manag. Rev. 2023, 25, 270–296. [Google Scholar] [CrossRef]
- Sava, G.N.; Pluteanu, S.; Tanasiev, V.; Patrascu, R.; Necula, H. Integration of BIM solutions and IoT in smart houses. In Proceedings of the 2018 IEEE International Conference on Environment and Electrical Engineering and 2018 IEEE Industrial and Commercial Power Systems Europe (EEEIC/I&CPS Europe), Palermo, Italy, 12–15 June 2018; pp. 1–4. [Google Scholar]
- Popova, S.; Izonin, I. Application of the Smart House System for Reconstruction of Residential Buildings from an Obsolete Housing Stock. Smart Cities 2022, 6, 57–71. [Google Scholar] [CrossRef]
- Valinejadshoubi, M.; Moselhi, O.; Bagchi, A.; Salem, A. Development of an IoT and BIM-based automated alert system for thermal comfort monitoring in buildings. Sustain. Cities Soc. 2021, 66, 102602. [Google Scholar]
- Desogus, G.; Quaquero, E.; Rubiu, G.; Gatto, G.; Perra, C. Bim and iot sensors integration: A framework for consumption and indoor conditions data monitoring of existing buildings. Sustainability 2021, 13, 4496. [Google Scholar] [CrossRef]
- Hasan, S.M.; Lee, K.; Moon, D.; Kwon, S.; Jinwoo, S.; Lee, S. Augmented reality and digital twin system for interaction with construction machinery. J. Asian Arch. Build. Eng. 2021, 21, 564–574. [Google Scholar] [CrossRef]
- Zahid, H.; Elmansoury, O.; Yaagoubi, R. Dynamic Predicted Mean Vote: An IoT-BIM integrated approach for indoor thermal comfort optimization. Autom. Constr. 2021, 129, 103805. [Google Scholar] [CrossRef]
- Kang, K.; Lin, J.; Zhang, J. BIM-and IoT-based monitoring framework for building performance management. J. Struct. Integr. Maint. 2018, 3, 254–261. [Google Scholar] [CrossRef]
- Liu, C.C.; Kuo, W.L.; Shiu, R.S.; Wu, I.C. Estimating and Visualizing Thermal Comfort Level via a Predicted Mean Vote in a BIM System; Osaka University: Osaka, Japan, 2014. [Google Scholar]
- Kim, E.; Cho, Y.; Kim, G. Real time building data collecting using IoT and BIM. In Proceedings of the 2018 Asian Conference on Design and Engineering, Okinawa, Japan, 1–3 November 2018; pp. 1–3. [Google Scholar]
- Vestin, A.; Säfsten, K.; Löfving, M. Smart factories for single-family wooden houses–a practitioner’s perspective. Constr. Innov. 2021, 21, 64–84. [Google Scholar] [CrossRef]
- Rusimamto, P.W.; Endryansyah, L.A.; Harimurti, R.; Anistyasari, Y. Implementation of arduino pro mini and ESP32 cam for temperature monitoring on automatic thermogun IoT-based. Indones. J. Electr. Eng. Comput. Sci. 2021, 23, 1366–1375. [Google Scholar] [CrossRef]
- Hasibuan, A.; Qodri, A.; Isa, M. Temperature monitoring system using arduino uno and smartphone application. Bull. Comput. Sci. Electr. Eng. 2021, 2, 46–55. [Google Scholar]
- Chandramohan, J.; Nagarajan, R.; Satheeshkumar, K.; Ajithkumar, N.; Gopinath, P.A.; Ranjithkumar, S. Intelligent smart home automation and security system using Arduino and Wi-fi. Int. J. Eng. Comput. Sci. (IJECS) 2017, 6, 20694–20698. [Google Scholar]
- Gunputh, S.; Murdan, A.P.; Oree, V. Design and implementation of a low-cost Arduino-based smart home system. In Proceedings of the 2017 IEEE 9th international conference on communication software and networks (ICCSN), Guangzhou, China, 6–8 May 2017; pp. 1491–1495. [Google Scholar]
- Sarah, A.; Ghozali, T.; Giano, G.; Mulyadi, M.; Octaviani, S.; Hikmaturokhman, A. Learning IoT: Basic experiments of home automation using ESP8266, arduino and XBee. In Proceedings of the 2020 IEEE International Conference on Smart Internet of Things (SmartIoT), Beijing, China, 14–16 August 2020; pp. 290–294. [Google Scholar]
- Nayyar, A.; Puri, V. A review of Arduino board’s, Lilypad’s & Arduino shields. In Proceedings of the 2016 3rd international conference on computing for sustainable global development (INDIACom), New Delhi, India, 16–18 March 2016; pp. 1485–1492. [Google Scholar]
- Fezari, M.; Al Dahoud, A. Integrated development environment “IDE” for Arduino. In WSN Applications; Arduino: Piedmont, Italy, 2018; pp. 1–12. [Google Scholar]
- Kumar, N.S.; Vuayalakshmi, B.; Prarthana, R.J.; Shankar, A. IOT based smart garbage alert system using Arduino UNO. In Proceedings of the 2016 IEEE Region 10 Conference (TENCON), Singapore, 22–25 November 2016; pp. 1028–1034. [Google Scholar]
- Soni, D.; Makwana, A. A survey on mqtt: A protocol of internet of things (iot). In Proceedings of the International Conference on Telecommunication, Power Analysis and Computing Techniques (ICTPACT-2017), Chennai, India, 6–8 April 2017; Volume 20, pp. 173–177. [Google Scholar]
- Shah, H.; Soomro, T.R. Node. js challenges in implementation. Glob. J. Comput. Sci. Technol. 2017, 17, 73–83. [Google Scholar]
- Bloch, T. Connecting research on semantic enrichment of BIM-review of approaches, methods and possible applications. J. Inf. Technol. Constr. 2022, 27, 416–440. [Google Scholar] [CrossRef]
- Meadati, P.; Irizarry, J.; Akhnoukh, A. Building information modeling implementation-current and desired status. In Computing in Civil Engineering; ASCE Library: Reston, VA, USA, 2011; pp. 512–519. [Google Scholar]
- Kensek, K.M. Integration of Environmental Sensors with BIM: Case Studies Using Arduino, Dynamo, and the Revit API; Instituto de Ciencias de la Construcción Eduardo Torroja (IETCC): Madrid, Spain, 2014. [Google Scholar]
- Thabet, W.; Lucas, J.; Srinivasan, S. Linking life cycle BIM data to a facility management system using Revit Dynamo. Organ. Technol. Manag. Constr. Int. J. 2022, 14, 2539–2558. [Google Scholar] [CrossRef]
- Pogorelskiy, S.; Kocsis, I. BIM and Computational Fluid Dynamics Analysis for Thermal Management Improvement in Data Centres. Buildings 2023, 13, 2636. [Google Scholar] [CrossRef]
- Wu, L.; Lu, W.; Xue, F.; Li, X.; Zhao, R.; Tang, M. Linking permissioned blockchain to Internet of Things (IoT)-BIM platform for off-site production management in modular construction. Comput. Ind. 2022, 135, 103573. [Google Scholar] [CrossRef]
- Yazdinejad, A.; Dehghantanha, A.; Parizi, R.M.; Srivastava, G.; Karimipour, H. Secure intelligent fuzzy blockchain framework: Effective threat detection in iot networks. Comput. Ind. 2023, 144, 103801. [Google Scholar] [CrossRef]
- Han, T.; Ma, T.; Fang, Z.; Zhang, Y.; Han, C. A BIM-IoT and intelligent compaction integrated framework for advanced road compaction quality monitoring and management. Comput. Electr. Eng. 2022, 100, 107981. [Google Scholar] [CrossRef]
- Teizer, J.; Wolf, M.; Golovina, O.; Perschewski, M.; Propach, M.; Neges, M.; König, M. Internet of Things (IoT) for integrating environmental and localization data in Building Information Modeling (BIM). In ISARC Proceedings of the International Symposium on Automation and Robotics in Construction, Taipei, Taiwan, 28 June–1 July 2017; IAARC Publications: Cambridge, UK, 2017; Volume 34. [Google Scholar]
- Borkowski, A.S. Evolution of BIM: Epistemology, genesis and division into periods. J. Inf. Technol. Constr. 2023, 28, 646–661. [Google Scholar] [CrossRef]
Figure 1.
BIM maturity levels according to the so-called Bew–Richards ramp. Source: own elaboration based on [18].
Figure 1.
BIM maturity levels according to the so-called Bew–Richards ramp. Source: own elaboration based on [18].

Figure 2.
Methodology for installing and connecting the sensor to the BIM model. Source: own elaboration.
Figure 2.
Methodology for installing and connecting the sensor to the BIM model. Source: own elaboration.

Figure 3.
Physical connection between the microcontroller and the sensor. Source: own photo.

Figure 4.
Connection of the microcontroller to the MB102 power module. Source: own photo.

Figure 5.
Procedure of the Node-RED. Source: own elaboration.

Figure 6.
The BIM model used in the study. Source: own elaboration.

Figure 7.
Isometric view of the room with sensor location. Source: own elaboration.

Figure 8.
Imported parameters into the system family with the sensor. Source: own elaboration.

Figure 9.
Graph of average air temperature in the month of July, 2023. Source: own elaboration.

Figure 10.
Graph of average atmospheric pressure in the month of July, 2023. Source: own elaboration.
Figure 10.
Graph of average atmospheric pressure in the month of July, 2023. Source: own elaboration.


Table 1.
Related works with the theme of interest. Source: own elaboration.
| Authors | Main Idea and Application | Difference |
|---|---|---|
| Rusimamto, P. W., Endryansyah, L. A., Harimurti, R., and Anistyasari, Y. (2021) [46] | Automatic temperature measurement using cameras (wifi) | A solution based on the more expensive Arduino pro mini |
| Hasibuan, A., Qodri, A., and Isa, M. (2021) [47] | Temperature measurement with transmission to a smartphone | Kit on Arduino Uno |
| Chandramohan, J., Nagarajan, R., Satheeshkumar, K., Ajithkumar, N., Gopinath, P. A., and Ranjithkumar, S. (2017) [48] | Low-cost solution and new communication protocol for monitoring and controlling the home environment | Without using BIM |
| Gunputh, S., Murdan, A. P., and Oree, V. (2017) [49] | Low-cost, multi-faceted home automation system based on the Arduino microcontroller for thermal comfort control and energy management | without using MQTT |
| Sarah, A., Ghozali, T., Giano, G., Mulyadi, M., Octaviani, S., and Hikmaturokhman, A. (2020) [50] | IoT trainer project to understand IoT concepts, which are divided into three aspects: IoT devices, connectivity and cloud or application system | Dedicated and difficult-to-replicate solutions |
Table 2.
A list of kit components with prices. Source: own elaboration.
| Product | Function | Feature | Price [USD] |
|---|---|---|---|
| NodeMCU V3 with ESP8266 wifi module | Microcontroller | 10 GPIO pins, 1-Wire, I2C bus, Analog-to-Digital Converter, PCB antenna. Built-in microUSB connector CH340 USB–UART converter, Wi-Fi: 2.4 GHz Flash memory: 4 MB | 4.16 |
| BMP280 | Temperature and pressure sensor | Interface: I2C or SPI Measured pressure range: 300–1100 hPa Accuracy: 1 hPa Supply voltage: 3.3 V Temperature measurement range: −40 to +85 °C Size: 15 × 10 mm | 1.97 |
| Wires complete | Female–female, female–male | 10 cm | 1.97 |
| MB102 | Power module for contact plates | Input voltage: 6.5–12 V Output voltages: 5 V and 3.3 V Current capacity: 700 mA Jumpers to change the output voltage DC power input (5.5 mm × 2.1 mm) USB port ON/OFF button Indicator light | 1.70 |
| USB cable | USB type A (m)–micro USB type B (m) | USB compatibility: 1.0, 1.1, 2.0 Cable length: 80 cm Data link | 1.21 |
| Power charger | 5 V 1000 mA | For devices with a DC voltage of 5 V and up to 1 A (1000 mA) Outside/inside entry hole dimensions: 5.5 mm/inside 2.5 or 2.1 mm (universal) Switching mode (stabilized) Input 110–240 V~AC | 4.56 |
| Total | 15.57 |
Disclaimer/Publisher’s Note: The statements, opinions and data contained in all publications are solely those of the individual author(s) and contributor(s) and not of MDPI and/or the editor(s). MDPI and/or the editor(s) disclaim responsibility for any injury to people or property resulting from any ideas, methods, instructions or products referred to in the content. |
© 2024 by the author. Licensee MDPI, Basel, Switzerland. This article is an open access article distributed under the terms and conditions of the Creative Commons Attribution (CC BY) license (https://creativecommons.org/licenses/by/4.0/).
Share and Cite
MDPI and ACS Style
Borkowski, A.S. Low-Cost Internet of Things Solution for Building Information Modeling Level 3B—Monitoring, Analysis and Management. J. Sens. Actuator Netw. 2024, 13, 19. https://doi.org/10.3390/jsan13020019
AMA Style
Borkowski AS. Low-Cost Internet of Things Solution for Building Information Modeling Level 3B—Monitoring, Analysis and Management. Journal of Sensor and Actuator Networks. 2024; 13(2):19. https://doi.org/10.3390/jsan13020019
Chicago/Turabian StyleBorkowski, Andrzej Szymon. 2024. "Low-Cost Internet of Things Solution for Building Information Modeling Level 3B—Monitoring, Analysis and Management" Journal of Sensor and Actuator Networks 13, no. 2: 19. https://doi.org/10.3390/jsan13020019
Note that from the first issue of 2016, this journal uses article numbers instead of page numbers. See further details here.