Article

An Optimized Link State Routing Protocol with a Blockchain Framework for Efficient Video-Packet Transmission and Security over Mobile Ad-Hoc Networks

by
Huda A. Ahmed
1,2 and
Hamid Ali Abed AL-Asadi
3,*
1
Faculty of Computer Science and Mathematics, University of Kufa, Najaf 54001, Iraq
2
College of Computer Science and Information Technology, University of Basrah, Basrah 61004, Iraq
3
Department of Computer Science, College of Education for Pure Sciences, University of Basrah, Basrah 61004, Iraq
*
Author to whom correspondence should be addressed.
J. Sens. Actuator Netw. 2024, 13(2), 22; https://doi.org/10.3390/jsan13020022
Submission received: 26 November 2023 / Revised: 5 February 2024 / Accepted: 23 February 2024 / Published: 11 March 2024
(This article belongs to the Section Network Security and Privacy)

Abstract

:
A mobile ad-hoc network (MANET) necessitates appropriate routing techniques to enable optimal data transfer. The selection of appropriate routing protocols while utilizing the default settings is required to solve the existing problems. To enable effective video streaming in MANETs, this study proposes a novel optimized link state routing (OLSR) protocol that incorporates a deep-learning model. Initially, the input videos are collected from the Kaggle dataset. Then, the black-hole node is detected using a novel twin-attention-based dense convolutional bidirectional gated network (SA_ DCBiGNet) model. Next, the neighboring nodes are analyzed using trust values, and routing is performed using the extended osprey-aided optimized link state routing protocol (EO_OLSRP) technique. Similarly, the extended osprey optimization algorithm (EOOA) selects the optimal feature based on parameters such as node stability and link stability. Finally, blockchain storage is included to improve the security of MANET data using interplanetary file system (IPFS) technology. Additionally, the proposed blockchain system is validated utilizing a consensus technique based on delegated proof-of-stake (DPoS). The proposed method utilizes Python and it is evaluated using data acquired from various mobile simulator models accompanied by the NS3 simulator. The proposed model performs better with a packet-delivery ratio (PDR) of 91.6%, average end delay (AED) of 23.6 s, and throughput of 2110 bytes when compared with the existing methods which have a PDR of 89.1%, AED of 22 s, and throughput of 1780 bytes, respectively.

1. Introduction

Mobile ad-hoc networks (MANETs) are infrastructure-less networks in which self-configured mobile nodes are interconnected via wireless links [1]. Due to their decentralized process, such nodes confide in each other to store and transmit packets. Video-packet transmission over MANETs is a challenging task because of the sudden changes in topology and minimal central administration [2]. Traditional cellular wireless networks demand a high-priced infrastructure for achieving great mobility. However, MANETs cannot require high-priced or wired infrastructure [3]. Also, conventional wireless networks require a constant network infrastructure with access points or base stations that are eligible to be utilized for situations such as military missions and disaster relief [4]. In these cases, a high-speed deployment and self-organized network can be employed for certain purposes and particular periods. In general, ad-hoc networks are self-configured, decentralized, self-organized networks and can generate a communication network without confiding in any constant infrastructure [5]. Advancements in the Internet have changed our way of living by connecting people to the physical world. MANETs are a type of wireless ad-hoc network that allows mobile devices to communicate without relying on infrastructure or control [6]. Each device acts as a node that can forward, receive, or transmit data packets to other nodes in the network. Nodes include mobiles, laptops, or tablets connected to wireless networks for communication [7].
These devices form a network by creating links between nodes that are nearer and relaying data packets to nodes that are out of the range [8]. MANETs are useful in emergencies such as military situations, remote areas, and disaster response circumstances where no other communication exists. The challenges faced by MANETs are battery life, bandwidth, and security threats [9]. Due to limited bandwidth and battery life, the performance and reliability of the network become degraded; also, a lack of centralized control and dynamic nature makes it vulnerable to security threats such as denial-of-service attacks, eavesdropping, and packet drop by malicious nodes [10]. Thus, various types of research are carried out to further improve the MANET environment by using routing, congestion control, and security mechanisms. The energy constraints are a major problem in MANETs due to the lack of power supply to devices, and the mobility of devices causes insecure and low-throughput communication [11]. The packet drop is the reason for low throughput and grey-hole attacks. Thus, network breaches and packet drops are considered malicious misbehaviors [12].
Also, the routing in MANETs is insecure since the nodes are responsible for packet routing, network management, and transmissions. Many protocols are available for achieving the QoS requirements in MANETs and there are two types of routing strategies: proactive and reactive. Reactive routing only generates routes when necessary [13]. Determining the current pathways is not necessary for reactive protocols. Instead, it is done on a demand basis, hence they are considered as on demand routing protocols. Land mobile radio (LMR), temporary ordered routing algorithm (TORA), ad-hoc on demand distance vector routing (AODV), and dynamic source routing (DSR) are a few instances of these reactive routing methods [14]. Processing times in reactive protocols are typically longer while determining routes and transmitting packets [15,16].
These two procedures take a long time, which prolongs the end-to-end delay. Proactive routing protocols cover many protocols such as the destination sequenced distance vector routing protocol (DSDV), wireless routing protocol (WRP), cluster head gateway switch routing protocol (CGSR), and optimized linked state routing protocol (OLSR) [17,18]. The OLSR generates a maximum throughput that is scalable and manageable. The fundamental ad-hoc routing solutions are OLSR, AODV, and DSR. Using HELLO and transmission control, the OLSR is a proactive link state routing protocol enhanced for mobile ad-hoc networks that determines and extends the information throughout the MANET [19]. Using shortest-path forwarding, each node in the network determines the next hop destination of other nodes. Since the OLSR’s primary function is to store and update its routes, it can provide a route instantaneously whenever it is needed [20]. The OLSR protocol has been used in several recent studies to transmit videos more efficiently and with better results than with other conventional protocols. Combining deep-learning techniques can result in higher performance and further increase the efficiency of the OLSR. For video transmissions, the proposed study therefore used the OLSR protocol with deep learning.

Motivation

The mobile ad-hoc network (MANET) describes a collection of portable nodes connected by wireless links and operating as a separate system. The MANET has a lot of intriguing features when a node moves from one area to a different one. For instance, it may continue to maintain connected systems and remain flexible and adaptive. Mobile-to-mobile communication relies highly on routing protocols that broadcast the information. The protocol used for routing determines the path for video transmission from source to destination. Ad-hoc on-demand vector is a reactive routing system used in MANETs that uses less memory because routing mechanisms have an impact on overall performance. However, several routing protocols used are vulnerable to various attacks that drop the packets instead of transmitting the packets, causing crashes and congestion in the traffic. Thus, the proposed study utilizes a new deep-learning-based routing for enhancing the efficacy of the OLSR routing protocol to transmit video on MANETs and also improving the security of MANETs through the blockchain. The main objectives of the proposed work are:
(i)
To introduce a novel deep-learning model with a trust-based optimal routing protocol for enhancing reliability, maintaining video continuity, increasing the packet-delivery ratio, and decreasing transmission errors while transmitting video packets in MANETs with enhanced security.
(ii)
To propose a novel hybrid deep-learning structure for identifying black-hole nodes to provide effective video-packet routing in a MANET environment.
(iii)
To securely store the MANETs’ information, blockchain security is enabled and the validation process is performed by utilizing an extended consensus algorithm.
(iv)
To analyze the performance of the proposed study by evaluating varied metrics and the comparing the attained results with other existing methodologies, such as secure routing algorithm blockchain technology (SRABC), ad-hoc on-demand distance Vector (AODV), dynamic source routing (DSR), highly efficient dual authenticated routing (HEDAR), secured encryption technique with optimum route discovery (SETORD), the OLSR, and destination sequenced distance vector (DSDV).
The rest of this paper is arranged as follows: Section 2 presents the related works to be discussed with MANETs. Section 3 considers the proposed methodology. Section 4 provides the results and discussion. Finally, Section 5 presents the conclusion and future work.

2. Related Works

Prasath et al. [21] presented a bi-fitness swarm optimizer-based blockchain assisted secure swarm intelligence routing protocol for MANETs. The MANET provides communication between mobile devices and devices without any proper infrastructure. Hence, to provide quality of service (QoS), supervision of nodes and providing security is challenging. Thus, the following processes are considered: BLAKE-3 hashing algorithm for providing authentication zone-wise, rewards-optimized deep Q-learning algorithm utilized for clustering, particle-swarm optimization algorithm applied for priority-based routing securely, and finally sensitivity of packets are calculated using a sensitive aware data-encryption algorithm performed using blockchain-based SALSA 20. The performance of the suggested method has limited resources and bandwidth.
To enable the transmission of videos across MANETs, a self-configured adaptable infrastructure that considers the quality of service is described by Jayabarathan et al. [22]. The routing method sets up a multipath-forwarding system, maintains a list of routes on a regular basis, and categorizes these based on a variety of criteria. In order to improve the efficiency of services and reduce the likelihood of disconnected links despite employing less signaling cost, this concept functions differently in extremely changing states than it does when dealing with more static ones. Venkatasubramanian et al. [23] introduced the detection of black- and grey-hole attacks using hybrid cat with a PSO-based deep-learning algorithm in MANETs. This study focused on detecting both black-hole and grey-hole attacks by using deep-learning techniques, because the MANET is more susceptible to attacks than the wired network. In each attack, the detection block forwarding ratio metric is used to find the difference between the normal and faulty nodes. The collected records were changed by malicious nodes to escape from the detection process. This was prevented by using a convolutional neural network (CNN) and a long short-term memory (LSTM) network. The tuning of parameters is carried out by using hybrid cat-particle swarm optimization (HCPSO). This suggested method has limited effectiveness and computational cost.
Ghodichor et al. [24] introduced a secure routing protocol to mitigate attacks by using blockchain technology in MANETs. In MANET communication, several nodes are connected in the network, and thus are susceptible to various attacks. Thus, this article explains many types of attacks that affect MANETs by using a safe routing algorithm (SRA) that employs the blockchain (SRABC). The SRA protects the control and flow of data against attacks by utilizing a hash function for every data transmission. Also, the role of the blockchain in MANET security is explored here and the connection between SRA and the blockchain is described. Finally, the throughput and PDR are evaluated using the SRABC approach and compared to various routing protocols. Lwin et al. [25] presented blockchain-based lightweight trust management in mobile ad-hoc networks. Nowadays MANETs widely use the blockchain due to its characteristics such as immutability, consensus, provenance, etc. The blockchain is employed not only for secure storage but also for trustless exchange of data between end nodes. The challenges involved in ad-hoc networks are the type of nodes used during the validation process and how to overcome the computational complexities. This study provides a trust-management system with a consensus algorithm, termed optimized link state protocol (OLSP), to embed the blockchain concept in MANETs. Thus, the blockchain solves the issues in OSLR, because each node performs the security operations in a repeated manner. Also, using predefined principles protects the network from attackers. The results showed this consensus algorithm, used in resource-hungry MANETs, reduces validation time and overhead. Srilakshmi et al. [26] presented an improved hybrid secure multipath routing protocol for MANETs. In this existing study, a hybrid genetic algorithm with hill climbing (GAHC) was used for selecting the optimal route. Initially, an improved fuzzy c-means approach was constructed on density peaks and the cluster heads were selected in an estimated way depending on direct, indirect, and recent trust values. Here, the computation also depends upon the trust threshold worth nodes obtained. Even cluster heads were obtained in the multi-hop routing process, and it was the combination of all routes. The features utilized in this existing work for obtaining optimal routing were latency, throughput, and connection. The developed protocol afforded optimal performance compared to other comparable protocols. Vivekananda et al. [27] introduced an efficient video-transmission process using clustering and optimization approaches in a MANET environment. This existing study used discrete wavelet transform (DWT) to the video frames for decomposing the input frames into several sub-bands. For transmitting the videos, bit streams were utilized with the stream control transmission protocol (SCTP) multi-streaming. Here, clustering was carried out by the enhanced fuzzy c-means algorithm (EFCM). Then, the optimal path selection was performed by the enhanced cuckoo search (ECS) optimization algorithm for sending video streams. Through the inverse operation of the video-sending part, frame reconstruction was enabled at the receiver side. The simulation analysis reveals the effectiveness of this existing study by achieving less performance in delivery ratio, delay, energy consumption, throughput, and overhead by changing the number of nodes and rates.Sharma et al. [28] utilized improvised OSLR with an optimized multi-protocol router (MPR) and DYDOG for affording secure video transmission. Here, the developed hybrid approach can ensure secure video streaming in MANETs by optimizing factors such as energy utilization and delay in the OLSR. The developed protocol enhanced the node’s mobility and promoted security by analyzing varied malicious attack nodes such as packet replication, black holes, and wormholes. This study used encryption methods such as digital signature and AES to secure the frames against malicious attacks. The simulation results prove the efficacy of the developed approaches.

Problem Statement

Mobile-to-mobile communication has become safer because of the growing dissemination of data using MANETs. The MANET network faces challenges; network performance mainly degrades the security. In a blockchain system, node mobility causes problems due to changes in the connectivity of nodes. Thus, mobility makes the process difficult since nodes have limited lengths to transfer information to a new block. Therefore, the existing methods are more challenging due to MANETs’ dynamic structure, complex facilities, changeable bandwidth requirements, insufficient security measures, and multi-hop communication. To solve these issues, the deep-learning method is used for improved performance.

3. Proposed Methodology

Accordingly, the proposed study introduces an effective extended the OLSR protocol with a deep-learning model for enabling effective video streaming in MANETs. The steps involved in the proposed study are data collection, black-hole detection with trust-based optimal reliable routing, blockchain storage, and validation. Initially, the input video data are gathered from publicly available sources. Then, for identifying black-hole nodes, the proposed study introduces a new twin-attention-based dense convolutional bidirectional gated network (SA_DCBiGNet) model. Then, a trust value is generated to analyze the reliability of neighboring nodes, based on the trust values. After, the routing is performed using the extended osprey-assisted optimized link state routing protocol (EO_OLSRP). Figure 1 shows the block diagram of the proposed method.
Here, the osprey optimization algorithm (OOA) selects the optimal path based on parameters such as node-stability degree and link-stability degree. Finally, blockchain storage is enabled to enhance the security of MANET information through interplanetary file system (IPFS) technology. The validation process of the proposed blockchain framework is performed by utilizing the delegated proof-of-stake (DPoS) method. Thus, the proposed study effectively secures MANETs against unauthorized parties and thereby enhances confidentiality. The attained superior performance in the proposed study states that the developed extended OLSR is a suitable protocol for MANET video transmission applications. An effective open-source framework for simulating different network situations, including mobile devices is ns-3. It is an important tool for researchers and developers since it offers an extensive collection of models and modules to precisely depict the operation of mobile networks. Also, this study proposes the performance of mobile networks can be better understood by using ns-3 mobile simulation models. Through precise simulation of mobility, channel propagation, MAC protocols, and applications, we can obtain significant insights and enhance network architectures for enhanced mobile experiences.

3.1. System Model

Mobile ad-hoc networks (MANETs) are the most prevalent kind of wireless system, due to their flexibility and many characteristics, including being infrastructure-less and self-configuring. MANETs are faced with several difficulties, including constrained devices, restricted bandwidth, and link failure caused by a change in topology that is very dynamic, constrained devices, scalability, fault tolerance, security risks, and the maintenance routing protocol. For information to be sent from a single node to a different one in MANETs, routing is a fundamental issue. Since the development of commercial mobile ad-hoc networks, routing has been the subject of analysis. Many MANET routing protocols are currently being developed to provide accuracy, speed, stability, dependability, scalability, resiliency, and QoS-awareness, along with routing protocols for an enormous amount of dynamic network topology. The defined network model serves as a basis for the implementation of the proposed approaches. In any network, routing is the process of choosing a path. Numerous machines, referred to as nodes, and the pathways or links that connect them, make up a computing network. There are numerous ways in which two nodes in a linked network might communicate with each other. The process of choosing the optimal path while adhering to pre-set rules is referred to as routing. The blockchain is a distributed database that operates on a peer-to-peer (p2p) basis, similar to a ledger, wherein a list of ever-expanding entries, known as blocks, are connected and secured through the use of public-key cryptography. Using blockchain technology, instead of adding to the centralized database as in a traditional centralized system, new information is added to a block and made available to all nodes in a distributed network. A hash value is created, typically using the safe hash cryptographic technique 256 bits (SHA256), which identifies each block in a blockchain. Security is controlled to safeguard sensitive data and prevent hackers and other unauthorized individuals from accessing them. As the reliance on blockchain networks grows, a major concern is blockchain security. The goal of blockchain security, a risk-management strategy, is to safeguard transactions and, by extension, the entire blockchain network. To enable video transmission through the nodes, several novel features have been incorporated into the proposed algorithm. The operational concept of the proposed algorithm is displayed in Figure 2. First, the input video is fed to the proposed module. In order to achieve effective video streaming on both sides, two Linux modules are used. The video stream is thus sent to the proposed MANET infrastructure, and it is appropriately received at the output side. Then, the simulation settings of the network are adjusted to extract features from the videos to test them, and finally, they are secured to save the information.

3.2. Data Collection

Data collection is the process of gathering and analyzing information from various sources. Then, the input videos are collected from the Kaggle dataset. Therefore, two separate datasets are used to collect the videos: (1) short videos—the short videos are provided for use in identifying objects among other video-processing applications; and (2) CSV—a dedicated dataset for a wireless sensor network-detection system (WSN-DS) is created in this study to aid in the detection and classification of the following type of denial-of-service (DoS) attack, black-hole attacks. Dataset links: https://www.kaggle.com/datasets/mistag/short-videos (16 November 2023), https://www.kaggle.com/datasets/bassamkasasbeh1/wsnds (16 November 2023).

3.3. Black Hole Detection

The malicious network participates in a variety of harmful acts that reduce the network’s efficiency [29]. Then, the malicious node transmits route response (RREP) information to the source node after the source node receives the route request (RREQ) most quickly to the node that is being attacked without considering the real route from the point of origin. The false route response is regularly transmitted to the source node by the blackhole station. When a malicious node maintains data packets before deleting the remainder of the network, then the network’s performance drops.
Figure 3 illustrates that the network consists of 10 nodes connected by a dynamic topology, with a source node and a destination node. The route request (RREQ) for the shortest path to the destination is broadcast by the source node when it needs to transfer data packets to the destination node. When a black hole or malicious node, for instance Node 4, receives the RREQ message, it offers the immediate false route response to the source node. For instance, Node 1 delivers the data packets through that routing after receiving the RREP message. Data packets are received by Node 4, which then drops them from the network, causing the network to break down. Thus, the proposed study presents a new dense convolutional bidirectional gated network (SA_DCBiGNet) model based on twin attention for detecting black-hole nodes. Then, the twin-attention model can simultaneously concentrate on local and global aspects of the input. The term ‘twin aspect’ describes the capacity of the model to handle, inside a single attention layer, two distinct features of the input data: the general structure and the smaller details. As a result, the model can potentially show unclear signs of black holes by capturing the intricate interactions between various data points. From the dense layers, it can identify spatial information such as temperature disparities or brightness patterns that could point to the existence of a black hole. The term ‘dense’ describes the utilization of numerous convolutional layers to increase the capacity for feature extraction. Then, bidirectional gated network layers identify dependency relationships and temporal changes are carried out by analyzing the retrieved characteristics across the data, both forward and backward in time. This is important in order to spot minute alterations or signatures that could point to the activity of a black hole. The network generates a prediction about the possibility of a black hole present at a given place in the data based on the extracted features and their temporal correlations.

3.3.1. Twin-Attention-Based Dense Convolutional Bidirectional Gated Network (SA_DCBiGNet)

The proposed dense convolutional bidirectional gated network (SA_DCBiGNet) model is discussed in this section. The proposed SA_DCBiGNet method includes a dense convolutional neural network (Dense-CNN), twin attention, and Bi-GRU network. There are two kinds of twin attention: the position-attention and channel-attention methods. The proposed SA_DCBiGNet model is based on twin attention for locating black-hole nodes. Once the black-hole node is detected, videos received from the particular node are ignored. Table 1 depicts hyperparameters and values. Figure 4 shows the architecture of the SA_DCBiGNet model.

Dense Convolutional Neural Network

The proposed dense network is formed by neurons that learn to optimize each other. Additionally, as the term ’dense network’ signifies, layers may be densely interconnected [30], which means every neuron through a particular layer acquires the input of every single neuron around the prior layer and the same way. It also serves as an input for each of the neurons among the layers following in Figure 5.
A dense network is used in various fields for numerous kinds of applications, including linear classification and analysis and unsupervised information clustering. It can analyze data with complex patterns. The proposed convolutional neural network (CNN) is a type of neural network that is comparable to a dense network because it is designed largely to analyze visual data. The result allows an encoding of video-specific details in the neural network construction, which makes it more suitable for tasks that require videos. A CNN’s straightforward and accurate design, shown in Figure 6, allows it to associate a sizable quantity of data recorded in a video into the final output.
As a result, the proposed CNN might significantly lower the number of features due to maintaining a weight-sharing framework and pooling techniques and hence perform better than DNNs in evaluating videos. The full connection of nodes still enhances the problem of dimensionality. It is essential to recall that CNNs lack spatial relationship invariance, and this implies it cannot record an object’s location or orientation. Therefore, a CNN could not be immediately applicable when the position of details is of concern. In the field of design study results, CNNs are rapidly being used for a variety of tasks including classification and automatic design. Twin Attention
Twin attention is proposed to combine local and global features in an adaptable manner [31]. This section describes the twin-attention layers that capture systematically distanced contextual data. Figure 7 shows the twin-attention module.
Position-Attention Method
The proposed position-attention method consists of increasing a model’s capacity for local characteristics by encoding a larger variety of context-related data into each other. The method for adaptively aggregating spatial contexts is then elaborated. The local feature is represented as B R C × H × W . The convolutional layer produces two features, A and D , where A , D R C × H × W . Then, the dimensions are reshaped by R C × N . Hence, the number of pixels is denoted as N = H × W . The spatial attention connected to softmax S R N × N is then calculated by performing a matrix multiplication involving the transpose vectors D and A .
s i j = exp A i , D j i = 1 N exp A i , D j
Hence, for s i j , the i t h position is affected by the j t h position. In addition, reshaping R C × N and producing a new feature E R C × H × W is carried out by entering the feature B through the convolution layer. The outcome is then reshaped as R C × H × W by performing a matrix multiplication involving E and S as the transpose. To achieve the result F R C × H × W , an element-wise method is executed using feature B and increasing the dimension factor.
F j = α i = 1 N s i j E i + B j
Thus, α appears with zero and proceeds to add extra weights. Equation (2) indicates the final feature F in every position, which comprises a weighted average for the attributes throughout all regions and also the initial parameters. The result systematically integrates contexts based on spatial attention and global conceptual perception. Similar features interact to enhance each other, improving semantic integrity and intra-class compactness.
Channel-Attention Method
The channel-attention method proposed is interesting and demonstrates important potential to improve deep CNN effectiveness. A class-specific solution can be considered for every channel’s layer for higher-order features, and various conceptual outputs are connected to one another. In the architecture of the channel-attention method, Y R C × C is directly determined by the original elements B R C × H × W , ignoring the position of the attention method. An even more precise method is to restructure B t o R C × N before performing the matrix multiplication across B and the transposed version B . To obtain the channel attention Y R C × C , finally add the softmax layer.
y j i = exp B i . B j i = 1 C exp B i , B j
where y j i represents the effect of the i t h channel concerning the j t h channel. Additionally, to transpose Y and B , multiply those results, and then reshape in R C × H × W . The end result F R C × H × W can be obtained by performing an element-wise operation using B and multiplying the outcome with scale parameter β .
F j = β i = 1 C y j i B i + B j
Hence, β rapidly acquires a weight in 0. According to Equation (4), which describes the long-term structural connections among feature map elements, every channel’s end feature comprises a weighted average of the features extracted from the other channels and the original attributes. In twin attention, this enhances the ability to distinguish between features.

Bi-GRU Network

The proposed GRU network, improved by two layers of architecture, is referred to as a Bi-GRU network. The two-layer layout gives the output layer access to the input layers’ full context data at all times. The Bi-GRU network’s fundamental principle is that the input series is processed by two networks that are forward and backward networks, before their respective outputs are combined in a single output layer. The forward layer analyzes the output from the hidden layer in every step between forward and backward in a Bi-GRU network, then the backward layer computes the output from the hidden layer every time between backward and forward. At every stage, the output values from the forward and backward layers are combined and normalized by the output layer in Figure 8.
h t 1 = g w y h 1 y t + w h 1   h 1 h t 1 1 + a h 1
h t 2 = g w h 1 h 2 h t 1 + w h 2   h 2 h t 1 2 + a h 2
x t = f w h 2 x h t 2 + w h 2   x h 1 2 + a x
Hence, h t 1 N H and h t 2 N H represent the output of the hidden layer in the forward direction, H represents the number of elements, t denotes time, h t 1 N H and h t 2 N H represent the output of the hidden layer in the backward direction, x t N T denotes every label value for the combining term at the moment, T denotes the number of labels, the input time denoted as y t , f . denotes activation function, a and w represent weight matrices, and g . indicates the GRU processing network. In this section, Bi-GRUs can detect black holes more accurately by capturing more subtle information about these signatures through analysis of the data in both forward and backward orientations. Overall, Bi-GRU networks present a viable method for enhancing MANETs’ blackhole identification and strengthening network safety and dependability. The proposed (SA_DCBiGNet) model has an entropy loss, which affects the efficiency; thus, the parameters are required to be fine-tuned; therefore, loss becomes reduced, which is described in Equation (10),
P e n t r o p y l o s s = 1 N t i = 1 c W h mod u l e s E c k + 1 E c log 1 E c k
where c represents the total number of modules, N t represents the total number of samples, E c denotes true vector, and E c k indicates label matrix. In order to reduce the loss function, the parameters are fine-tuned by utilizing the extended osprey optimization algorithm.

3.4. Trust Value Computation

The dependability of surrounding mobiles is determined by the extended osprey-assisted optimized link state routing protocol (EO_OLSRP), using the transmitted topology control (TC) and HELLO messages. A mobile may be chosen in a packet transmission when the trust rate is at least equal to the specified trust criteria. The collection of neighbors can be changed to include the number of messages every neighbor has sent in addition to neighbor identifiers in order to account for the newly added modules. Every time a TC and HELLO message is established, these variables are modified. The trust-based optimal routing also identifies trustworthiness in a node n controlled by a separate node y as a probability of performing a specific action expected y , which is represented as T y n . Then, y may evaluate trustworthiness as a result of knowledge collected during a certain operation phase by applying a weighted average of the trust with every type of action, such as route reply, route error, route request, and data transmission. During a period, message transmissions through n , in which p c s are confirmed to be valid, the total quantity of attempts transmission is p a , and the total number of accurate transmissions as p s , is estimated by:
T y n = p c + ε p s p t + ε p a
where 0 < ε < 1 indicates the weighting factor representing a ratio of effective transmissions that shows a high probability that the transmission link can operate properly. In this case, a mathematical framework similar to that used to measure link quality is employed, which differs from the trust-level analysis. Equation (11), in addition to evaluating trustworthiness, also partially demonstrates connection quality. Other more complex measurements that describe link quality, including the collision monitoring and signal separation approach, as well as the link adjustment and power control method, may also be employed to produce a more precise trustworthiness rating. T x n ; j represents the trustworthiness of node n as provided by node y through the j t h trustworthiness update cycle. When new data arrives, the node maintains its archive and computes a trustworthiness score utilizing a weighted mean or shifting average model. Consider that the measurement of T x n ; j for the j t h trustworthiness update phase is designated as T ˜ x n ; j , which is determined by assessing n ’s current behavior while y examines the correctness and authenticity of the messages that arrive. In the j + 1 t h trustworthiness update phase, generate a number of the trustworthiness, that is indicated as T ^ x n ; j . The moving average approach is used to generate a smooth valuation in Equation (12),
T ^ y n ; j + 1 = α T ^ y n ; j + 1 α T ˜ y n ; j , f o r n N 1 y
where 0 < α < 1 represents a weighting factor utilized to balance the current measurement data and the previous estimation. Assume the path k ε K s y , in which K s y is a collection of pathways that begins at a source node s and ends at a destination node y , for instance K s y = a l l p a t h s f r o m s t o y . Then, T x k ; j denotes the trustworthiness of the path specified by the node y . As a result, the path’s trustworthiness is described as
T y p ; j = n k T y n ; j
As a result, y can increase its reputation on a path depending on the trustworthiness of its nearby nodes. The connections in Equation (13) can be utilized as a measurement of routing by a node to determine routing decisions.

3.4.1. Optimized Link State Routing Protocol

The proposed OLSR represents a proactive routing system that commonly exchanges network structure information from nodes [32,33]. Each node in the network chooses a set of neighboring nodes to serve as multipoint relays (MPR). The OLSR proposes to function independently of the network’s additional protocols. In addition, the connection between layers that exist from the OLSR is not used in any computation. It is utilized for groups of ad-hoc networks such as MANETs.
In the OLSR, the MPRs assume the responsibility of transmitting control traffic intended for distribution over the complete network. MPRs reduce the number of transmissions necessary for transmitting control messages, leading to a dependable and efficient system. Additionally, a particular task is to announce connection state details across the networks. It is utilized in route processing to build a path from two network nodes, beginning at a single source network and terminating at the additional destination node. Figure 9 demonstrates the OLSR protocol.
The two forms of messages used in the OLSR are topology control and HELLO messages. Each node in a system may acquire information about the link state and adjacent nodes in two hops through HELLO messages. The multi-point relay (MPR) of every node utilized to interact is determined based on this data. Each node in a network transmits messages, which are used to update a database essential to packet routing. To build an MPR selection set, various nodes frequently transmit TC messages. By reducing the optimum periodic interval of time and response to issuing TC messages, the OLSR is routinely enhanced.
An integrated administration scheme is not necessary for the OLSR to manage the routing procedure. It may be useful for certain network operations to have routes accessible through a routing list because there will be no delay associated with finding a route in that area. In addition, the MPR approach enables the OLSR most effectively in large networks. On the opposite side, the OLSR norms do not provide any capabilities for the quality of link testing. Then, the utilization of bandwidth rises as an outcome of the routing table’s regular updates. Moreover, sometimes it becomes harder to detect MPR, at last, the routing is accomplished utilizing the OLSR.

3.4.2. Extended Osprey Optimization Algorithm

This study proposes an OOA that is a metaheuristic algorithm that is effective in performing the search process in both the global and local problem-solving space to produce a satisfactory solution [34]. There are two stages: exploration and exploitation stages. The capacity of the system to locate the primary suitable region and avoid local optima is improved by combining the global search phase and integrating the idea of exploration. Then, the capability of the approach to arrive at probable superior options in promising regions increases as a result of the search process from the local scale using the possibility of exploitation. Here, the OOA determines the optimal path based on parameters such as link-stability degree and node-stability degree in Equations (14) and (15).
C i j = λ 1 L Q i j + λ 2 X i j + λ 3 S i j
where, C i j represents link stability from i and j , X i j indicates safety degree, λ 1 , λ 2 , λ 3 represent weighting vector, L Q i j represents link quality, and S i j denotes factor for predicting mobility.
V Y = h Y h 2 n h Y h n 2
Hence, V Y represents variance, h denotes the total quantity of nodes, Y h represents the message level acquired from every adjacent node. The fitness is obtained using Equation (16),
f i t n e s s   v a l u e = max Node   stability   degree   +   Link   stability   degree

Initialization

The OOA describes a population-based strategy that utilizes the benefit of the searching ability of population members in the area of problem-solving to identify a feasible solution over a replication-based approach. As an individual of the OOA population, every search agent determines the ranges of variables related to their specific location within the search region. Consequently, every search agent is a possible fix for the problem, represented statistically by a vector. All search agents comprise an OOA populace, which is given in Equation (17). When the OOA is initially applied, Equation (18) is used to initialize at random search agents’ locations in the search area.
p = p 1 p 2 p n N × M = p 1 , 1 p 1 , j p 1 , m p i , 1 p i , j p i , m p N , 1 p N , j p N , M N × m
p i , j = l b j + r i j . u b j l b j , i = 1 , 2 , , N . j = 1 , 2 , , m .
Hence, p indicates search agents’ positions, p i represents the i t h search agents, p i , j indicates the j t h dimension, N represents the number of search agents, M denotes the problem variable, r i j indicates a random variable in the range between [0, 1], l b j represents the lower bound, and u b j indicates the upper bound. Equation (19) can be utilized to represent the objective function as a set of vectors.
G = G 1 G i G N N × 1 = G P 1 G P i G P N N × 1
where G i represents the objective function of the i t h search agents, and G denotes the range of objective function.

Exploration Stage

The base for the initial level of the OOA population-updating system is produced by simulating search agents’ natural behavior. The OOA explores capacity in the search region, enabling the identification of the ideal position while avoiding the local optimum. The positions of different search agents within the search area that provide a higher objective function score are measured to be less than ideal for each search agent regarding the overall area. Equation (20) is used to uniquely identify each search agent’s collection of features.
G L i = P h | h 1 , 2 , , N G h < G i P b e s t
Hence G L i represents the feature locations of the i t h search agents, P b e s t indicates the best search agents’ positions. The new position of the associated search agents is found by a simulation that involves the search agents’ approaching feature. The objective function numerical value, which is provided in Equation (21), is increased by the search agent’s new location.
p i , j L i = p i , j + r i , j . S G i , j R i , j . p i , j
p i , j L 1 = p i , j L 1 , l b j p i , j L 1 u b j l b j , p i , j L 1 < u b j u b j , p i , j L 1 > u b j .
P i = P i L 1 , G i L 1 < G i ; P i , e l s e
where P i L 1 indicates the new location of the i t h search agents in the initial stage, p i , j L 1 represents the j t h vector, G i L 1 represents the objective function rate, S G i indicates an optimal feature of the i t h search agents, S G i , j represents the j t h vector, and R i , j represents the random variable range of [0, 1].

Exploitation Stage

The second phase of increasing the number of individuals in the OOA is based on a numerical simulation of the natural activities of search agents. Then, the search agent’s position is altered by the simulation of moving the feature to the correct location. The local search area’s OOA exploitation potential is enhanced by the search area, leading to improved possibilities that exceed the recognized ways through integration. According to the OOA technique, an appropriate location for the absorbing feature is first randomly selected for every individual in the group using Equation (24).
p i , j L 2 = p i , j + l b j + r . u b j l b j t , i = 1 , 2 , , m , k = 1 , 2 , , K
P i , j L 2 = p i , j L 2 , l b j p i , j L 2 u b j i b j , p i , j L 2 < l b j u b j , p i , j L 2 < u b j
This is used to increase the objective function’s score in the current position, which modifies the related locations of the search agents, permitting Equation (26),
P i = P i L 2 , G i L 2 < G i ; P i , e l s e
where P i L 2 represents the location of the i t h search agents in the second sage, P i , j L 2 represents the j t h vector, G i L 2 indicates the objective function value, r i , j represents a random variable in the range [0, 1], K represents the number of iterations, and k denotes iteration area. The proposed model frequently produces training errors, because the hyper parameters are difficult to learn. Thus, to resolve these issues, the opposition-based learning (OBL) approach uses the extended osprey optimization (Ex-OOA) algorithm to optimize the hyperparameters of the proposed model. The OBL method uses the fitness function f value to determine whether the current choice is better or not. A different value p ¯ for the true value p [ v , l ] is adopted in the fundamental definition of OBL, and this value can be found using the following formula:
p ¯ = v + l p
The description can be extended to n dimensions using the following formula:
p ¯ i = v i + l i p i , i = 1 , 2 , , N
where p R n denotes the real vector and p ¯ R n represents the opposite vector. During the optimization phase, a comparison is also made between the two responses p and p ¯ . The better of two options is stored and the other is eliminated through the evaluation of the fitness function. The extended osprey optimization approach is illustrated in Algorithm 1. Figure 10 shows the flowchart of the OOA.
Algorithm 1: Ex-OOA
The problem details (objective function, constraints, and variables).
Set the total number of iterations K and the OOA size of the population N.
Create the initial distribution matrix utilizing Equations (14) and (15).
Assess the objective function with Equation (16)
For k = 1 to K
and For i = 1 to N
Stage 1: Exploration
Adjust the feature locations of the ith OOA individual utilizing Equation (20): G L i = P h | h 1 , 2 , , N G h < G i P b e s t .
The ith search agents randomly choose the feature.Utilizing Equation (21), determine the new location of the ith OOA individual, depending on the first stage of the OOA.
p i , j L i = p i , j + r i , j . S G i , j R i , j . p i , j
Evaluate the boundary conditions of the new location of the OOA individuals utilizing Equation (22):
p i , j L 1 p i , j L 1 , l b j p i , j L 1 u b j l b j , p i , j L 1 < u b j u b j , p i , j L 1 > u b j .
Utilizing Equation (23), modify the ith OOA individual.
P i = P i L 1 , G i L 1 < G i ; P i , e l s e
Stage 2: Exploitation
Utilizing Equation (24), determine the new location of the ith OOA individual, depending on the second stage of OOA. p i , j L 2 = p i , j + l b j + r . u b j l b j t
Evaluate the boundary conditions of the new location of the OOA individuals utilizing Equation (25):
P i , j L 2 p i , j L 2 , l b j p i , j L 2 u b j i b j , p i , j L 2 < l b j u b j , p i , j L 2 < u b j
Alter the ith OOA individual utilizing Equation (26):
P i = P i L 2 , G i L 2 < G i ; P i , e l s e
End.
Select the most suitable option.
End OOA.

3.5. Interplanetary File System (IPFS)

The proposed interplanetary file system’s (IPFS) interaction with the blockchain is necessary to address the issue of storing enormous amounts of MANET data. An innovative protocol called IPFS allows for the formation of a distributed and peer-to-peer information storage network. In addition, the proposed IPFS provides the possibility to store big files in an allocated and reliable way. The IPFS’s ability to share files between numerous peers is depicted in Figure 11.
The content identifier (CID), commonly referred to as the file hyperlink or address, is a hashing algorithm and value that is encrypted for each file submitted to the proposed IPFS network in Figure 11a. Furthermore, as described in Figure 11b, other individuals with the CID might access and receive the file. Each peer acts as the role of file server in IPPS, allowing it to share and store a huge number of files quickly. Figure 11c demonstrates how a peer might obtain a record from several data sources. Data cannot be changed by the main operator due to the dispersed approach. The CID additionally serves as evidence of the validity of the file because it would modify the contents of the file in Figure 11d. As a result, the proposed IPFS is considered a responding blockchain component while there is an enormous capacity to address the issue of redundant, massive storage of data in the blockchain. To ensure authenticity and reliability, peers may choose to store layout documents and files into the IPFS and add CIDs to the blockchain operations.

3.6. Delegated Proof-of-Stake (DPoS)

In the proposed method, as part of a blockchain consensus process called delegated proof-of-stake (DPOS), network participants select passes on to vote and assist in verifying the preceding block [35]. The holders of a proposed DPoS blockchain can vote to determine which nodes will approve transactions. The number of staked holdings determines the individual’s voting power. The decision of this is appointed to the nodes and is more influenced by users with larger stakes. The term ’delegate’ refers to the specified nodes. In the proposed DPoS method, each node in the blockchain system is entitled to vote according to the assets and select the node that it believes is most suitable.
Because DPoS employs an independent voting process, it is more representative by build than similar systems. The proposed DPoS is a process to ensure that people authorized with verifying blocks in the entire network perform verification accurately and honestly, instead of eliminating the demand for confidence. The trusted node must also be confirmed as the source of each verified block. The transaction is no longer verified when a certain number of unknown nodes are accomplished due to DPoS. Still, it usually helps to provide 3 s processing-based operations.
For individuals planning to submit a vote in the situation, every validator may provide different incentives. For instance, if a member is selected to send forward a block, it can distribute a certain percentage of incentive cash between the selected users. It is commonly known that because there are not many validators, the process will conclude quickly with a consensus.

4. Result and Discussion

In this section, the results comparison and performance of the proposed methods are explained. The simulations and system requirements results are utilized to execute the research in Python. A total of five videos are collected for the proposed method, of which 80% are utilized for training and 20% for testing. Table 2 shows the system configurations. The proposed method uses two datasets: https://www.kaggle.com/datasets/mistag/short-videos, 16 November 2023.

4.1. Performance Metrics Evaluation

The performance analysis is estimated utilizing metrics such as average end delay (AED), dropped packets (DP), end-to-end delay, packet-delivery ratio (PDR), throughput, and routing overhead (ROH), and the resulting outcome is computed hundreds of times (100 s) at five nodes.
  • Average end delay (AED): The unit of average end delay is the second (s). AED is described as the mean time it takes for the total number of packets to travel from two nodes, which is computed using Equation (29):
A E D = i = 0 n T R T S t o t a l a m o u n t o f p a c k e t s
T R represents the total amount of time the packet takes to be received, T s represents the total amount of time the packet takes to be sent.
  • Dropped packet (DP): The unit of the dropped packet is percentage (%). The fraction of lost packets compared to sent packets is used to calculate packet loss.
D P = t o t a l o f p a c k e t s e n t t o t a l o f p a c k e t r e c e i v e d t o t a l o f p a c k e t s e n t
  • Throughput: The unit of throughput is bits per second (bps). A certain number of data packets are sent to the receiver over a specific period of time. It is usually computed in bits of information per second.
T h r o u g h p u t = n u m b e r o f p a c k e t s r e c e i v e d t o t a l t i m e
  • End-to-end delay: The unit of end-to-end delay is milliseconds (ms). The amount of time required for a packet to travel from the point of origin to the destination across a system is known as the end-to-end delay.
d e n d t o e n d = T L R
Here, T represents processing time, L represents the length of time, and R represents the total ratio.
  • Packet-delivery ratio (PDR): The packet-delivery ratio (PDR) is measured as a percentage (%). The PDR is a proportion of the total number of packets transferred to the total number of packets received by the initial node from the system destination node.
P D R = Re c e i v e d p a c k e t s S e n t p a c k e t s × 100
  • Routing overhead (ROH): The ROH is measured as a percentage (%). The ROH represents the total number of packets sent by all nodes for controlling the total number of packets received from the destination node.
R O H = t o t a l a m o u n t o f p a c k e t s s e n d t o t a l a m o u n t o f p a c k e t s r e c e i v e d

4.2. Comparative Analysis with Other Methods

This section provides the result analysis and comparison of the proposed and existing methods in terms of the secure routing algorithm blockchain protect (SRABC), ad-hoc on-demand distance vector (AODV), dynamic source routing (DSR), highly efficient dual authenticated routing (HEDAR), secured encryption technique with optimum route discovery (SETORD), the OLSR, destination sequenced distance vector (DSDV), geographic routing protocol (GRP) and hybrid wireless mesh protocol (HWMP). Figure 12 depicts the comparison of the proposed and existing OLSR protocols. In order to validate the OLSR protocol, it is essential to guarantee its dependability, effectiveness, and security in MANET implementations. Also, the OLSR protocol improves performance and enhances security.
Figure 12a–k depicts the comparison of the proposed and existing OLSR protocols. The studied OLSR has large networks with lots of nodes that can be handled. For dynamic wireless networks, the OLSR provides a reliable and effective routing solution. The proposed OLSR protocol has energy efficiency, scalability, low overhead, quick convergence, loop-free routing, many routes, and fast convergence. Also, with the energy-efficient design, the OLSR can be used in wireless connections with a short battery life. Through the comparison analysis with other existing protocols, the proposed protocol is validated by achieving better results in every performance metric.

Simulation Outputs

The evaluation of the simulation result is displayed in this section. First, randomly generate the blockchain connection. After that, communication occurs inside the MANET, then the blockchain is integrated into the network, and nodes are recognized by their relevant weights. The most efficient method of interaction has also been used to finish a transaction over the MANET. At last, a range of attacks are included in the set of data in training, and a range of assaults are validated in datasets by testing. The creation of a node in the MANET blockchain with the proper weight is shown in Figure 13.
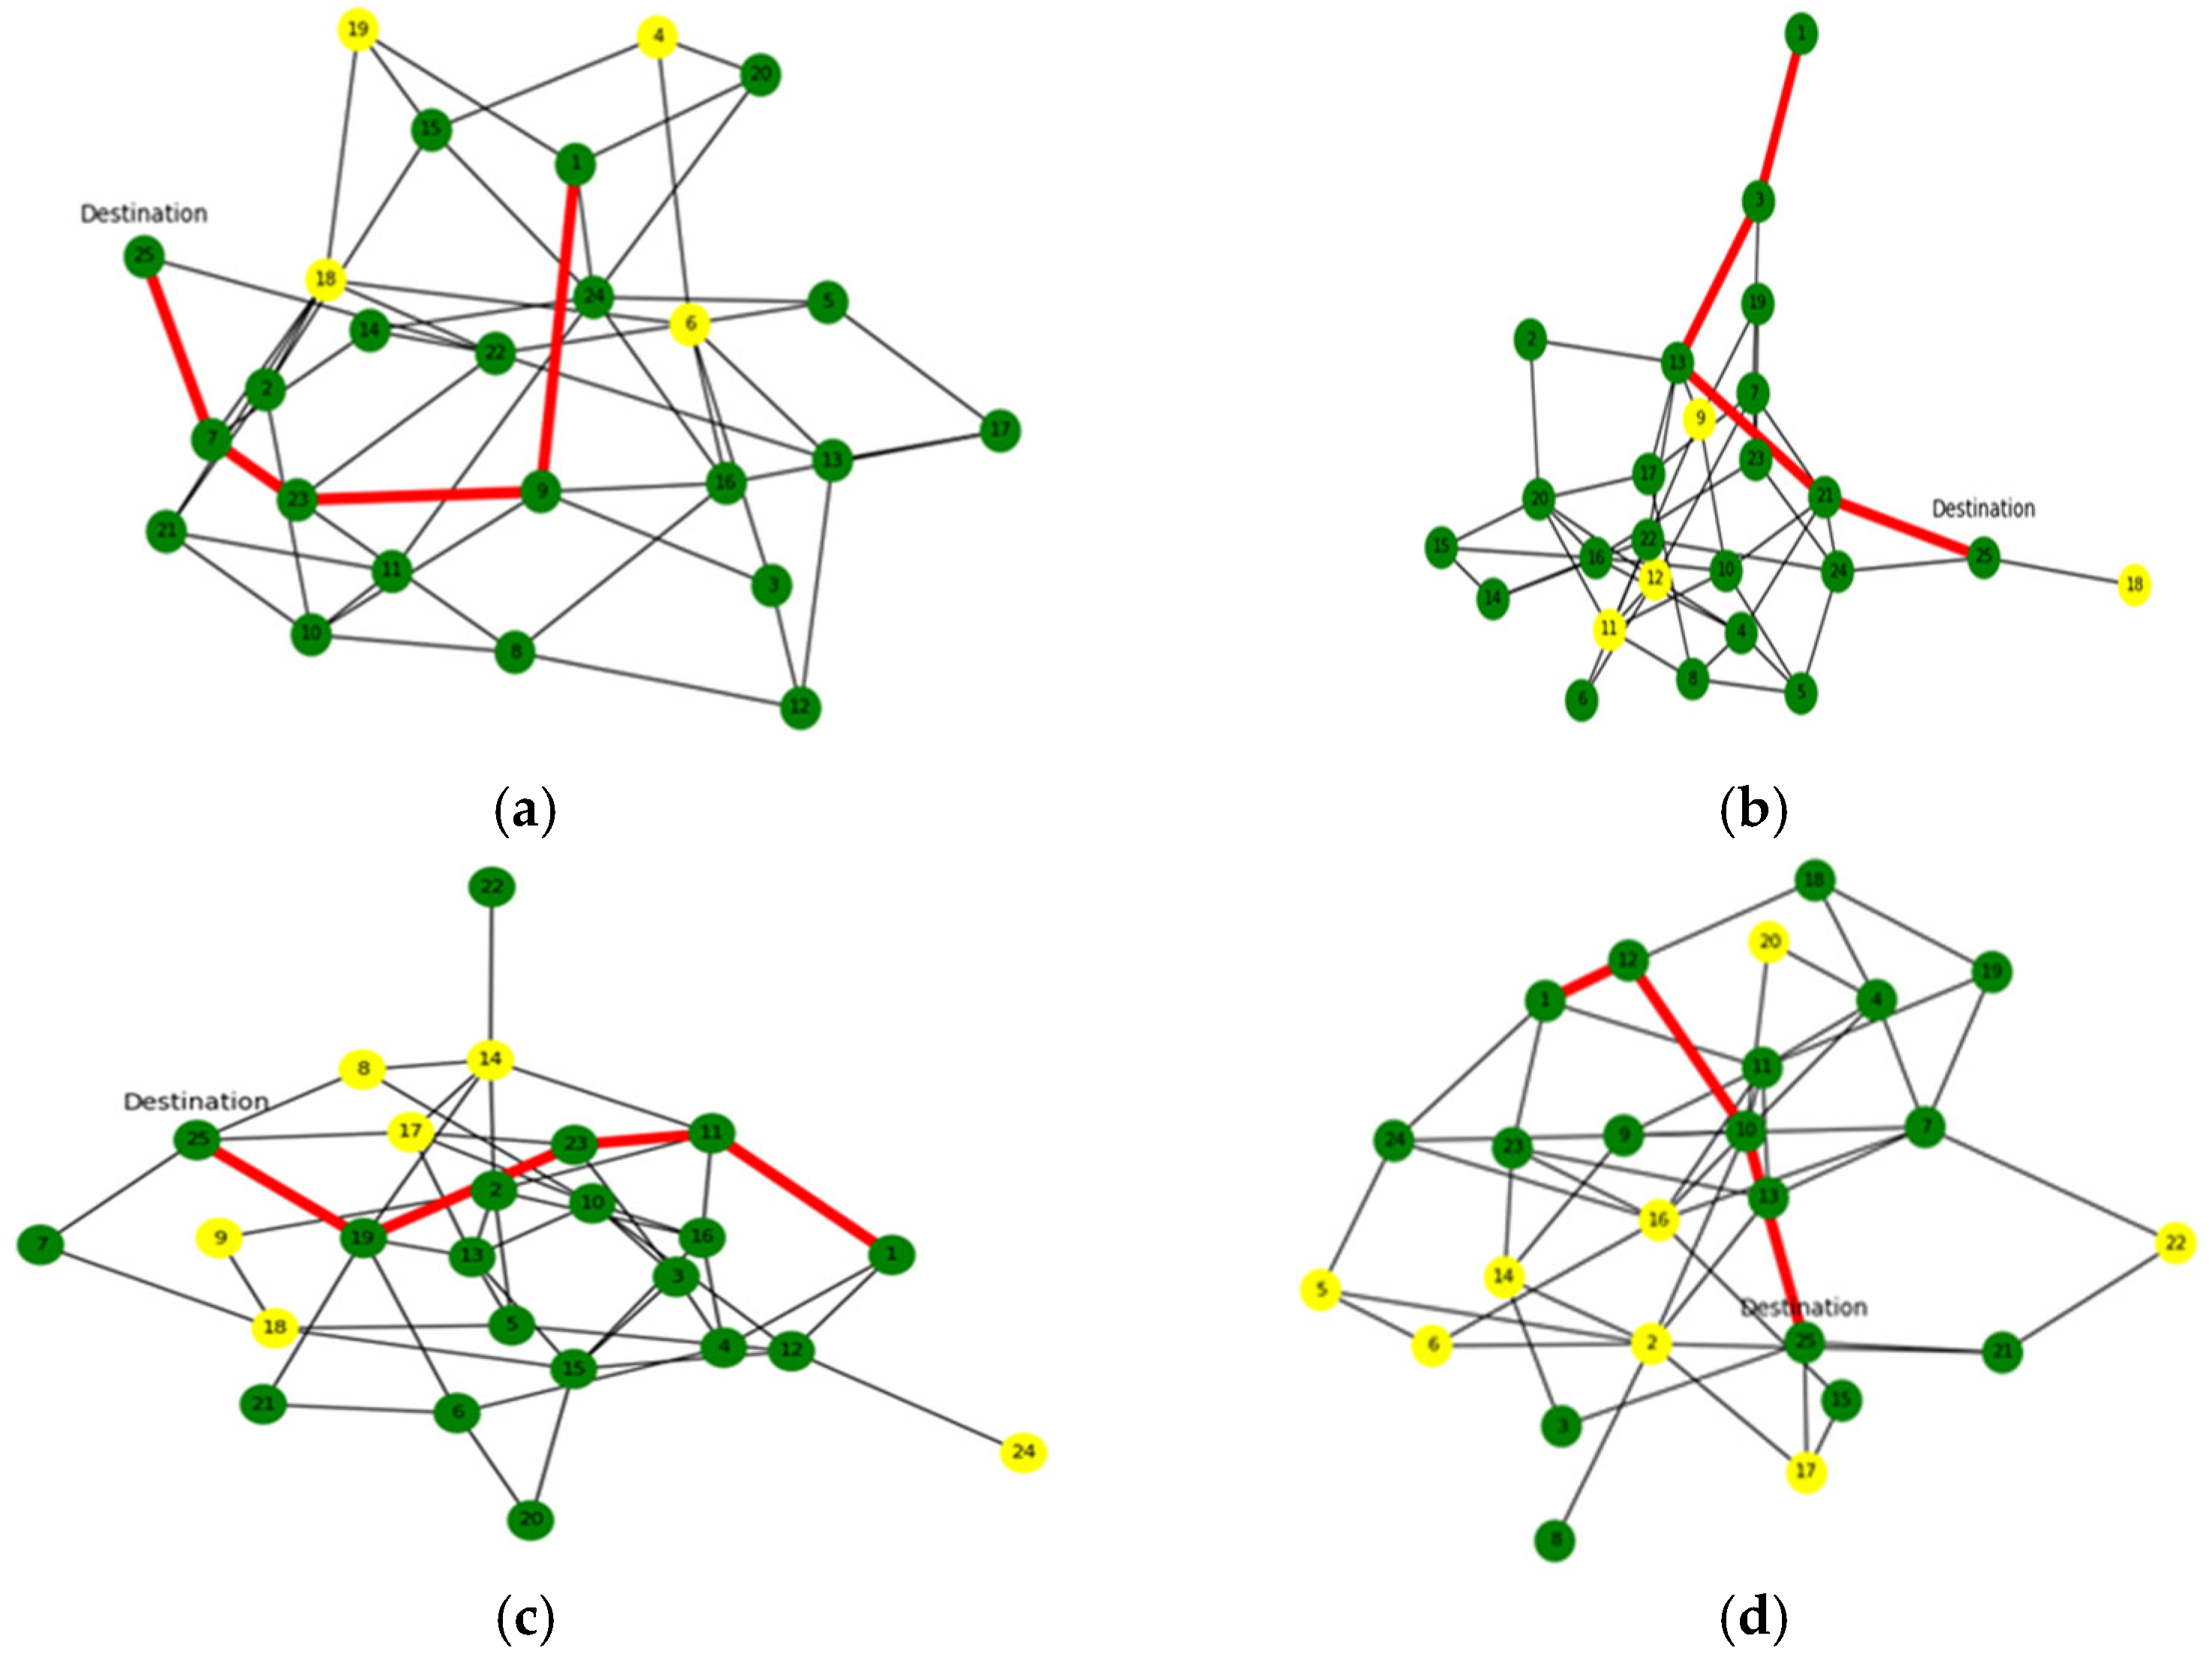
A node is built using a blockchain, with every node having the appropriate weight after the block is created and the data is hashed. In Figure 13a, Node 1 is the source node and Node 25 is the destination node. The shortest paths go from Node 1 to Node 9, from Node 9 to Node 23, from Node 23 to Node 7, and from Node 7 to Node 25. This may result in improved network performance generally and in transaction confirma-tion times. Also, Figure 13b–d shows the shortest-path calculation. Due to its ability to quickly recalculate routes and preserve connectivity, shortest-path algorithms can dynamically adapt to changes in network topology, such as those caused by node mo-bility or link failures. As networks grow, the shortest-path algorithms are a good choice since they can manage larger MANETs more effectively than certain routing tech-niques. The simulation parameters of the proposed method are depicted in Table 3.
Figure 14 and 
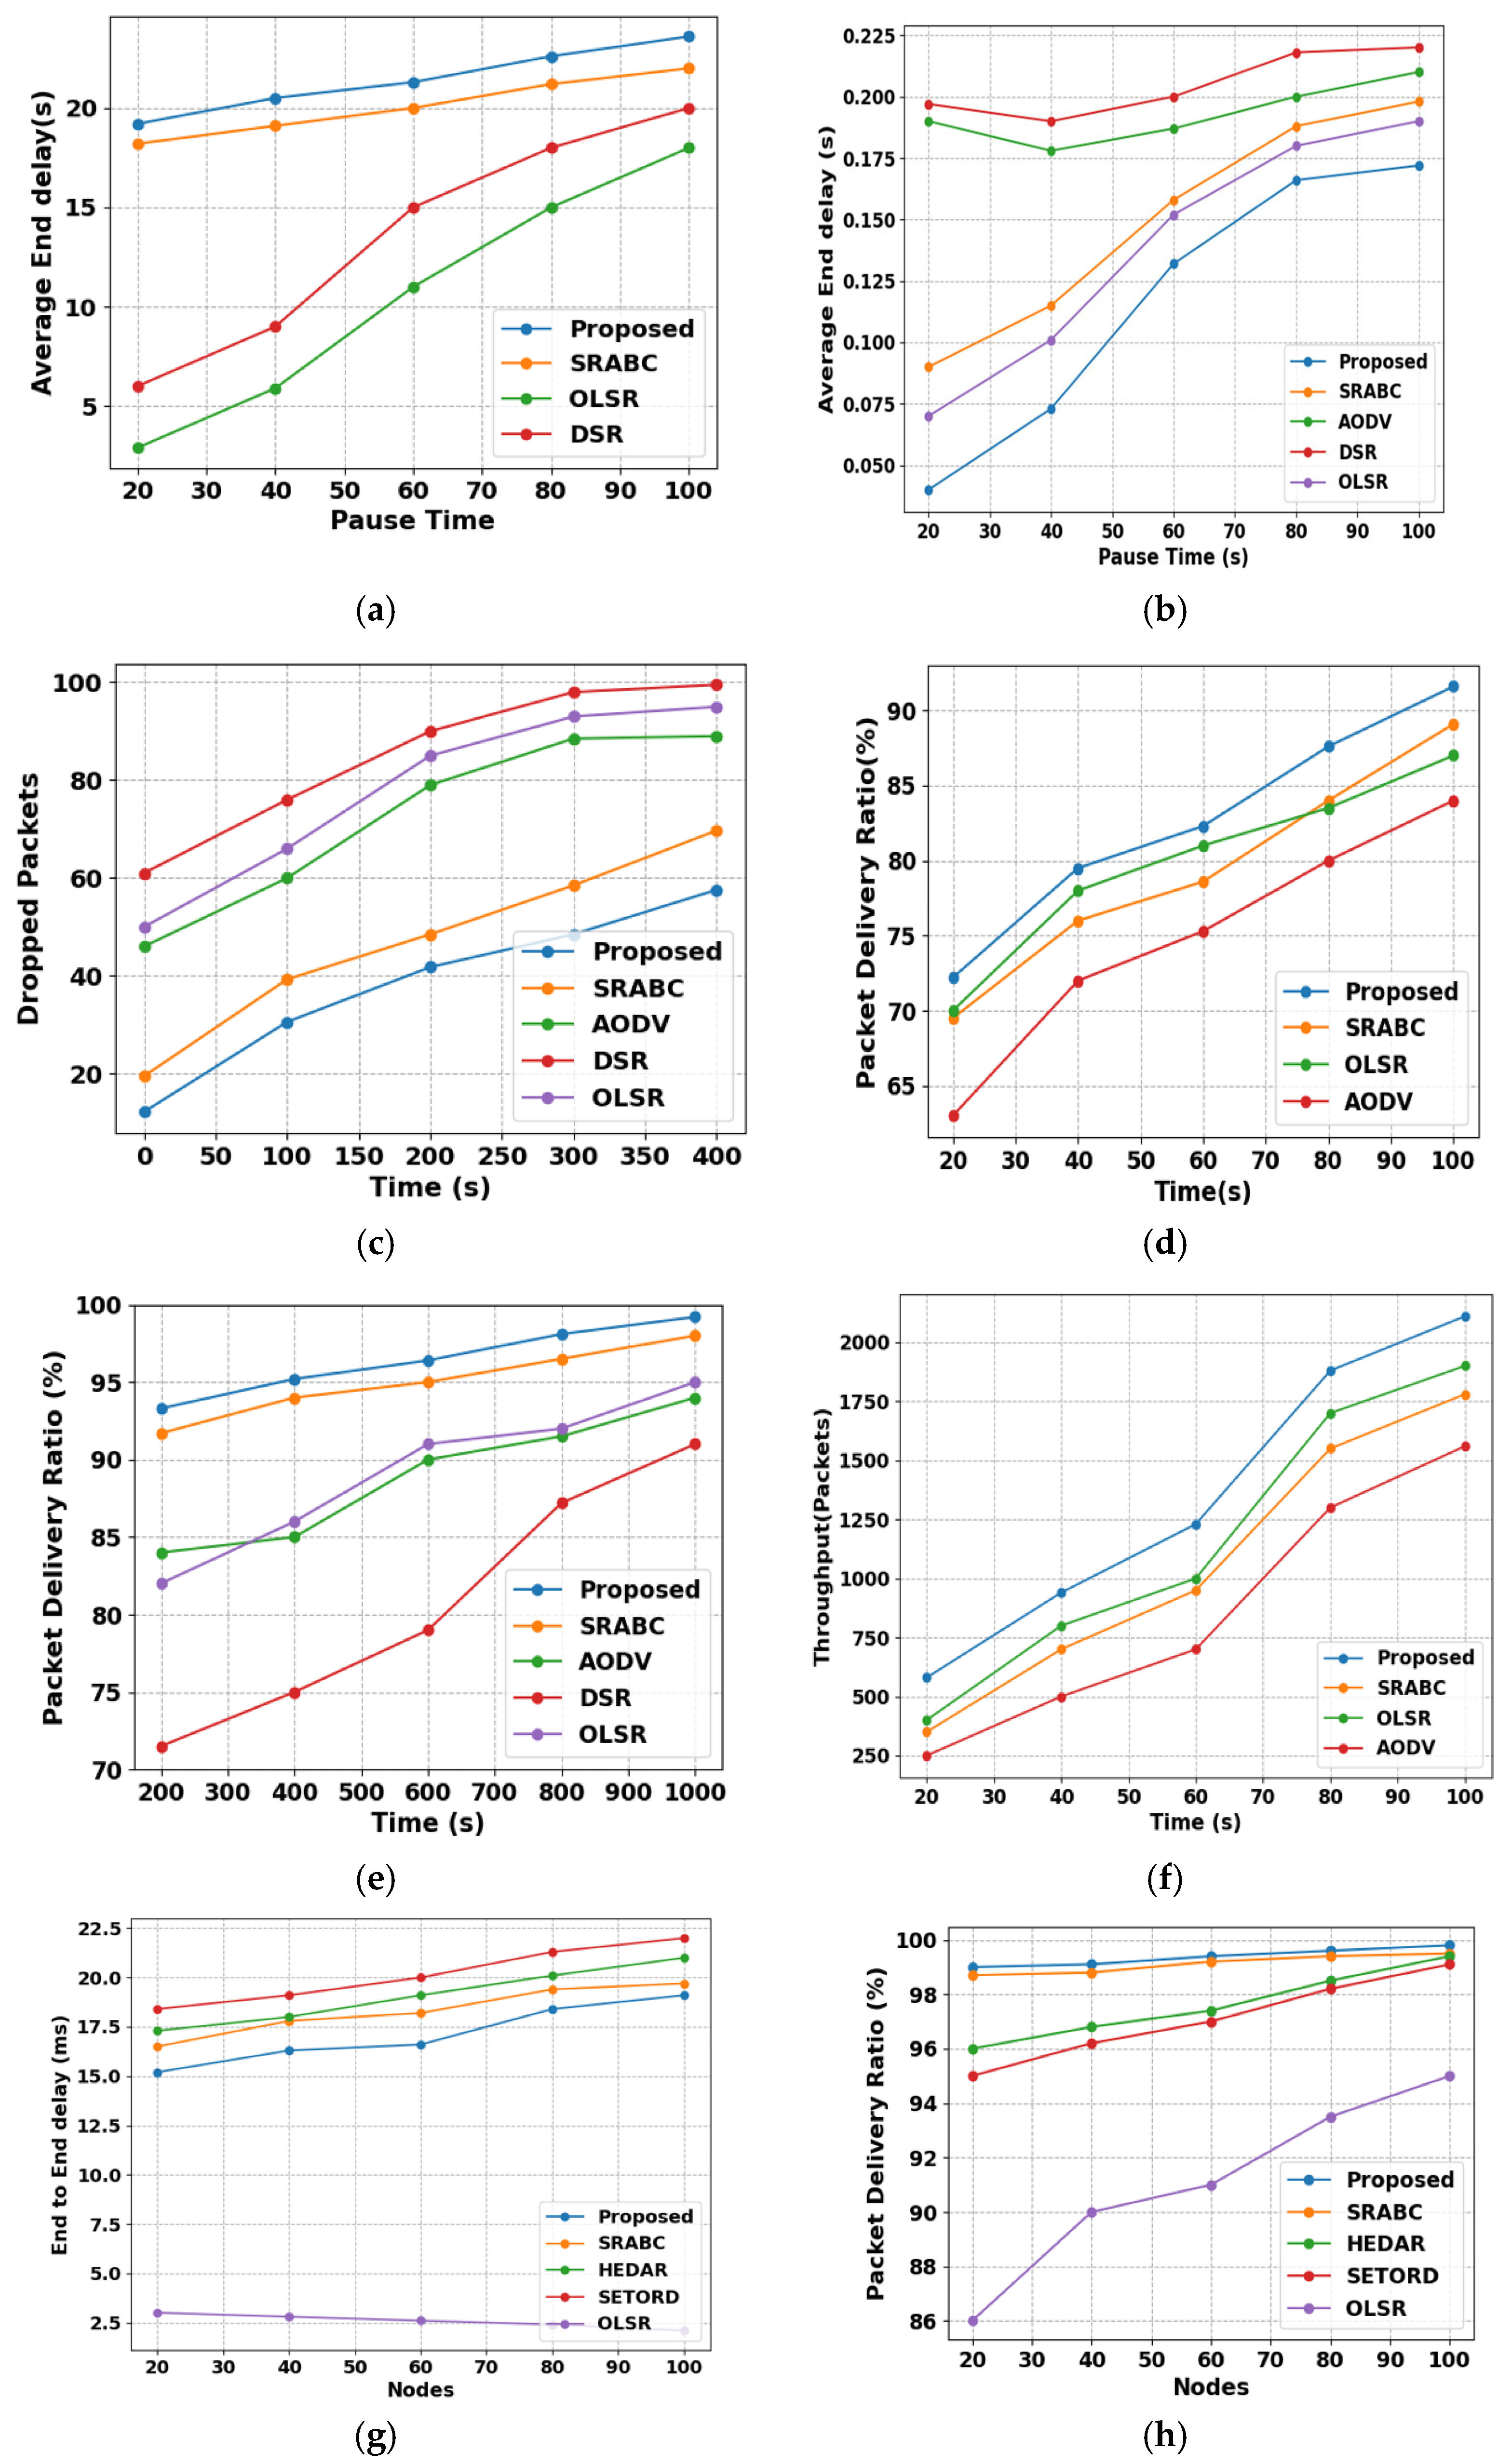
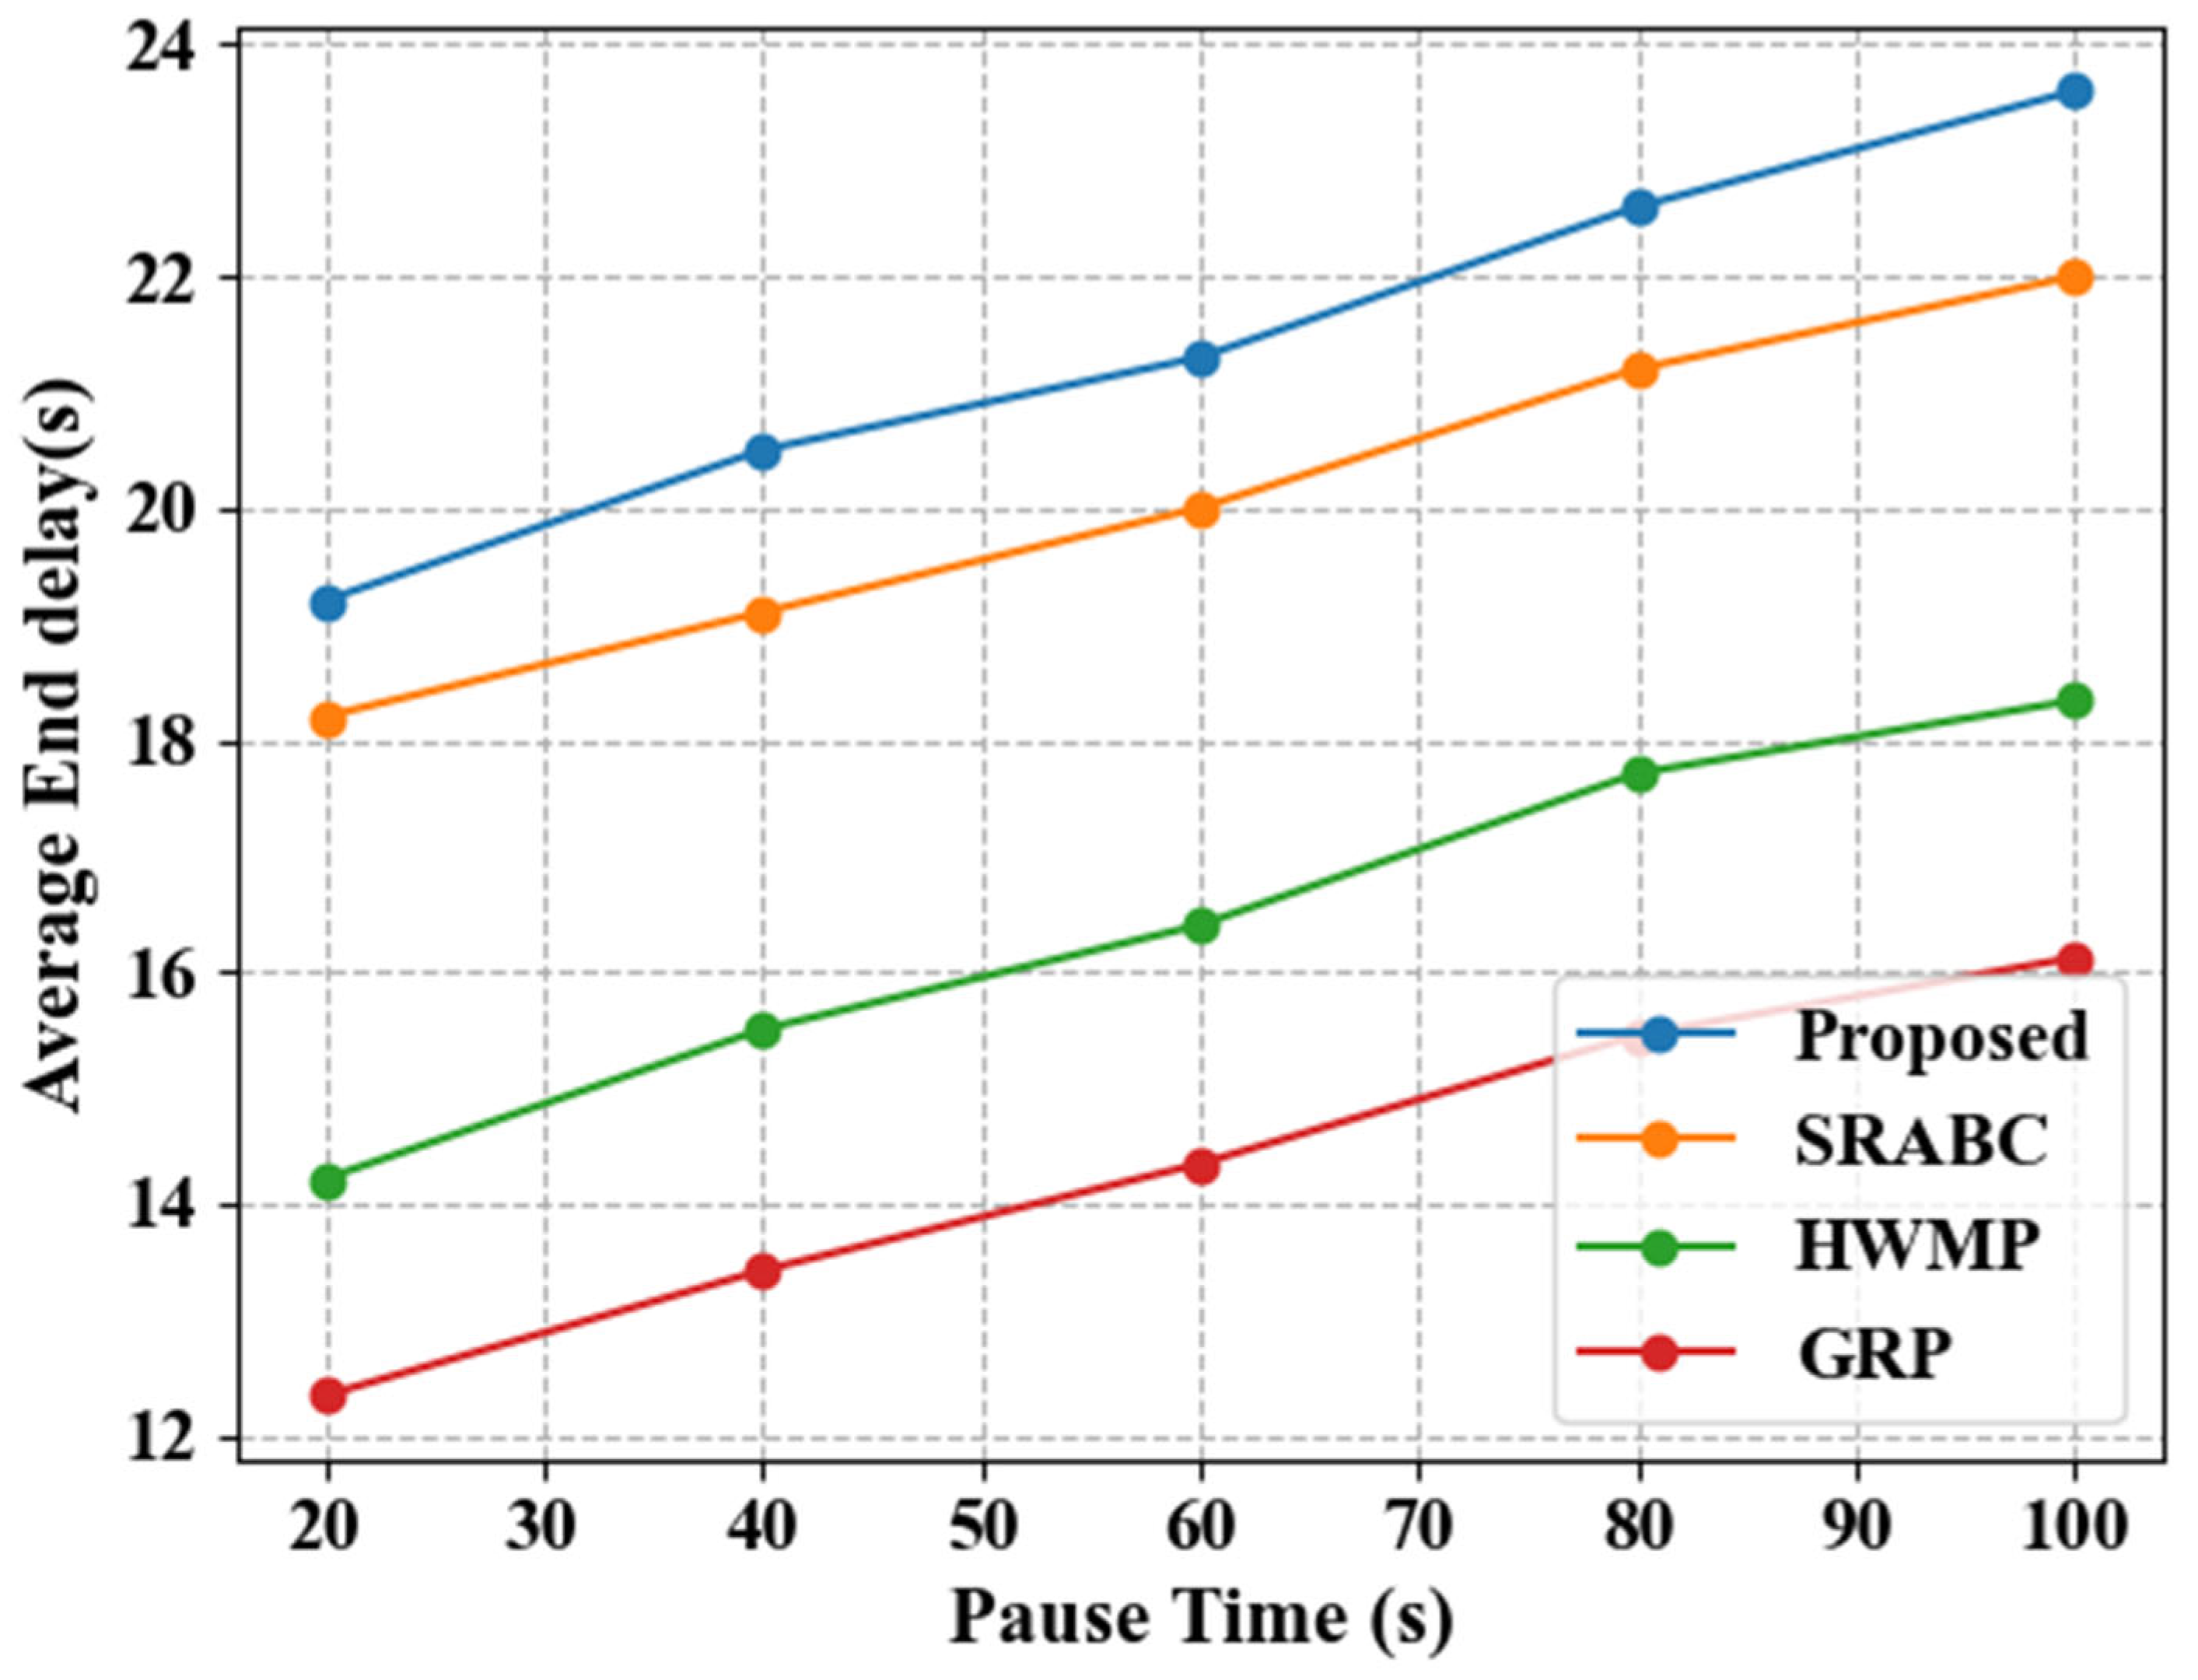
Table 4 show the average end delay(s) of the proposed methods by varying pause time. This graph demonstrates that the average end delay rises with the pause time over a period of time. For a pause time of 20, the proposed model achieves an average end delay of 19.2 s, compared to the average end delays of the existing SRABC, GRP, and HWMP methods, which are 18.2, 14.21, and 12.34 s, respectively. For a pause time of 40, the proposed model achieves an average end delay of 20.5 s, com-pared to the average end delays of the existing methods of 19.1, 15.5, and 13.4 s, re-spectively. For a pause time of 60, the proposed model achieves an average end delay of 21.3 s, compared to the average end delays of existing methods of 20, 16.4, and 14.34 s, respectively. For a pause time of 80, the proposed model achieves an average end delay of 22.6 s, compared to the average end delays of the existing methods of 21.2, 17.71, and 15.45 s, respectively. For a pause time of 100, the proposed model achieves an av-erage end delay of 23.6 s, compared to the average end delays of the existing methods of 22, 18.34, and 16.12 s, respectively. As a result, the graph indicates that the recom-mended technique performs better in terms of end-to-end delay.
Figure 15 and 
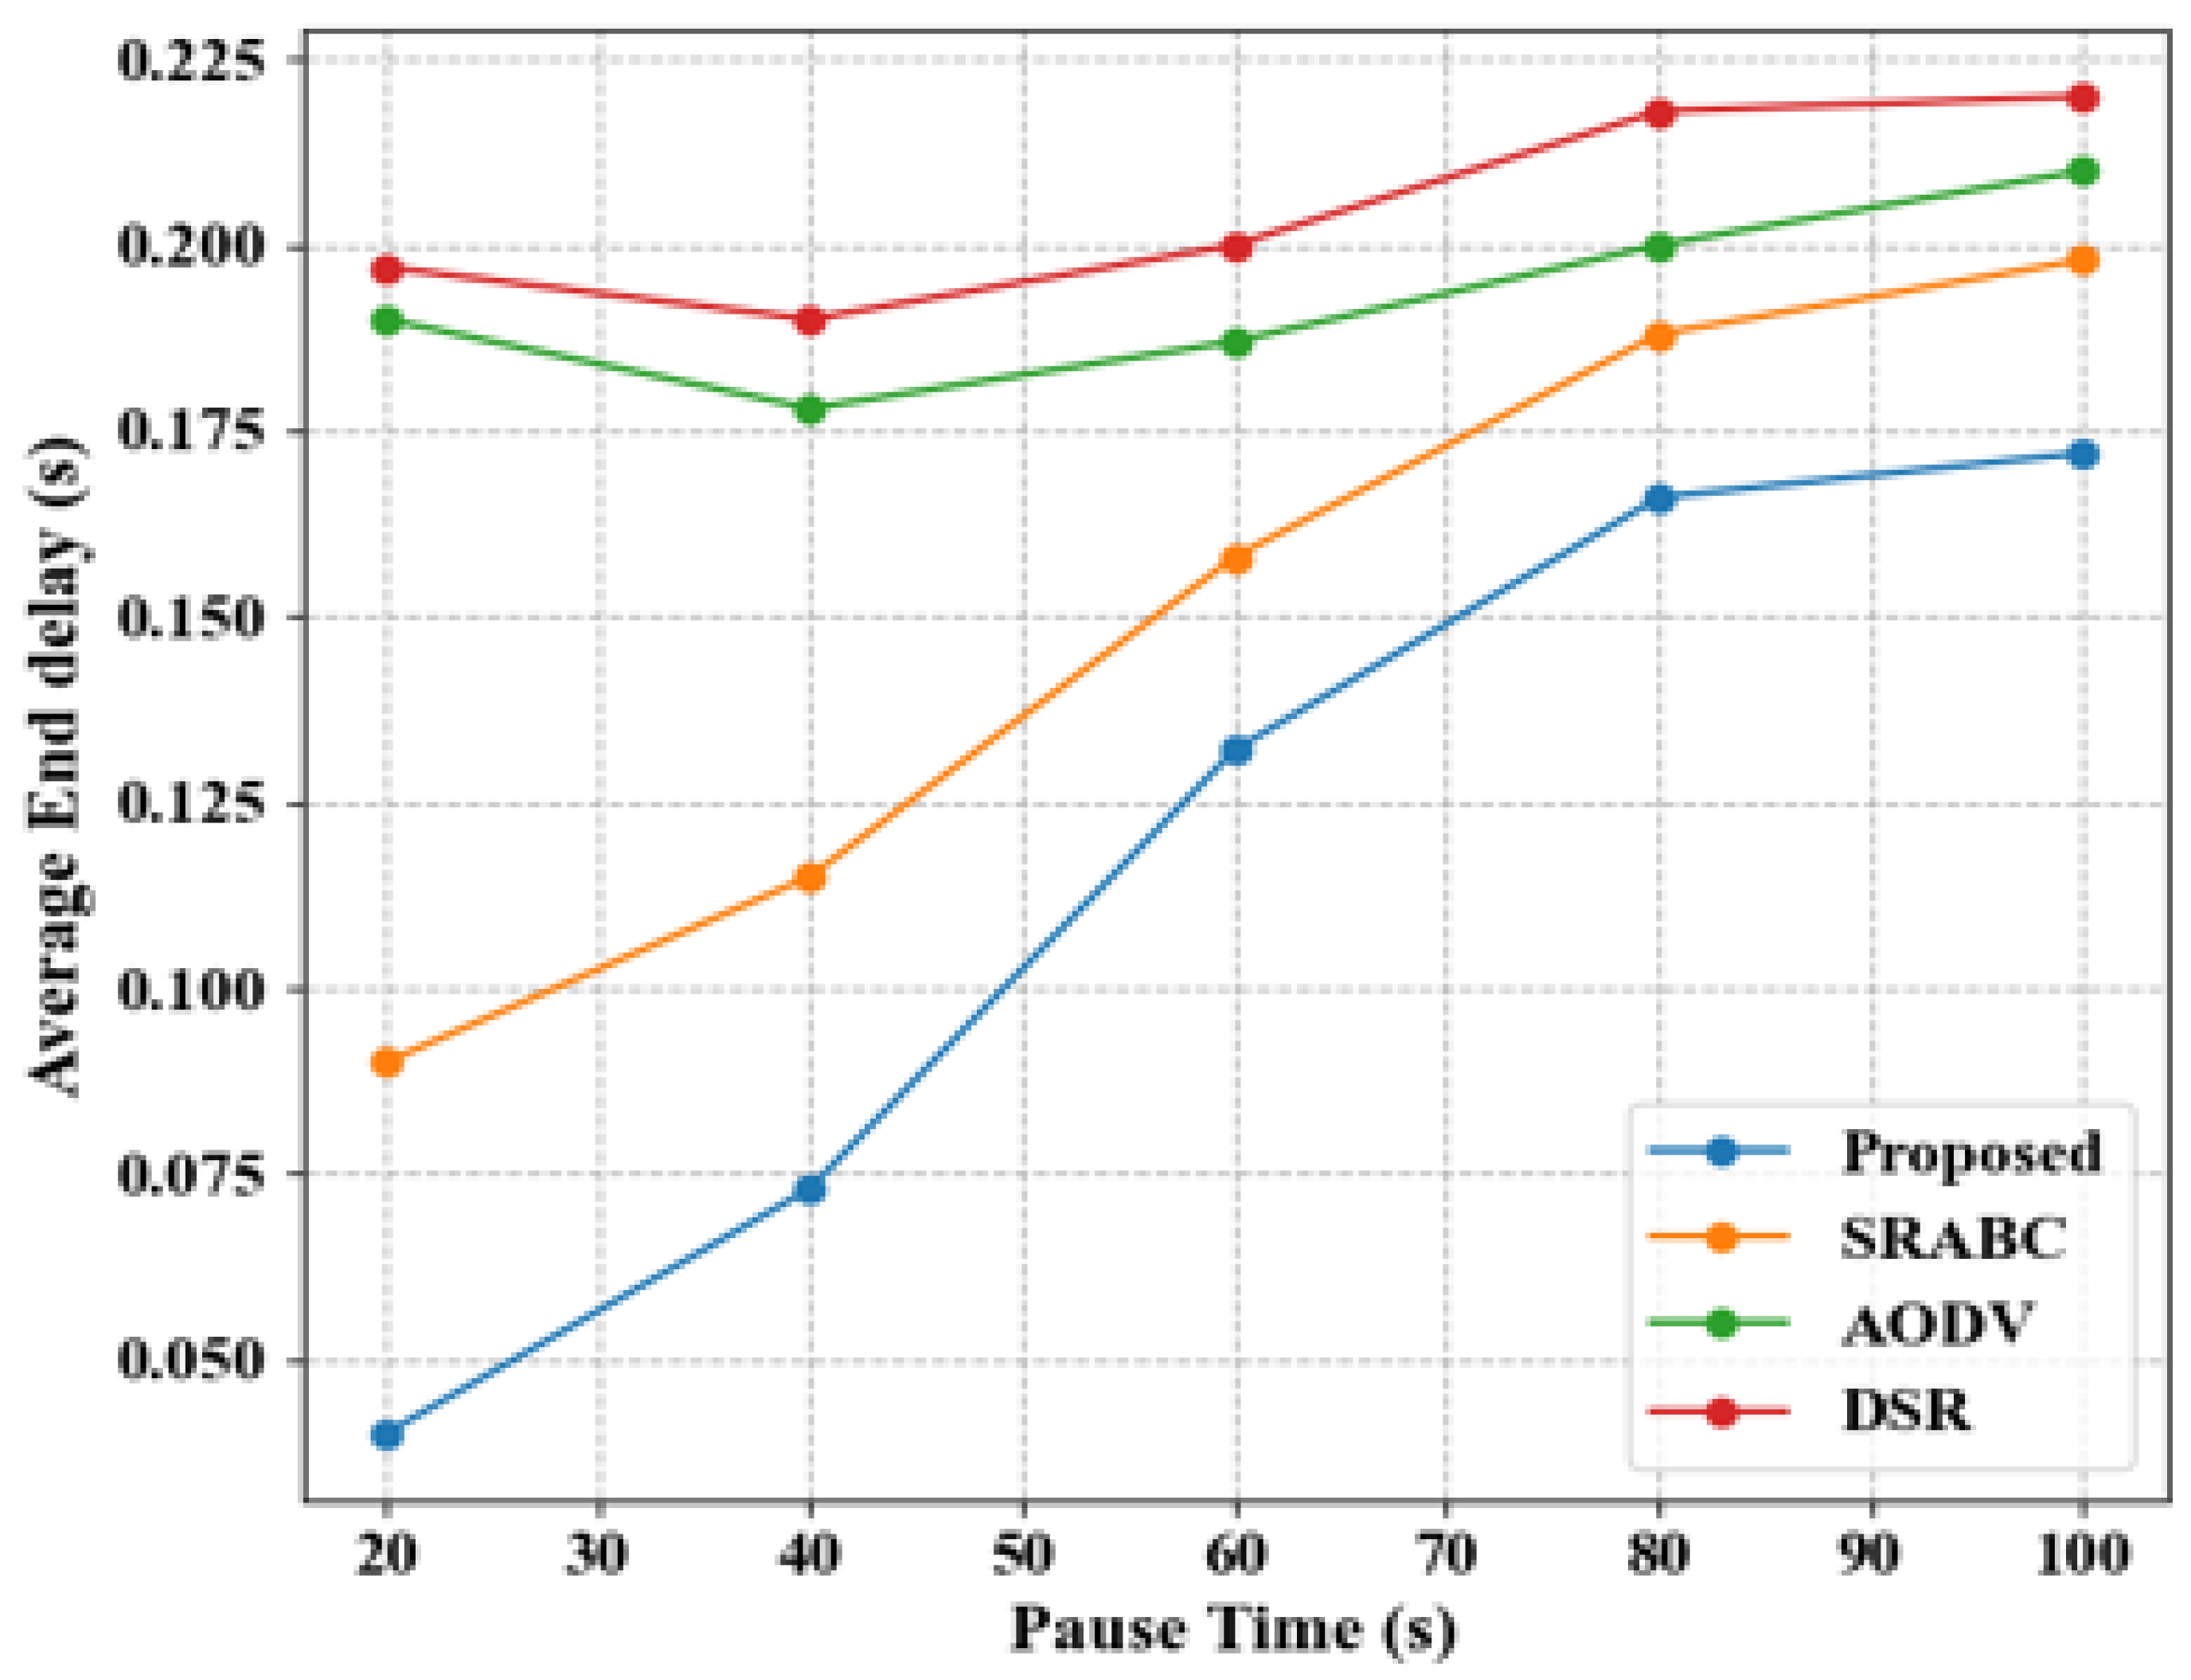
Table 4 show the average end delay(s) of the proposed and existing methods by varying pause time. For a pause time of 20, the proposed model achieves an average end delay of 0.04 s, compared to the average end delays of the existing SRABC, AODV, and DSR methods, which are 0.09, 0.19, and 0.197 s, respectively. For a pause time of 40, the proposed model achieves in 0.073 s, compared to the existing methods, which are 0.115, 0.178, and 0.19 s, respectively. For a pause time of 60, the proposed model achieves an average end delay of 0.132 s, compared to the average end delays of the existing methods, of 0.158, 0.187, and 0.2 s, respectively. For a pause time of 60, the proposed model achieves an average end delay of 0.132 s, compared to the average end delays of the existing methods, which are 0.158, 0.187, and 0.2 s, respec-tively. For a pause time of 80, the proposed model achieves an average end delay of 0.166 s, compared to the average end delays of the existing methods, which are 0.188, 0.2, and 0.218 s, respectively. For a pause time of 100, the proposed model achieves an average end delay of 0.172 s, compared to the average end delays of the existing methods, which are 0.198, 0.21, and 0.22 s, respectively. As a result, the graph indicates that the recommended technique performs better in terms of end-to-end delay. For a pause time of 100, the existing SRABC method pause time is 0.198 s, which the pro-posed method improves to 0.074 s. For a pause time of 100, the existing AODV method pause time is 0.21 s, which the proposed method improves to 0.038 s. For a pause time of 100, the existing DSR method pause time is 0.22 s, which the proposed method improves to 0.048 s.
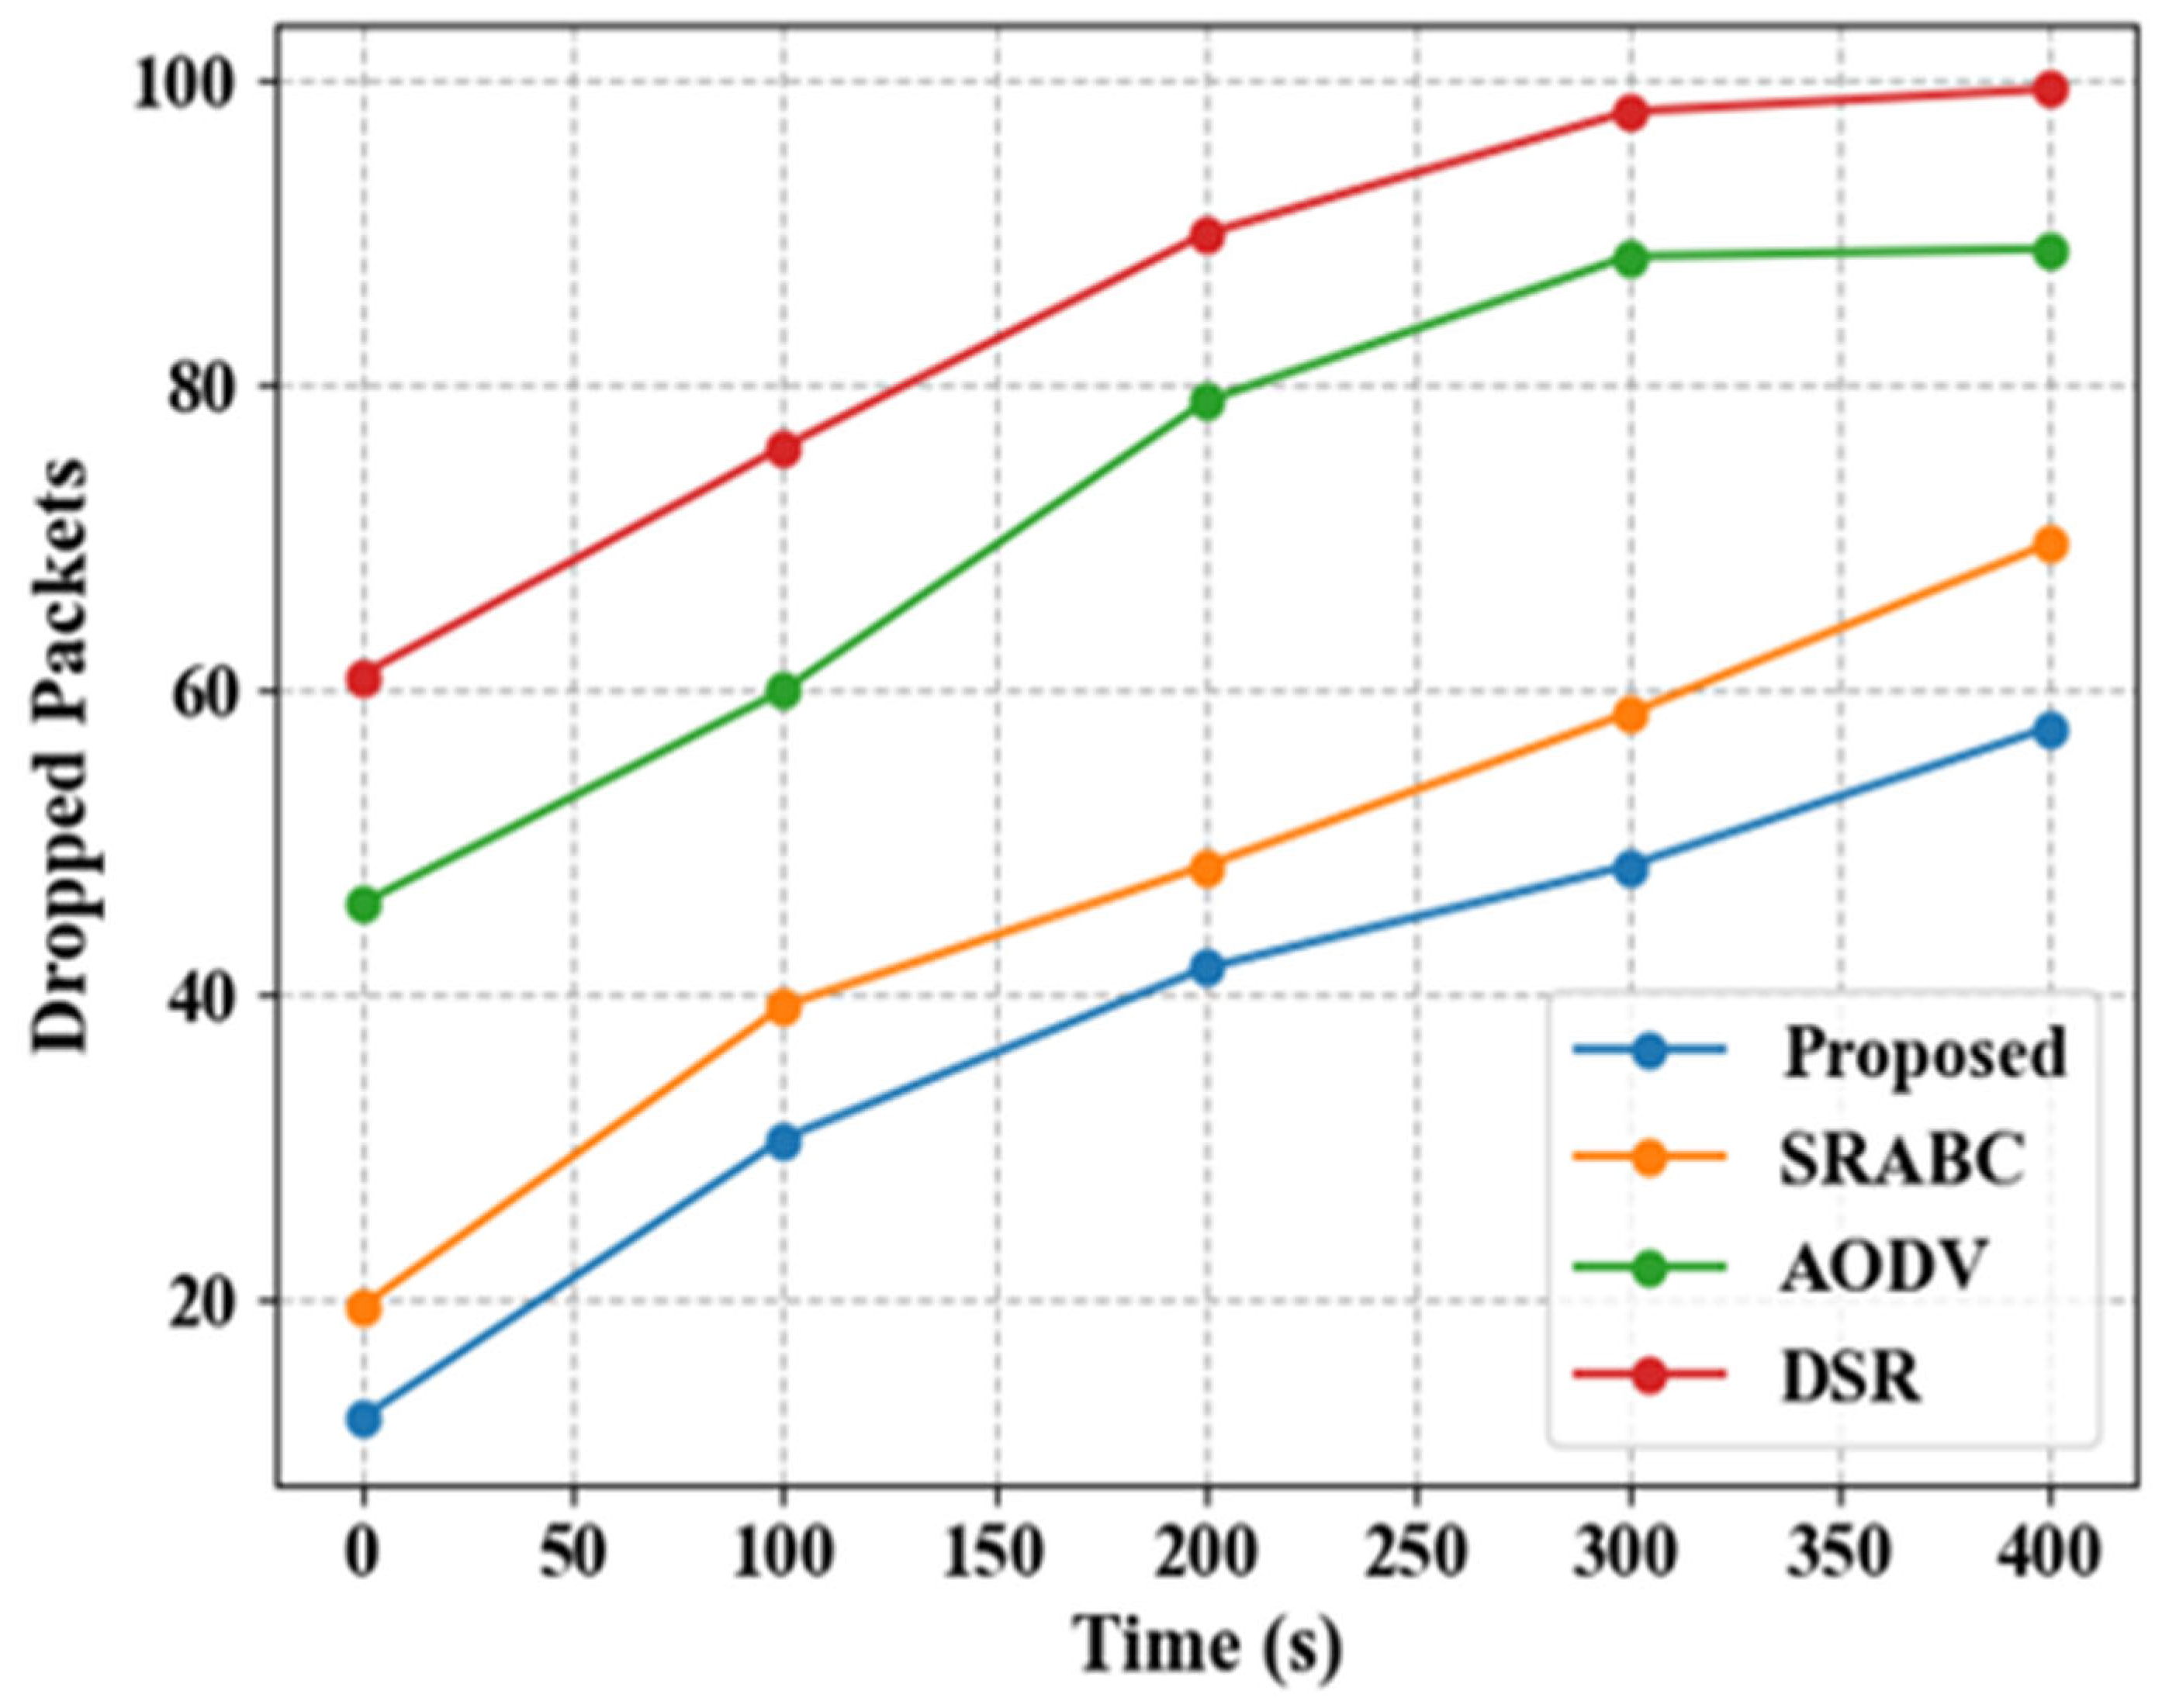
Figure 16 and Table 4 show the dropped packets of proposed and existing methods by varying time (s). At a time of 0 s, the proposed method achieves a number of dropped packets of 12.2, whereas for the existing SRABC, AODV, and DSR methods, the numbers of dropped packets are 19.5, 46 and 61, respectively. At a time of 100 s, the proposed method has 30.6 dropped packets, whereas the existing methods have 39.3, 60 and 76, respectively. At a time of 200 s, the proposed method has 41.8 dropped packets, whereas the existing methods have 48.5, 79, and 90, respectively. At a time of 300 s, the proposed method has 48.5 dropped packets, whereas the existing methods have 58.5, 88.5, and 98, respectively. At a time of 400 s, the proposed method has 57.6 dropped packets, whereas the existing methods have 69.7, 89, and 99.5, respectively. So, the generated graph proves that the recommended strategy achieves a very low packet drop ratio. At a time of 400 seconds, the existing SRABC method time is 69.7 s, which the proposed method improves to 12.1 s. At a time of 400 seconds, the existing AODV method time is 89 s, which the proposed method improves to 31.7 s. At a time of 400 seconds, the existing DSR method time is 99.5 s, which the proposed method improves to 41.9 s.
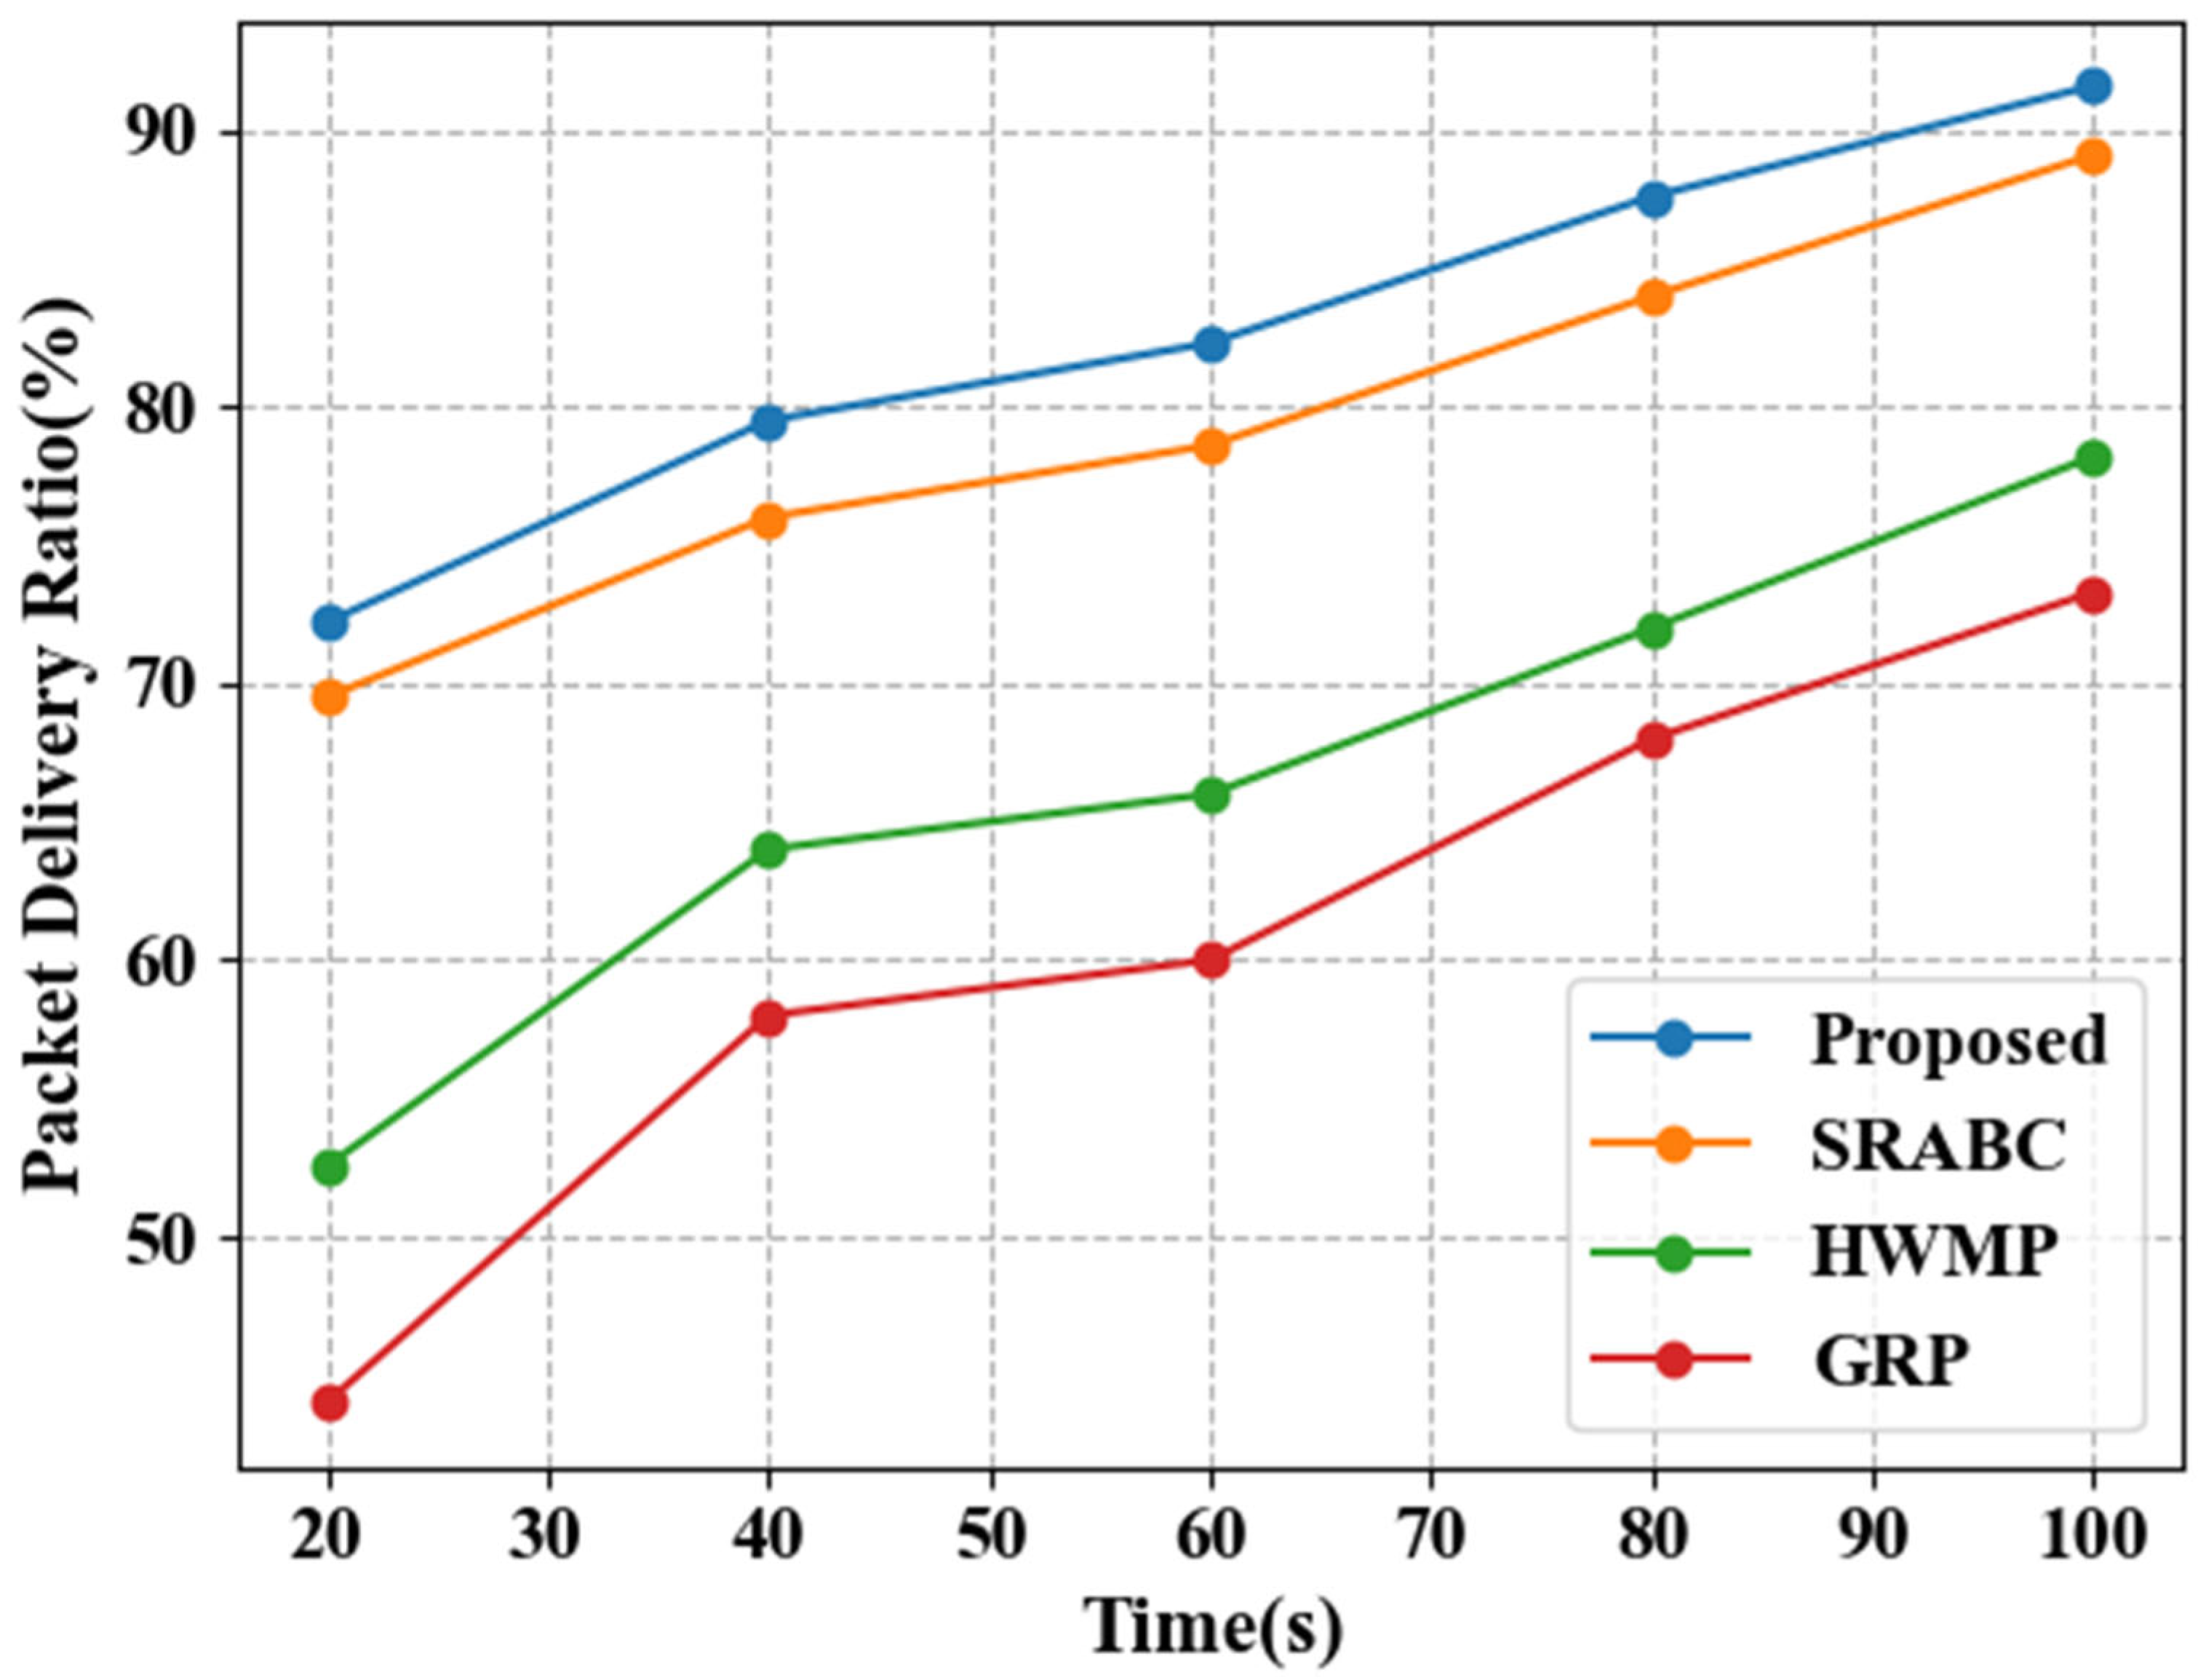
Figure 17 and Table 4 show the packet-delivery ratio (%) of the proposed methods by varying time. At a time of 20 seconds, the packet-delivery ratio of the proposed method is 72.2%, whereas the packet-delivery ratios of the existing SRABC and HWMP methods are 69.5% and 52.54%, respectively. At a time of 40 seconds, the pack-et-delivery ratio for the proposed method is 79.5%, whereas for the existing methods, it is 76%, 64%, and 58%, respectively. At a time of 60, the packet-delivery ratio for the proposed method is 82.3%, whereas for the existing methods, it is 78.6%, 66%, and 60%, respectively. At a time of 80 seconds, the packet-delivery ratio for the proposed method is 87.6%, whereas for the existing methods, it is 84%, 72%, and 68%, respectively. At a time of 100, the packet-delivery ratio for the proposed method is 91.6%, whereas for the existing methods, it is 89.1%, 78.2%, and 73.3%, respectively. The graph clearly in-dicates that the proposed method’s packet-delivery ratio obtains the maximum value compared to the prior techniques.
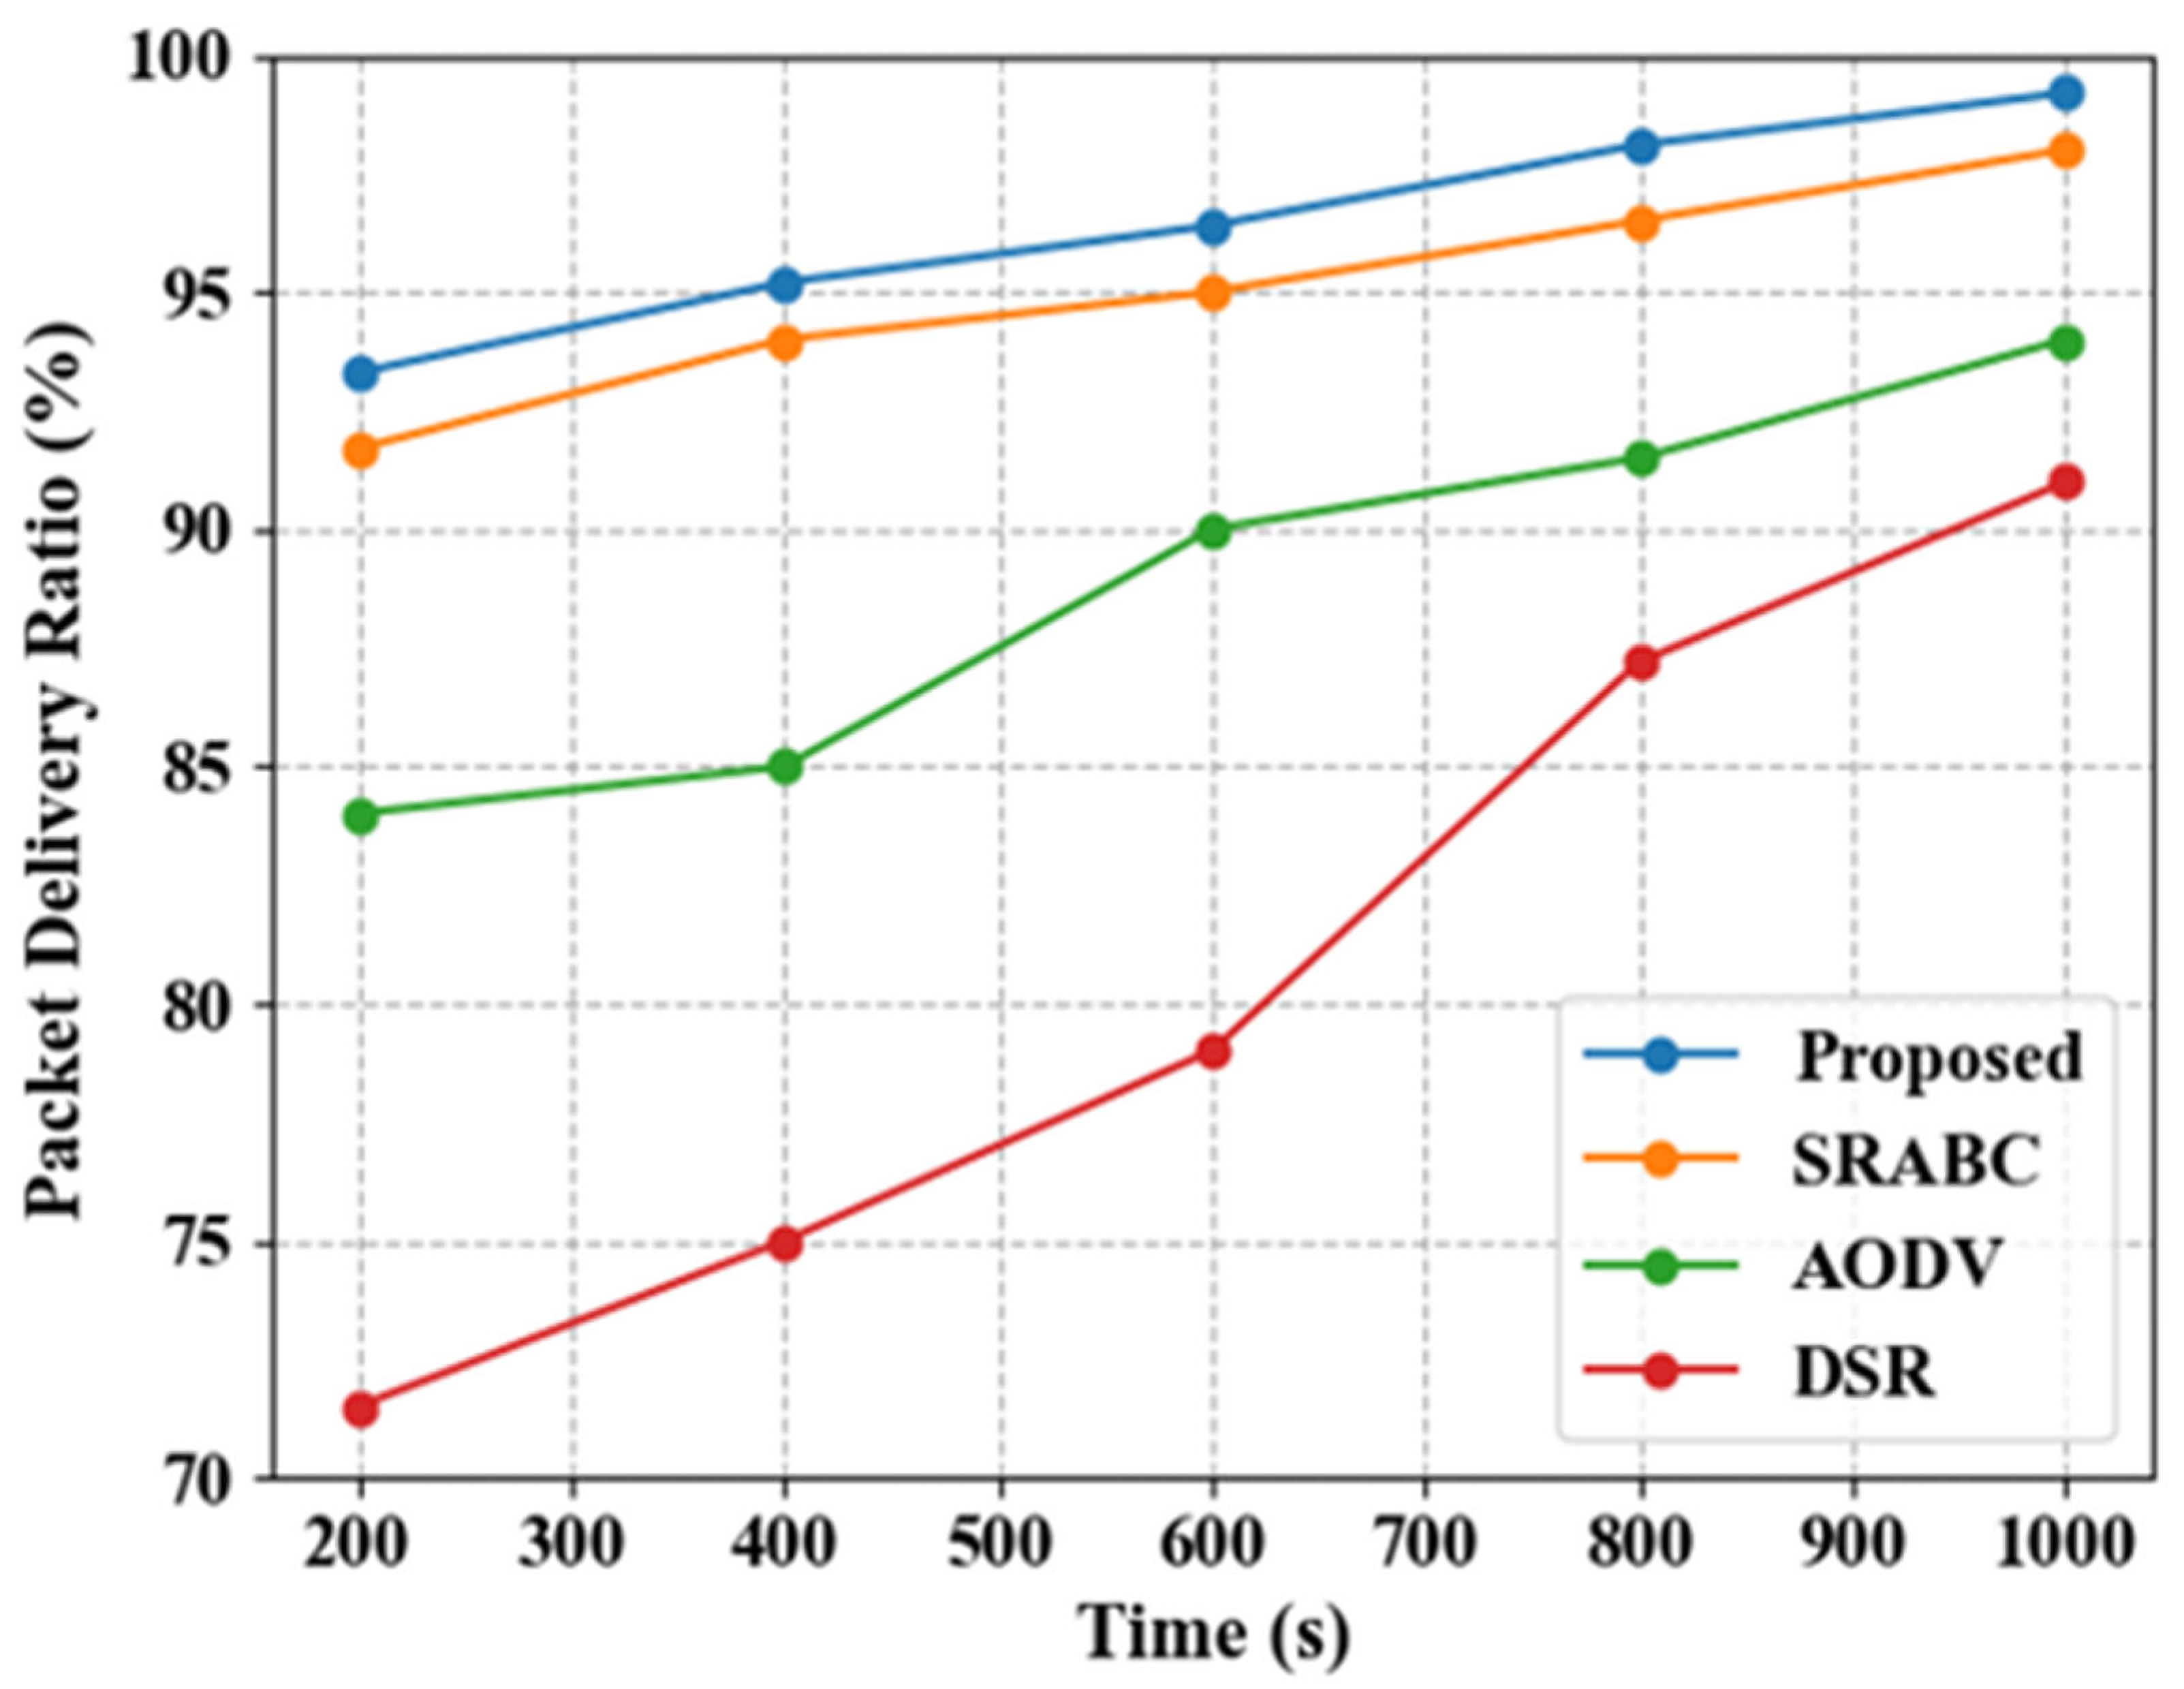
 Figure 18 and Table 4 show the packet-delivery ratio (%) of the proposed and existing methods by varying time. At a time of 200 seconds, the packet-delivery ratio of the proposed method is 93.3%, whereas for the existing SRABC, AODV, and DSR methods, it is 91.7, 84 and 71.5%, respectively. At a time of 400 seconds, the packet-delivery ratio for the proposed method is 95.2%, whereas for the existing methods, it is 94%, 85%, and 75%, respectively. At a time of 600 seconds, the packet-delivery ratio for the proposed method is 96.4%, whereas for the existing methods, it is 95%, 90%, and 79%, respectively. At a time of 800 seconds, the pack-et-delivery ratio for the proposed method is 98.1%, whereas for the existing methods, it is 96.5%, 91.5%, and 87.2%, respectively. At a time of 1000 seconds, the packet-delivery ratio for the proposed method is 99.1%, whereas for the existing methods, it is 98%, 94%, and 91%, respectively. So, the proposed method delivers a higher packet ratio when compared to other approaches. At a time of 1000 seconds, the existing SRABC method time is 98 s, which the proposed method improves to 1.2 s. At a time of 1000 seconds, the existing AODV method time is 94 s, which the proposed method improves to 5.2 s. At a time of 1000 seconds, the existing DSR method time is 91 s, which the proposed method improves to 8.2 s.
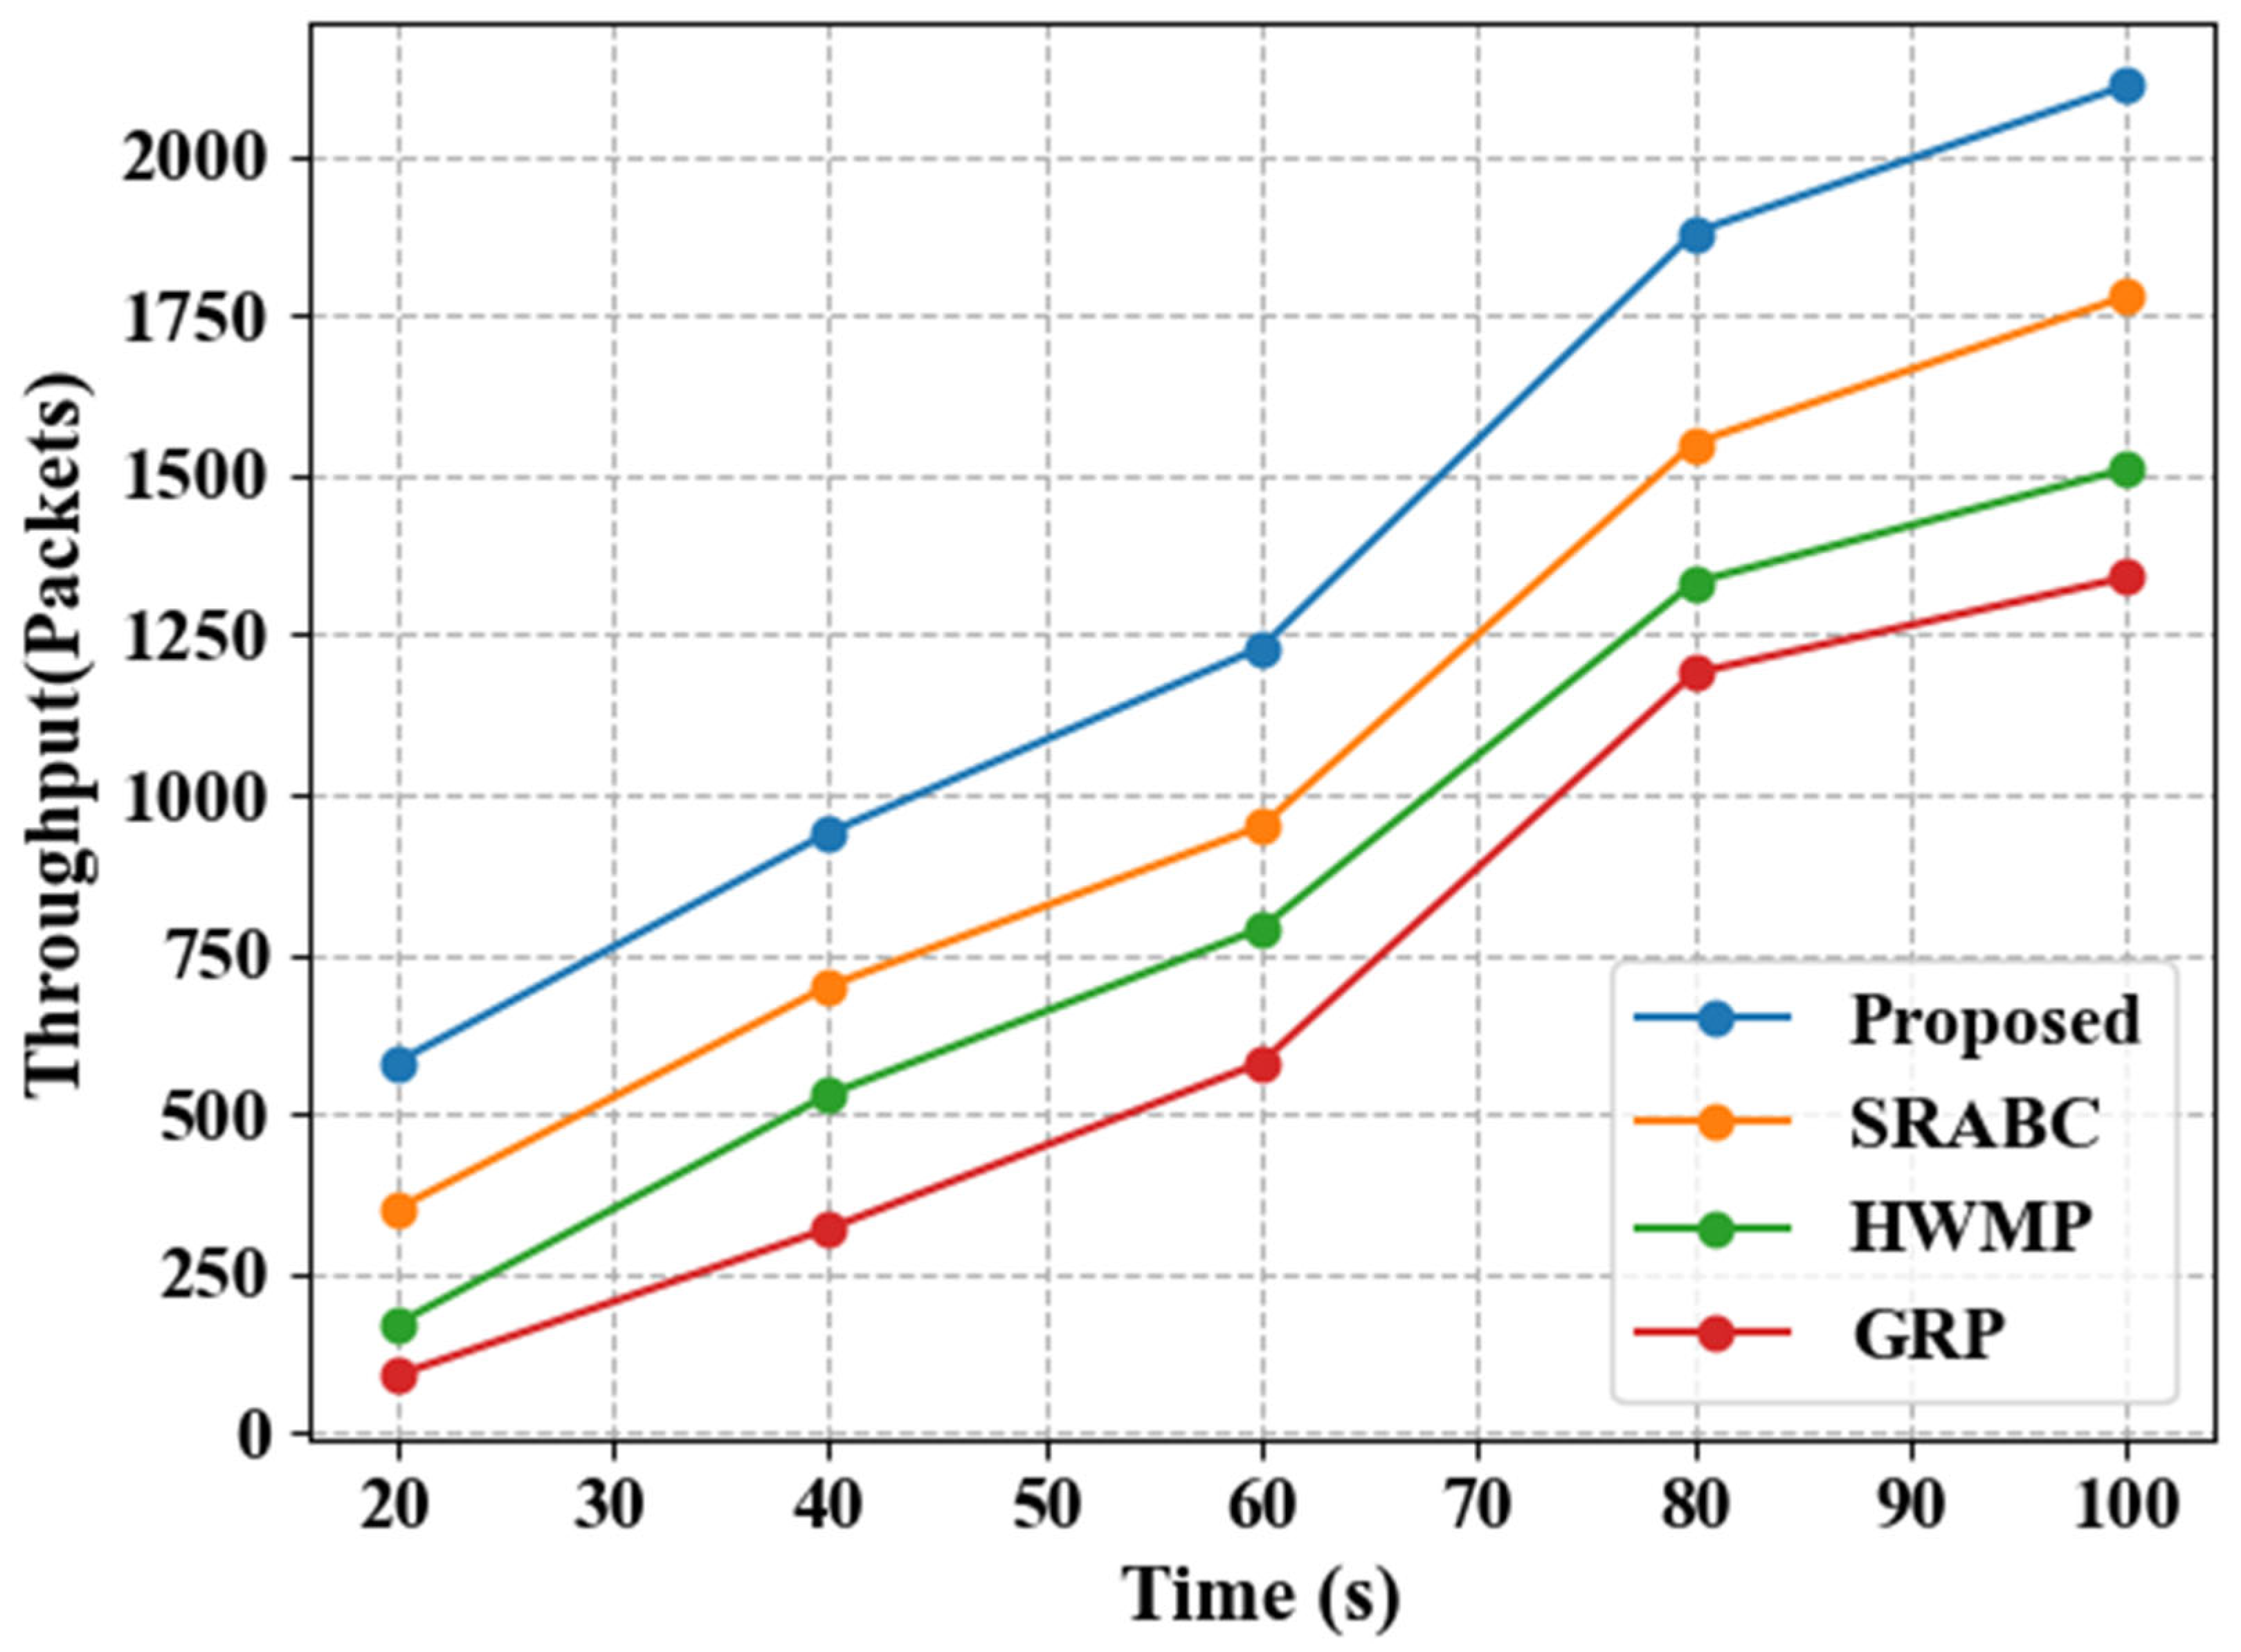
Figure 19 and Table 4 show the throughput (packets) of the proposed methods by varying time. At a time of 20 seconds, the proposed model achieves a throughput of 580, compared to the throughputs of the existing SRABC, HWMP, and GRP methods which are 350, 170, and 90, respectively. At a time of 40 seconds, the proposed model achieves a throughput of 940, compared to the throughputs of the existing methods, which are 700, 530, and 320, respectively. At a time of 60 seconds, the proposed model achieves a throughput of 1230, compared to the throughputs of the existing methods, which are 950, 790, and 580, respectively. At a time of 80 seconds, the proposed model achieves a throughput of 1880, compared to the throughputs of the existing methods, which are 1550, 1332, and 1190, respectively. At a time of 100 seconds, the proposed model achieves a throughput of 2110, compared to the throughputs of the existing methods, which are 1780, 1510, and 1340, respectively. So, the proposed method is to enable higher actual throughput while reducing total expenses for overhead.
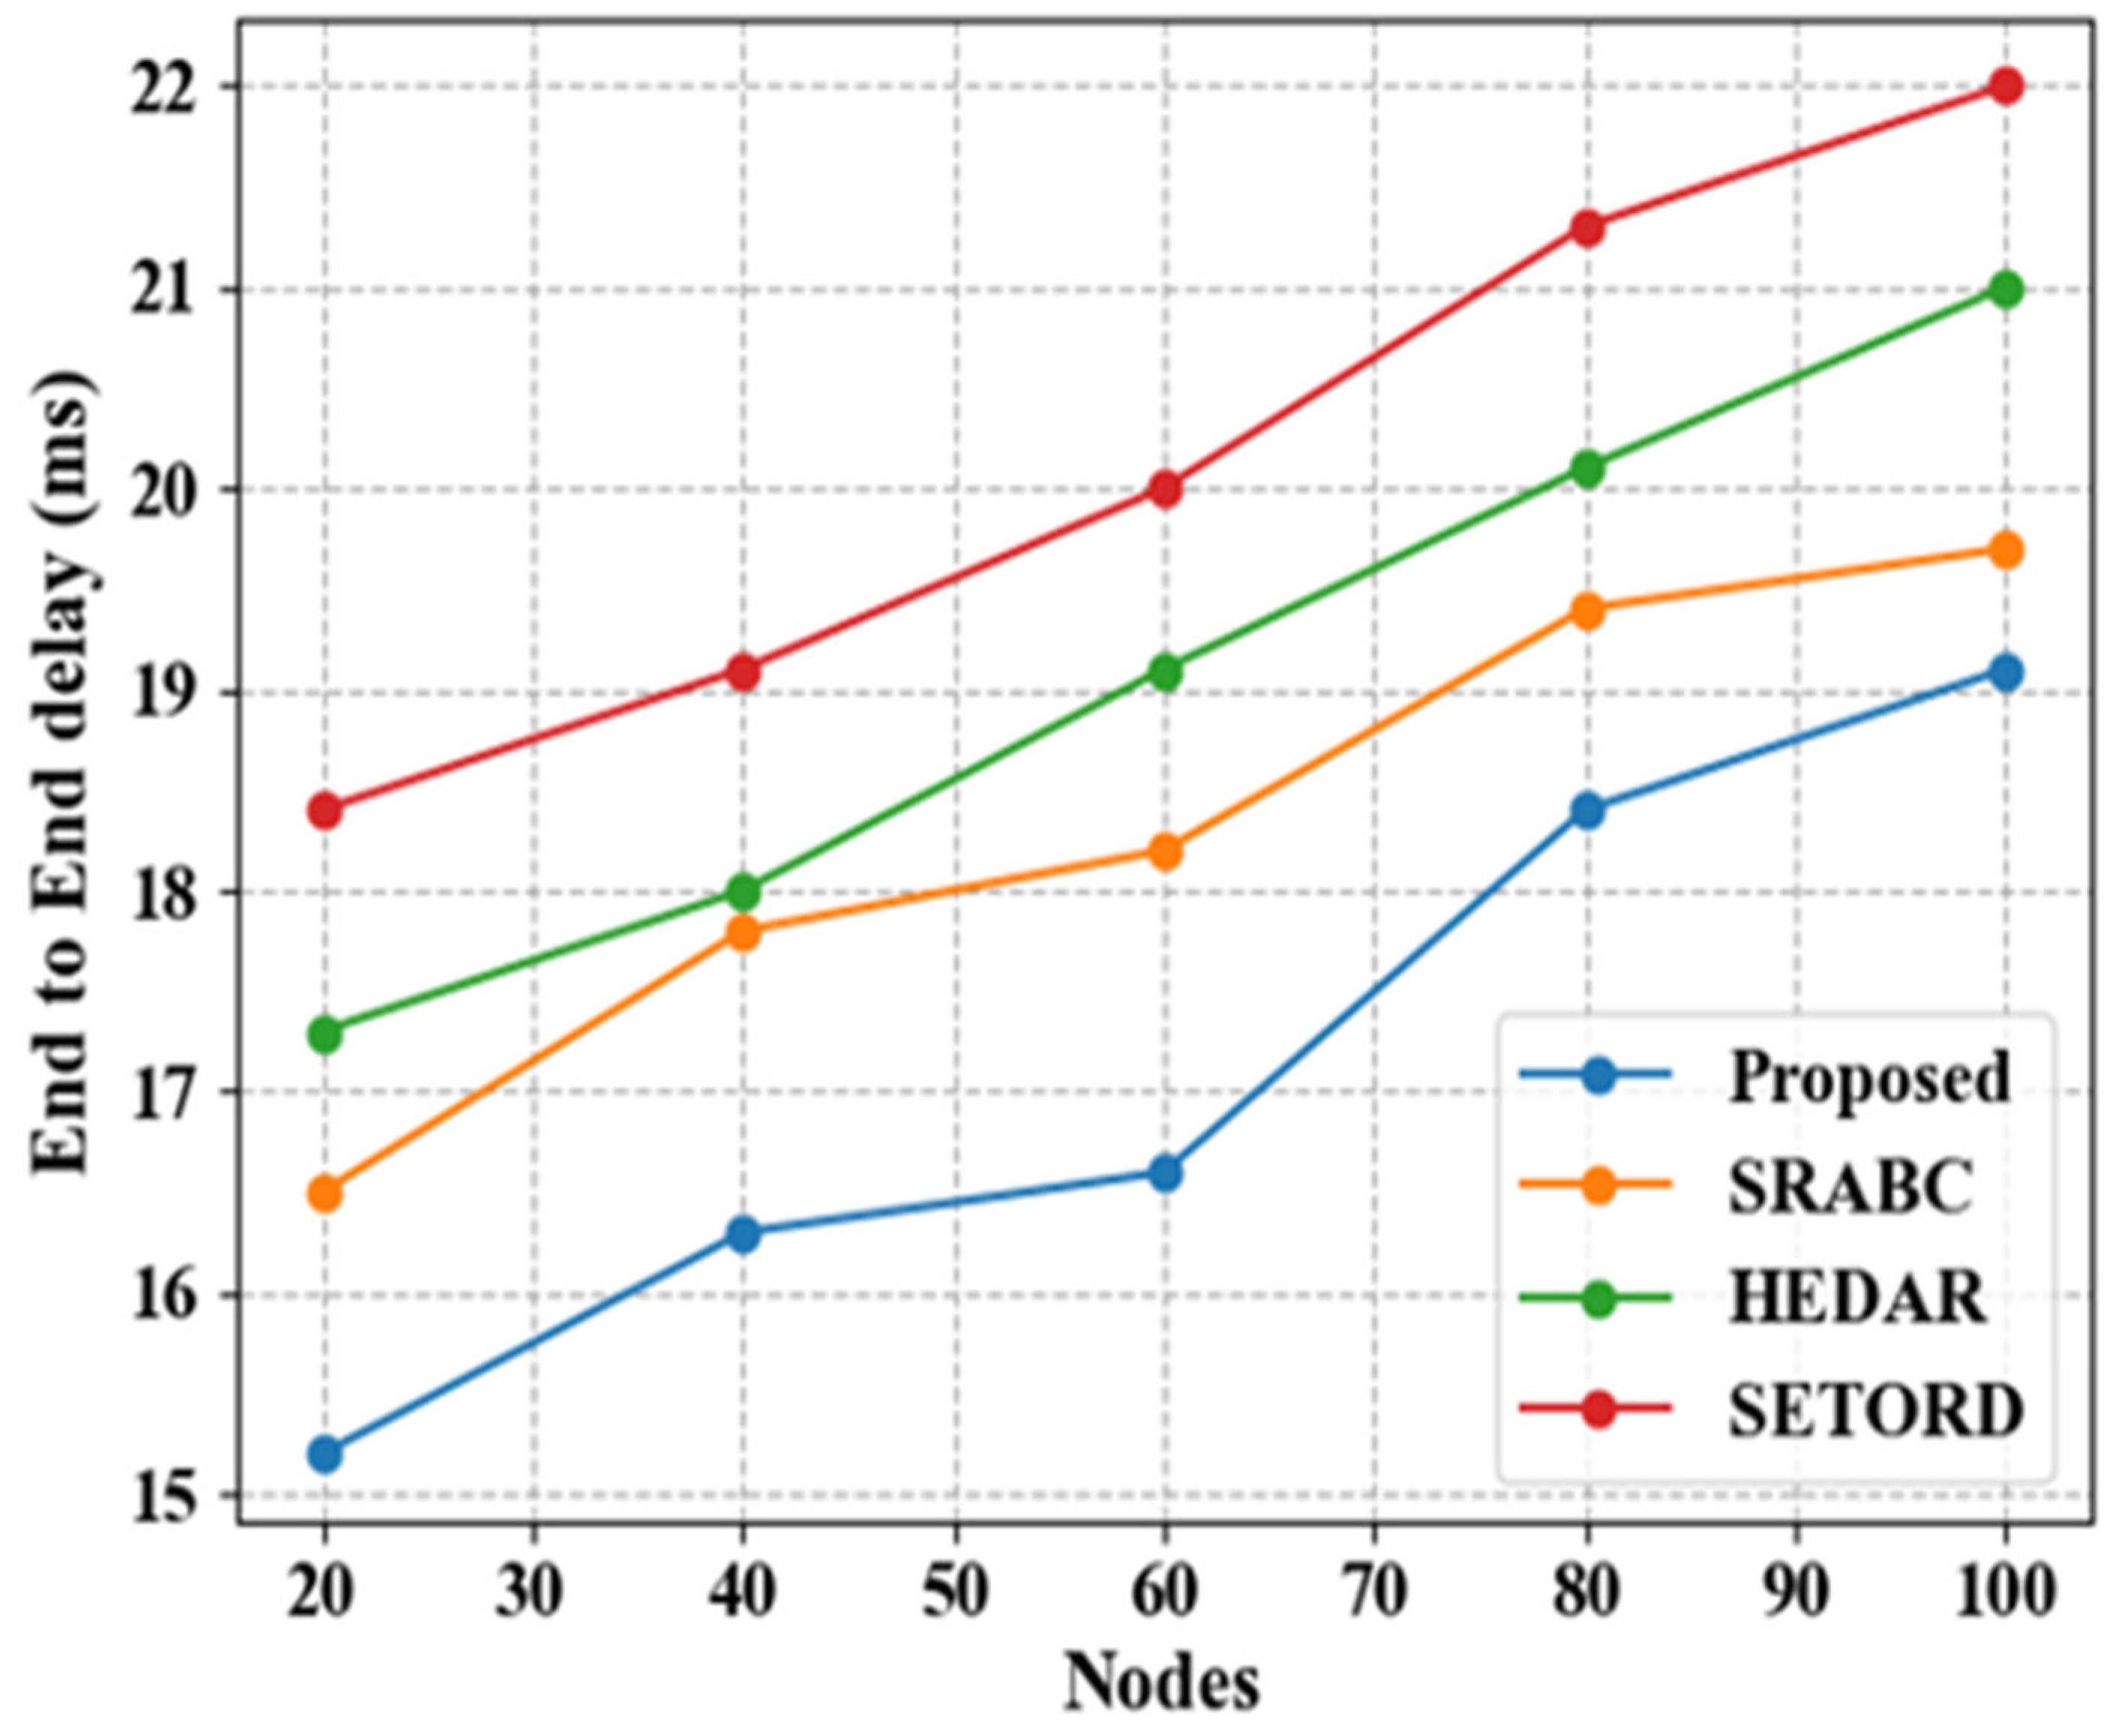
Figure 20 shows the end-to-end delay of the proposed and existing methods by varying nodes. For Node 20, the proposed method achieves an end-to-end delay of 15.2, compared to the end-to-end delays of the existing SRABC, HEDAR, and SETORD methods, which are 16.5, 17.3, and 18.4, respectively. For Node 40, the proposed method achieves an end-to end delay of 16.3, compared to the end-to-end delays of the existing methods, which are 17.8, 18, and 19.1, respectively. For Node 60, the proposed method achieves an end-to-end delay of 16.6, compared to the existing methods’ end-to-end delays, which are 18.2, 19.1, and 20, respectively. For Node 80, the proposed method achieves an end-to-end delay of 18.4, compared to the existing methods’ end-to-end delays, which are 19.4, 20.1, and 21.3, respectively. For Node 100, the pro-posed method achieves an end-to-end delay of 19.1, compared to existing methods’ end-to-end delays, which are 19.7, 21 and 22, respectively. The figure demonstrates that, in comparison to the preceding method, the end-to-end delay is insignificant. For Node 100, the existing SRABC method node is 19.7, which the proposed method im-proves to 0.6. For Node 100, the existing HEDAR method node is 21, which the pro-posed method improves to 1.9. For Node 100, the existing SETORD method node is 22, which the proposed method improves to 2.9.
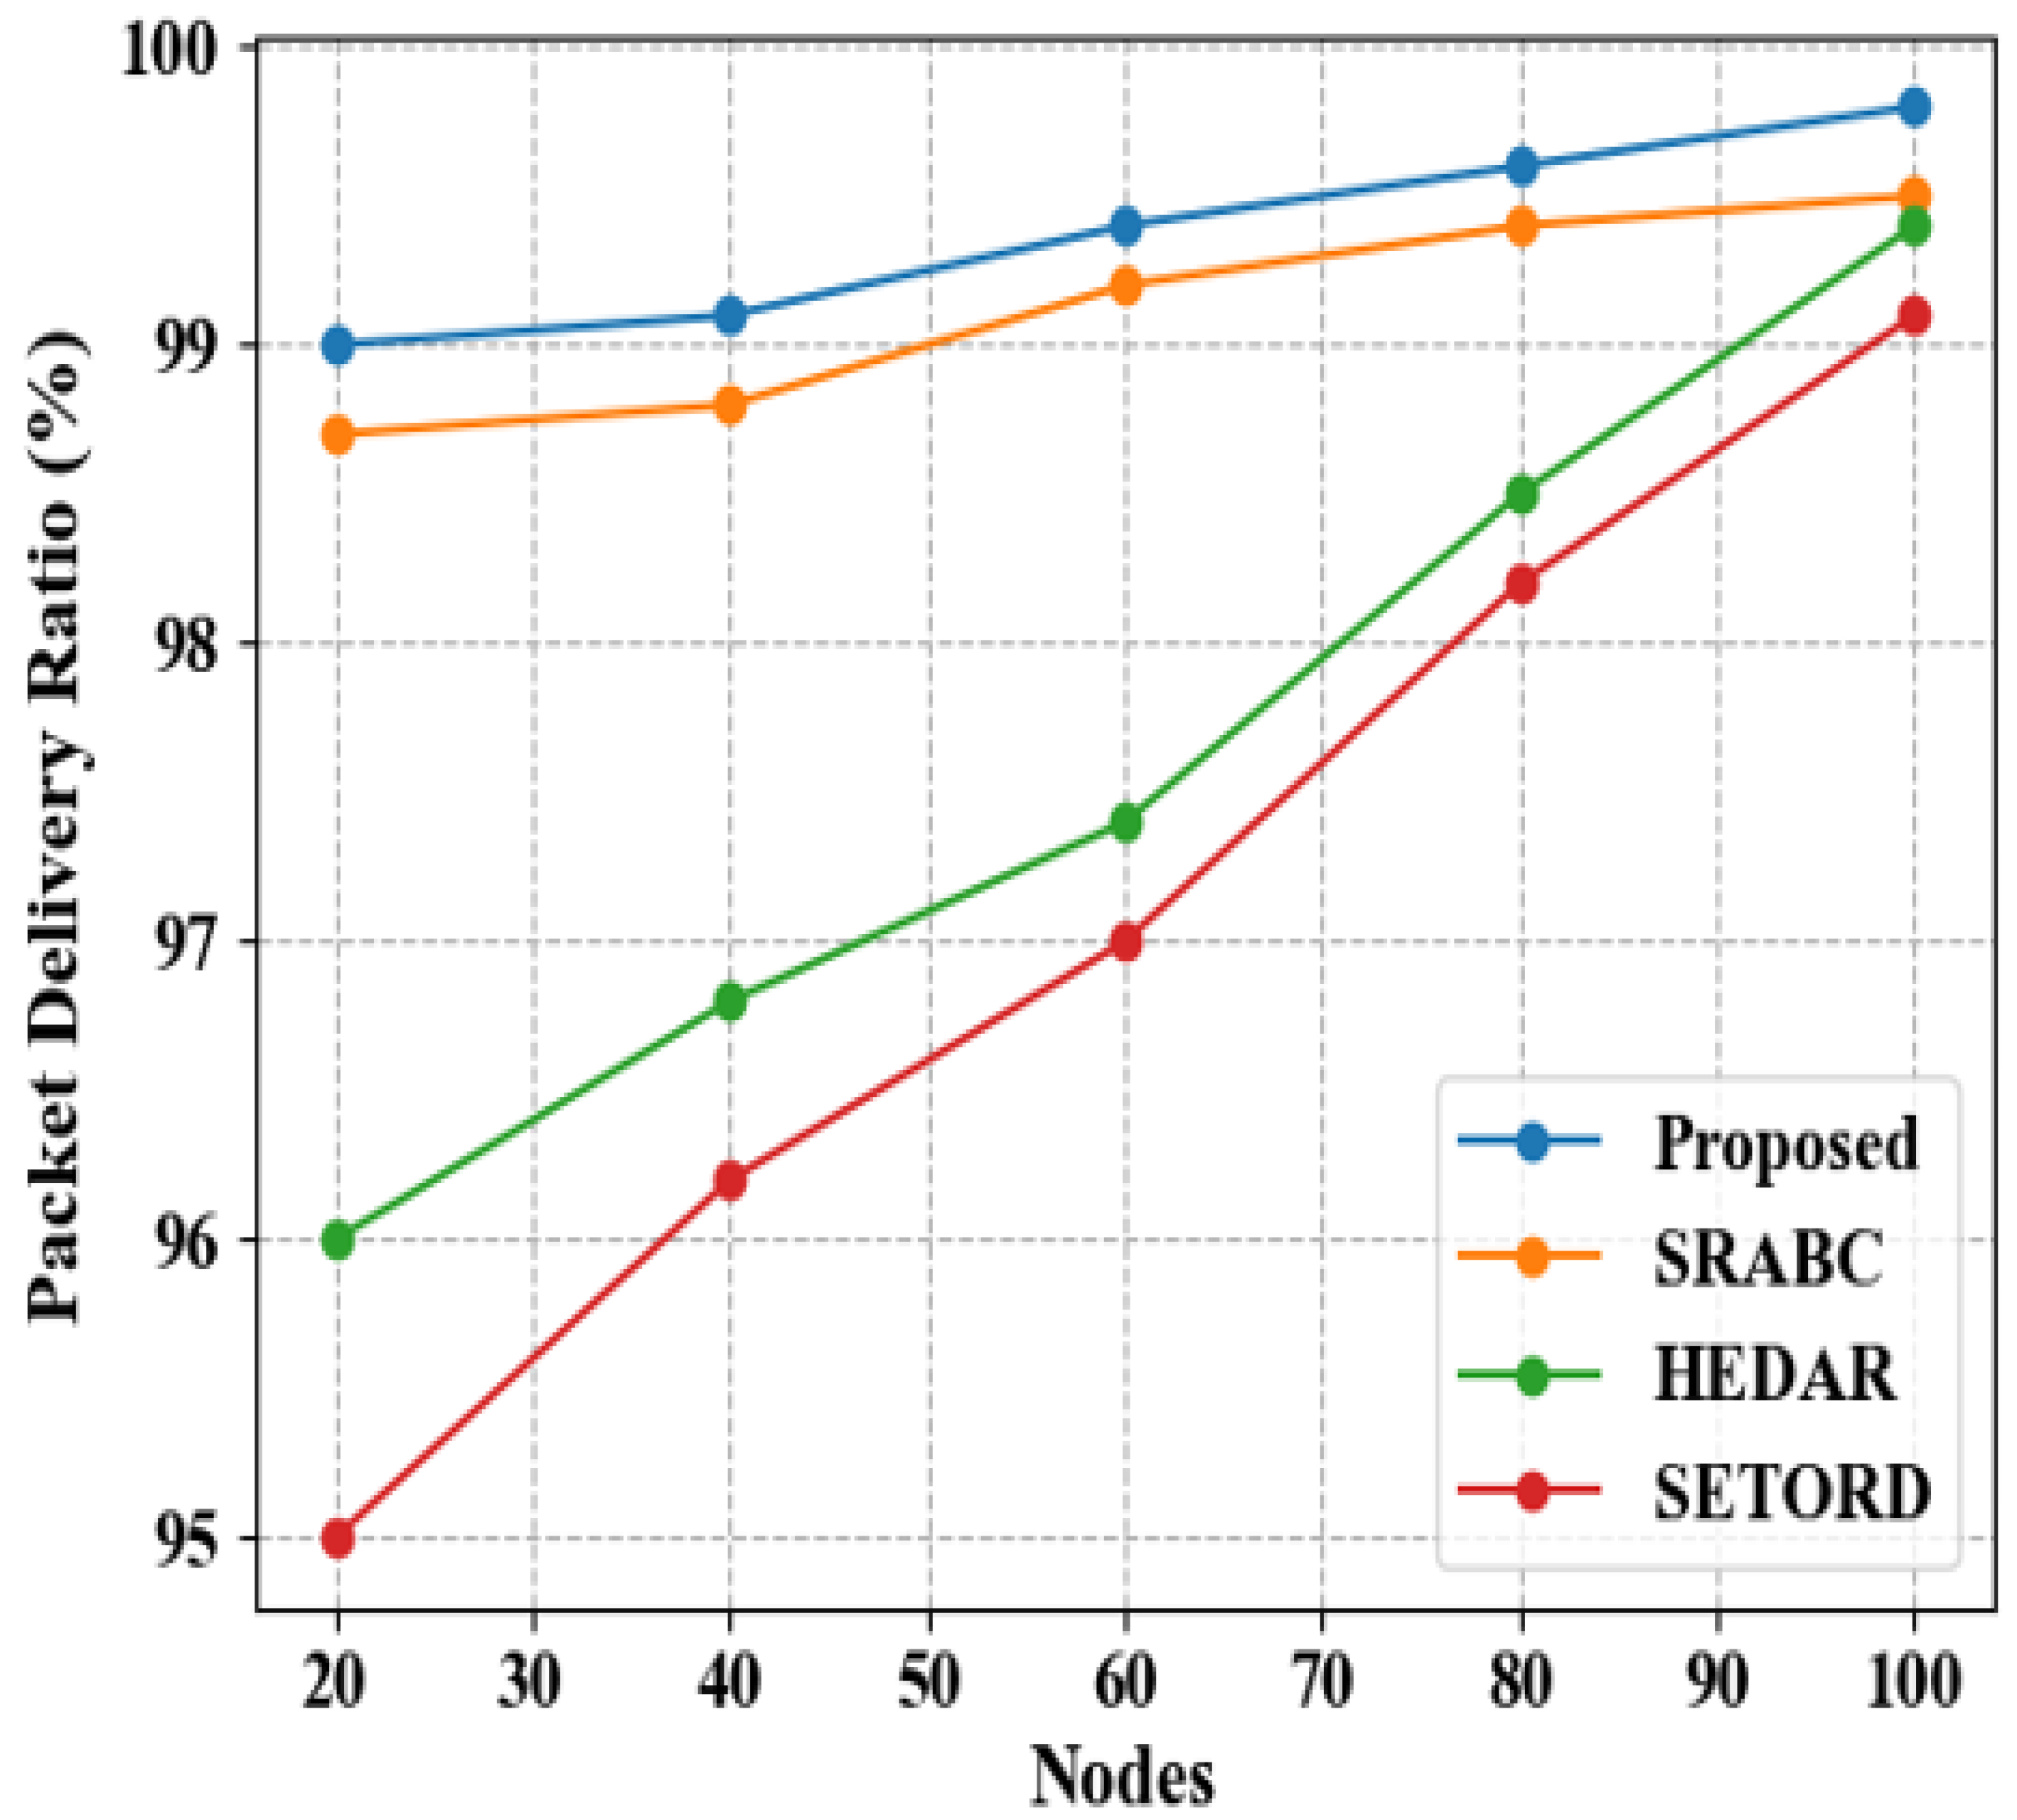
Figure 21 shows the packet-delivery ratio of proposed and existing methods by varying nodes. For Node 20, the proposed method achieves a packet-delivery ratio of 99, compared to existing SRABC, HEDAR, and SETORD methods’ packet-delivery ra-tios of 98.7, 96, and 95. For Node 40, the proposed method achieves a packet-delivery ratio of 99.1, compared to existing methods’ packet-delivery ratios, which are 98.8, 96.8, and 96.2, respectively. For Node 60, the proposed method achieves a pack-et-delivery ratio of 99.4, compared to existing methods’ packet-delivery ratios, which are 99.2, 97.4, and 97, respectively. For Node 80, the proposed method achieves a pack-et-delivery ratio of 99.6, compared to existing methods’ packet-delivery ratios, which are 99.4, 98.5, and 98.2, respectively. For Node 100, the proposed method achieves a packet-delivery ratio of 99.8, compared to existing methods’ packet-delivery ratios of 99.5, 99.4, and 99.1, respectively. So, the proposed method produces better results than other methods. For Node 100, the existing SRABC method node is 99.5, which the pro-posed method improves to 0.3. For Node 100, the existing HEDAR method node is 99.4, which the proposed method improves to 0.4. For Node 100, the existing SETORD method node is 99.1, which the proposed method improves to 0.7.
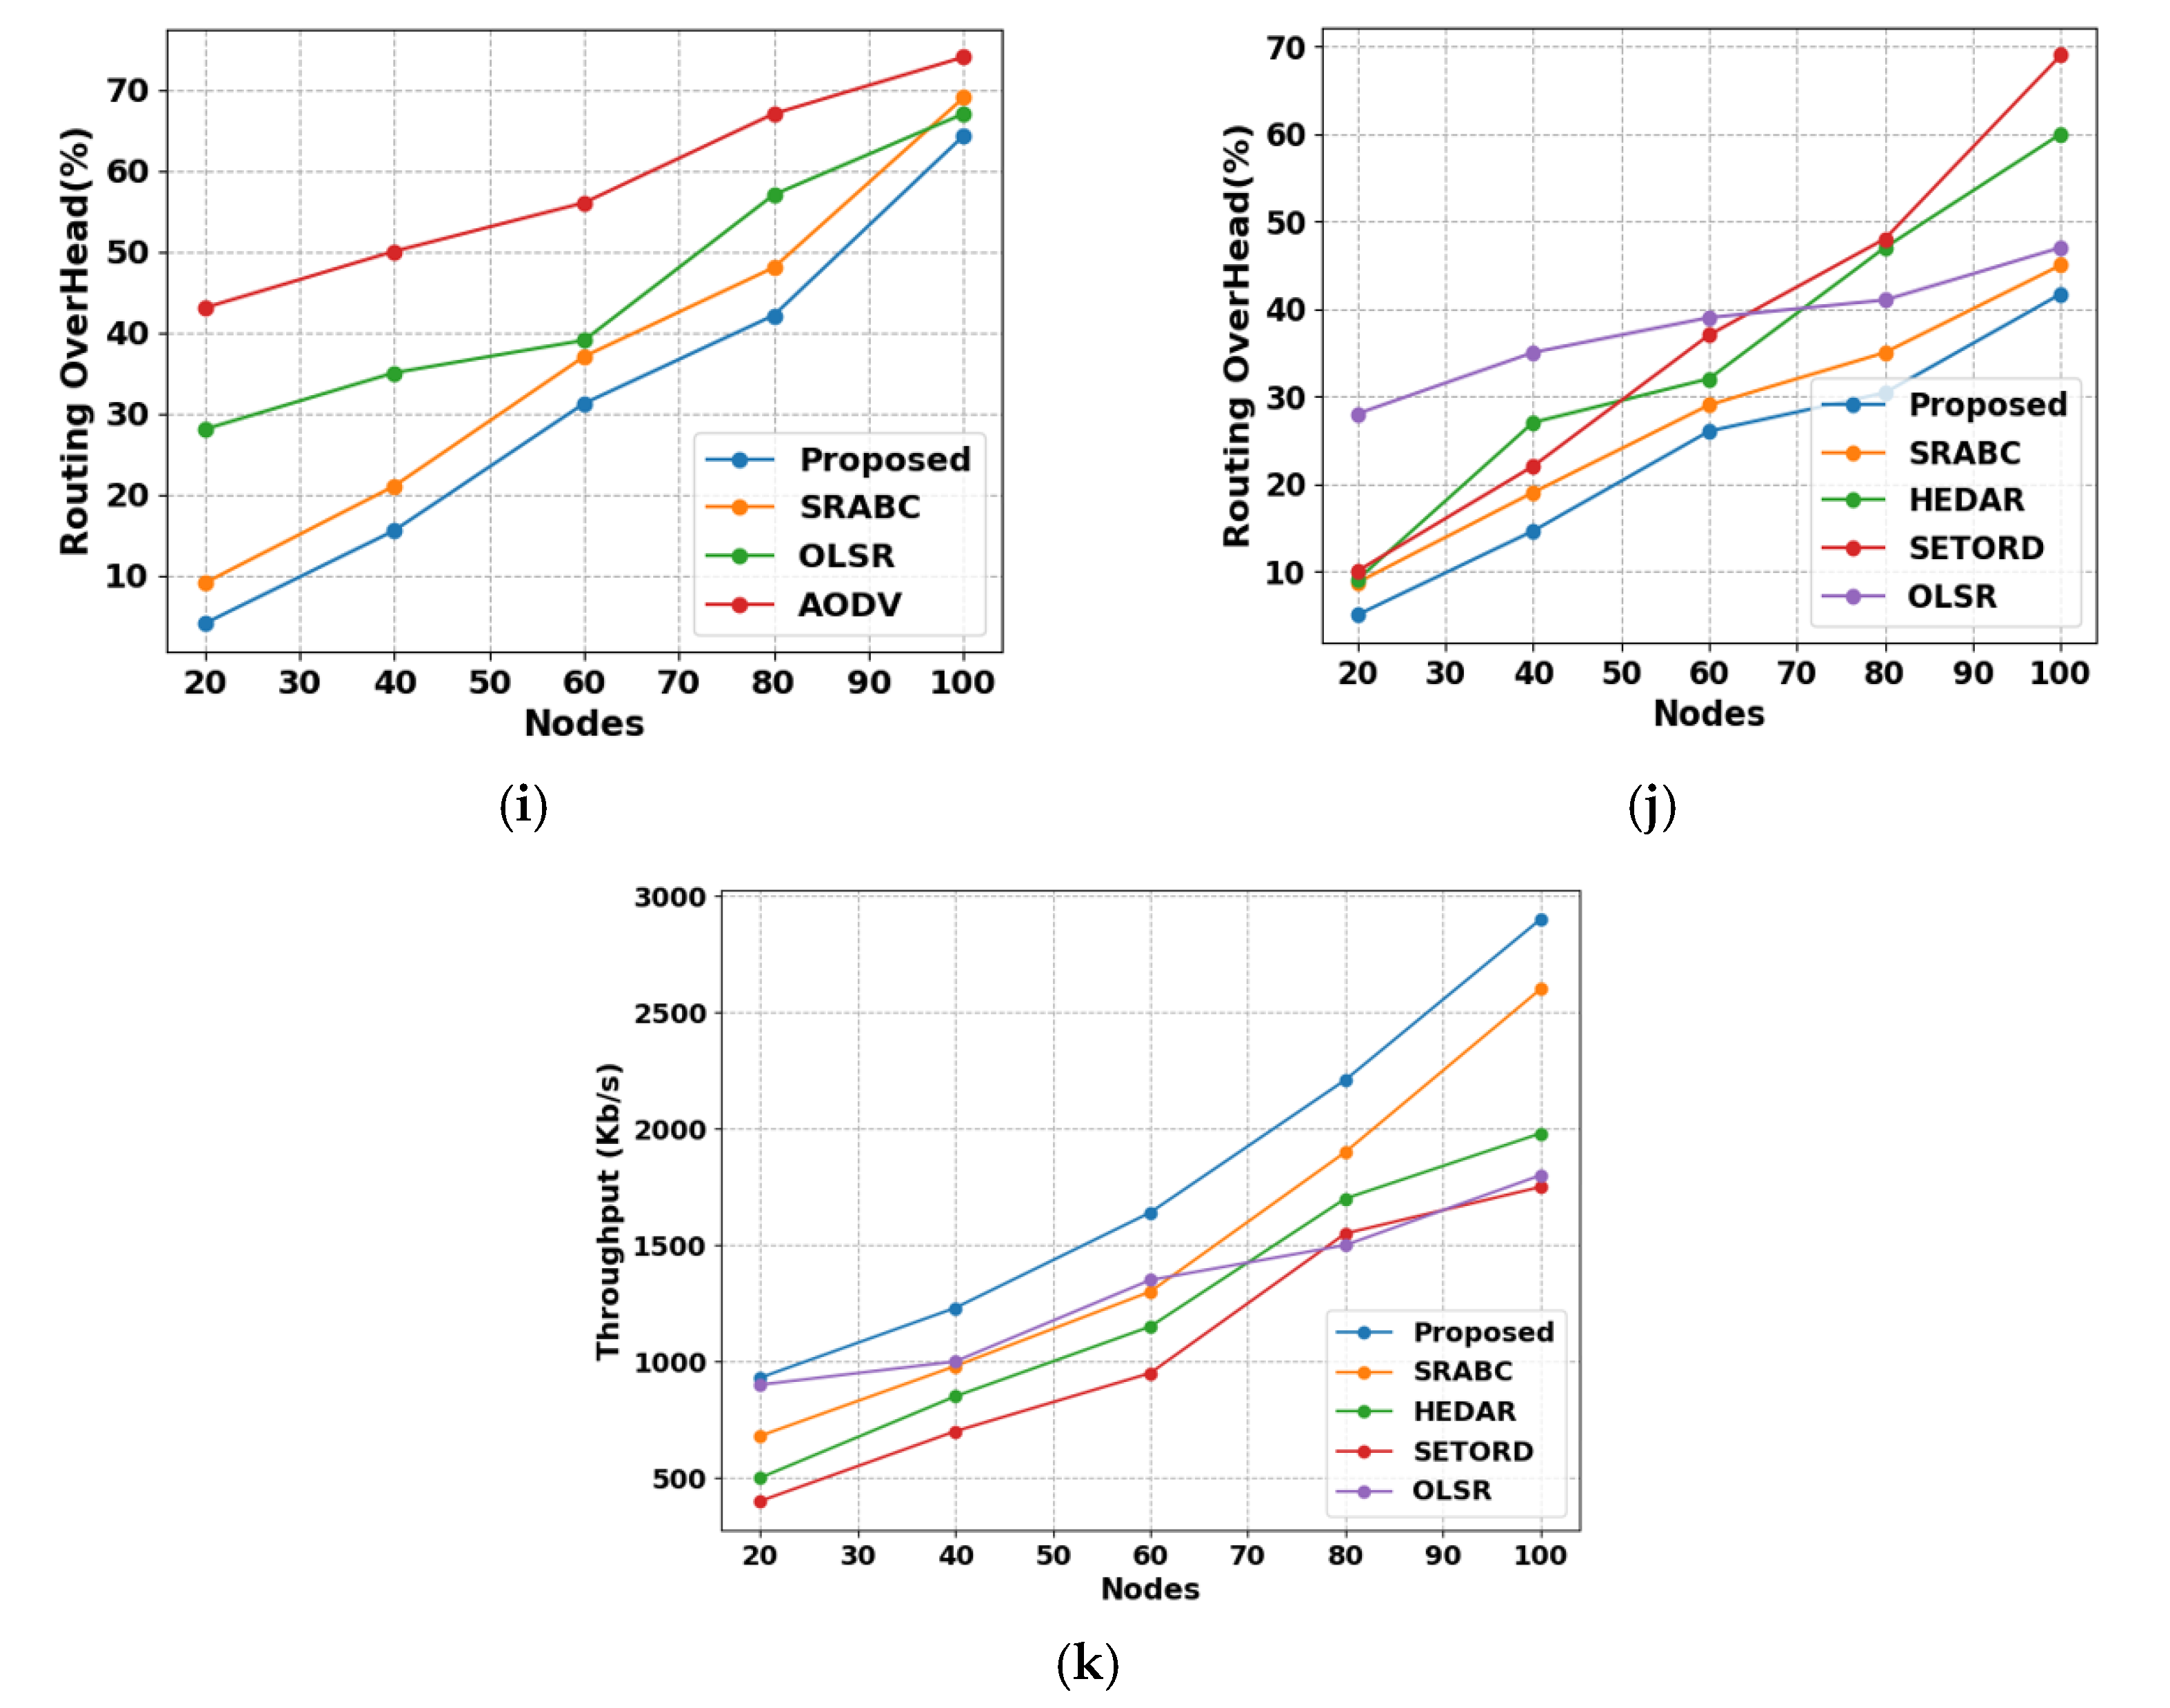
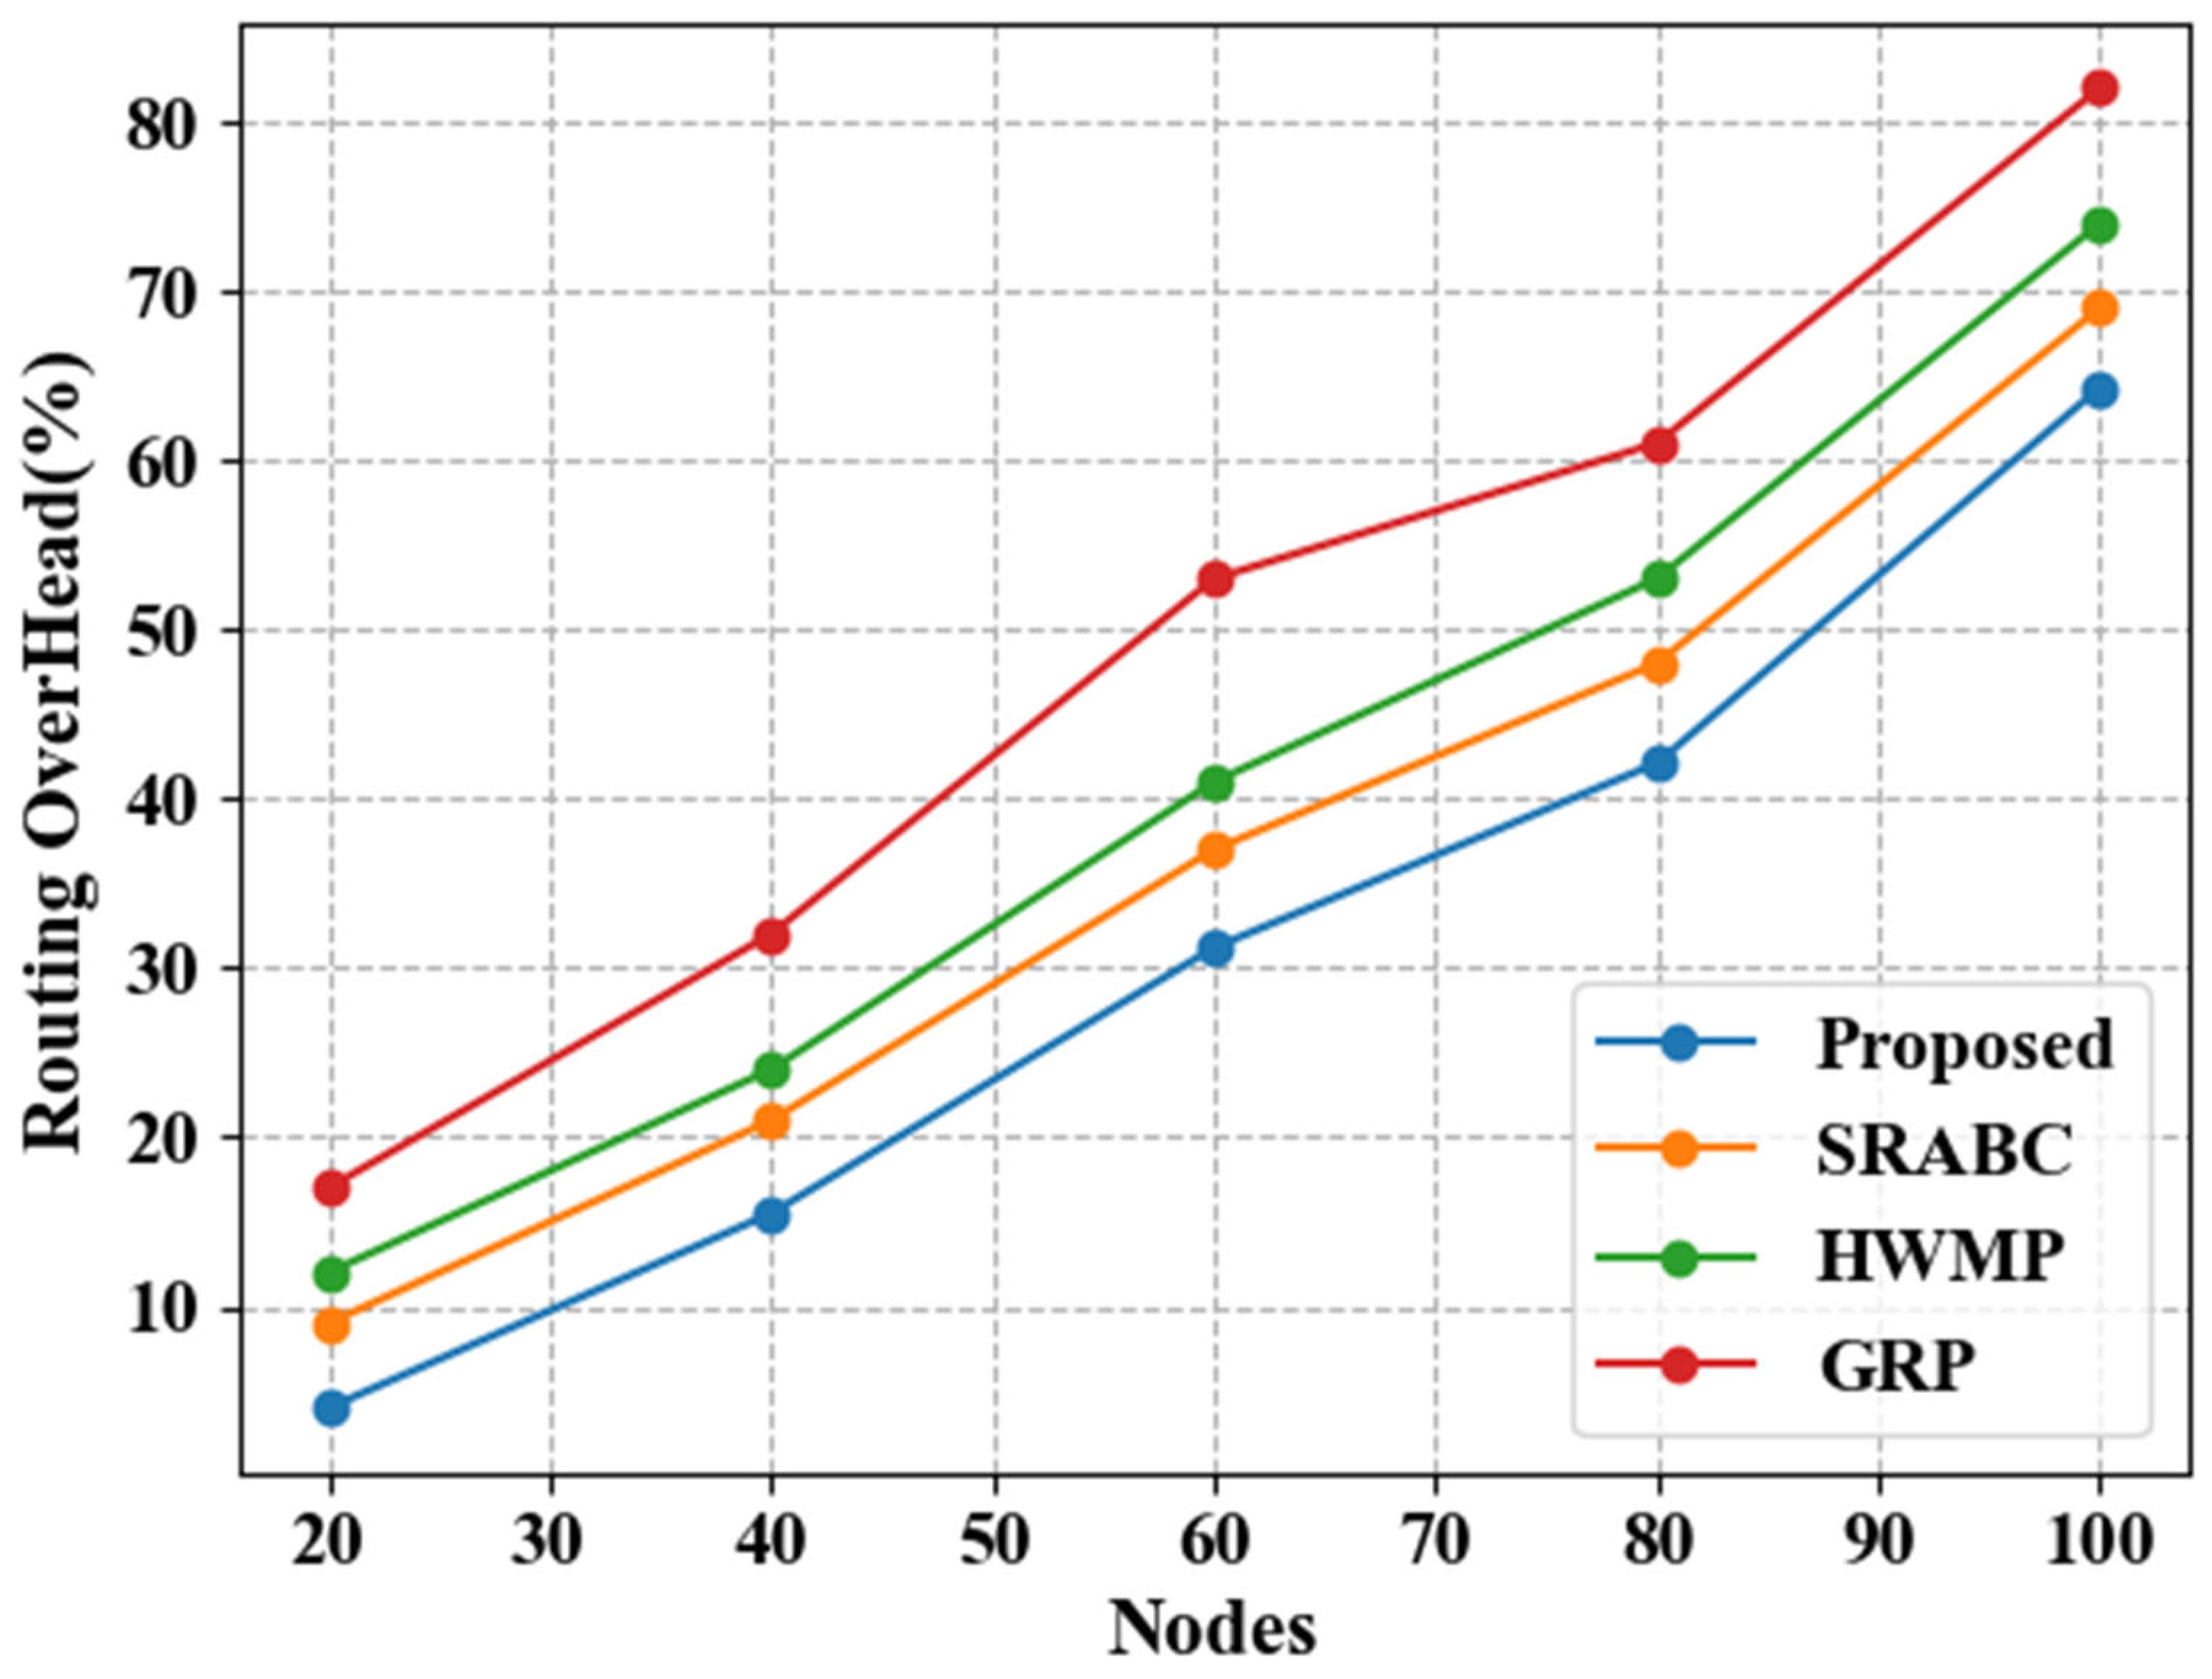
Figure 22 shows the routing overhead (%) of the proposed methods by varying nodes. At a time of 20 seconds, the proposed model achieves a routing overhead of 4, compared to the routing overheads of the existing SRABC, HWMP, and GRP methods which are 9, 12, and 17, respectively. At a time of 40 seconds, the proposed model achieves a routing overhead of 15.5, compared to the existing method’s routing over-heads, which are 21, 24, and 32, respectively. At a time of 60 seconds, the proposed model achieves a routing overhead of 31.2, compared to the existing method’s routing overheads which are 37, 41, and 53, respectively. At a time of 80 seconds, the proposed model achieves a routing overhead of 42.1, compared to the existing method’s routing overheads, which are 48, 53, and 61, respectively. At a time of 100 seconds, the pro-posed model achieves a routing overhead of 64.3, compared to the existing method’s routing overheads, which are 69, 74, and 82, respectively. The graph illustrates that the proposed approach leads to a decrease in routing costs.
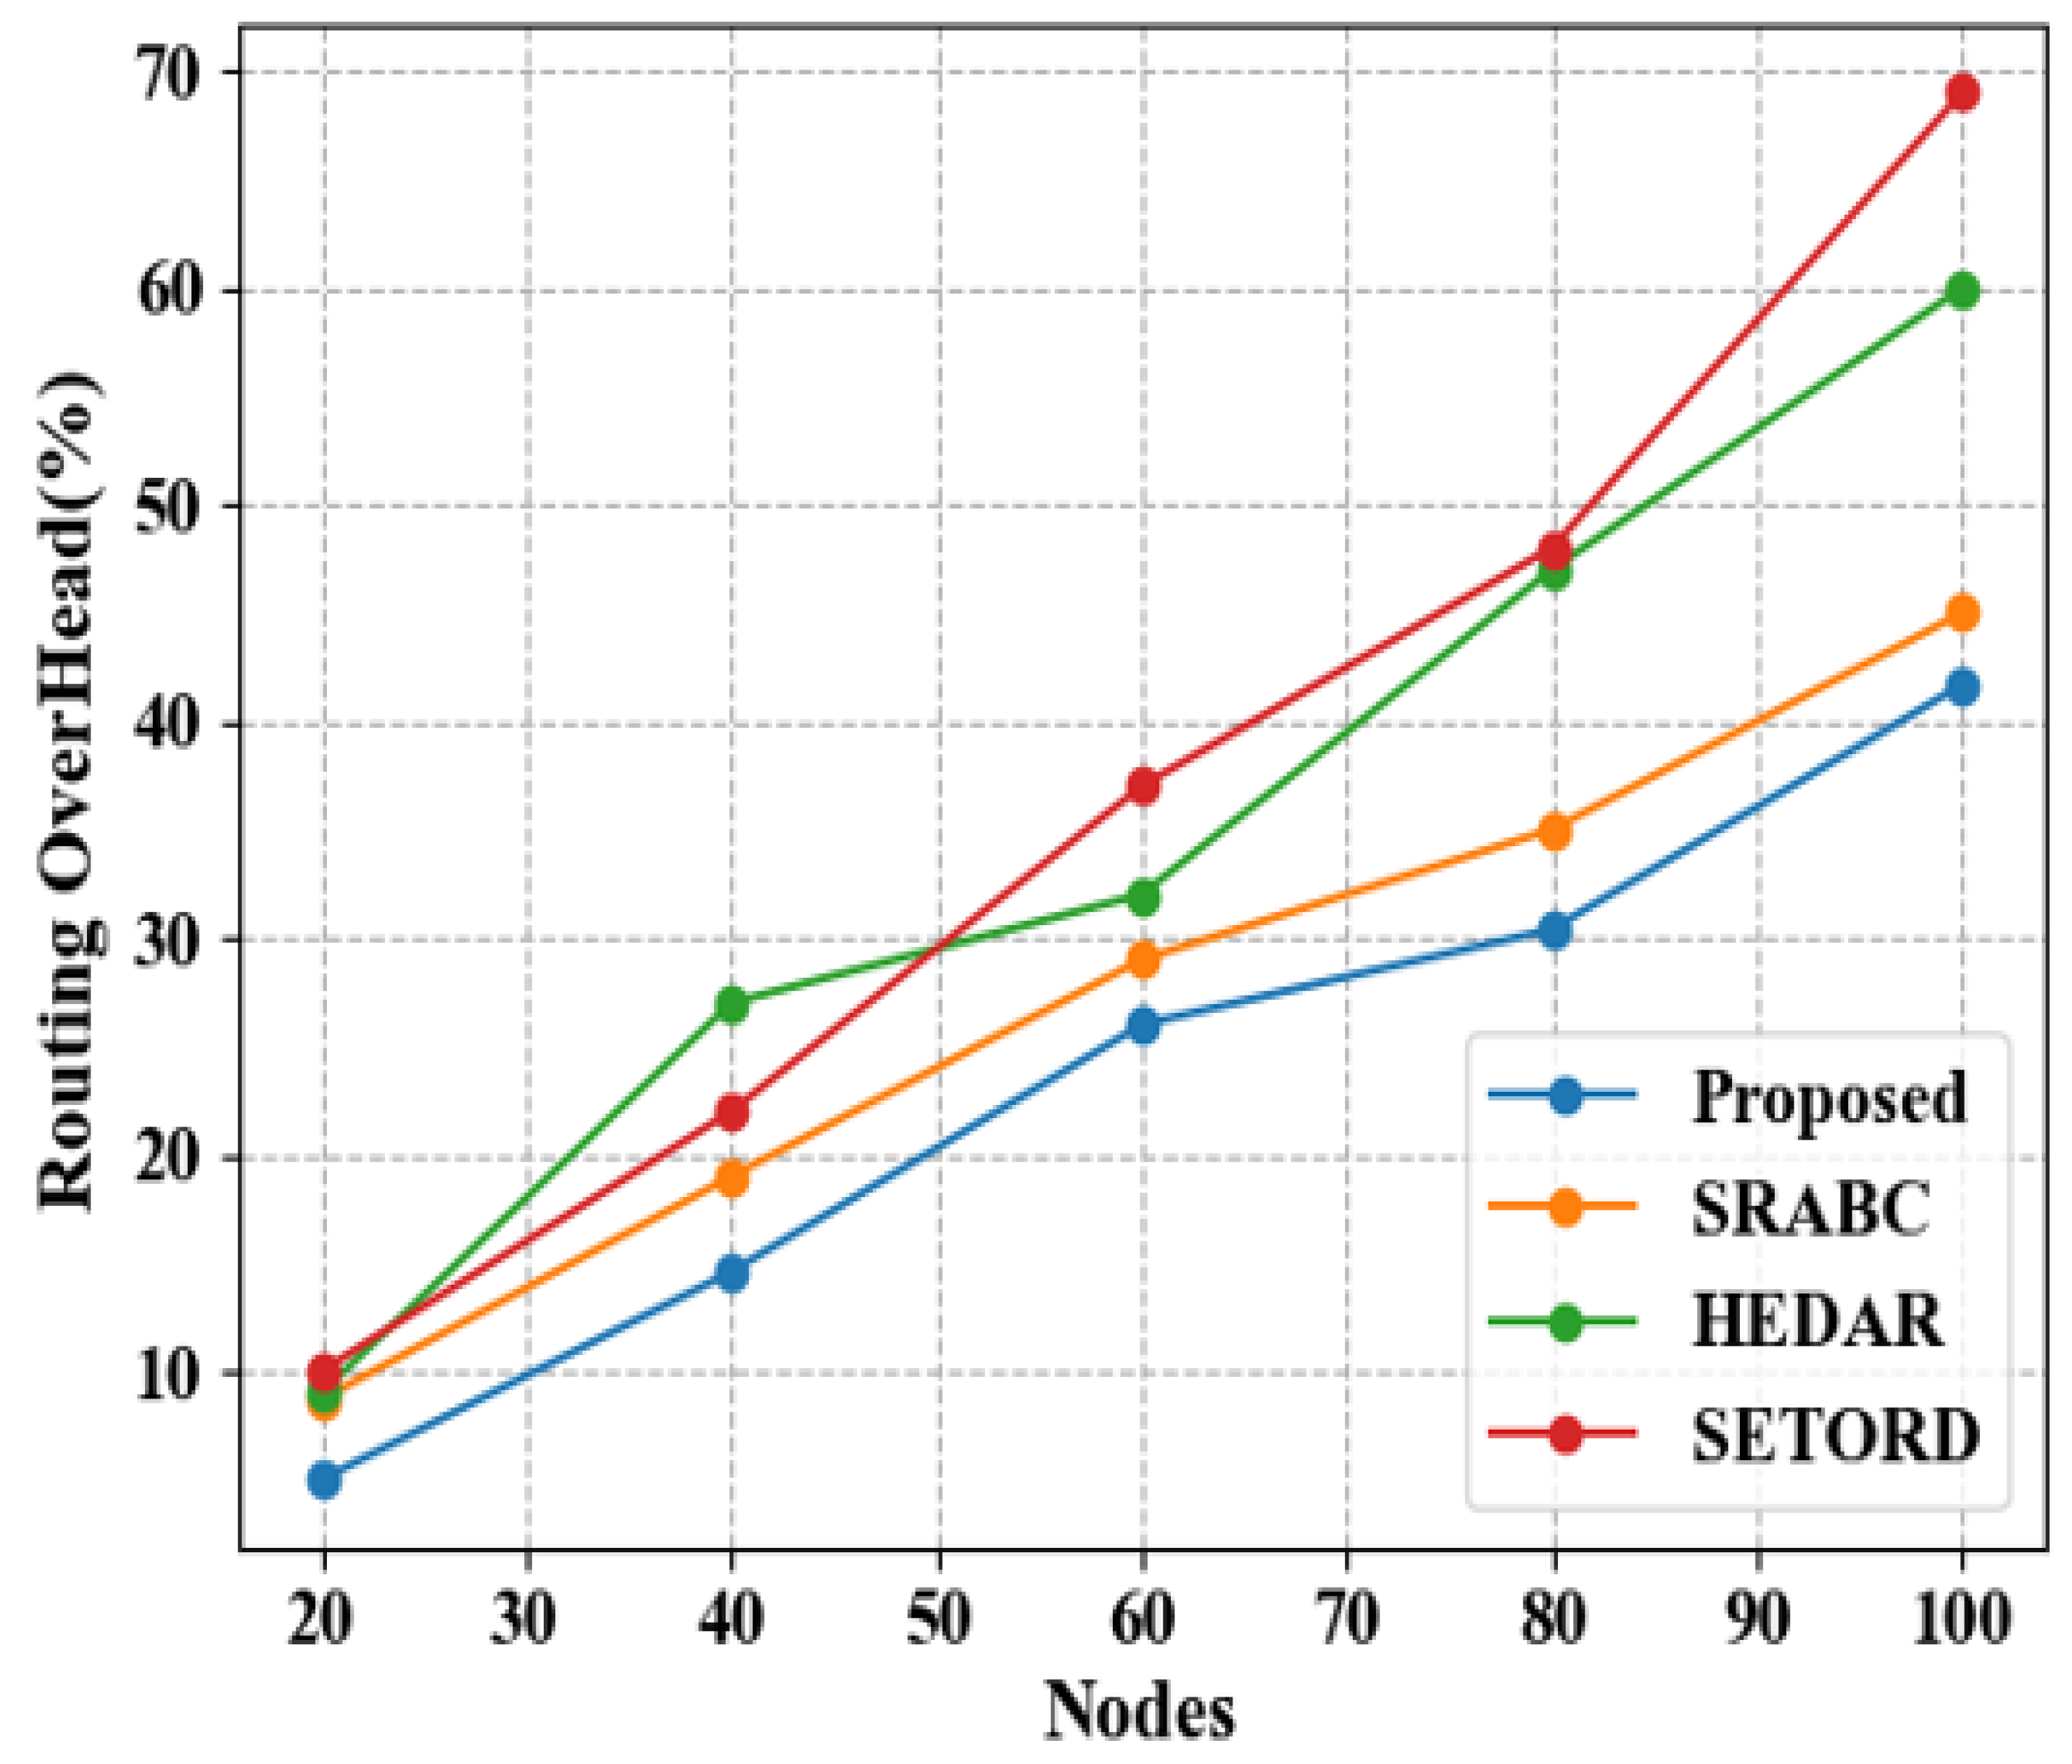
Figure 23 shows the routing overhead (%) of proposed and existing methods by varying nodes. For 20 nodes, the proposed method’s routing overhead is 5%, compared to the routing overheads of the existing SRABC, HEDAR, and SETORD methods, which are 8.7, 9, and 10%, respectively. For 40 nodes, the proposed method achieves a routing overhead of 14.6%, compared to existing methods’ routing overheads, which are 19, 27, and 22%, respectively. For 60 nodes, the proposed method achieves a routing overhead of 26%, compared to existing methods’ routing overheads, which are 29, 32, and 37%, respectively. For 80 nodes, the proposed method achieves a routing overhead of 30.4%, compared to existing methods’ routing overheads, which are 35, 47, and 48%, respec-tively. For 100 nodes, the proposed method achieves a routing overhead of 41.7%, compared to existing methods’ routing overheads, which are 45, 60, and 69%, respec-tively. So, the proposed method may permit routing to certain networks, and it in-creases security. For Node 100, the existing SRABC method node is 45, which the pro-posed method improves to 3.3. For Node 100, the existing HEDAR method node is 60, which the proposed method improves to 18.3. For Node 100, the existing SETORD method node is 69, which the proposed method improves to 27.3.
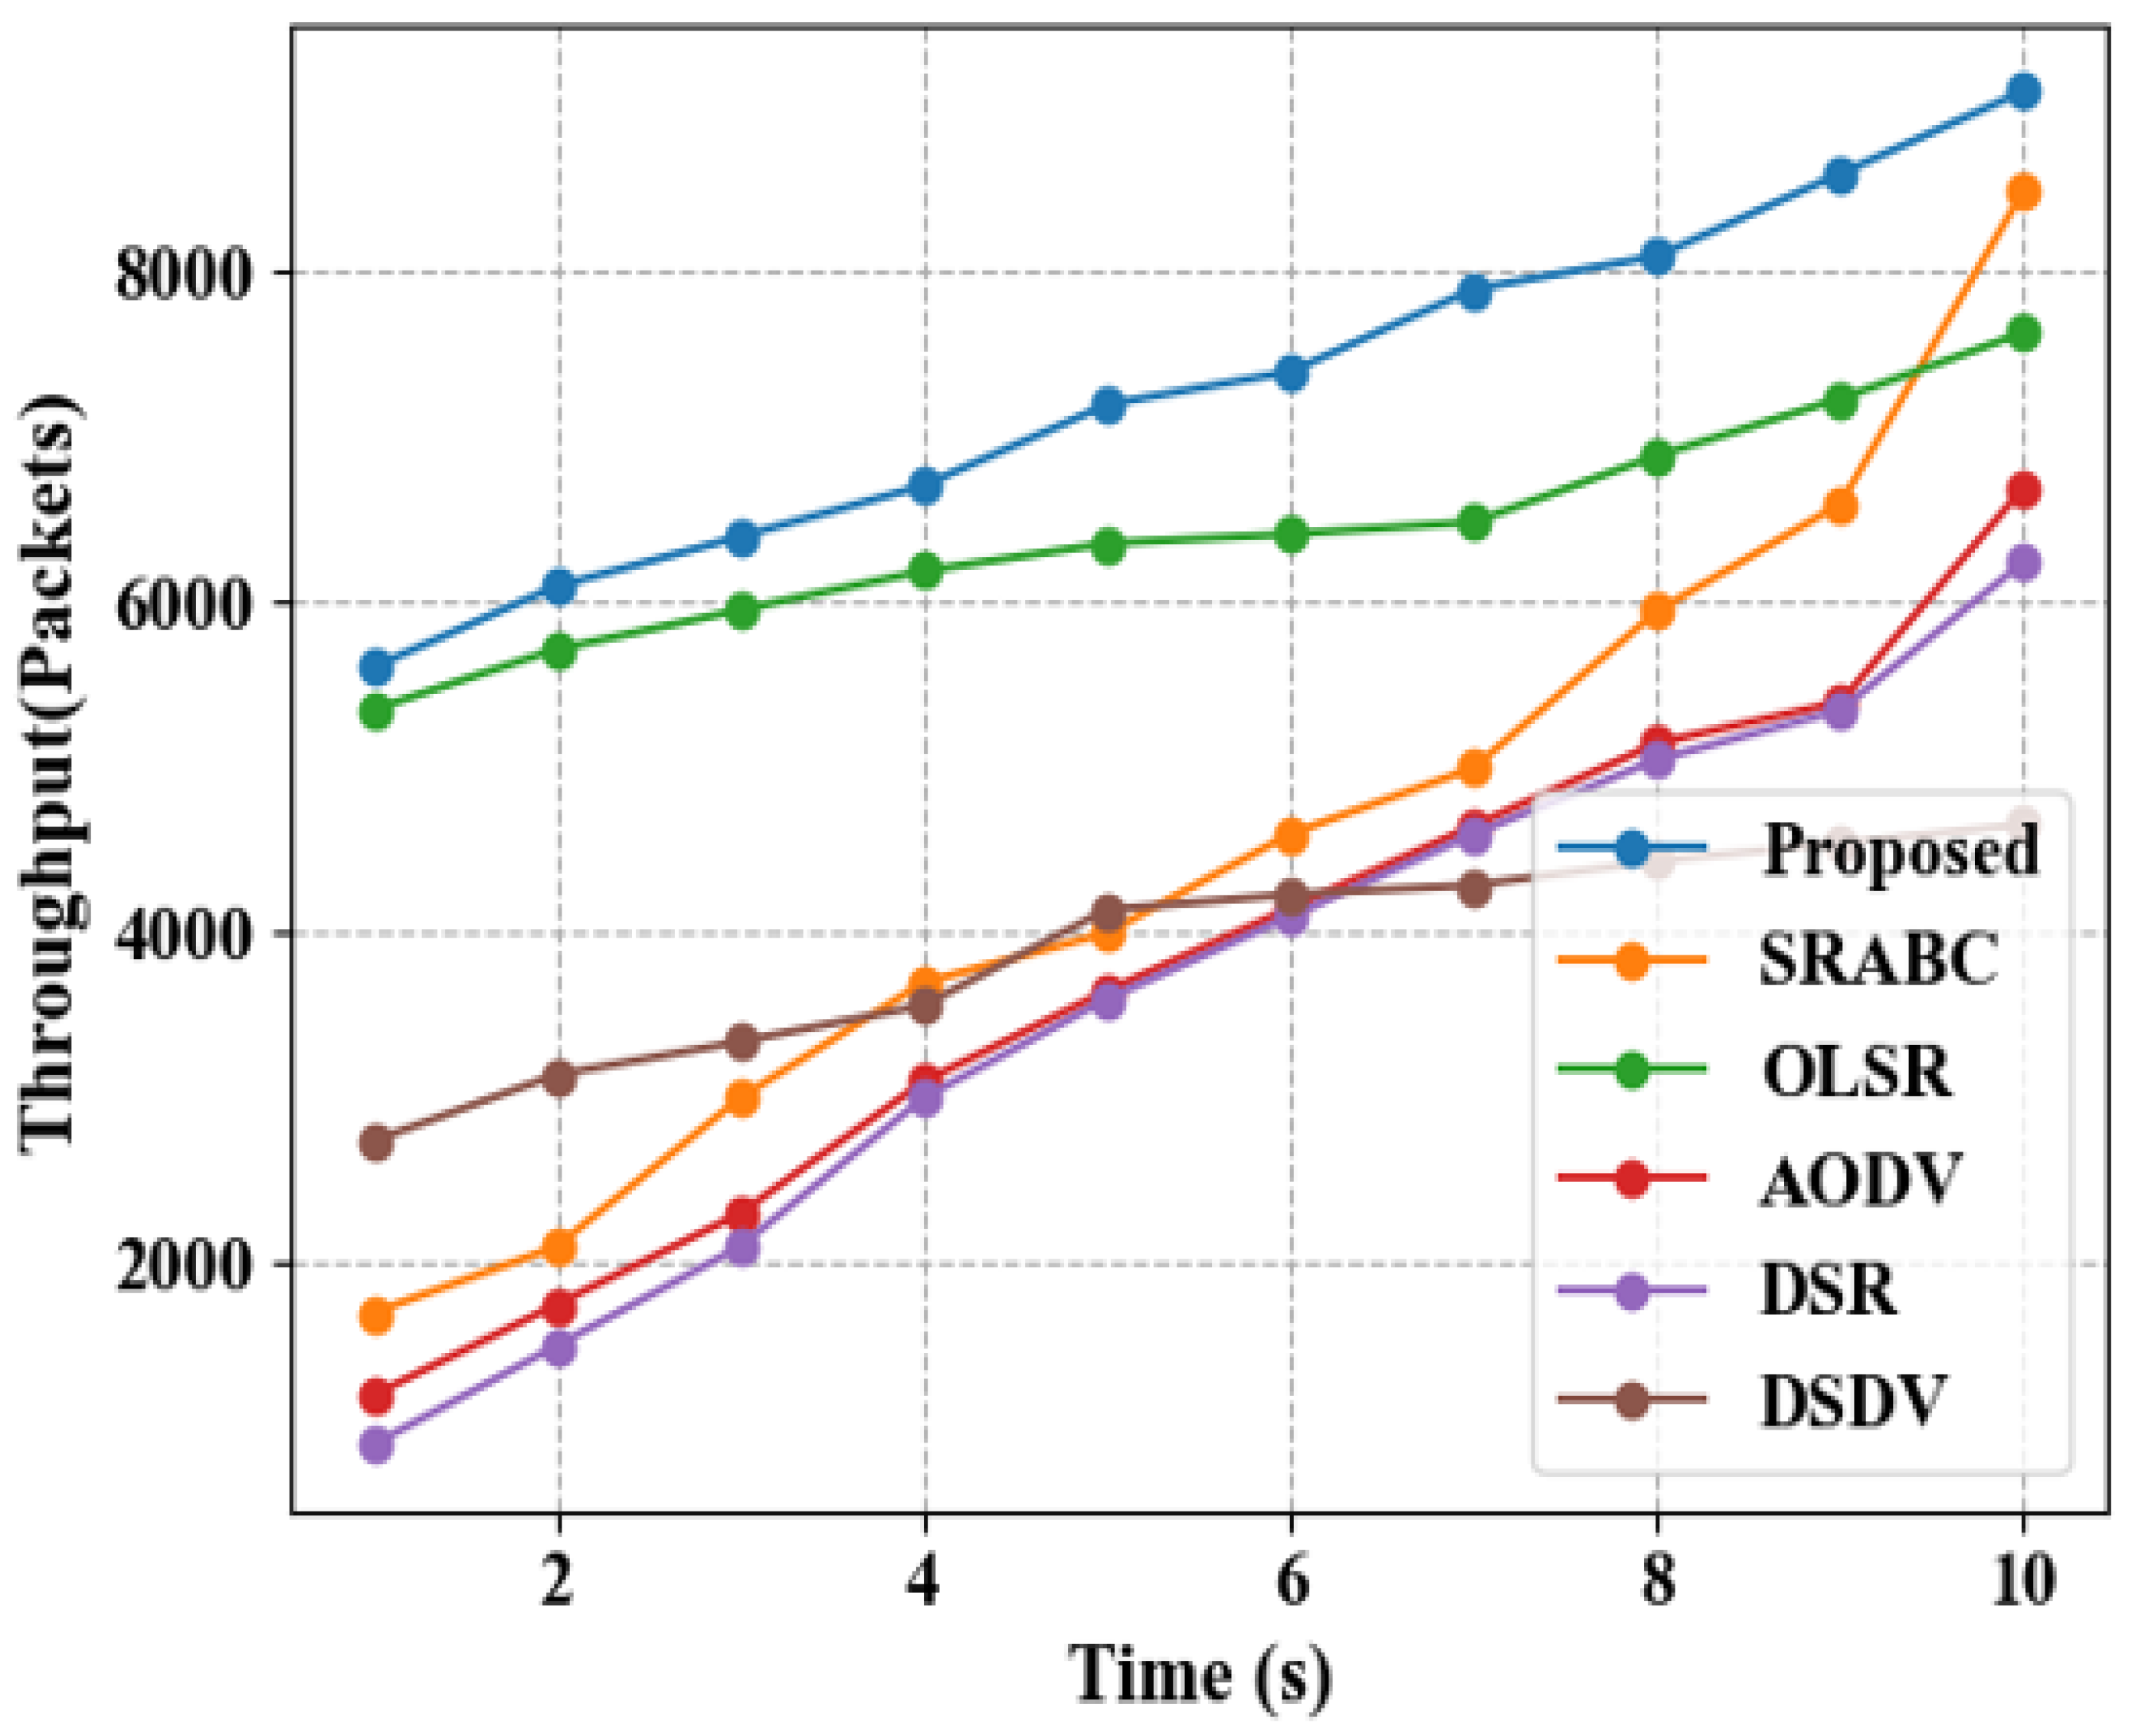
Figure 24 shows the throughput (packets) of the proposed and existing methods by varying time. At a time of 2 s, the throughput of the proposed method is 6100, whereas the throughputs of the existing SRABC, OLSR, AODV, DSR, and DSDV meth-ods are 2100, 5719,1750, 1500, and 3141, respectively. At a time of 4 s, the proposed method’s throughput is 6710, whereas the existing methods’ throughputs are 3700, 6193, 3100, 3000, and 3560, respectively. At a time of 6 s, the proposed method’s throughput is 7400, whereas the existing methods’ throughputs are 4600, 6415, 4150, 4100, and 4233, respectively. At a time of 8 s, the proposed method’s throughput is 8100, whereas the existing methods’ throughputs are 5950, 6891, 5150, 5050, and 4436, respectively. At a time of 10 s, the proposed method’s throughput is 9100, whereas the existing methods’ throughputs are 8500, 7637, 6700, 6250, and 4656, respectively. Therefore, the proposed method offers higher throughput, offering an effective trans-mission rate. Table 5 shows an analysis of throughput (packets) time.
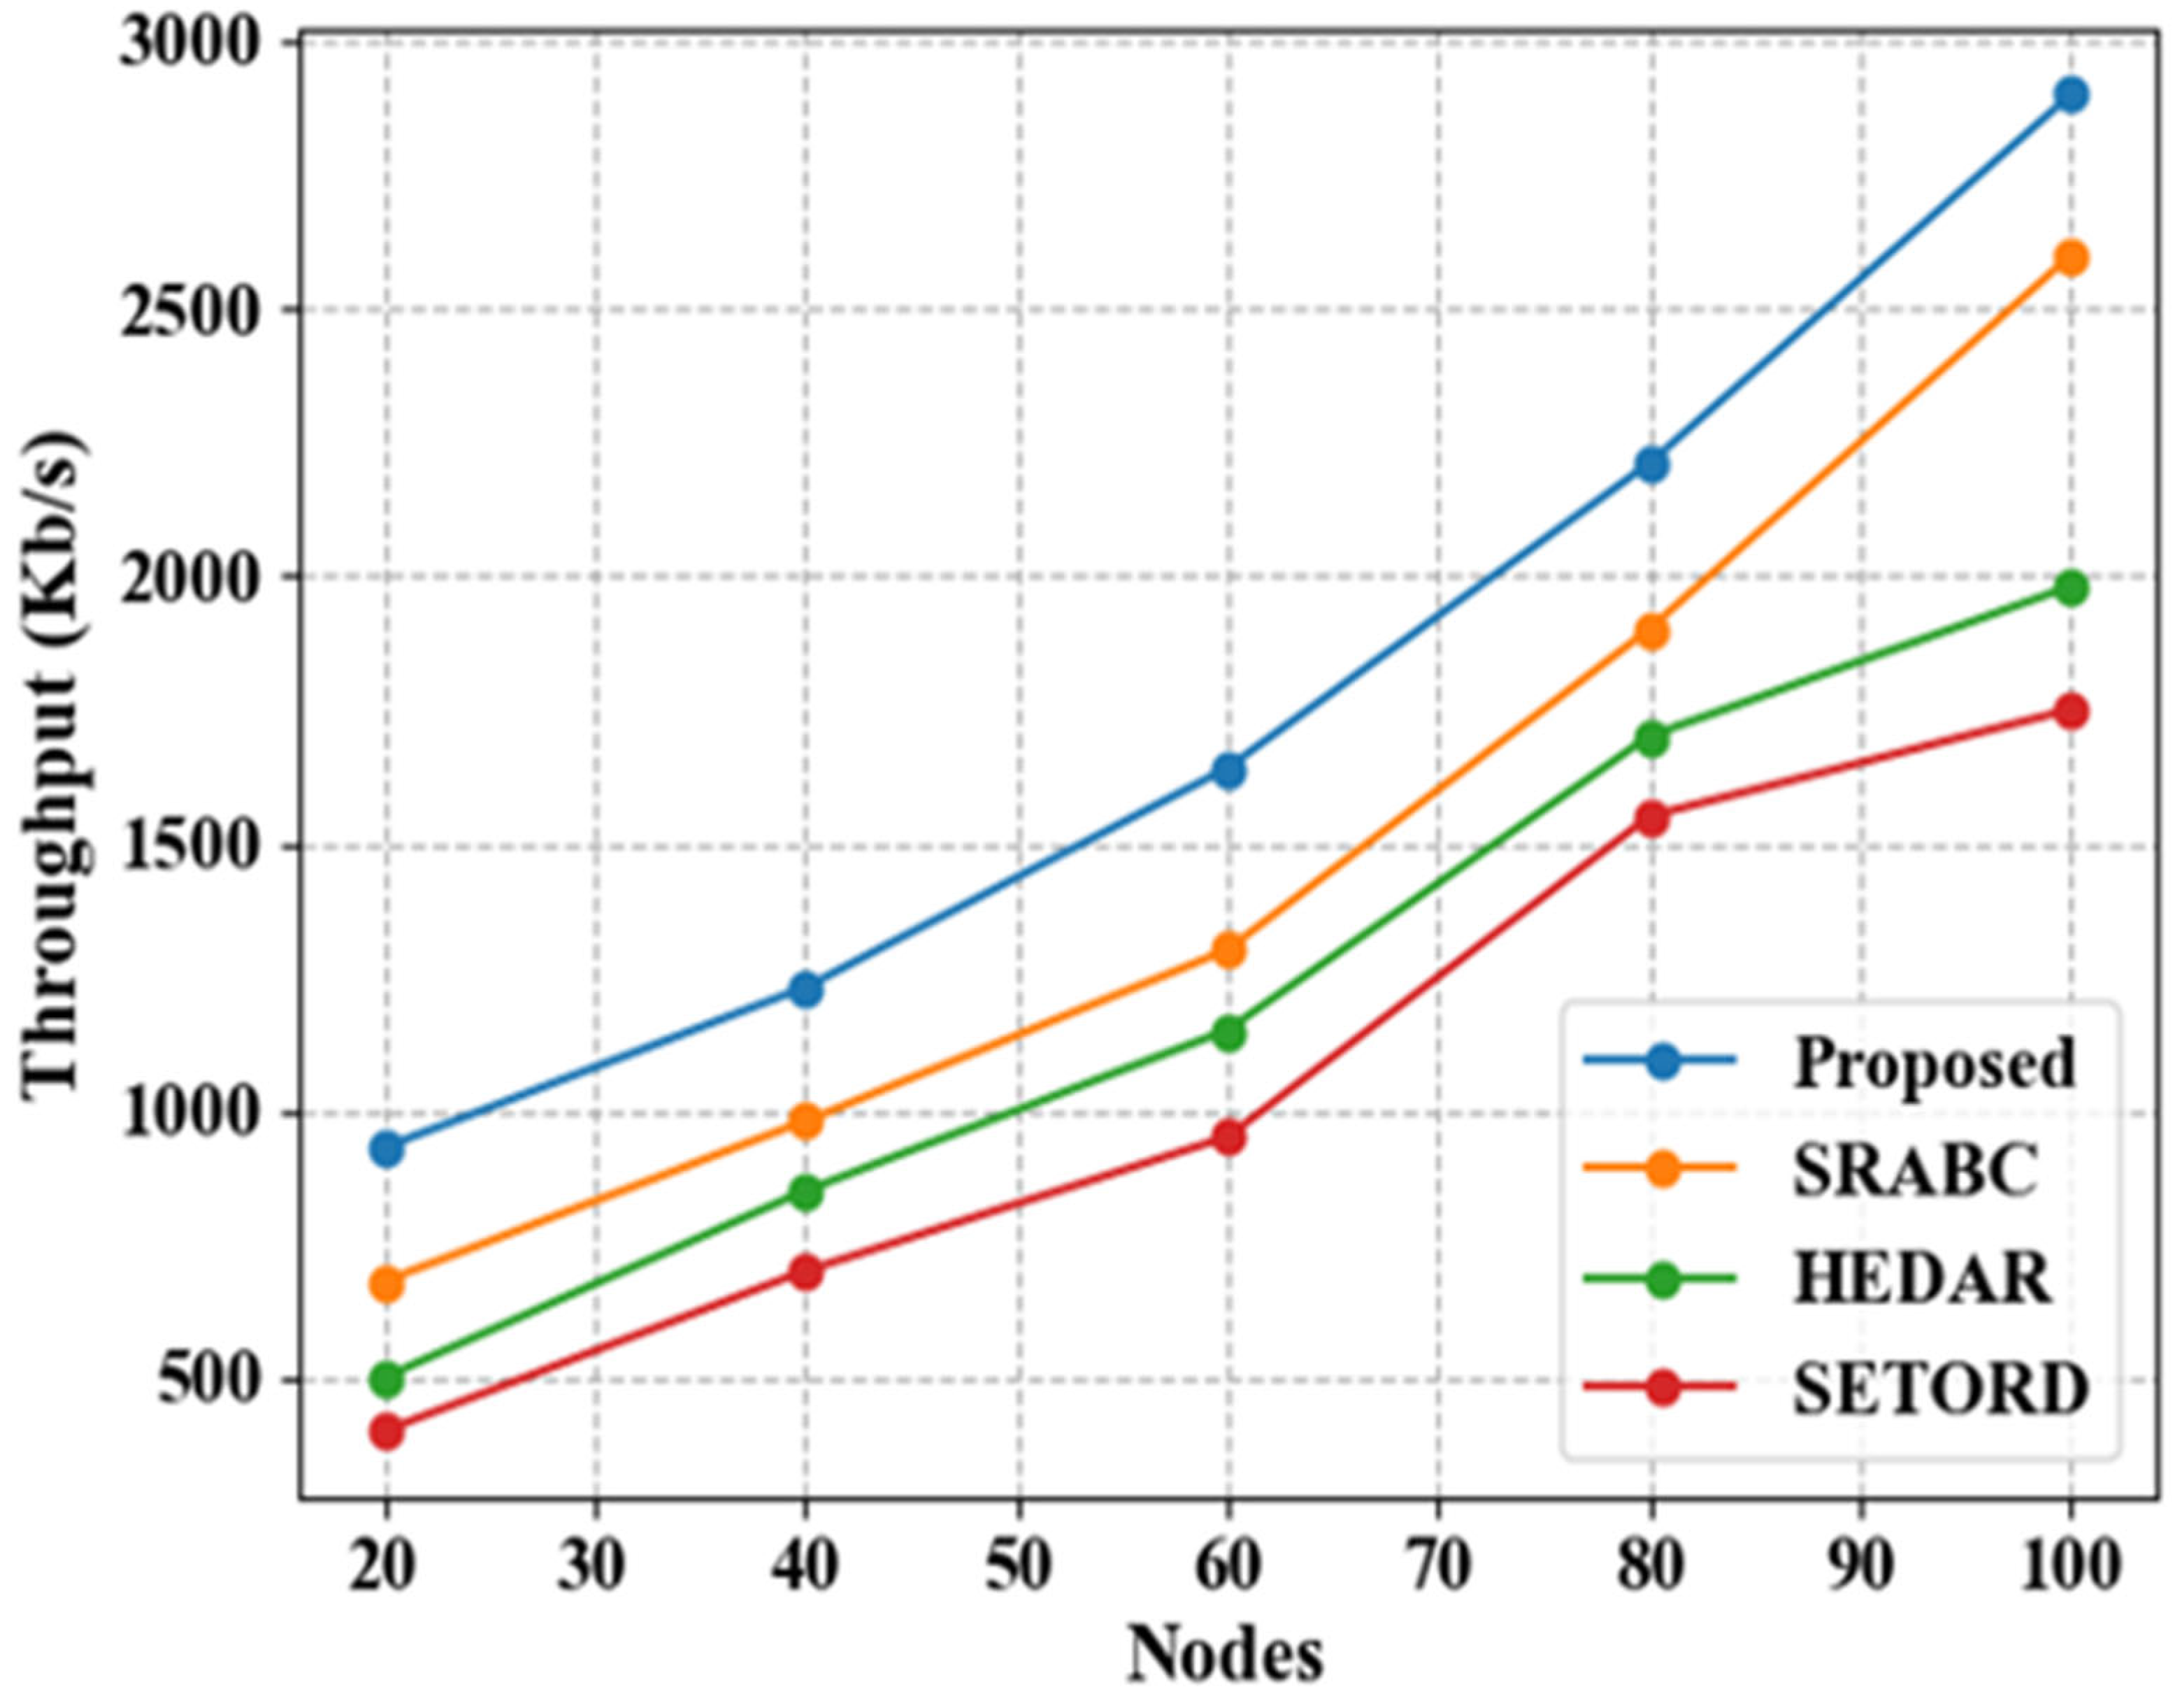
Figure 25 shows the throughput (Kb/s) of the proposed and existing methods by varying nodes. For 20 nodes, the throughput of the proposed method is 930, whereas the throughputs of the existing SRABC, HEDAR, and SETORD methods are 680, 500, and 400, respectively. For 40 nodes, the proposed method’s throughput is 1230, where-as the existing methods’ throughputs are 980, 850, and 700, respectively. For 60 nodes, the proposed method’s throughput is 1640, whereas the existing methods’ throughputs are 1300, 1150, and 950, respectively. For 80 nodes, the proposed method’s throughput is 2210, whereas the existing methods’ throughputs are 1900, 1700, and 1550, respec-tively. For 100 nodes, the proposed method’s throughput is 2900, whereas the existing methods’ throughputs are 2600, 1980, and 1750, respectively. Thus, the proposed method improves throughput compared to the preceding methods. Table 6 shows the analyzing nodes of the proposed and existing methods. For Node 100, the existing SRABC method node is 2600, which the proposed method improves to 300. For Node 100, the existing HEDAR method node is 1980, which the proposed method improves to 920. For Node 100, the existing SETORD method node is 99.1, which the proposed method improves to 0.7.
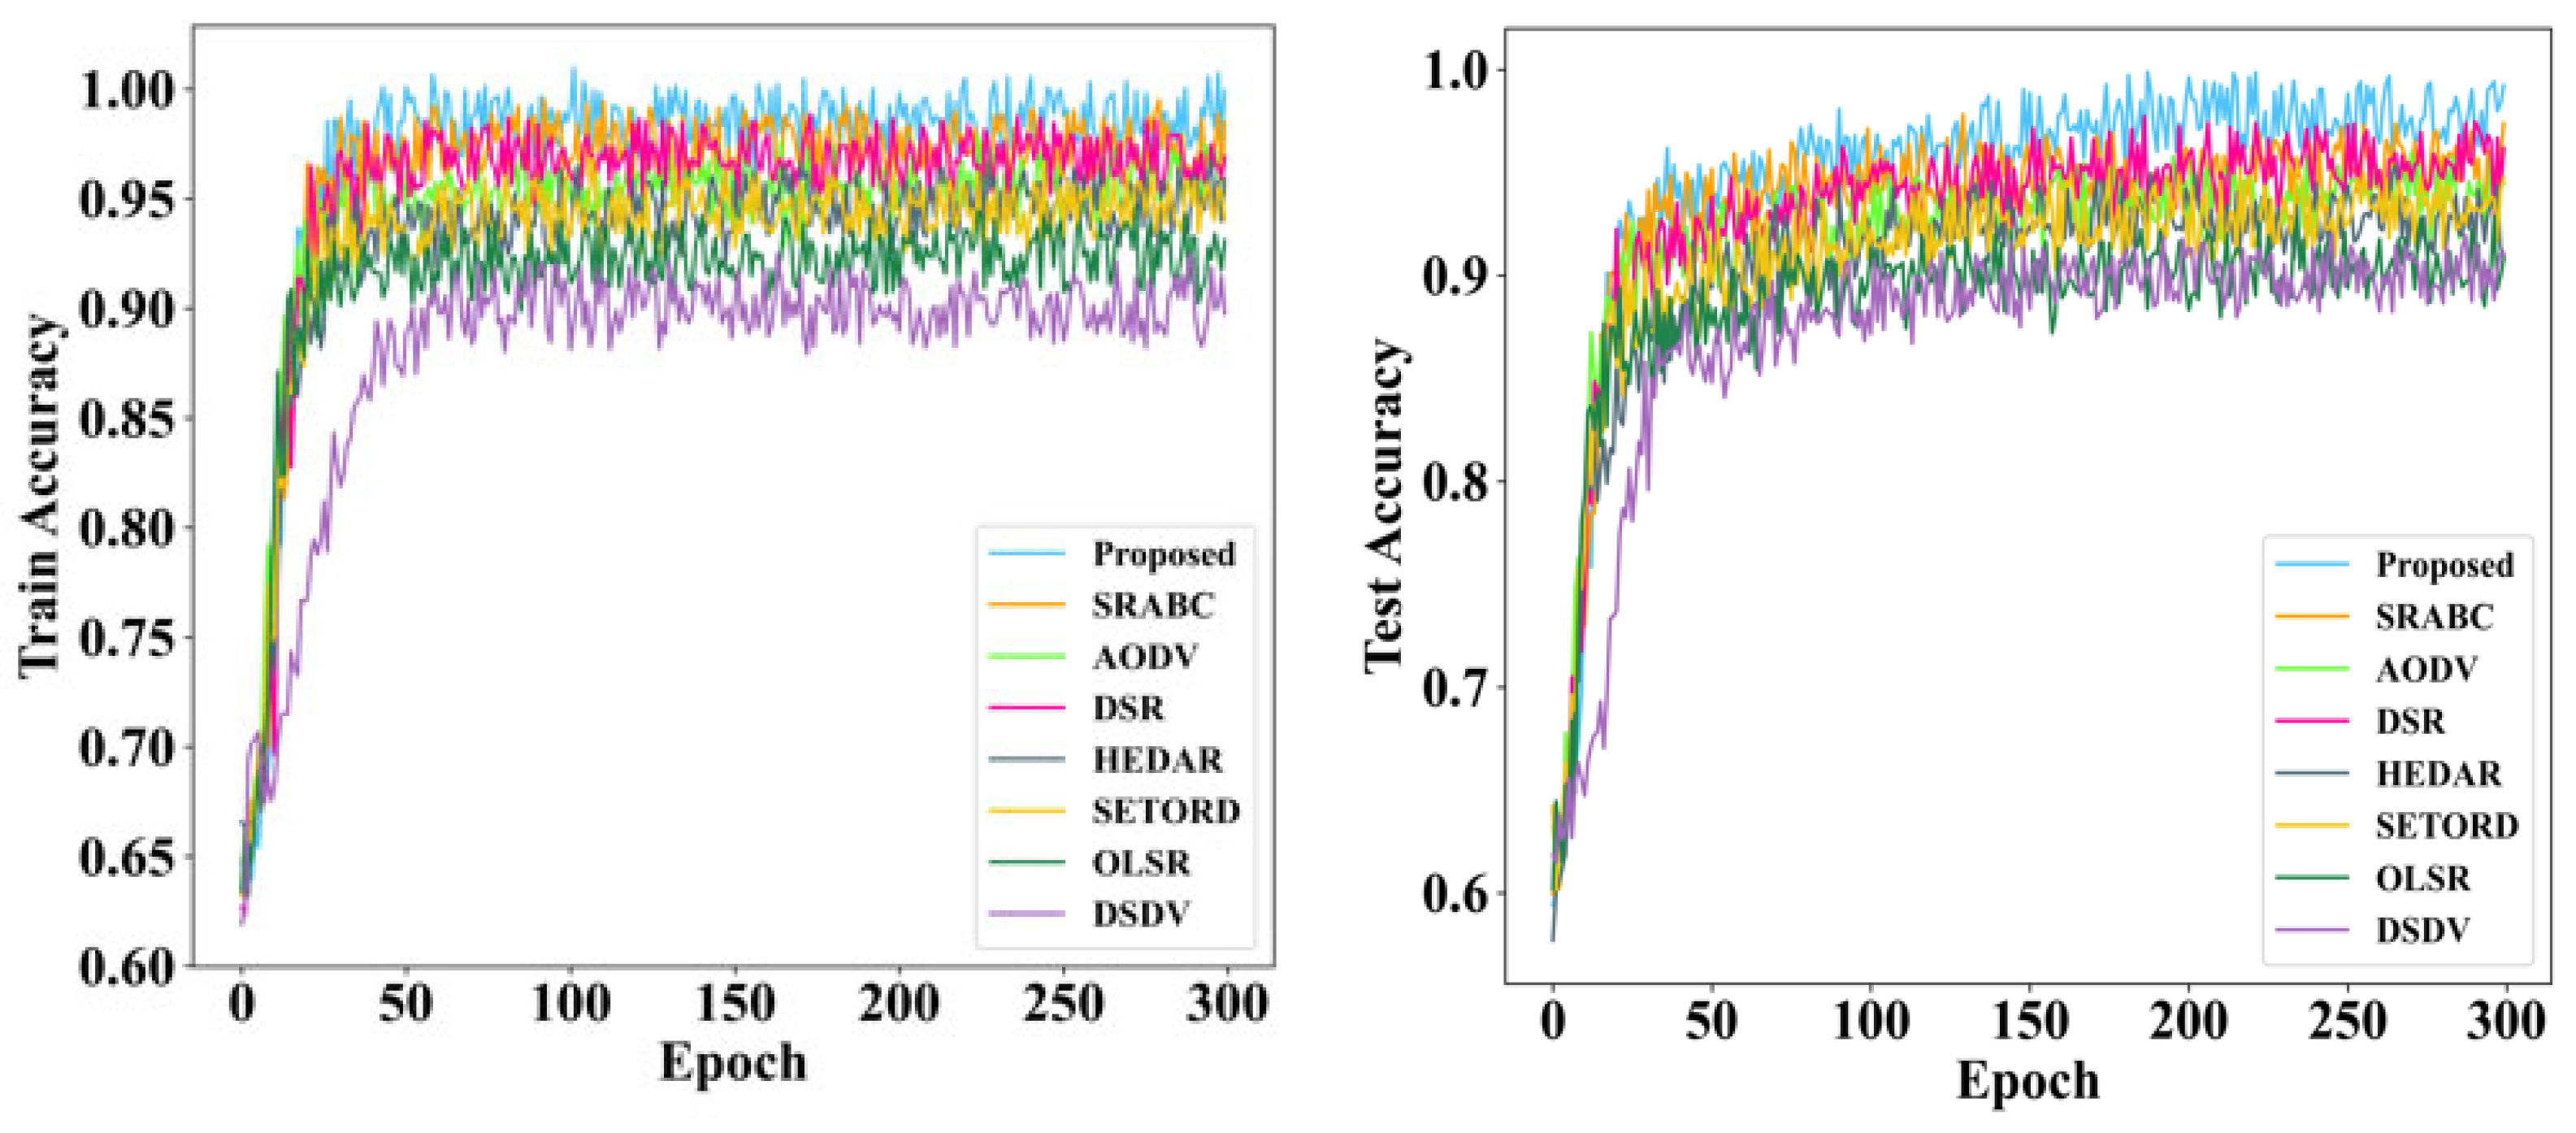
Figure 26 shows the training and testing accuracy of the proposed and existing methods for different epoch values. In the training stage, the accuracy of the proposed method increases up to 50 epochs and after the 50th epoch, there is a sudden rise in accuracy up to the 100th iteration, and after that, a rise to the 150th epoch. After an epoch value of 200, and from 250 and 300, the training accuracy remains constant for the proposed methods. Also, during testing accuracy level, after the 50th epoch there is a gradual rise in accuracy up to the 100th epoch, and after that, a sudden rise up to 200 epochs. After an epoch value of 200, and from 250 and 300, the testing accuracy re-mains constant for the proposed methods. Therefore, the proposed approach is effec-tive as, with an increase in repetitions, accuracy likewise rises to produce better out-comes.
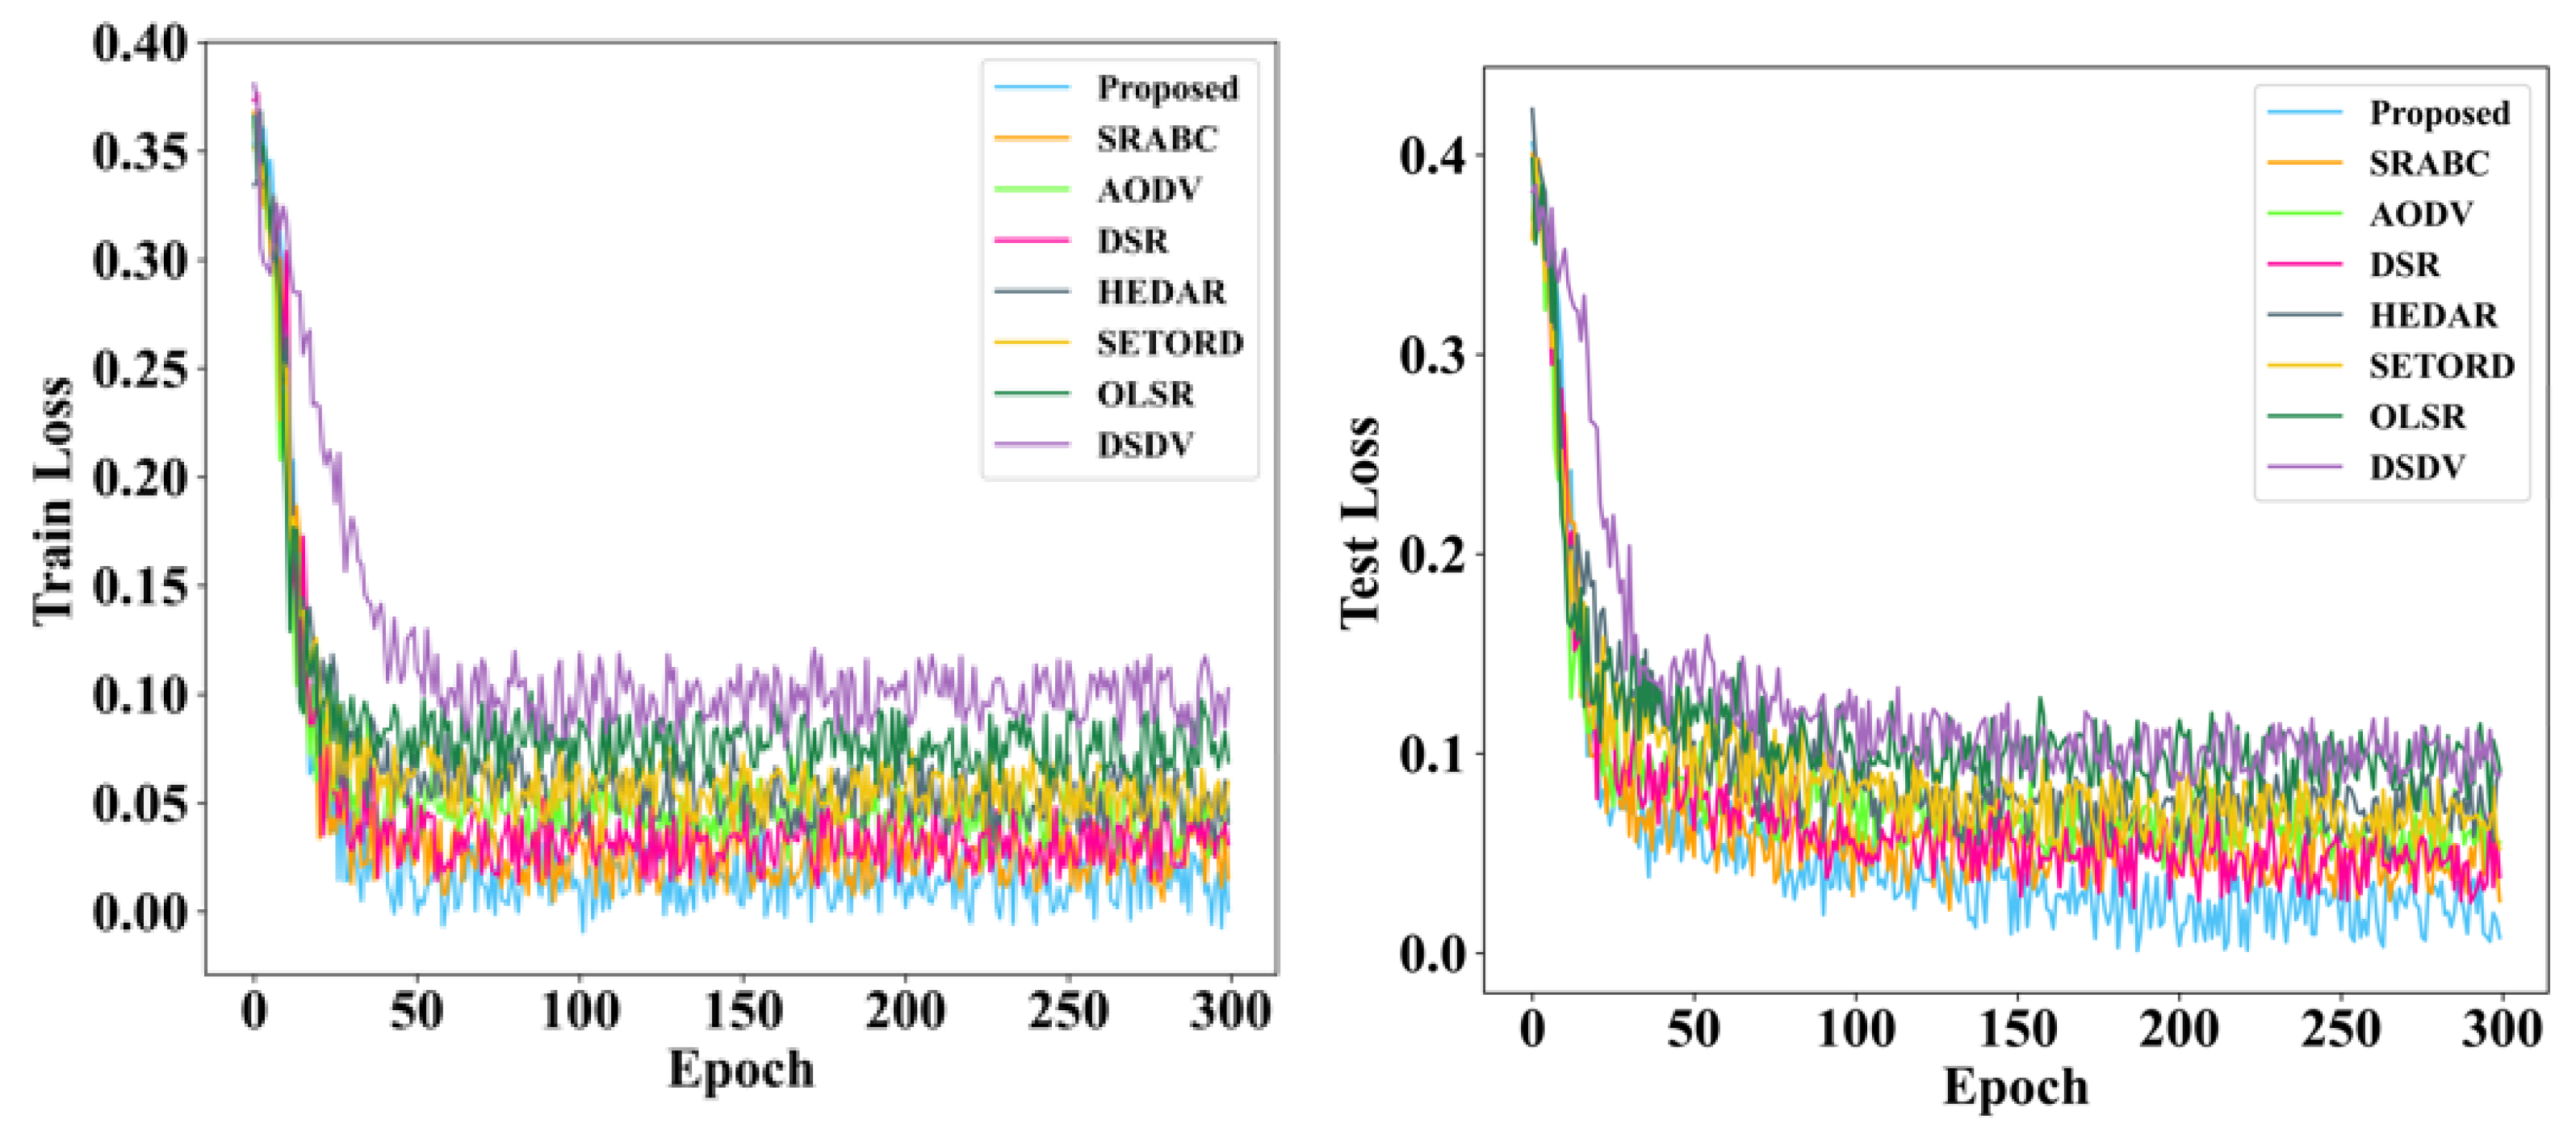
Figure 27 shows the training and testing loss of the proposed methods for different epoch values. In the training stage, the loss of the proposed method decreases up to 50 epochs, and after the 50th epoch, there is a sudden reduction in loss value. After an epoch value of 100, and from 150 to 200, the loss value shows a sudden drop, and after that, at epoch values of 250 to 300, the loss value remains constant. So, the proposed method demonstrates better outcomes than comparing to training and testing loss value.
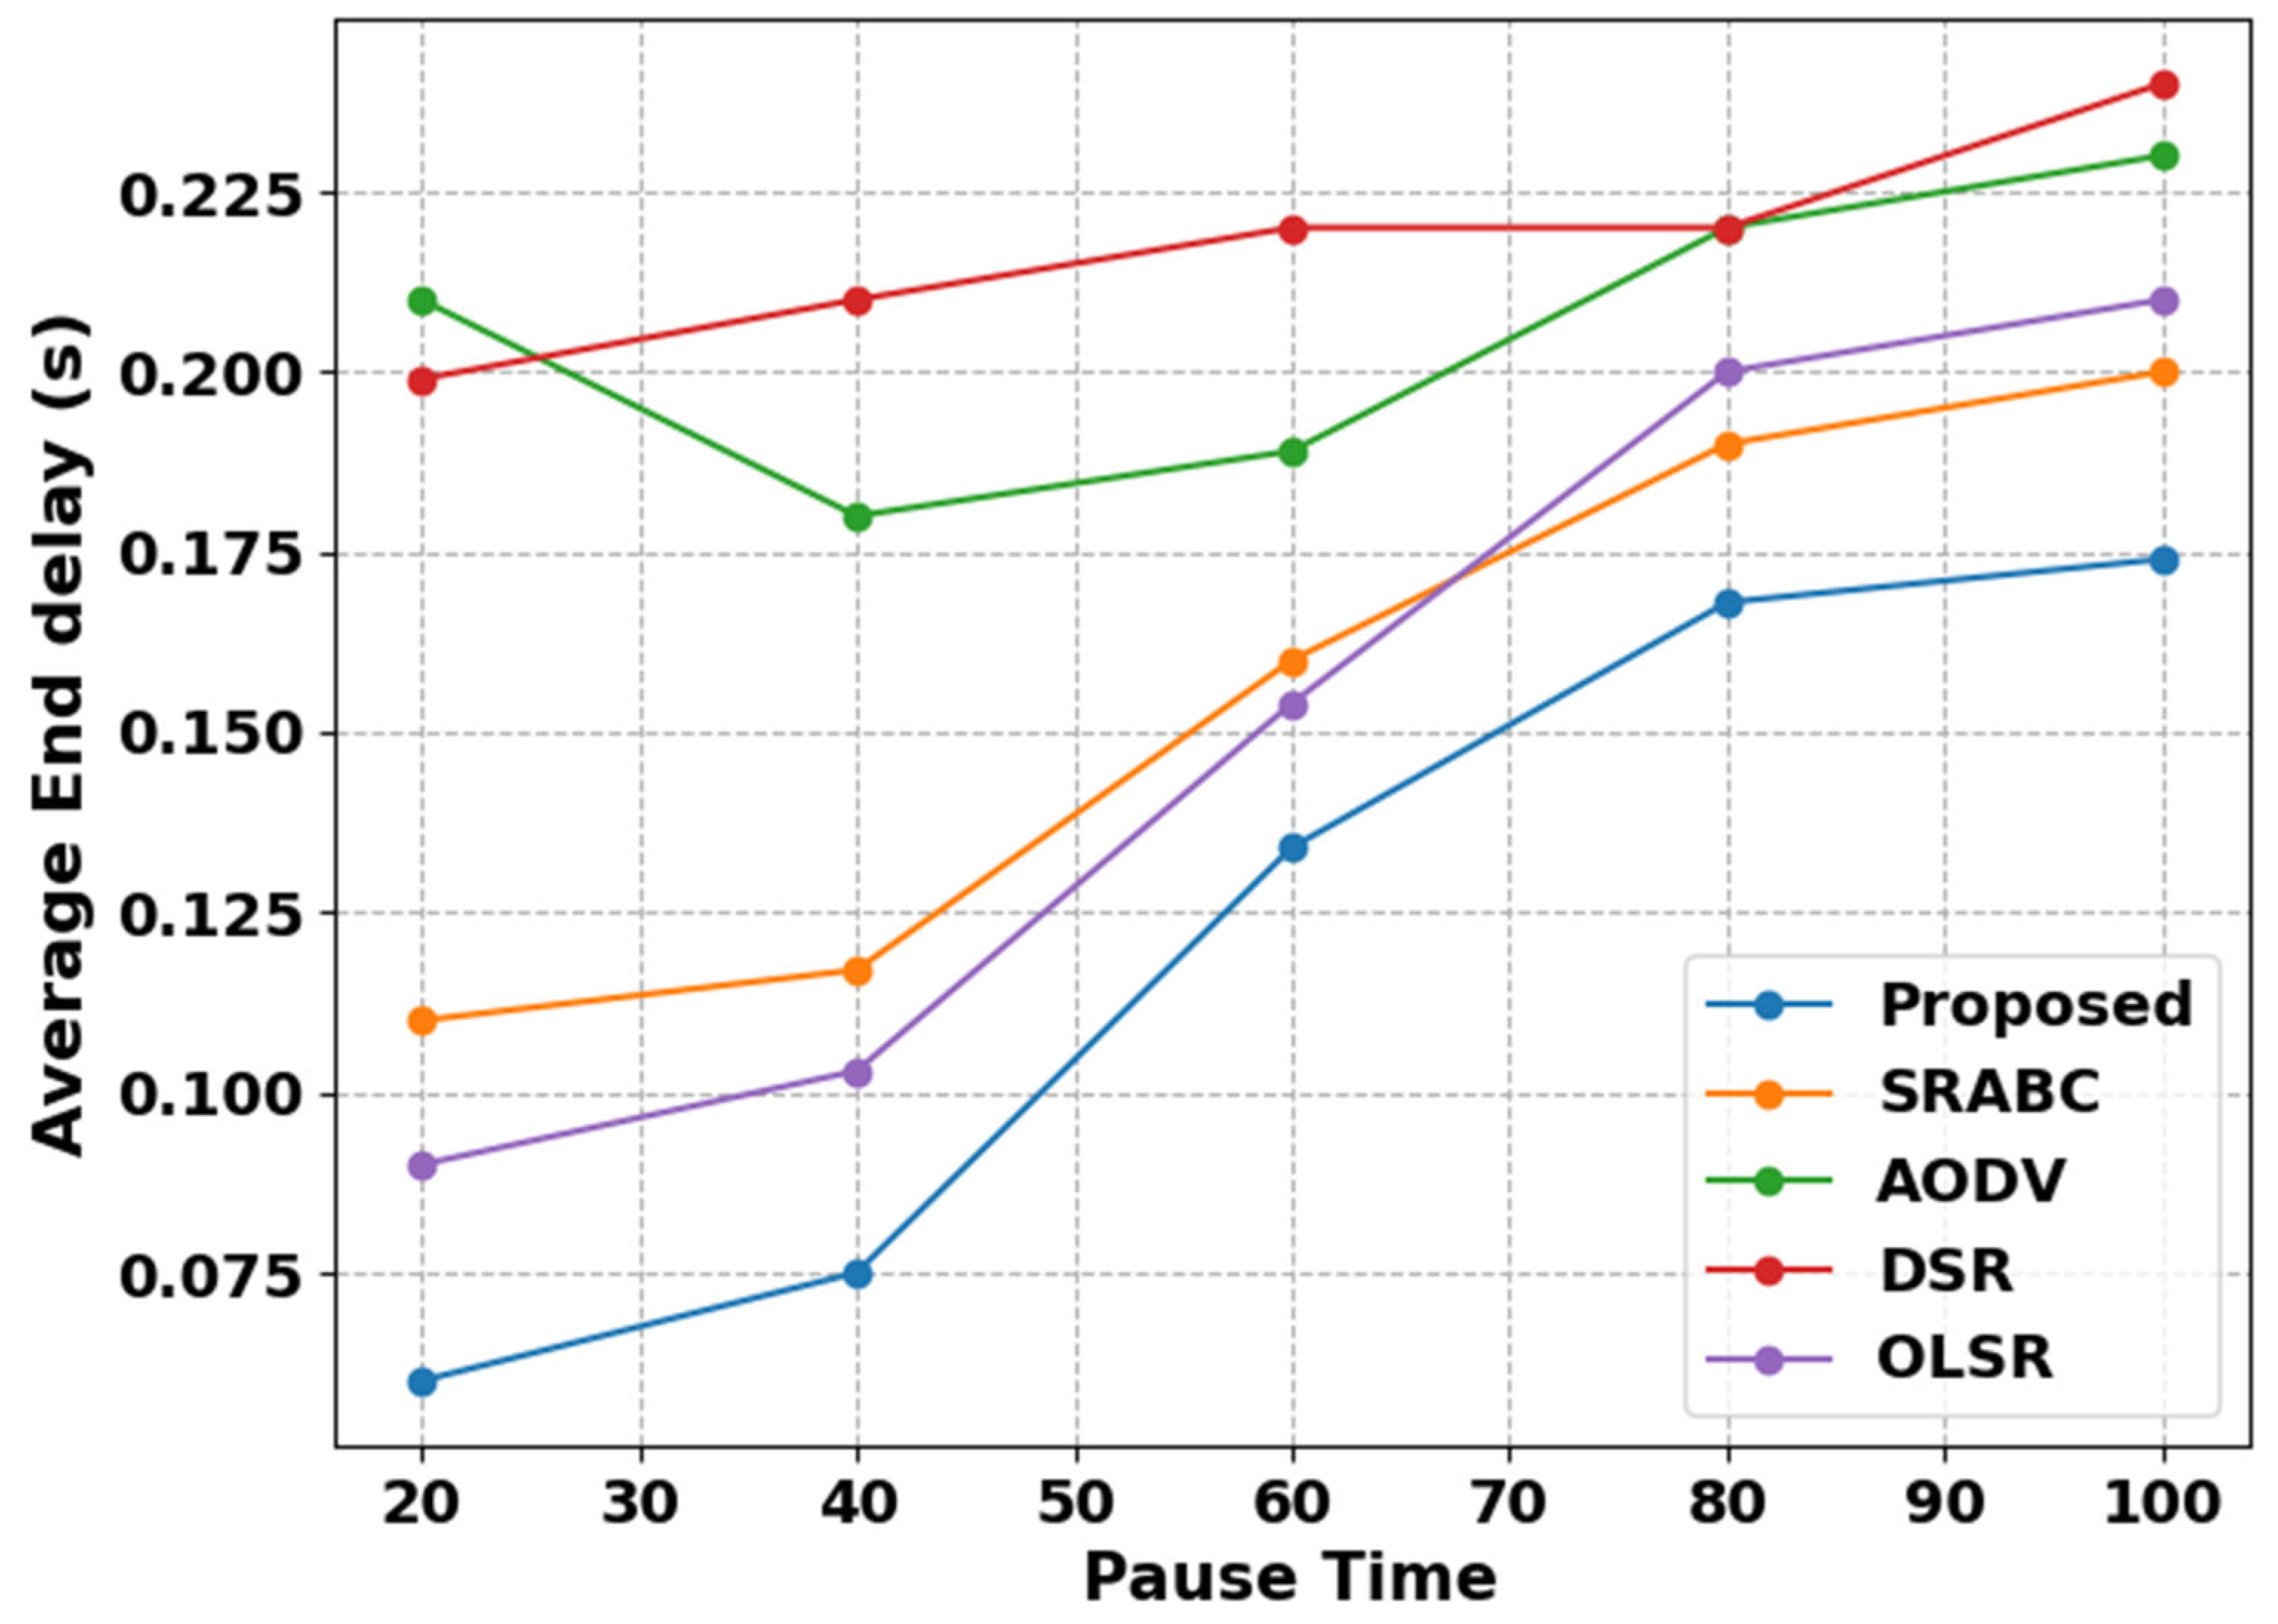
Figure 28 shows the comparison of the proposed and existing methods, with four videos for training and one for testing. For a pause time of 20, the proposed method achieves an average end delay of 0.06 s, compared to the average end delays of the ex-isting SRABC, AODV, DSR, and OLSR methods, which are 0.11, 0.21, 0.199, and 0.09 s, respectively. For a pause time of 60, the proposed method’s average end delay is 0.134 s, compared to the existing methods’ average end delays, which are 0.16, 0.189, 0.22, and 0.154 s, respectively. For a pause time of 100, the proposed method’s average end delay is 0.174 s, compared to the existing methods’ average end delays, which are 0.2, 0.23, 0.24, and 0.21 s, respectively. Thus, the existing methods have more processing time than the proposed method.
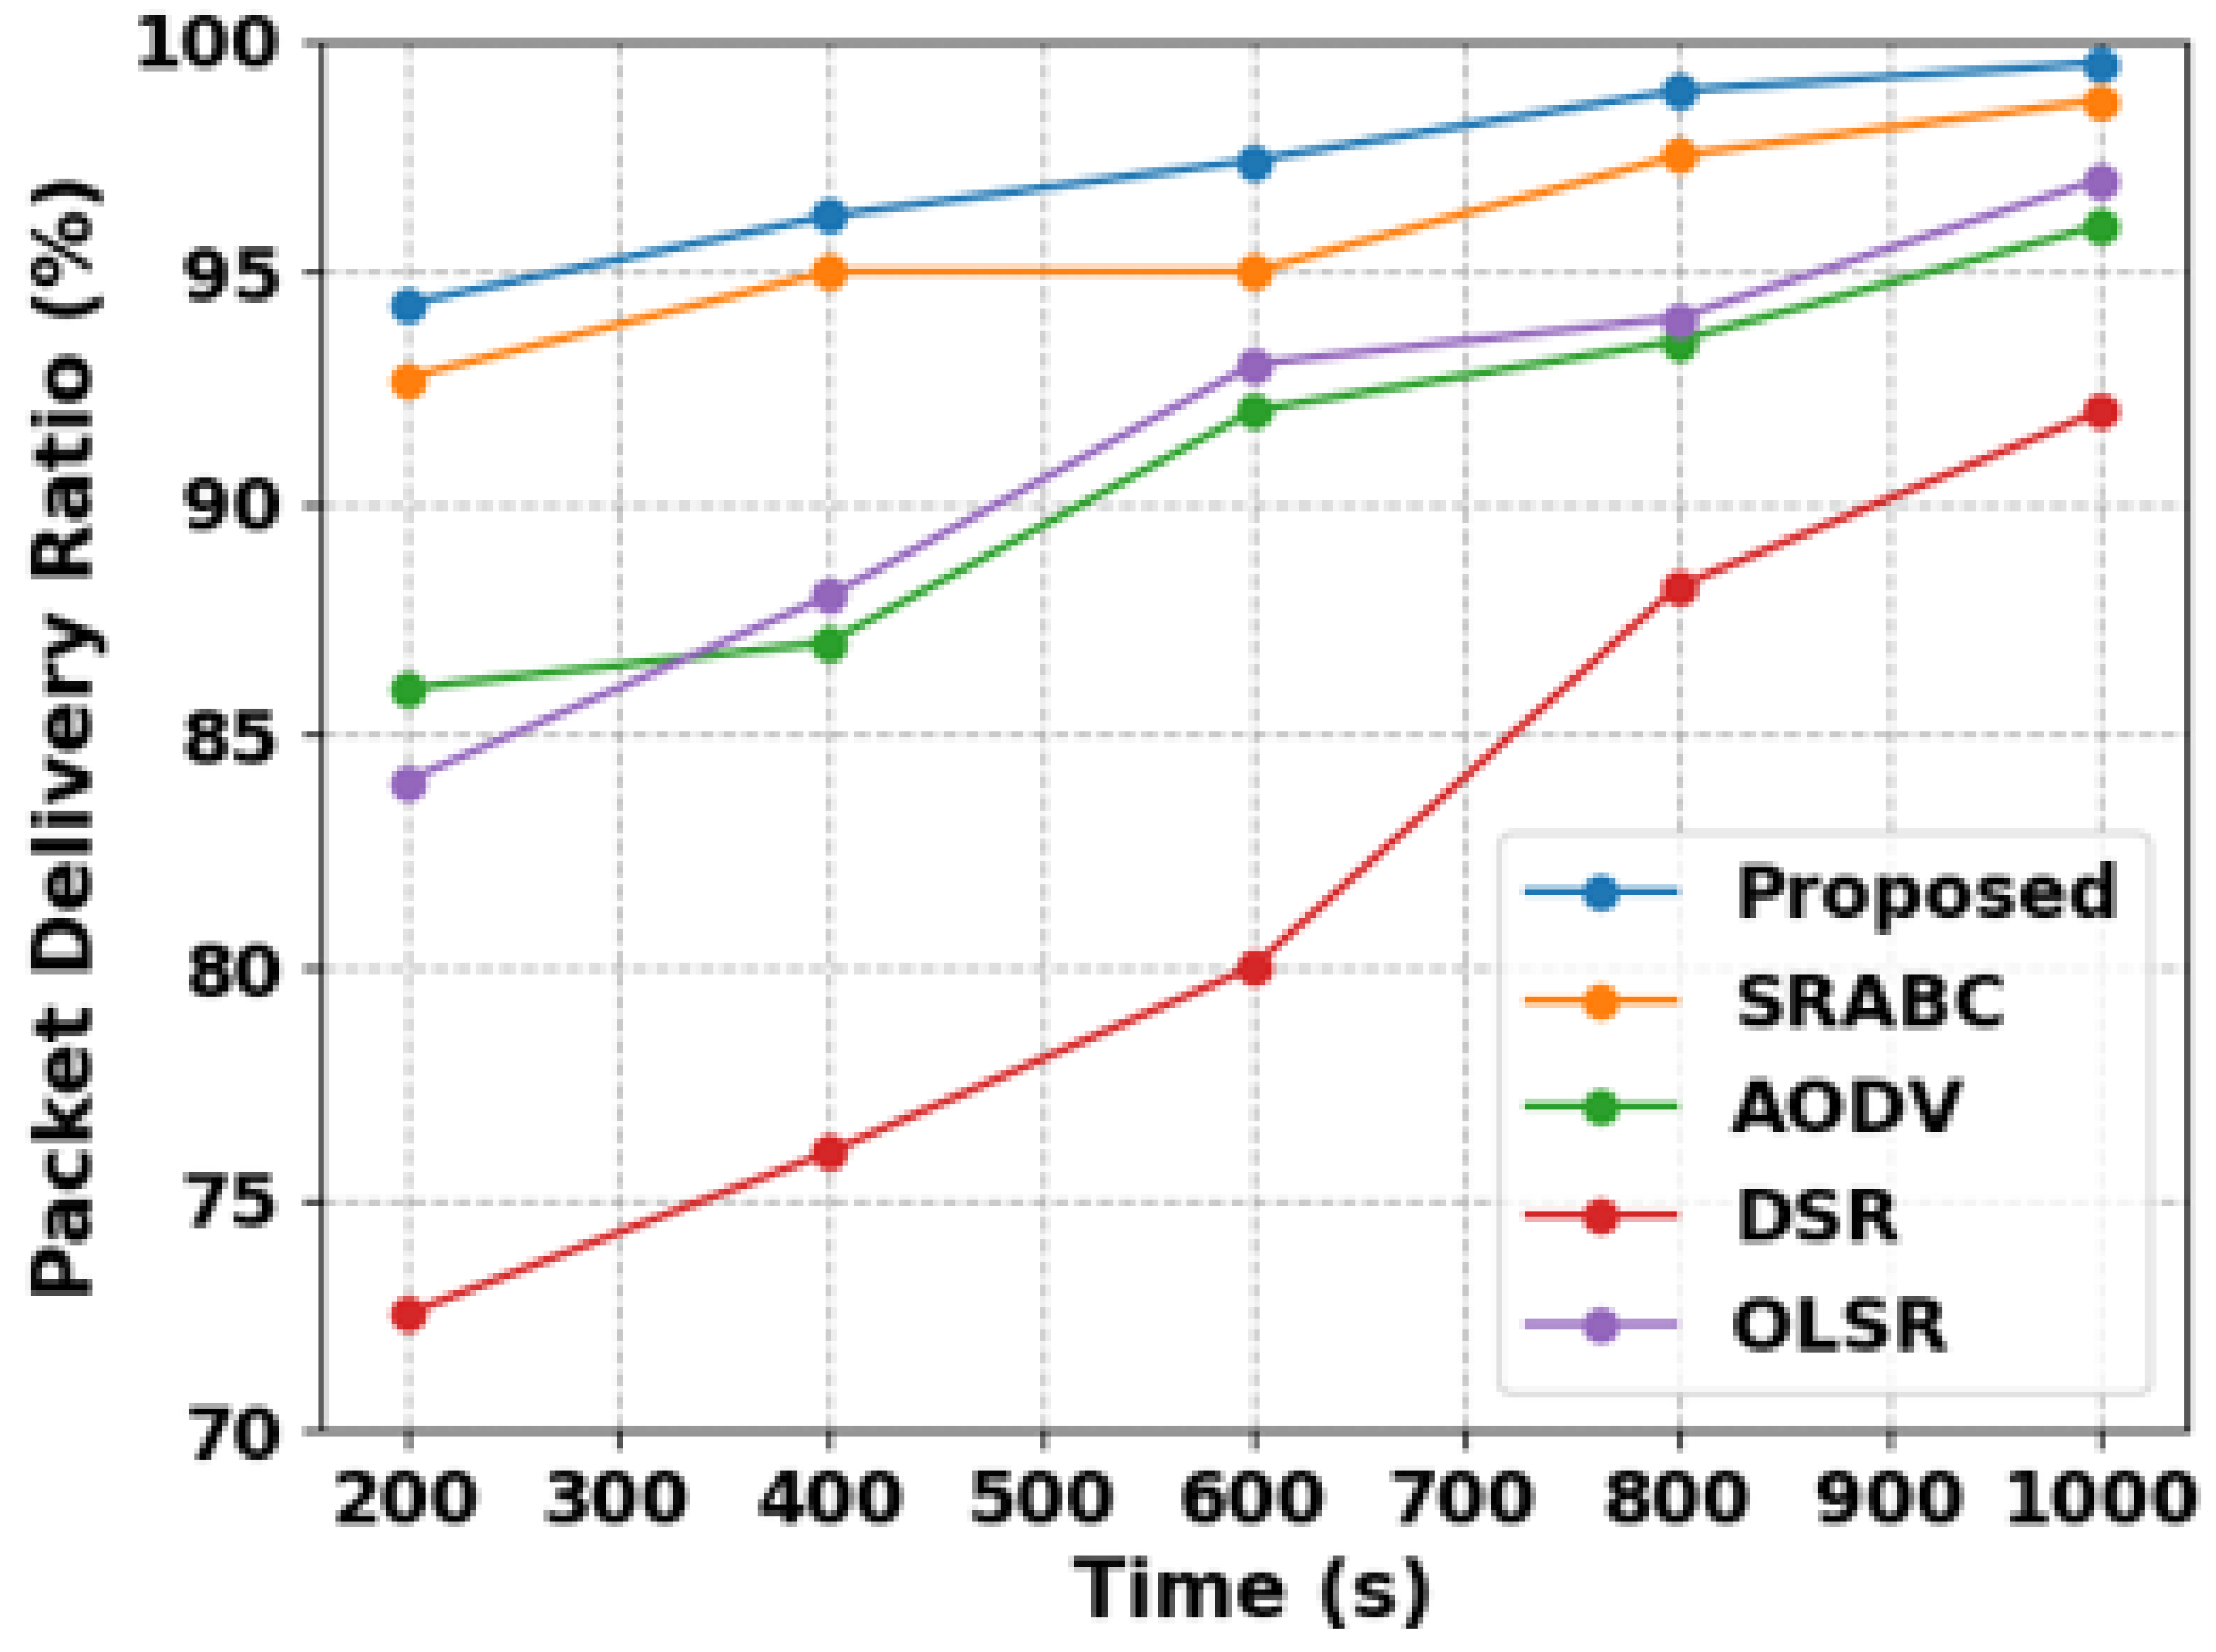
Figure 29 shows the comparison of the proposed and existing methods with five videos for training and two for testing. At a time of 200 seconds, the proposed method achieves a packet-delivery ratio of 94.3 s, compared to the packet-delivery ratios of the existing SRABC, AODV, DSR, and OLSR methods, which are 92.7, 86, 72.5, and 84 s, respectively. For a pause time of 400, the proposed method’s packet-delivery ratio is 96.2 s, compared to the existing methods’ packet-delivery ratios, which are 95, 87, 76, and 88 s, respectively. For a pause time of 800, the proposed method’s packet-delivery ratio is 98.9 s, compared to the existing methods’ packet-delivery ratios, which are 97.5, 93.5, 88.2, and 94 s, respectively. For a pause time of 1000, the proposed method’s packet-delivery ratio is 99.5 s, and the existing methods’ packet-delivery ratios are 98.7, 96, 92, and 97 s, respectively. The existing methods involve network expansion, causing congestion and poorer network performance. Also, the proposed method produces a better result.
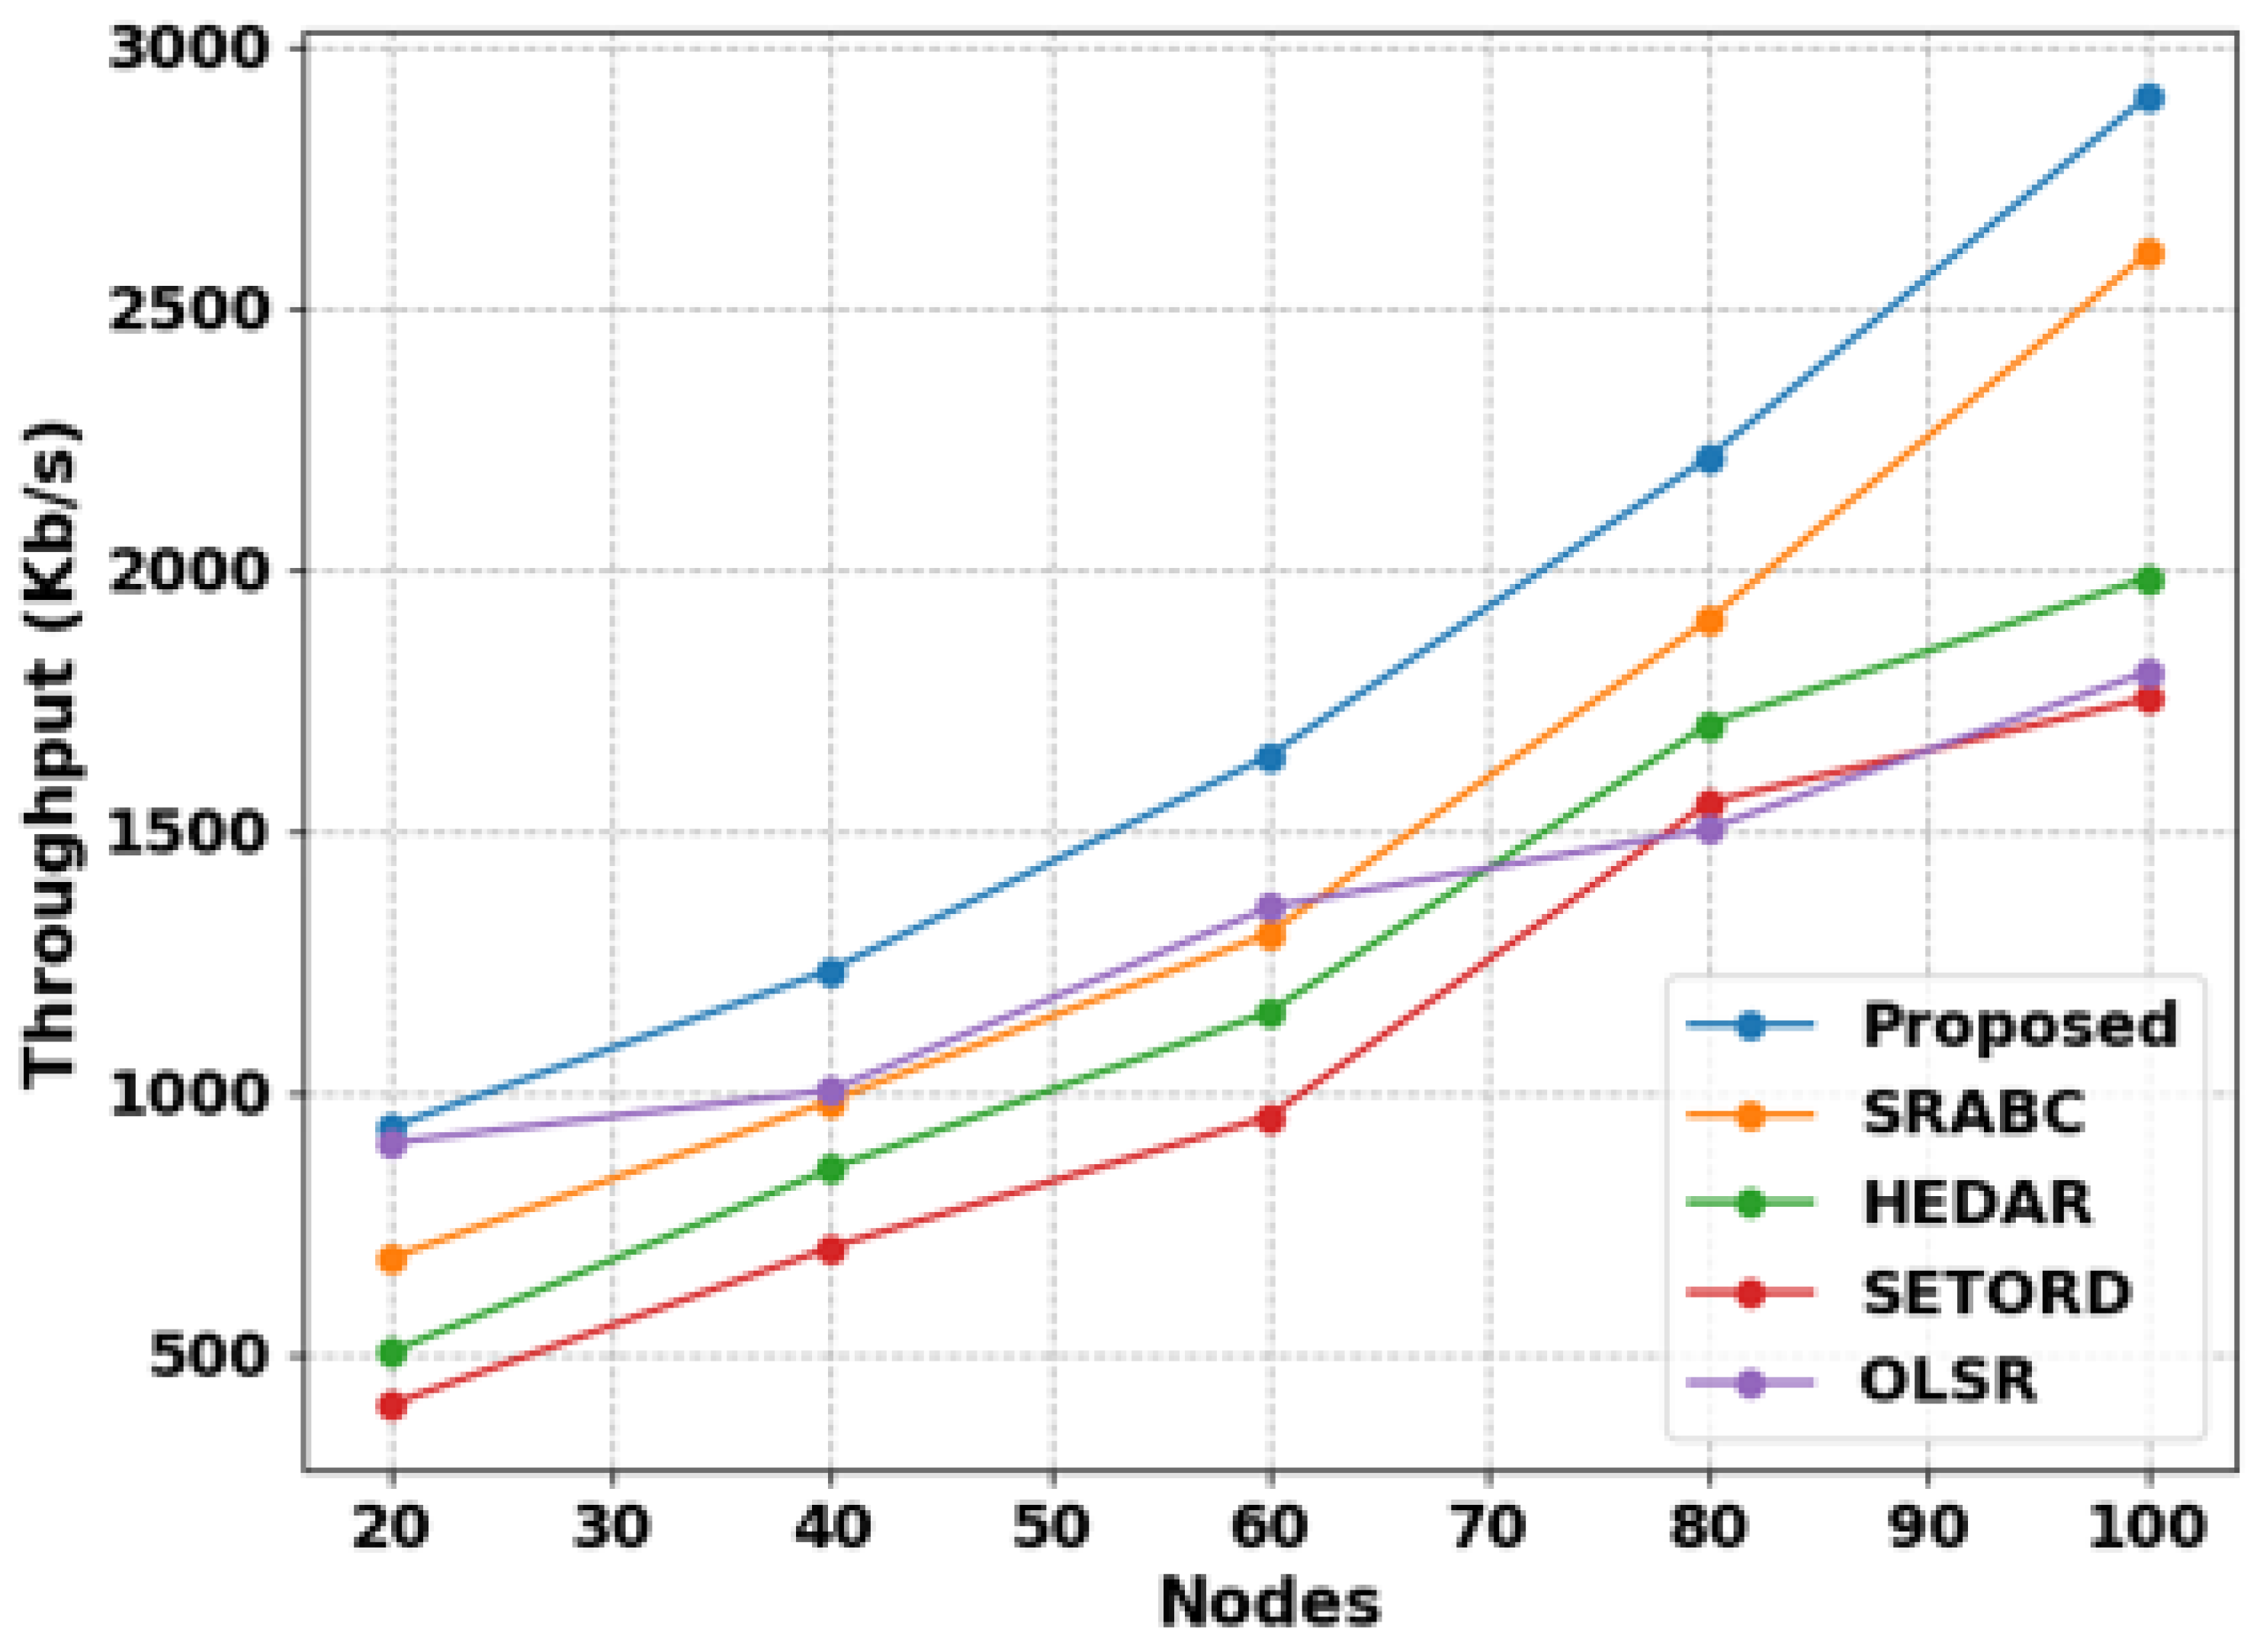
Figure 30 shows the comparison of the proposed and existing methods with six videos for training and three for testing. For 20 nodes, the proposed method achieves a throughput of 932 s, compared to the throughputs of the existing SRABC, HEDAR, SETORD, and OLSR methods, which are 682, 502, 402, and 902, respectively. For 40 nodes, the proposed method’s throughput is 1232, compared to the existing methods’ throughputs, which are 982, 852, 702, and 1002, respectively. For 80 nodes, the pro-posed method’ throughput is 2212, compared to the existing methods’ throughputs, which are 1902, 1702, 1552, and 1502, respectively. For a pause time of 100, the pro-posed method’s throughput is 2902, compared to existing methods’ throughputs, which are 2602, 1982, 1752, and 1802, respectively. The existing models need a lot of data to be trained compared to the proposed method. Table 7 shows the values of addi-tional video training and testing by varying time and nodes.

5. Conclusions and Future Scope

This paper aims to resolve the security issue with mobile ad-hoc networks. As a result, several methods are initially investigated in order to identify the network and attributes of the attacker. This study analyzes the features of deep-learning-based security detection methods, which may be useful in MANETs for developing situational suitable strategies. Firstly, the input videos are collected, and then the proposed study detected black-hole nodes that behave in a unique way from other nodes in specific conditions. This simple detection method can effectively recognize such characteristics. Next, trust value is used to assess data and network trust levels to identify attacks and offer security solutions. Then, the OLSR protocol provides an effective routing system that is employed in mobile ad-hoc networks, to decrease network-related traffic data. Then, the osprey optimization method fine-tuned the parameters such as node-stability degree and link-stability degree. Thus, interplanetary file system technology enables blockchain storage to increase the security of the MANET’s data for sharing files and applications. Finally, the validation process utilizing the delegated proof-of-stake method is possible because of the system’s higher consensus, which results in an enhanced delegation limit. The proposed model performs better in terms of AED (0.172), DP (57.6), PDR (99.8), end-to-end delay (19.1), ROH (41.7), and throughput (9100).
In the future, the system will be extended to detect a wider variety of network attacks by adding more criteria to the specified attack-detection method. The proposed method will be expanded even further to carry out efficient data-packet transfer for extensive network setups with the goal of achieving optimal link quality between mobile nodes in MANETs. Increased capacity and network durability are directly correlated with improved node links. Thus, the hyperparameters of the proposed method will be optimized, utilizing several optimization techniques, including genetic algorithms. Furthermore, other types of wireless networks, such as vehicular ad-hoc networks (VANETs) will be assessed to utilize the proposed approach in the future.

Author Contributions

Conceptualization, H.A.A. and H.A.A.A.-A.; methodology, H.A.A.; software, H.A.A.; validation, H.A.A.A.-A.; formal analysis, H.A.A.A.-A.; investigation, H.A.A. and H.A.A.A.-A.; resources, H.A.A.A.-A.; data curation, H.A.A. and H.A.A.A.-A.; writing—original draft preparation, H.A.A. and H.A.A.A.-A.; writing—review and editing, H.A.A.A.-A.; visualization, H.A.A.; supervision, H.A.A.A.-A.; project administration, H.A.A.A.-A. All authors have read and agreed to the published version of the manuscript.

Funding

This research received no external funding.

Data Availability Statement

The original contributions presented in the study are included in the article, further inquiries can be directed to the corresponding author.

Conflicts of Interest

The authors declare no conflicts of interest.

References

  1. Kanellopoulos, D. Congestion control for MANETs: An overview. ICT Express 2019, 5, 77–83. [Google Scholar] [CrossRef]
  2. Qasmarrogy, G. Optimizing Video Transmission Performance in 5ghz Manet. J. Univ. Duhok 2020, 23, 402–411. [Google Scholar] [CrossRef]
  3. Safari, F.; Savic, I.; Kunze, H.; Ernst, J.; Gillis, D. The Diverse Technology of MANETs: A Survey of Applications and Challenges. Int. J. Future Comput. Commun. 2023, 37–48. [Google Scholar] [CrossRef]
  4. Vargheese, M.; Bhatia, S.; Basheer, S.; Dadheech, P. Improved Multi-Path Routing for QoS on MANET. Comput. Syst. Sci. Eng. 2023, 45, 2521–2536. [Google Scholar] [CrossRef]
  5. Soomro, A.M.; Naeem, A.B.; Senapati, B.; Bashir, K.; Pradhan, S.; Ghafoor, M.I.; Sakr, H.A. MANET: An Improved Hybrid Routing Approach for Disaster Management. In Proceedings of the 2023 IEEE International Conference on Emerging Trends in Engineering, Sciences and Technology (ICES&T), Bahawalpur, Pakistan, 9–11 January 2023. [Google Scholar] [CrossRef]
  6. Singh, U.; Sharma, S.K.; Shukla, M.; Jha, P. Blockchain-based BATMAN protocol using Mobile ad-hoc Network (MANET) with an Ensemble Algorithm. Res. Sq. 2021. ahead of print. [Google Scholar] [CrossRef]
  7. Sirajuddin, M.; Rupa, C.; Iwendi, C.; Biamba, C. TBSMR: A Trust-Based Secure Multipath Routing Protocol for Enhancing the QoS of the Mobile Ad Hoc Network. Secur. Commun. Netw. 2021, 2021, 5521713. [Google Scholar] [CrossRef]
  8. Harikrishnan, B.; Balasubaramanian, T. Performance Evaluation of BDAG Aided Blockchain Technology in Clustered Mobile Ad-Hoc Network for Secure Data Transmission. Int. J. Adv. Comput. Sci. Appl. 2021, 12. [Google Scholar] [CrossRef]
  9. Picone, M.; Cirani, S.; Veltri, L. Blockchain Security and Privacy for the Internet of Things. Sensors 2021, 21, 892. [Google Scholar] [CrossRef]
  10. Korir, F.; Cheruiyot, W. A survey on security challenges in the current MANET routing protocols. Glob. J. Eng. Technol. Adv. 2022, 12, 078–091. [Google Scholar] [CrossRef]
  11. Sangheethaa, S. A Comparative Study for Block Chain Applications in the MANET. Int. J. AdHoc Netw. Syst. 2023, 13, 3. [Google Scholar] [CrossRef]
  12. Mouchfiq, N.; Benjbara, C.; Habbani, A. Security in MANETs: The Blockchain Issue. In Communications in Computer and Information Science; Springer International Publishing: Berlin/Heidelberg, Germany, 2020; pp. 219–232. [Google Scholar] [CrossRef]
  13. Deebak, B.D.; Al-Turjman, F. A hybrid secure routing and monitoring mechanism in IoT-based wireless sensor networks. Ad Hoc Netw. 2020, 97, 102022. [Google Scholar] [CrossRef]
  14. Barman, M.R.; Chakraborty, D.; Das, J.K. Reactive and proactive routing protocols performance evaluation for MANETS using OPNET modeler simulation tools. In Machine Intelligence and Emerging Technologies; Satu, M.S., Moni, M.A., Kaiser, M.S., Arefin, M.S., Eds.; MIET 2022. Lecture Notes of the Institute for Computer Sciences, Social Informatics and Telecommunications Engineering; Springer: Cham, Switzerland, 2022; Volume 491. [Google Scholar] [CrossRef]
  15. Jain, R.; Kashyap, I. An QoS Aware Link Defined OLSR (LD-OLSR) Routing Protocol for MANETS. Wirel. Pers. Commun. 2019, 108, 1745–1758. [Google Scholar] [CrossRef]
  16. Zhang, D.; Cui, Y.; Zhang, T. New quantum-genetic based OLSR protocol (QG-OLSR) for Mobile Ad hoc Network. Appl. Softw. Comput. 2019, 80, 285–296. [Google Scholar] [CrossRef]
  17. Jain, R. Ant Colony Inspired Energy Efficient OLSR (AC-OLSR) Routing Protocol in MANETS. Wirel. Pers. Commun. 2022, 124, 3307–3320. [Google Scholar] [CrossRef]
  18. Bhuvaneswari, R.; Ramachandran, R. Denial of service attack solution in OLSR based manet by varying number of fictitious nodes. Clust. Comput. 2018, 22, 12689–12699. [Google Scholar] [CrossRef]
  19. Wheeb, A.H.; Al-Jamali, N.A. Performance Analysis of OLSR Protocol in Mobile Ad Hoc Networks. Int. J. Interact. Mob. Technol. 2022, 16, 106–119. [Google Scholar] [CrossRef]
  20. Kanagasundaram, H.; Ayyaswamy, K. Multi Objective ALO Based Energy Efficient and Secure Routing OLSR Protocol in MANET. Int. J. Intell. Eng. Syst. 2019, 12, 74–83. [Google Scholar] [CrossRef]
  21. Prasath, A.R. Bi-Fitness Swarm Optimizer: Blockchain Assisted Secure Swarm Intelligence Routing Protocol for MANET. Indian J. Comput. Sci. Eng. 2021, 12, 1442–1458. [Google Scholar] [CrossRef]
  22. Jayabarathan, J.K.; Avaninathan, S.; Savarimuthu, R. QoS enhancement in MANETs using priority aware mechanism in DSR protocol. EURASIP J. Wirel. Commun. Networking. 2016, 2016, 131. [Google Scholar] [CrossRef]
  23. Venkatasubramanian, S.; Suhasini, A.; Hariprasath, S. Detection of Black and Grey Hole Attacks Using Hybrid Cat with PSO-Based Deep Learning Algorithm in MANET. Int. J. Comput. Netw. Appl. 2022, 9, 724. [Google Scholar] [CrossRef]
  24. Ghodichor, N.; Thaneeghavl, R.; Sahu, D.; Borkar, G.; Sawarkar, A. Secure Routing Protocol to Mitigate Attacks by Using Blockchain Technology in Manet (Version 1). arXiv 2023, arXiv:2304.04254. [Google Scholar] [CrossRef]
  25. Lwin, M.T.; Yim, J.; Ko, Y.-B. Blockchain-Based Lightweight Trust Management in Mobile Ad-Hoc Networks. Sensors 2020, 20, 698. [Google Scholar] [CrossRef] [PubMed]
  26. Srilakshmi, U.; Veeraiah, N.; Alotaibi, Y.; Alghamdi, S.A.; Khalaf, O.I.; Subbayamma, B.V. An Improved Hybrid Secure Multipath Routing Protocol for MANET. IEEE Access 2021, 9, 163043–163053. [Google Scholar] [CrossRef]
  27. Vivekananda, G.N.; Reddy, P.C. Efficient video transmission technique using clustering and optimisation algorithms in MANETs. Int. J. Adv. Intell. Paradig. 2023, 25, 248–263. [Google Scholar] [CrossRef]
  28. Sharma, R.S.; Keswani, B.; Goyal, D. Hybrid model for Protocol Independent Secure Video Transmission Using Improvised OSLR with Optimized MPR and DYDOG. J. Algebr. Stat. 2022, 13, 1669–1679. [Google Scholar]
  29. Otoum, S.; Kantarci, B.; Mouftah, H.T. Hierarchical trust-based black-hole detection in WSN-based smart grid monitoring. In Proceedings of the ICC 2017—2017 IEEE International Conference on Communications (ICC), Paris, France, 21–25 May 2017. [Google Scholar] [CrossRef]
  30. Ma, Y.-J.; Ren, Y.; Feng, P.; He, P.; Guo, X.-D.; Wei, B. Sinogram denoising via attention residual dense convolutional neural network for low-dose computed tomography. Nucl. Sci. Technol. 2021, 32. [Google Scholar] [CrossRef]
  31. Hu, J.; Yan, P.; Su, Y.; Wu, D.; Zhou, H. A Method for Classification of Surface Defect on Metal Workpieces Based on Twin Attention Mechanism Generative Adversarial Network. IEEE Sens. J. 2021, 21, 13430–13441. [Google Scholar] [CrossRef]
  32. Fang, Y.; Yang, S.; Zhao, B.; Huang, C. Cyberbullying Detection in Social Networks Using Bi-GRU with Self-Attention Mechanism. Information 2021, 12, 171. [Google Scholar] [CrossRef]
  33. Ghawy, M.Z.; Amran, G.A.; AlSalman, H.; Ghaleb, E.; Khan, J.; AL-Bakhrani, A.A.; Alziadi, A.M.; Ali, A.; Ullah, S.S. An Effective Wireless Sensor Network Routing Protocol Based on Particle Swarm Optimization Algorithm. Wirel. Commun. Mob. Comput. 2022, 2022, 8455065. [Google Scholar] [CrossRef]
  34. Dehghani, M.; Trojovský, P. Osprey optimization algorithm: A new bio-inspired metaheuristic algorithm for solving engineering optimization problems. Front. Mech. Eng. 2023, 8, 1126450. [Google Scholar] [CrossRef]
  35. Misic, J.; Misic, V.B.; Chang, X. Delegated Proof of Stake Consensus with Mobile Voters and Multiple Entry PBFT Voting. In Proceedings of the GLOBECOM 2022—2022 IEEE Global Communications Conference, Rio de Janeiro, Brazil, 4–8 December 2022. [Google Scholar] [CrossRef]
Figure 1. Block diagram of the proposed method.
Jsan 13 00022 g001
Figure 2. System model of MANETs.
Jsan 13 00022 g002
Figure 3. Black-hole detection.
Jsan 13 00022 g003
Figure 4. Architecture of SA_DCBiGNet.
Jsan 13 00022 g004
Figure 5. Dense neural network.
Jsan 13 00022 g005
Figure 6. Dense convolutional neural network.
Jsan 13 00022 g006
Figure 7. Twin-attention module.
Jsan 13 00022 g007
Figure 8. BI-GRU network.
Jsan 13 00022 g008
Figure 9. Structure of the OLSR.
Jsan 13 00022 g009
Figure 10. Flowchart of the OOA.
Jsan 13 00022 g010
Figure 11. (ad) Process of the IPFS.
Jsan 13 00022 g011
Figure 12. (ak) Comparison of proposed and existing OLSR protocols.
Jsan 13 00022 g012aJsan 13 00022 g012b
Figure 13. (ad) Node creation in the blockchain.
Jsan 13 00022 g013
Figure 14. Average end delay(s) of the proposed methods by varying pause time.
Jsan 13 00022 g014
Figure 15. Average end delay(s) of the proposed and existing methods by varying pause time.
Jsan 13 00022 g015
Figure 16. Dropped packets of the proposed and existing methods by varying time (s).
Jsan 13 00022 g016
Figure 17. Packet-delivery ratio (%) of the proposed methods by varying time.
Jsan 13 00022 g017
Figure 18. Packet-delivery ratio (%) of the proposed and existing methods by varying time.
Jsan 13 00022 g018
Figure 19. Throughput (packets) of the proposed methods by varying time.
Jsan 13 00022 g019
Figure 20. End-to-end delay (ms) of the proposed and existing methods by varying nodes.
Jsan 13 00022 g020
Figure 21. Packet-delivery ratio (%) of the proposed and existing methods by varying nodes.
Jsan 13 00022 g021
Figure 22. Routing overhead (%) of the proposed methods by varying nodes.
Jsan 13 00022 g022
Figure 23. Routing overhead (%) of the proposed and existing methods by varying nodes.
Jsan 13 00022 g023
Figure 24. Throughput (packets) of the proposed and existing methods by varying time.
Jsan 13 00022 g024
Figure 25. Throughput (Kb/s) of the proposed and existing methods by varying nodes.
Jsan 13 00022 g025
Figure 26. Training and testing accuracy.
Jsan 13 00022 g026
Figure 27. Training and testing loss.
Jsan 13 00022 g027
Figure 28. Analysis of average end delay with four videos for training and one for testing by varying time.
Jsan 13 00022 g028
Figure 29. Analysis of the packet-delivery ratio with five videos for training and two for testing by varying time.
Jsan 13 00022 g029
Figure 30. Analysis of throughput with six videos for training and three for testing by varying nodes.
Jsan 13 00022 g030
Table 1. Hyperparameters and values.
ParametersValues
Epochs10
Batch size32
LossBinary cross entropy
Learning rate0.001
Dropout layer4
Input dimension(25,1)
Output dimension(25,1)
Table 2. System configurations.
ProcessorIntel® Core (TM) i3-3245 [email protected] Ghz 3.40 GHz
Installed memory (RAM)4.00 GB (3.83 GB usable)
System type64-bit operating system
Pen and touchNo pen or touch input is available for this display
Table 3. Simulation parameters.
ParameterTypical Value
Number of nodes100
Packet ratio99.7
Node speed16 ms
Maximum node speed1–20 m/s
Data size5 MB
Pause time100 s
Size of packets512 bytes
Topology dimensions800 m × 900 m
Number of malicious nodes1–10
Network layerConvoultional, maxpooling, Bi-GRU, dropout and dense layer.
Wireless standard and speedMANET and 0.056 s
Mobility modelNS-3
Table 4. Comparison of proposed and existing methods for time.
Packet delivery ratio (%)Time (s)20406080100
Proposed72.279.582.387.691.6
SRABC69.57678.68489.1
HWMP52.5464667278.2
GRP4458606873.3
Average end delay(s)Pause time20406080100
Proposed19.220.521.322.623.6
SRABC18.219.12021.222
HWMP14.2115.516.417.7118.34
GRP12.3413.4214.3415.4516.12
Throughput (packets)Time (s)20406080100
Proposed580940123018802110
SRABC35070095015501780
HWMP17053079013321510
GRP9032058011901340
Packet delivery ratio (%)Time (s)2004006008001000
Proposed93.395.296.498.199.2
SRABC91.7949596.598
AODV84859091.594
DSR71.5757987.291
Dropped packetsTime (s)0100200300400
Proposed12.230.641.848.557.6
SRABC19.539.348.558.569.7
AODV46607988.589
DSR6176909899.5
Average end delay(s)Pause Time20406080100
Proposed0.040.0730.1320.1660.172
SRABC0.090.1150.1580.1880.198
AODV0.190.1780.1870.20.21
DSR0.1970.190.20.2180.22
Table 5. Analysis of throughput (packets) time.
Throughput (packets)Time (s)2345678910
Proposed610064006710720074007900810086009100
SRABC210030003700400046005000595066008500
OLSR5719.185956.026193.416359.546415.36489.486891.277237.067637.46
AODV175023003100365041504650515054006700
DSR150021003000360041004600505053506250
DSDV3141.673341.943560.354141.624233.524289.284436.714546.724656.69
Table 6. Comparison of proposed and existing methods for nodes.
Routing overheadNodes20406080100
Proposed415.531.242.164.3
SRABC921374869
HWMP1224415374
GRP1732536182
Throughput (Kb/s)Nodes20406080100
Proposed9301230164022102900
SRABC680980130019002600
HEDAR500850115017001980
SETORD40070095015501750
Packet delivery ratio (%)Nodes20406080100
Proposed9999.199.499.699.8
SRABC98.798.899.299.499.5
HEDAR9696.897.498.599.4
SETORD9596.29798.299.1
End-to-end delay (ms)Nodes20406080100
Proposed15.216.316.618.419.1
SRABC16.517.818.219.419.7
HEDAR17.31819.120.121
SETORD18.419.12021.322
Routing overhead (%)Nodes20406080100
Proposed514.62630.441.7
SRABC8.719293545
HEDAR927324760
SETORD1022374869
Table 7. Values of additional videos for training and testing by varying time and nodes.
Average end delay 20406080100
Proposed0.060.0750.1340.1680.174
SRABC0.110.1170.160.190.2
AODV0.210.180.1890.220.23
DSR0.1990.210.220.220.24
OLSR0.090.1030.1540.20.21
Packetdelivery ratioProposed94.396.297.498.999.5
SRABC92.7959597.598.7
AODV86879293.596
DSR72.5768088.292
OLSR8488939497
ThroughputProposed9321232164222122902
SRABC682982130219022602
HEDAR502852115217021982
SETORD40270295215521752
OLSR9021002135215021802
Disclaimer/Publisher’s Note: The statements, opinions and data contained in all publications are solely those of the individual author(s) and contributor(s) and not of MDPI and/or the editor(s). MDPI and/or the editor(s) disclaim responsibility for any injury to people or property resulting from any ideas, methods, instructions or products referred to in the content.

