1. Introduction
Prognostics and health management (PHM), as well as machine condition monitoring (CM), are industrial maintenance paradigms that involve analyzing signals from sensors on machinery for signs that maintenance is or will be needed [
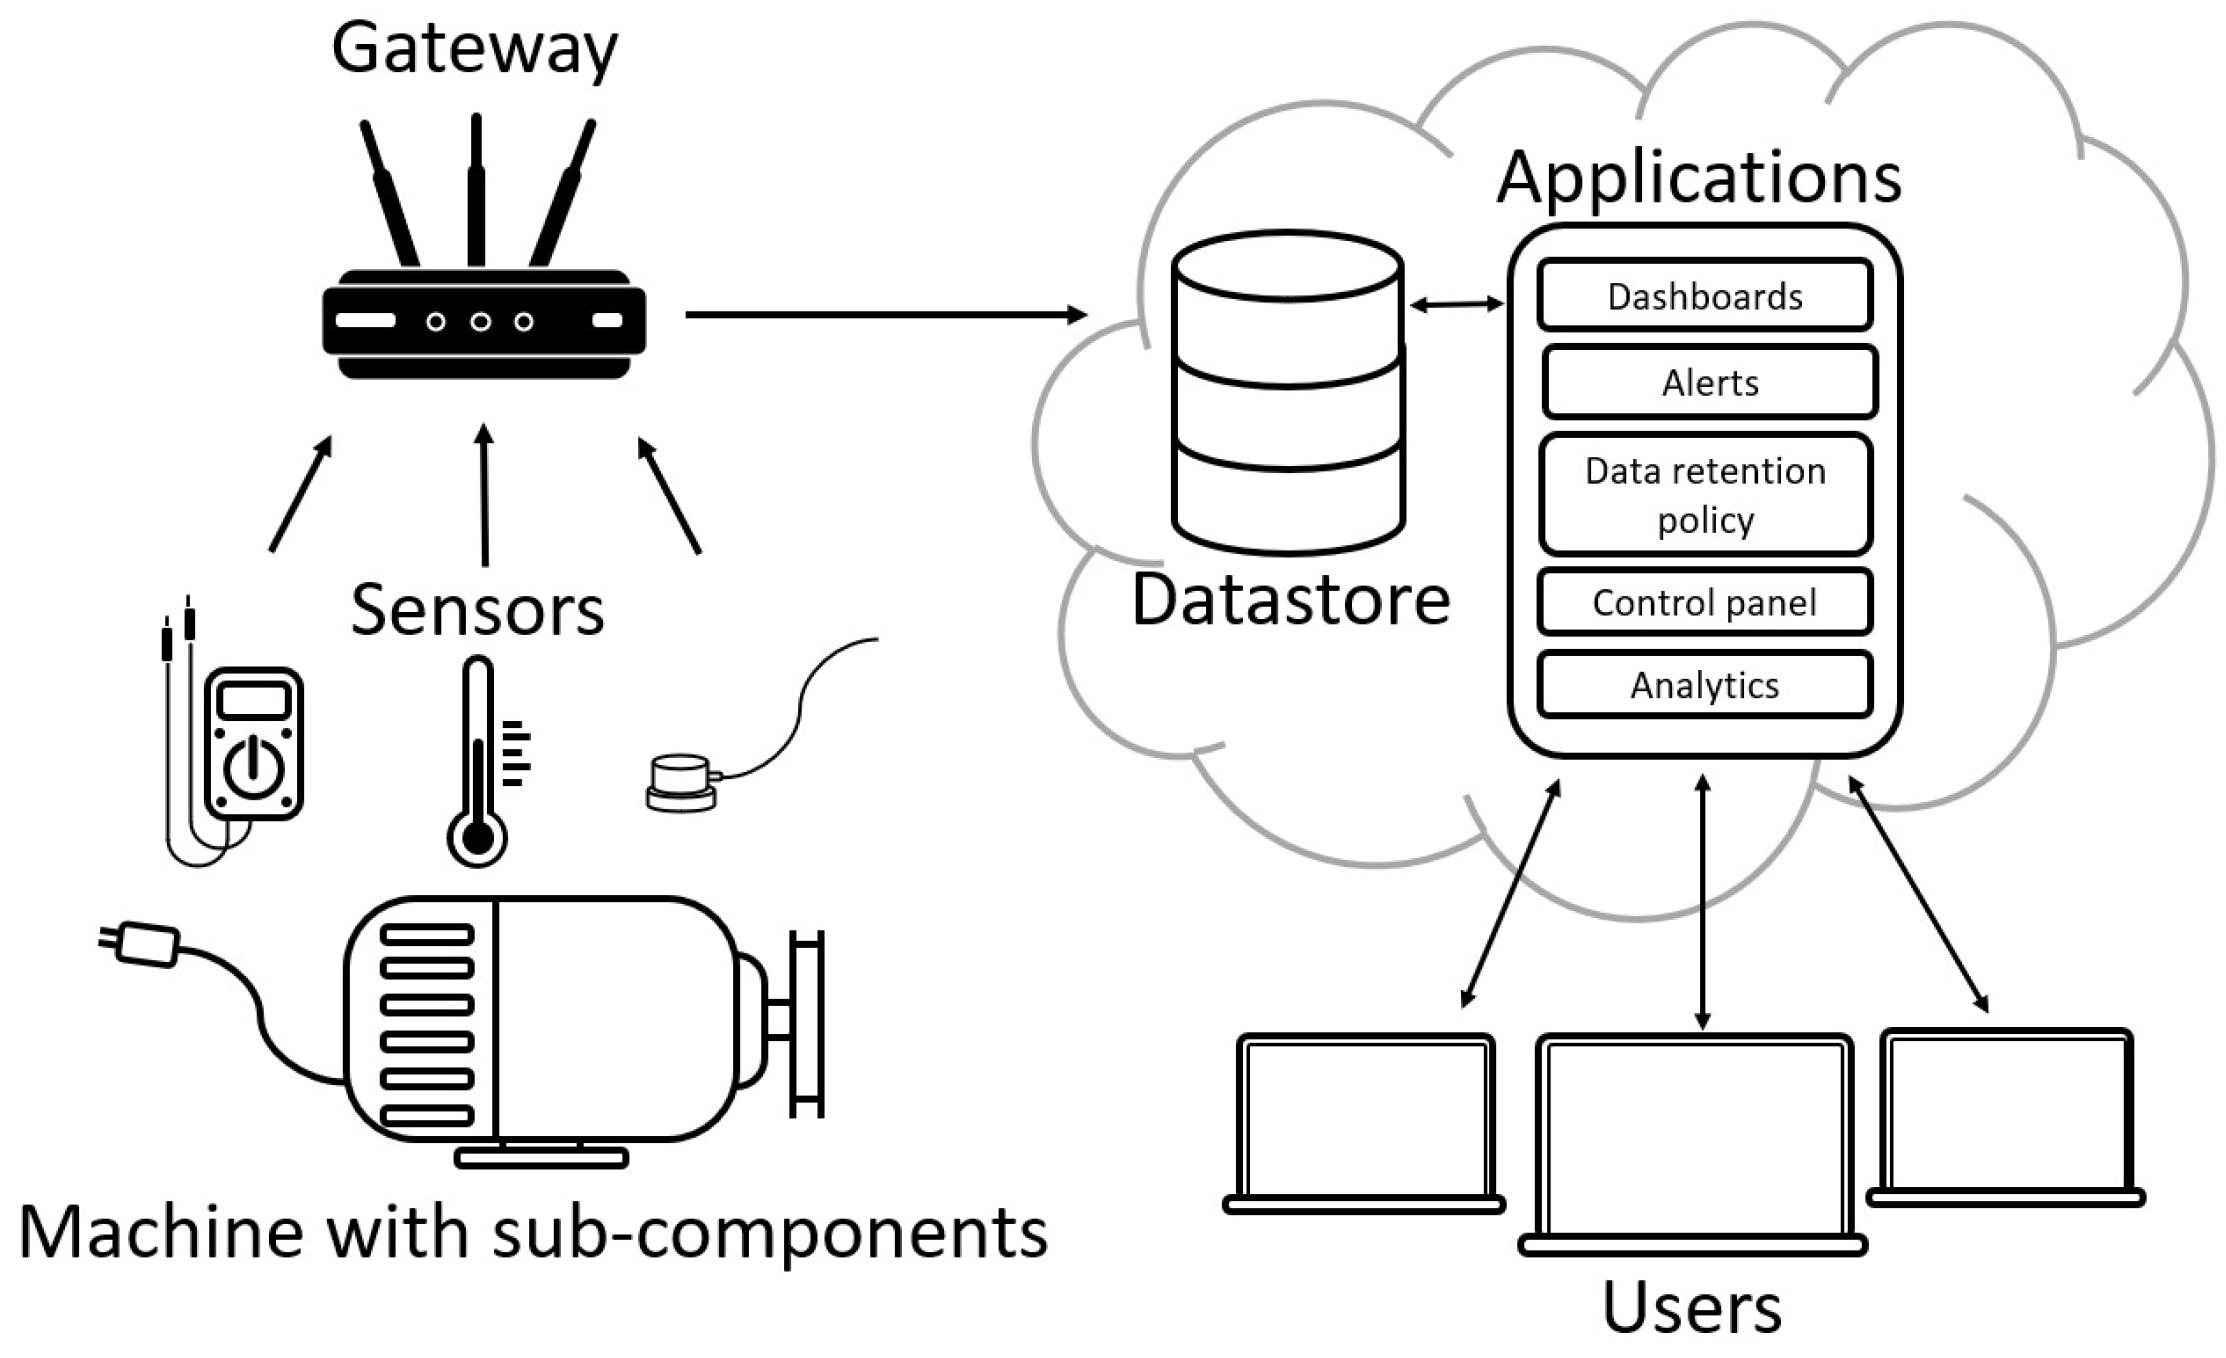
1]. Many types of signals are used in PHM, including vibrations, acoustical emissions, temperature, current draw, rotational speed, and many others. Collection and analysis of signals allows users to schedule maintenance interventions for optimal productivity, while preventing unexpected downtime or accidents. Industrial sectors for which operational interruptions are costly may benefit the most from CM systems. These sectors include power generation (e.g., wind turbines), advanced manufacturing, and transportation. The implementation of large-scale CM might require the installation of many sensors, gateways, or aggregation devices, data storage, and some level of automated analysis and alert issuing. With the advent of internet of things (IoT) technology, large-scale cloud network CM is becoming much more common. A generic example of such a sensor network with remote data storage is illustrated in
Figure 1.
Several factors determine the volume of raw data that can be generated in a CM system, including the size of raw data from individual measurements, the frequency at which measurements are taken, the number of sensors installed on a component, and the number of components being monitored. Additional factors can increase the heterogeneity and complexity of the information being stored. These include different types of machines, components, and types of sensors involved in the application. Detailed consideration of the organization of the information and the development of an ontology is thus warranted. Ontology involves the formal representation of the entities defined in a domain [
2]. There are various ontology development methodologies and notations. Lunat and Guha [
3] proposed a process to create an ontology that describes shared knowledge through the steps they took to develop their CYC ontology in the AI domain. Their process includes: (1) manual extraction of shared terms and a simple diagram for representing them; (2) computer-aided representations; and (3) device-level extraction and representations.
Conventional relational (table-oriented) and non-relational (NoSQL) databases (DBs) have both been used for live metric monitoring applications, as will be discussed in
Section 2. Non-relational databases, such as key-value and document-oriented databases, are generally preferred for their support of heterogeneous datatypes, as they can be useful in evolving applications. Relational databases are preferred because of their inherent enforcement of data uniformity and intuitive structure.
Specialized relational and non-relational databases have been developed to meet the needs of IoT systems and other live metric-monitoring applications (such as web traffic monitoring). A time series database (TSDB) is optimized for time-stamped data, often measurements or metrics [
4]. These can be optimized around the assumptions that certain time aggregation queries might be run frequently, that data from similar time periods might be queried together frequently, and/or other assumptions around the data’s temporal nature. A summary of popular open-source TSDBs is given in
Section 4.
Machine learning (ML) approaches are increasingly popular for condition monitoring applications [
5,
6], and these can benefit from TSDBs that are specifically designed for this use. For one, the success of ML algorithms is strongly dependent on the amount of quality, labeled data available. While current IoT CM systems tend to only keep processed frequency representations, different ML approaches tend to use a variety of input representations obtained by transforming or extracting features from raw measurements. So, to maximize flexibility, it would be beneficial to retain raw measurements. A TSDB can accommodate this by retaining historical data, as well as by hosting data from many sensors on related machinery. However, a problem that often occurs with raw health measurement practices is class imbalance (i.e., significantly more healthy data are collected than faulty data) and insufficient properly labeled health status labels (e.g., faults). Therefore, the TSDB also helps enforce the storage of contextual information to form the basis of regression or classification labels. The ability to efficiently filter data and select the most appropriate measurements for training and validation is key.
Several studies that are presented in
Section 2 lean towards the general acceptance of non-relational TSDBs for PHM and similar applications. This preference typically stems from the flexibility of NoSQL databases (as they do not necessitate a predefined schema), their capability to handle diverse data, and the ease with which they can be scaled and distributed across various data centers. It is essential, however, to note that this does not diminish the value of relational databases in such applications.
A well-structured approach is needed to support data collection, labelling, and overall management on a larger scale, as well as to enhance the further development of ML in PHM and industrial asset CM. This paper offers the following contributions:
It describes a flexible ontology suitable for managing machine health data in context;
It reduces the need for data wrangling or pre-processing, streamlining data operations;
It provides a standardized data approach that supports larger scale data collection to advance ML for PHM and CM;
It provides an example implementation of the ontology in PostgreSQL with sample data and queries.
In fact, this paper proposes a relational database schema that can cater to numerous use cases and be readily adapted for additional scenarios. The relational database model, with its consistency and structured nature, can be advantageous, particularly when data are being prepared for deep learning algorithms, where uniformity of data can speed up data cleaning and preparation. The scaling of the database engine, a pivotal aspect in the evolution of deep learning in PHM, is a challenge that modern relational databases can adequately address.
The remainder of this paper is organized as follows:
Section 2 provides a summary and review of the relevant literature. The proposed schema and the design principles behind it are detailed in
Section 3.
Section 4 discusses the database engine selection process and gives a rationale for this paper’s use of PostgreSQL in the sample implementation presented in
Section 5. A discussion of outcomes and conclusions are given in
Section 6 and
Section 7, respectively.
2. Previous Work
Wang et al. give a concise and informative discussion of the physical processes and control systems involved in industrial settings [
7]. The hardware–software system they propose is one of many that could provide the means of implementing this paper’s data ontology or one like it.
Mehmood et al. discuss modeling the temporal aspects of data in MongoDB and provide a good discussion of the data storage paradigms and considerations one should undertake when designing data infrastructure [
8]. They also compare different strategies to utilize document-oriented storage for time series data. One approach is to create a new document for each timestamp. A nested-document approach is also described with per-hour documents containing per-second sub-documents. Document nesting is one of several practices that can significantly increase query and read time.
Several TSDB comparisons have been published, most using generic narrow-table measurement schemas. Jensen et al. analyzed and classified time series management systems in academic publications up until late 2016 [
9]. They discussed the trend of general datastores being repurposed for time series and advocated for the development of more specialized solutions. Meng et al. presented an integrated sensing, communication, storage, and alerting system for monitoring vibrational anomalies at construction sites [
10]. They used a MySQL table to store raw data, processed data, and the results of analyses. They also partitioned the database by automatically creating a new table daily. If characteristics of the measurement data were revised, such as measurement duration or data type, a new table fitting the revised data structure was generated.
Incipini et al. compared the performance of three different database management systems for a light monitoring application [
11]. They recommended a schemaless database be chosen for IoT applications since they can accommodate heterogeneous data well, and IoT tends to be dynamic, where the types of measurements taken may change over time. Their test results indicated that MongoDB was the best choice among those tested, which also included CouchDB and MariaDB. Villalobos et al. proposed a three-level hierarchical architecture for data retention, where the most recent raw data are stored on solid state drives, and are transferred in a reduced and cleaned form to hard disk drives in the second and third layer after one month and one year, respectively [
12]. A novel time series reduction method was used for the third layer, extending the storage period on limited disk space. They tested and compared different types of databases to achieve this: a TSDB (InfluxDB), wide-column store (Cassandra), document store (MongoDB), and graph store (Neo4J). Temperature data from a manufacturing facility were used in testing. They found that the TSDB significantly outperformed the storage use and query execution time of other databases.
Zehara and Yfantidou performed various benchmark tests between InfluxDB, SQL Server, Cassandra, Elasticsearch, and OpenTSDB databases [
13]. They found that InfluxDB outperformed all other databases tested in terms of disk size, query performance, and write performance.
Petre et al. compared InfluxDB, Graphite, Round Robin Database Tool (RRDTool), Prometheus, OpenTSDB, and TimescaleDB using a multi-attribute maturity model [
14]. The inputs to their model did not include any performance data, but instead combined several quantitative and qualitative measures such as the number of lines of code, the ratio of open to closed bugs, and support for standard query languages, among others.
Recently, Yang et al. [
15] developed a general data ontology for representing industrial production workflows by describing data using a model of manpower, machine, material, method, and measurement. The authors cited the need for greater interoperability of data models as motivation for their work. While their ontology does accommodate aspects of measurement, its broad focus on the whole industrial workflow means that specific aspects useful for predictive maintenance, and ML-driven PHM in particular, are not described in detail. Ramonell et al. [
16] also recently developed a knowledge graph-based data integration system for digital twin asset management. Graph networks efficiently store data about related entities and can offer more flexibility than strictly relational databases. However, this can also lead to a greater need for data cleaning and structuring to prepare data for use in developing and applying ML models. Bakken and Soylu [
17] developed a query engine for databases having static aspects of assets represented in a graph network, while dynamic aspects (such as measurements) are stored in a generic TSDB. This offers some computational advantages, but challenges remain related to data structuring and preparation for ML.
Other sectors involving high-dimensional multi-time series data have similar requirements for TSDBs and can provide additional insights. For monitoring human health via bodily signals, Simanjuntak and Surantha propose an architecture having a relational database and a message queue telemetry protocol (MQTT). Additionally, Shen et al. [
18] identified issues of scaling TSDBs for IT infrastructure monitoring, especially as they may have very high numbers of metrics. To address this, they propose a novel TSDB platform, which scales as well as integrates ML features.
3. Outline of Proposed Schema
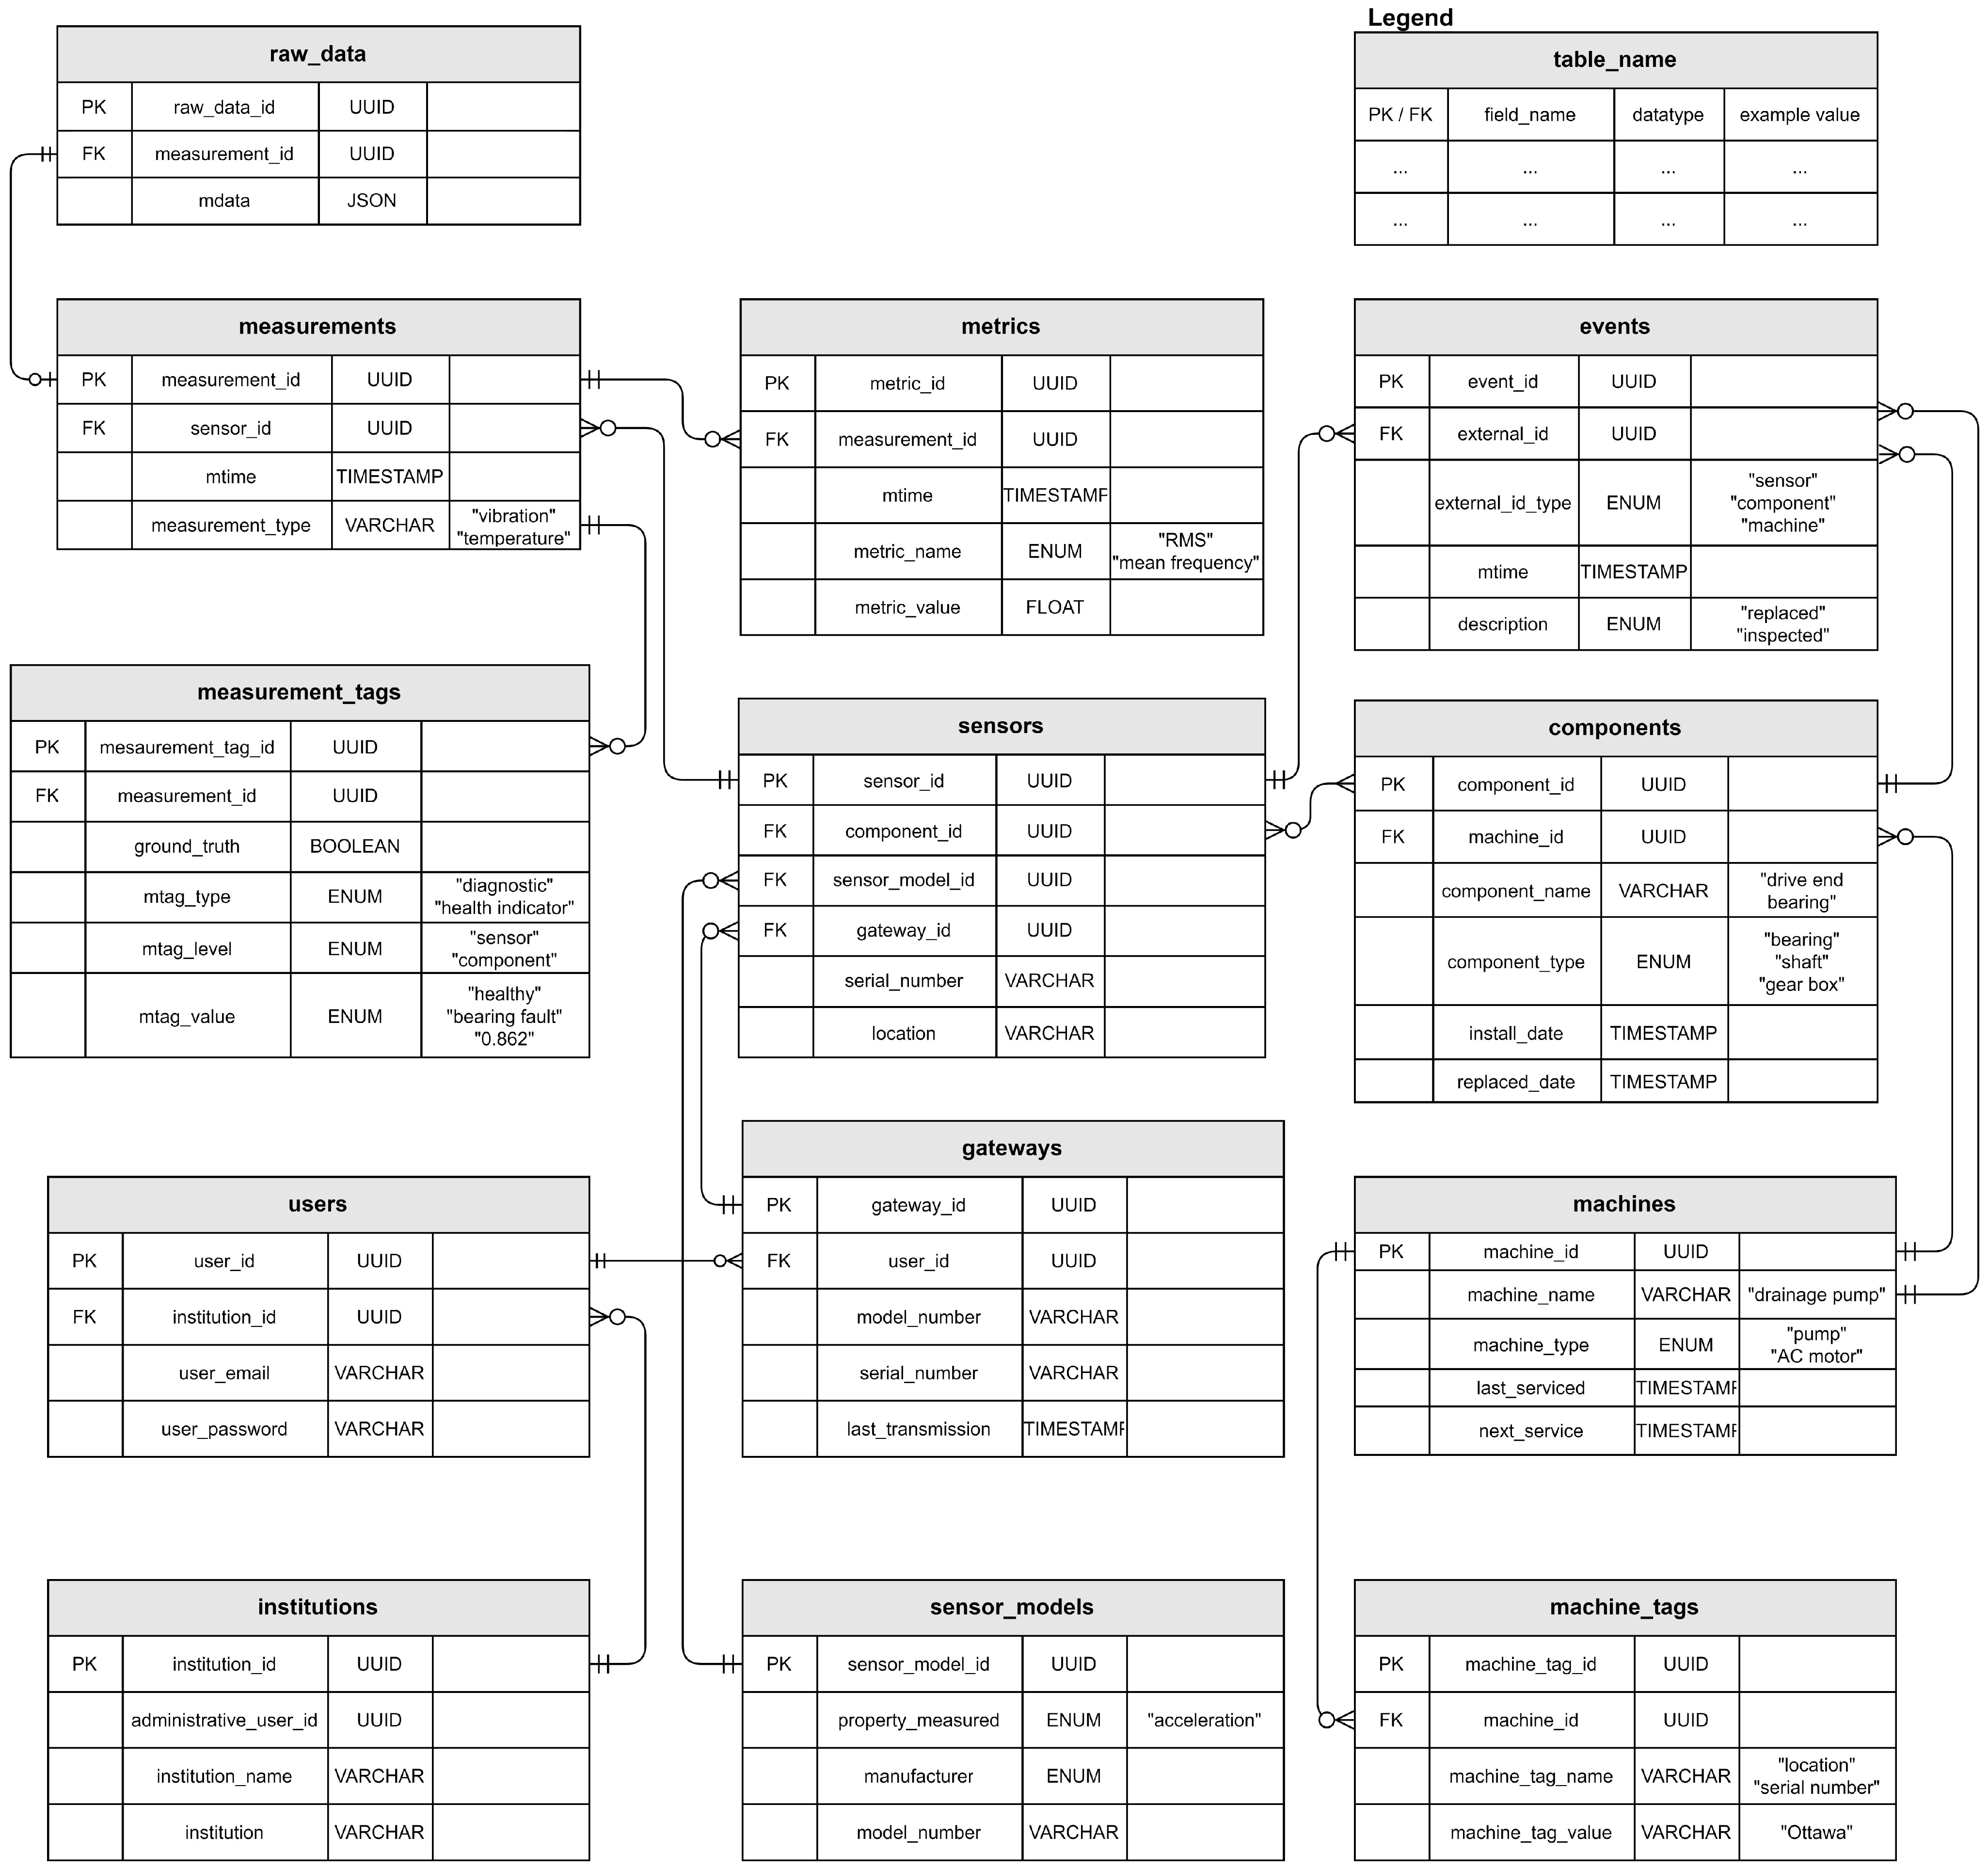
An entity relation diagram (ERD) of the proposed schema is given in
Figure 2. The design principles and considerations that culminated in the schema took into account the complex, multi-faceted nature of data in PHM. Recognizing the diverse needs and objectives of potential users, the schema emphasizes flexibility and adaptability, offering a structure that can accommodate different types of sensor data, a variety of metrics, and an array of contextual information. Flexibility is derived from the incorporation of semi-structured attributes within a structured relational schema. Specifically, this occurs in the tables wherein key-value records are stored (measurement_tags and machine_tags), as well as the metrics table. These key-value pairs offer flexibility as they can be adapted for various PHM applications (i.e., different kinds of industrial operations), while still lending overall structure to the data.
A priority of the schema is to enable a robust yet flexible framework that can manage some variability with respect to the particularities of the institution, machinery, sensors, and data involved, while still enforcing a useful structure. With an understanding that raw data and derived metrics each have their unique roles in the PHM landscape, the schema allows for the storage, retrieval, and utilization of both.
An important feature that differentiates the schema from those discussed in
Section 2 is its ability to extract and retain meaningful features from raw data for classical machine learning methods while still retaining raw data for potential future use, promoting research diversity and innovation. This design decision acknowledges that in the realm of PHM, the ability to revisit raw data for reanalysis and reapplication is highly valuable. Further, the schema was designed with the understanding that measurements, machine components, and sensor data do not exist in isolation but rather within a rich web of context and relationships. This schema addresses this by providing a way to add tags to measurements, to link sensors to multiple components, and to classify machines into broader categories.
Anticipating the practical need for managing multi-user access and privacy considerations, the schema incorporates features to gate data access, facilitating the development of a privacy mechanism, and to group users at the institutional level, allowing for broader data management and sharing strategies. In sum, the schema seeks to strike a balance between structure and flexibility, between data specificity and broad classification, and between current use and future potential, aiming to provide a data management tool for varied PHM applications. The following are descriptions of each table appearing in the ERD, with some example uses.
3.1. Measurements
This entity contains central metadata for a measurement: the sensor from which it originated, the time it was recorded, and the type of measurement it is. Here, “type” refers to generic kinds commonly used in PHM, such as temperature, vibration, current, etc.
3.2. Raw_Data
The raw signal data from sensors. Features can be extracted (as “metrics”) for use in feature engineering PHM methods, as well as direct use in deep ML methods. Retaining raw data is useful for researchers since different transformations and features can be applied to test different PHM methods. If features were extracted and raw data discarded, it would not be possible to obtain new or different features later. For flexibility, and to support different kinds of sensors with one raw data table, data are stored in the JavaScript object notation (JSON) format. For ease of use and data cleaning, it would be essential to standardize the formatting of such JSON objects. A vibration measurement from a uniaxial accelerometer can be represented as a 1D array of floating-point numbers where the length depends on the accelerometer’s sampling frequency and the duration of the recording. These arrays can become rather large, making raw data potentially the largest table in terms of disk use. An advantage of placing raw data in a separate table is the possibility of housing it on slower more economical storage. Another possibility is to delete older raw data records from which some useful metrics have already been extracted, perhaps conditional on other raw data from the same component in a similar time period being retained. The proposed schema allows for various optimizations in this area.
3.3. Metrics
Here, metrics are defined as atomic (single-value) indicators computed from raw data. Some metrics are commonly used as features for classical ML methods (e.g., kurtosis, peak frequency, root mean square, etc.). Certain users may wish to extract and track different metrics based on the type of equipment being monitored or the methods of analysis used. Hence, metrics are stored as key-value pairs associated with individual measurement records. This allows for flexibility in the number of and kinds of metrics extracted from the raw data. In implementation, it would be possible to either automatically extract metrics and add them to the DB upon measurement ingestion, or to retroactively define a metric and add metric rows for existing/historical measurements.
3.4. Measurement_Tags
Measurement tags are key-value attributes used to sort and categorize measurements beyond what is already imposed by the schema. For example, if the operational status of a machine is known at the time of measurement, this could be stored as a tag for that measurement. Furthermore, if human maintenance professionals know the health state of components being monitored during certain measurements, these measurements can be tagged for future reference, and provided as ground truths for ML training. Lastly, tags can store the condition states predicted by machine learning algorithms. Given the different purposes of measurement tags, it would be important to enforce standard use of keys and values.
3.5. Events
Events entities can also have various purposes. They are intended to be used to store temporal contextual information that is not strictly related to an individual measurement, and thus not suitable as a measurement tag. The foreign key used in an event entity may relate it to a sensor, component, or machine. The external_id_type attribute indicates which type of foreign key is used. This also indicates the scope of the event. For example, an event with a description “replaced” related to a component implies that early subsequent data from any sensor monitoring of that component can be considered as describing a healthy condition.
3.6. Sensors
One or several sensors may be installed to monitor one or many components. The nature of complex machinery is such that recorded signals rarely carry information about only one component. Thus, it would be beneficial to relate each sensor to all components that its signal may carry information about.
3.7. Sensor_Models
Information about a sensor must be known to interpret the data gathered from it. If many similar sensors are expected to contribute data to the DB, storing generic information about the sensor model in a dedicated table may reduce redundancy. Additional attributes may be added, as required, for specific sensors involved in the application. For example, a valuable attribute in vibration-based PHM is sample frequency. If one expects different instances of the same sensor model to operate with different sample frequencies, it would be advisable to add a sensor configuration table.
3.8. Components
Each component entity reflects a real part subject to PHM. It may be or have been monitored by one or several sensors. The component_type attribute identifies it as one of a certain general type of component (e.g., bearing, gear, shaft, etc.). In the interest of simplicity and ease of data cleaning, it may be preferrable to avoid applying highly granular typing. However, if some applications require additional information to be linked to certain component records, a component_tags key-value table (in keeping with the style used elsewhere in this schema) may be used. Other attributes of components relate to the installation of a given component, including a name, an installation date, and a replacement date. If the component is currently in service, a none type may be applied to the replaced_date attribute.
3.9. Machines
A machine entity corresponds to a real machine containing at least one component subject to PHM. Attributes of machines are used to identify and describe it in terms that are relevant for PHM. Additional attributes may be useful for a broader maintenance tracking and scheduling application. Since different machines may require different numbers of and kinds of attributes, for example to sort or group various machines, machines may be related to machine_tag entities.
3.10. Machine_Tags
For users with many machines, it might be useful to classify them into further groups, such as production lines, floors, and facilities. To allow flexibility in this, further classification of machines is stored as machine tags, key-value pairs applied to individual machines. For modeling data and keeping tags homogeneous, it will also be useful to apply standardized machine type tags to machines (e.g., pump, gearbox, generator, etc.).
3.11. Gateways
A gateway entity corresponds to a device connected to sensors that transmits their signals to the database. Gateway information may not be required in training PHM ML models, but storing information about them is important for the maintenance and administration of the physical network of devices associated with the data it generates.
3.12. Users
Large applications are also probably multi-user. Access to the data in the DB may be gated by an API that only grants users access to their own data or data shared with them. This allows for the development of a privacy mechanism. It also allows for easy implementation of queries involving data associated with an individual user.
3.13. Institutions
Institutions are modeled as groups of users, with one user designated as the institution administrator. An example use of the institution entity is, through an API, shared access to data for users of the same institution.
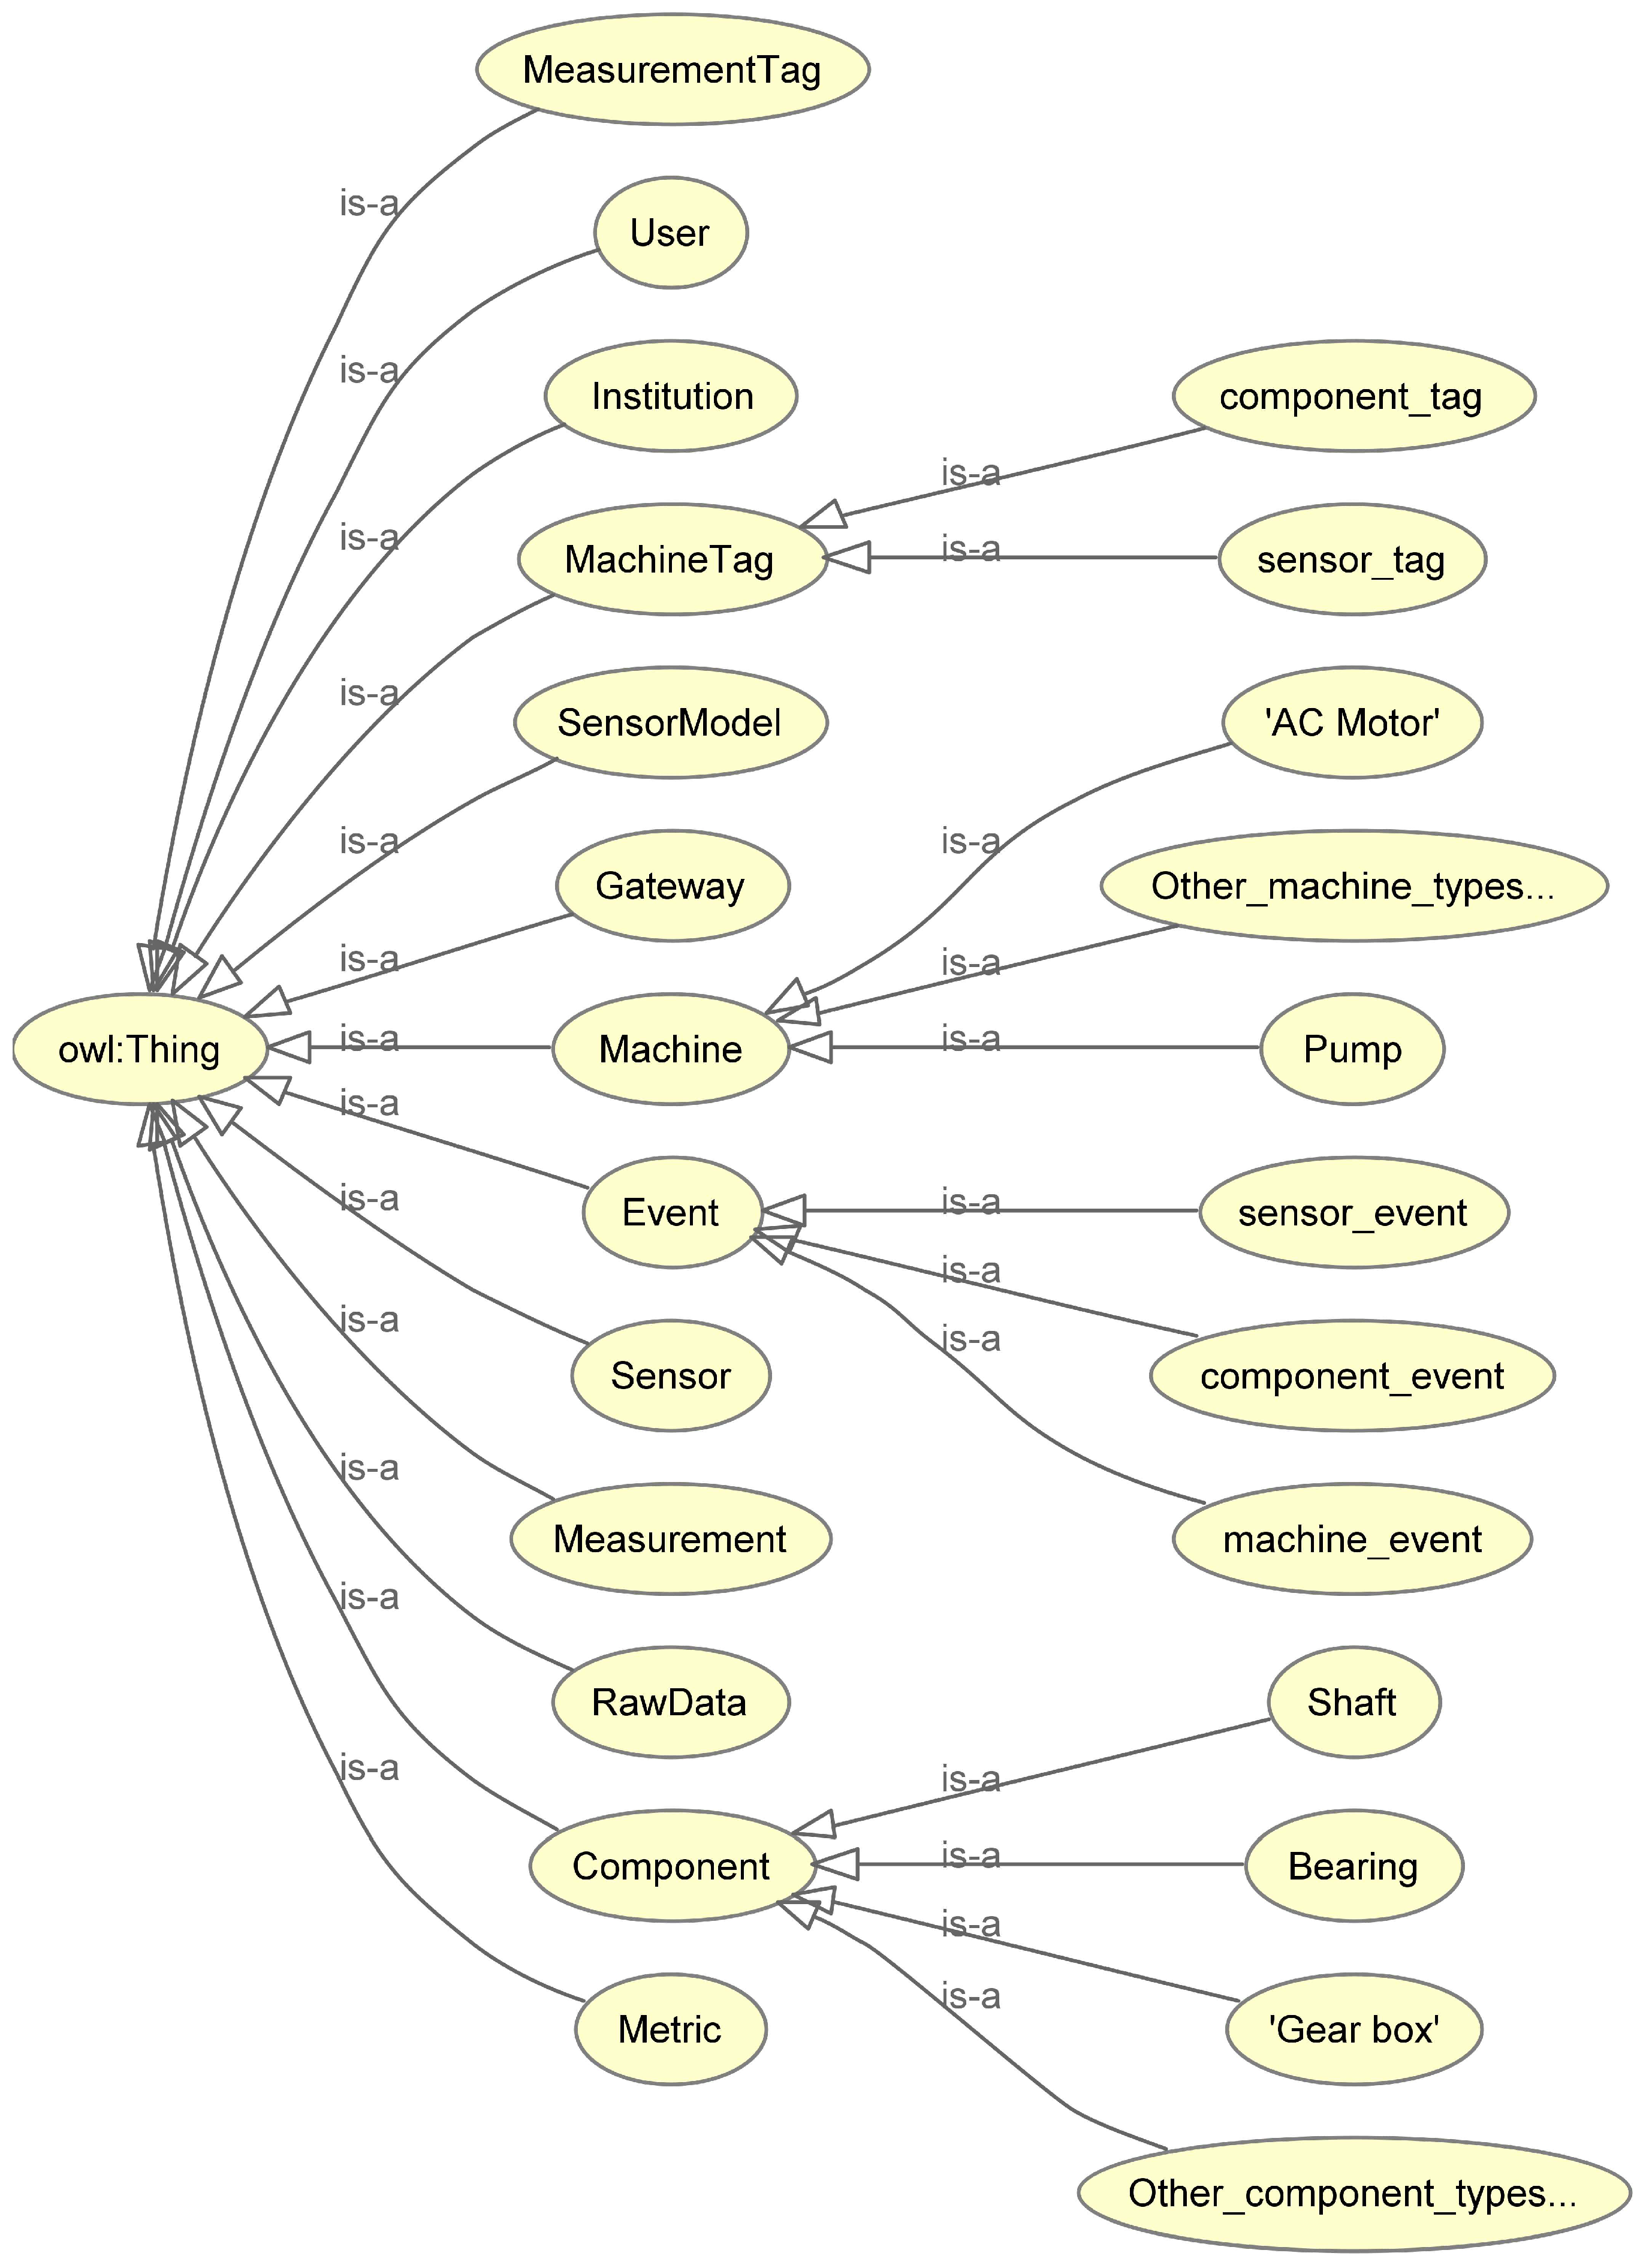
The OWL representation of the PHM ontology is provided in
Appendix C.
4. Selecting a Database Engine
The schema is a framework describing the structure of the data to be stored. A database engine must be chosen to implement the schema and begin to use it. Two kinds of database engines predominate: relational, such as SQL, and non-relational, or NoSQL. While the schema has been presented as an entity relation diagram, it is possible to implement relational schemas in document-oriented database engines. PostgreSQL and MongoDB are popular relational and non-relational database engines. Both are general purpose database engines suitable for many data storage applications, including time series data. Specialized TSDBs can also be built on relational or non-relational paradigms. InfluxDB and TimescaleDB are examples of each. Some of the most common technical considerations made when selecting a database engine include flexibility, scalability, and performance.
Flexibility, in this case, typically refers to the ability of the database to support heterogeneous data types and changing requirements around the structure of data to be stored [
19]. NoSQL or schemaless databases support a wide variety of datatypes and allow for new datatypes and structures to be introduced as an application evolves. For example, in a PHM application, it may not be immediately clear which features from the raw signal will be most useful in performing prognosis. Schemas in relational databases must be defined upon creation and can be more difficult to alter. The proposed schema demonstrates how some uncertainty can be accommodated in a static schema, for example, through the limited use of key-value column pairs in selected tables. Several tables involve key-value column pairs that can be populated with new keys over time. Additionally, using the JSON file format for storing raw measurements allows for different sensor data types to be packaged for the same column. The drawback to this is a requirement for data cleaning and standardized notation of the raw data being stored.
Scalability is an important selection criterion since PHM applications generate large amounts of data over time. To support larger volumes and velocities of data, databases can be vertically and horizontally scaled. Vertical scaling refers to adding capacity such as storage, processing power, and memory to a server node. Horizontal scaling refers to the creation of additional server nodes to jointly support the database [
20]. Generally speaking, both relational and non-relational databases can be vertically scaled, but the silo architecture of relational databases limit their ability to be scaled horizontally [
20].
The speed of data ingestion and query execution are key measures of performance [
21]. Speed requirements vary by application. For PHM, it may be necessary to graph historical metric values in a real-time interactive dashboard, for example, using a web tool such as Grafana. The speed with which data can be interacted with and searched can strongly drive usability. Retention of performance as scale grows is an important consideration. It can be difficult to predict the exact trajectory of an application, so the ability to dynamically allocate additional resources to a DB is valuable.
In addition to the technical considerations of flexibility, scalability, and performance, there are also practical considerations to be made around ease of use, community support, and enforcement of data standardization and integrity. With respect to ease of use, it is preferable to select a database engine that is intuitive, has robust documentation, a wide base of users, and established use cases and examples. Lastly, it is advantageous to choose a database engine that allows policing of the schema, which will improve data integrity and reduce the burden of data cleaning in downstream processes. To some extent, relational database engines inherently enforce data consistency as incomplete or incorrectly typed records cannot be ingested. Complex data integrity protocols can be built around relational and schemaless databases through other means, such as by requiring interactions with the database to be carried out through an application programming interface (API) that is designed to check the data for consistency.
For the sample implementation that follows, PostgreSQL is chosen as the database engine for implementing the schema. PostgreSQL offers a balance between structure, with its rigid schema and flexibility, and with its support for JSON datatypes. PostgreSQL supports hardware improvements for vertical scaling and can be horizontally scaled, for example, by sharding and partitioning, through extensions such as Postgres-XL. PostgreSQL can also offer high performance with query optimization and indexing.
5. Sample Implementation
Code for the sample implementation is available here:
https://github.com/JacobHendriks/sensors_ts_public (accessed on 19 March 2024) [
22]. The code was written to create the database, generate fictitious data, and query the database at intervals as the amount of data stored in the DB increased. The query execution time was measured at intervals. Measuring the execution time for queries while the database grows in terms of the number of entries and relations allows for examination of query performance versus scale. Certain parameters that dictate cardinality are prescribed in the benchmark code. Parameters, their descriptions, and default values are listed in the appendix. Varying these parameters changes the number of many-to-one relationships in the DB, which can impact query performance. The following results are given for the default values only; interested researchers are invited to clone the repo and run experiments with different parameters of their choosing to test conditions relevant to them.
The hardware used for this demonstration was a laptop computer (Dell XPS 17 9700, equipped with an i7-10750H CPU and 16 GB of RAM), rather than a cloud service as would be used in a real application. This was chosen for simplicity and to demonstrate a simple setup process that may be used for other proof-of-concept work.
In this implementation, some tables are populated with generated data at initialization and remain fixed in size while other tables grow in records with each interval. Tables that grow throughout the test include metrics, measurements, and raw_data. This reflects one of the aspects of how PHM applications scale; data velocity for these measurement-related tables is proportional to the number of active sensors in the network and the frequency with which measurements are taken. For simplicity, tests discussed in this paper involve a fixed number of sensors (864) and simulate the passage of time by adding rows to time-oriented tables with advancing timestamps. The parameters determining the final number of sensors are given in
Table A1 of
Appendix A.
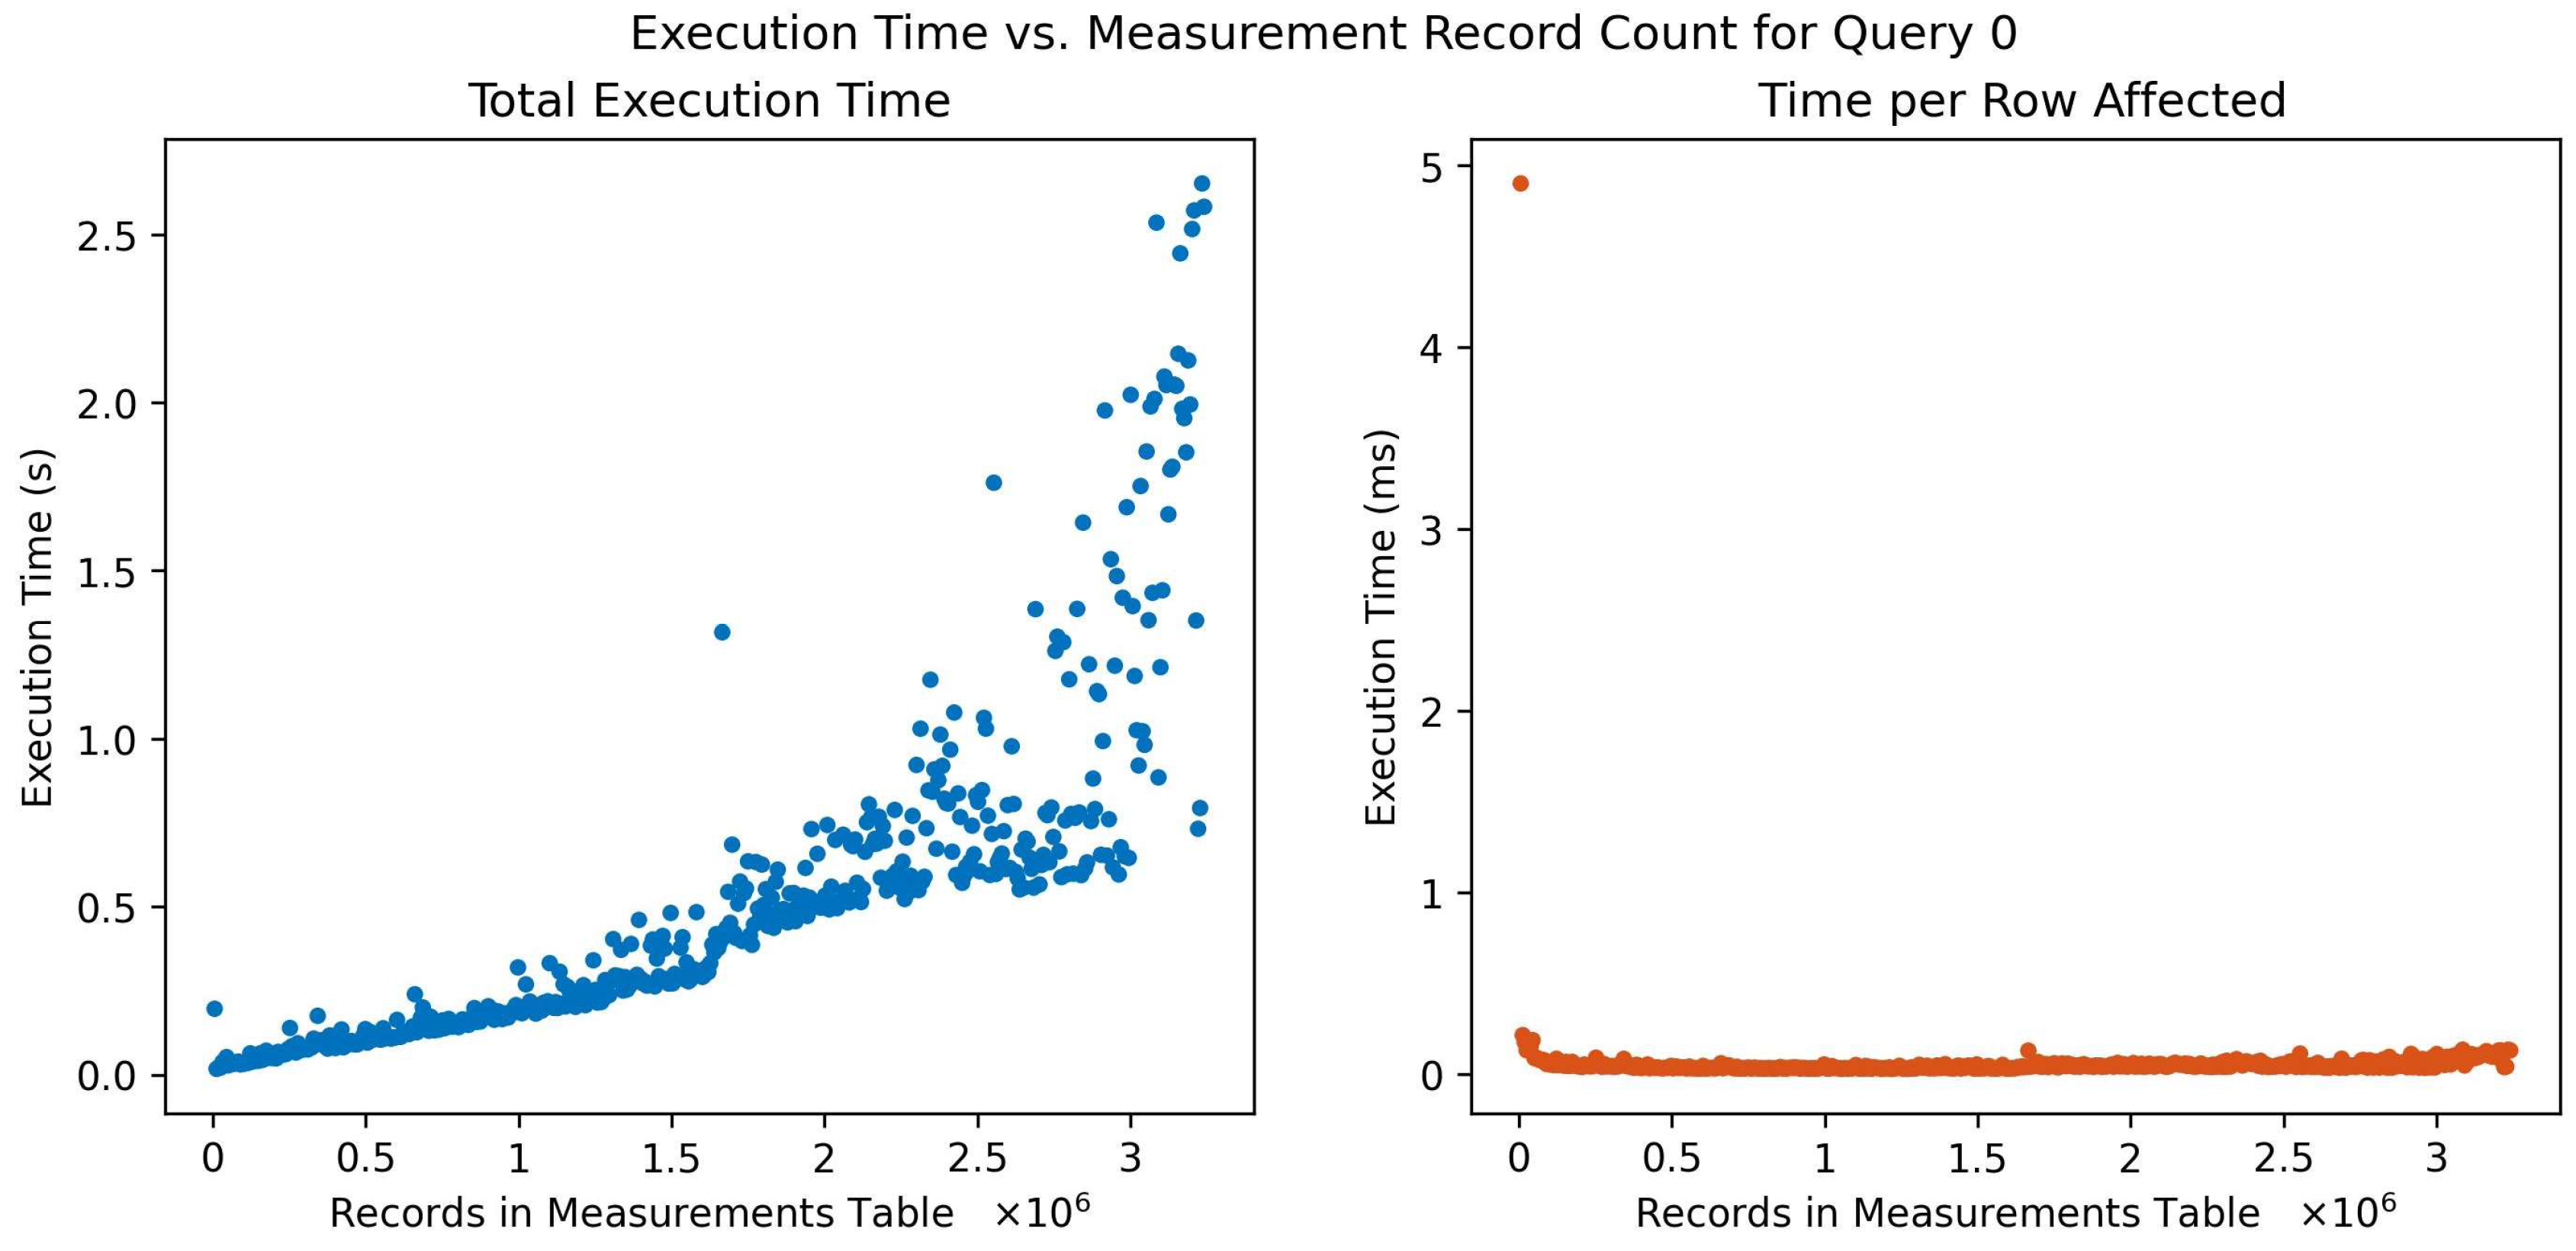
Each of the figures below show the performance in terms of execution time for one query. The left side shows the total time for the query to return a response, as timed in the calling Python function. For all queries, growth in total execution time increases non-linearly. Growth is expected, since the same queries return more rows as more data are added to the DB. The left side shows the total execution time divided by the number of rows affected by the query. Different queries display different trends in this regard. Queries used in this paper are described in
Appendix B.
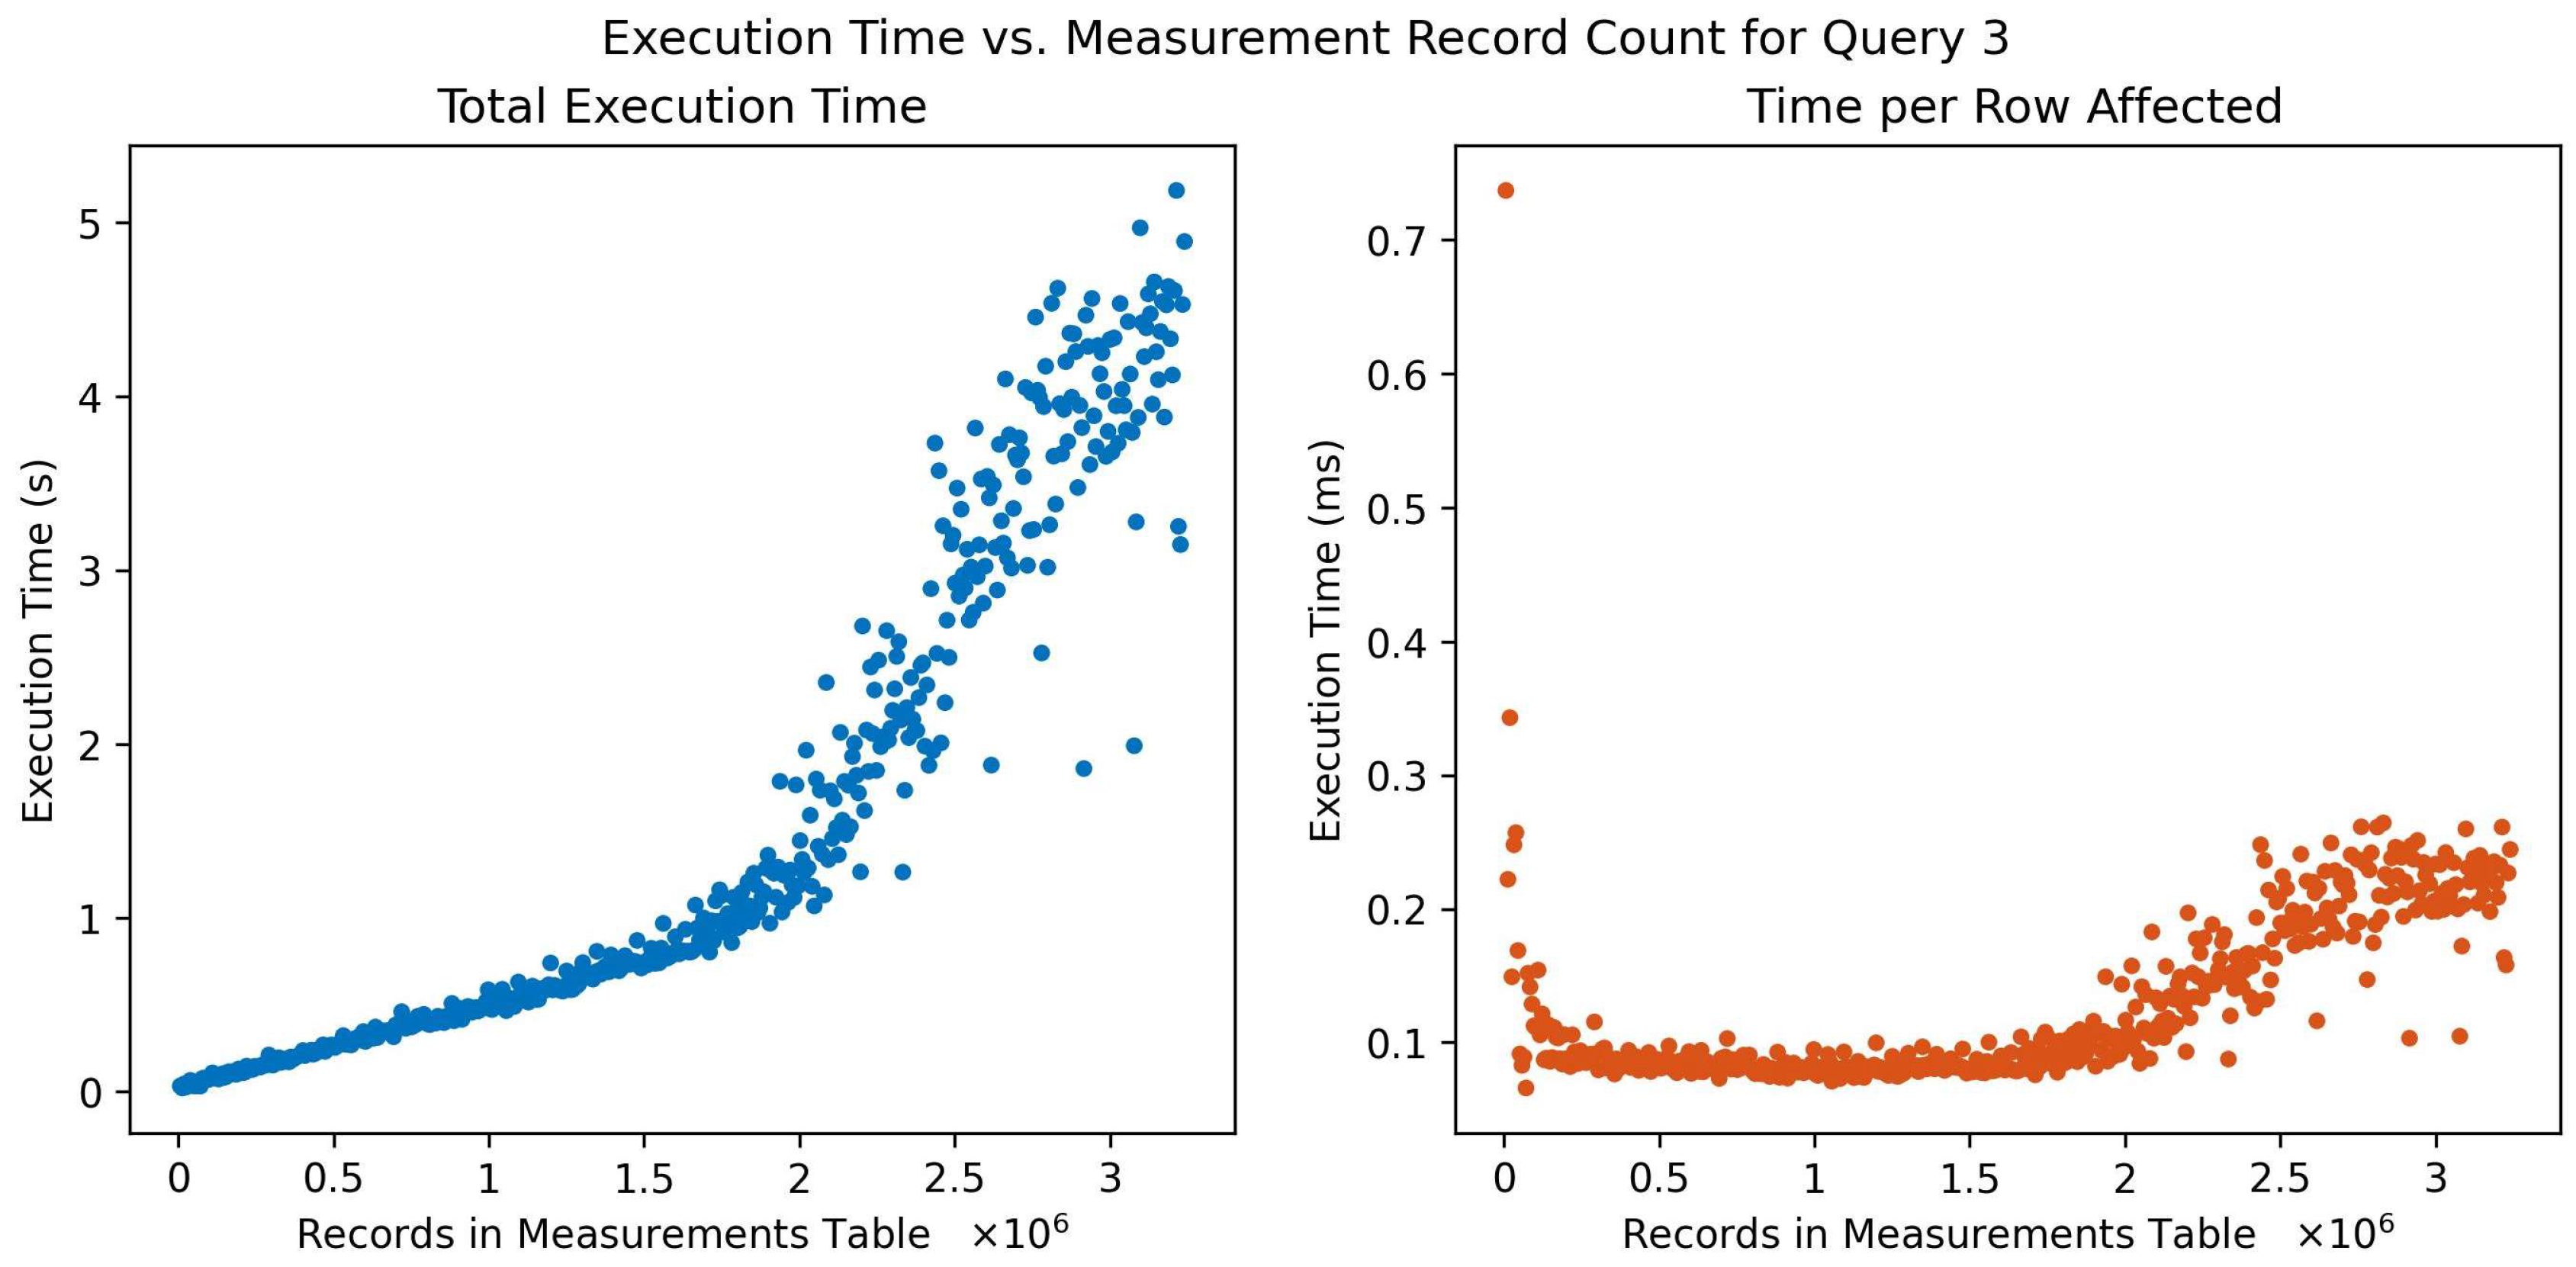
Figure 3 illustrates the results of a query conducted on raw data associated with a specific machine, demonstrating a direct application of the proposed schema. This query necessitates multiple join operations as the raw data are connected to machines through measurements, sensors, and components. The left side of the plot shows the total execution time of the query, and the right side of the plot shows the total execution time divided by the number of rows affected by the query. As simulated time advances, the query retrieves an expanding number of raw data entities. At first, the total execution time for the query exhibits an approximately linear growth, but as the number of rows affected increases, the growth becomes nonlinear. This nonlinear pattern is likely a result of the host machine’s memory handling capabilities, indicating that the exact behavior is dependent on the computer hardware used. Notably, even with this nonlinear growth in total execution time, the query time per affected row remains relatively fast.
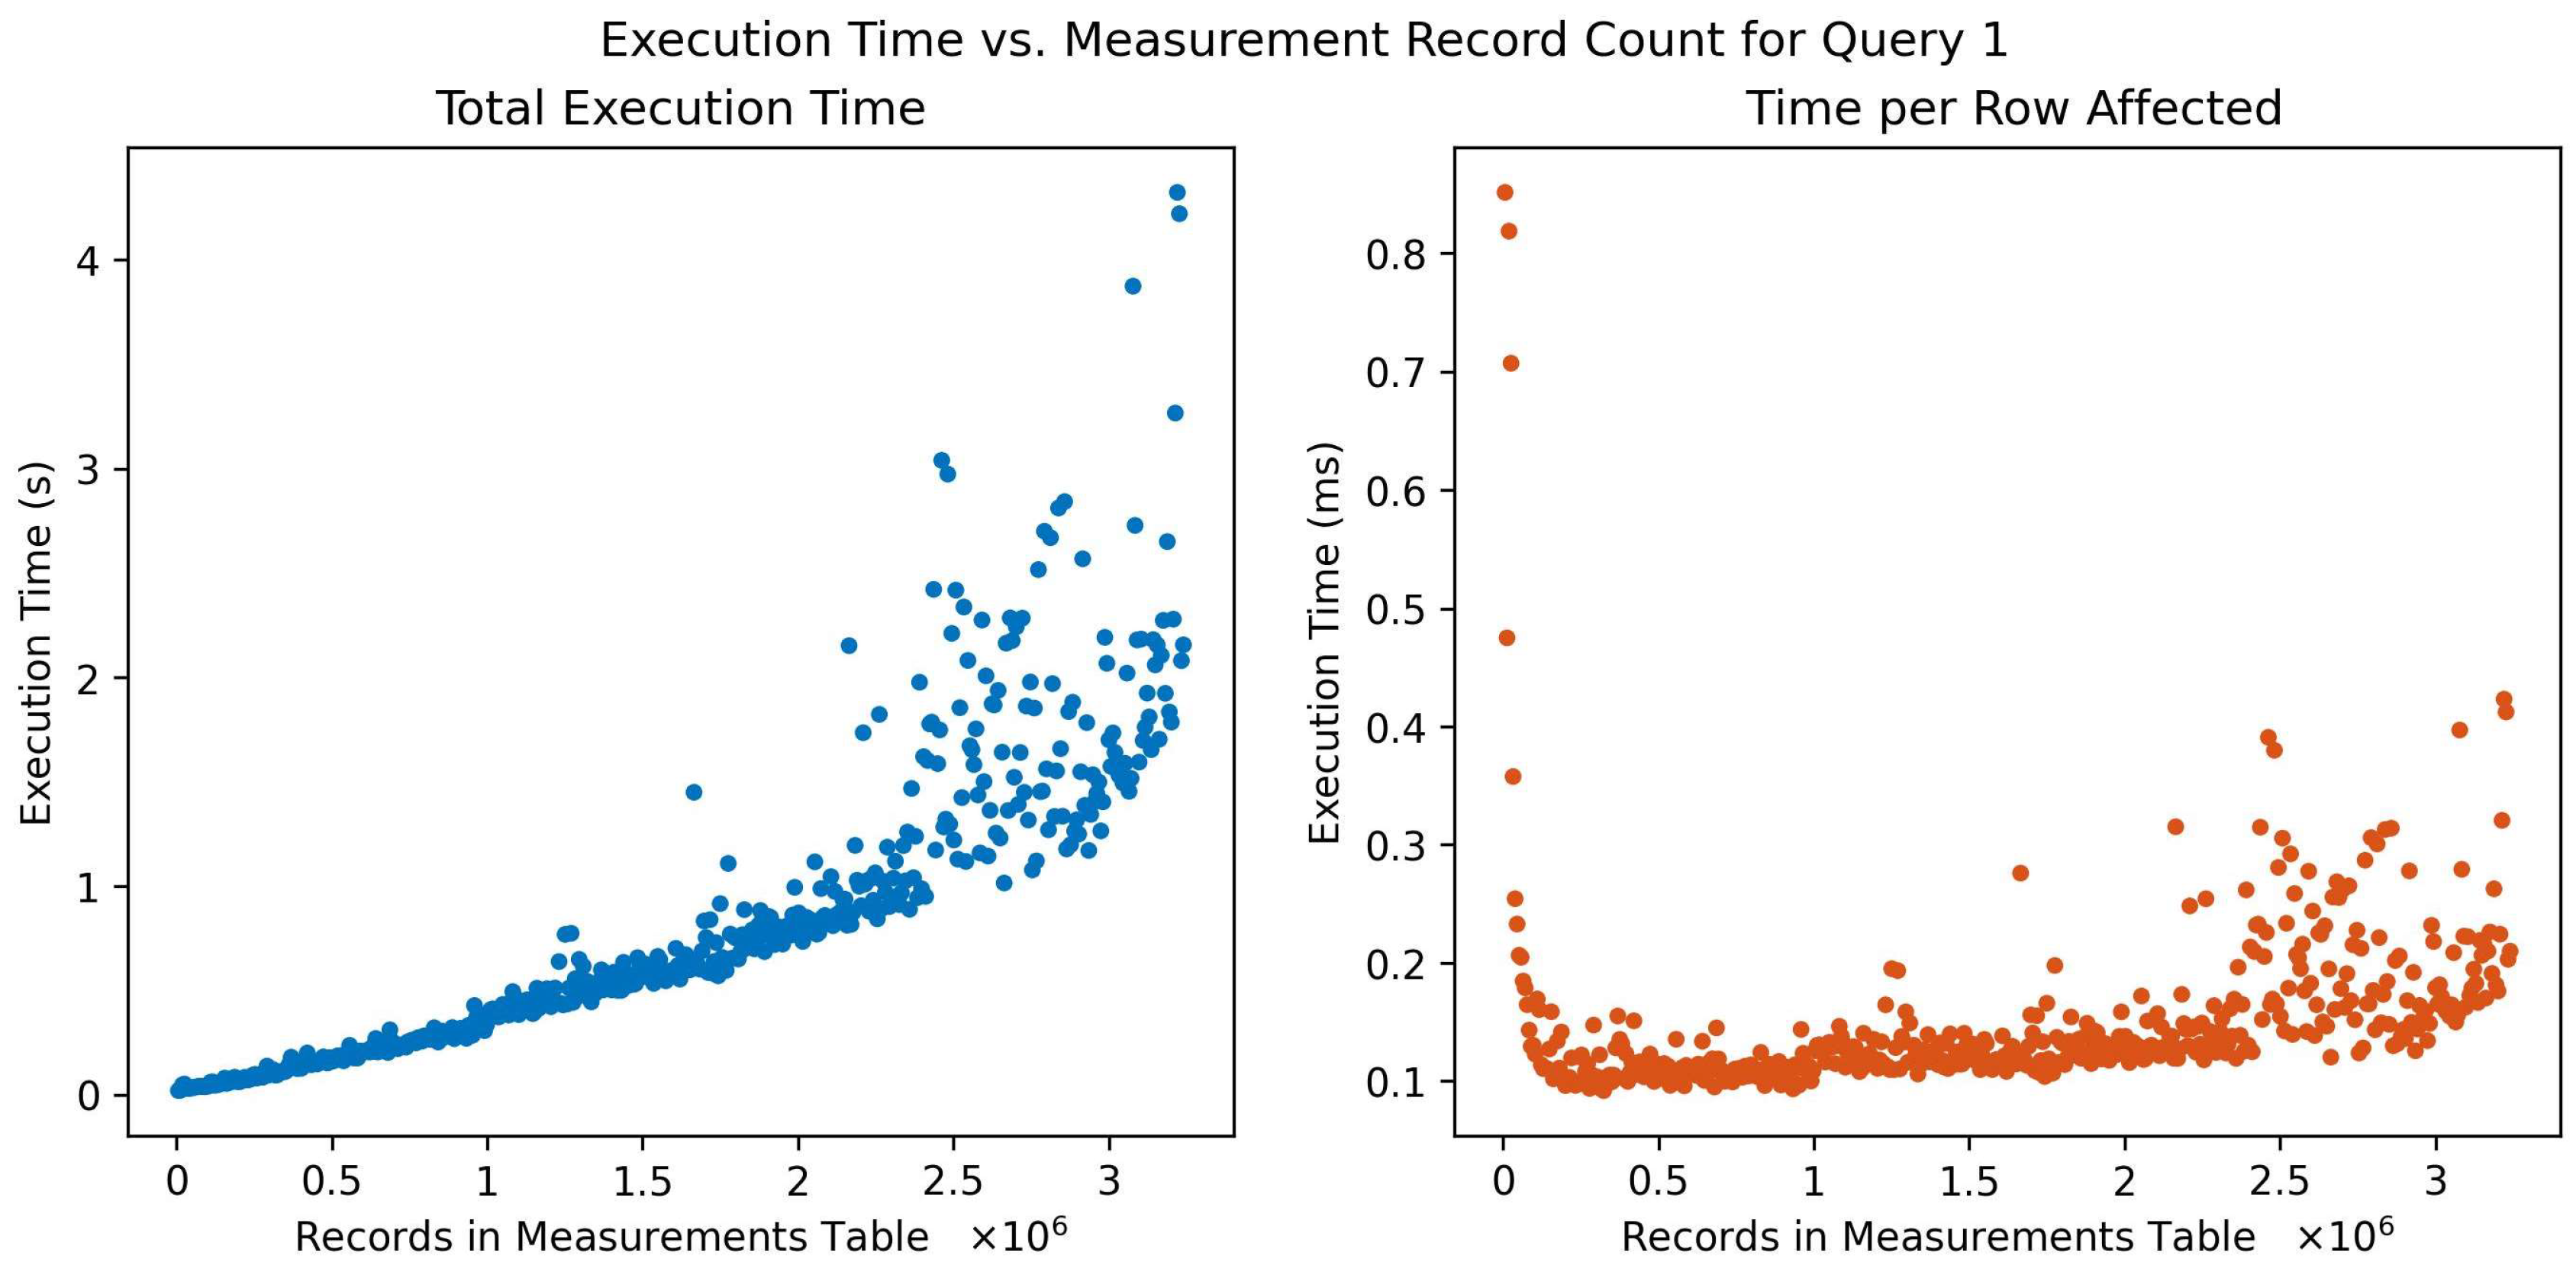
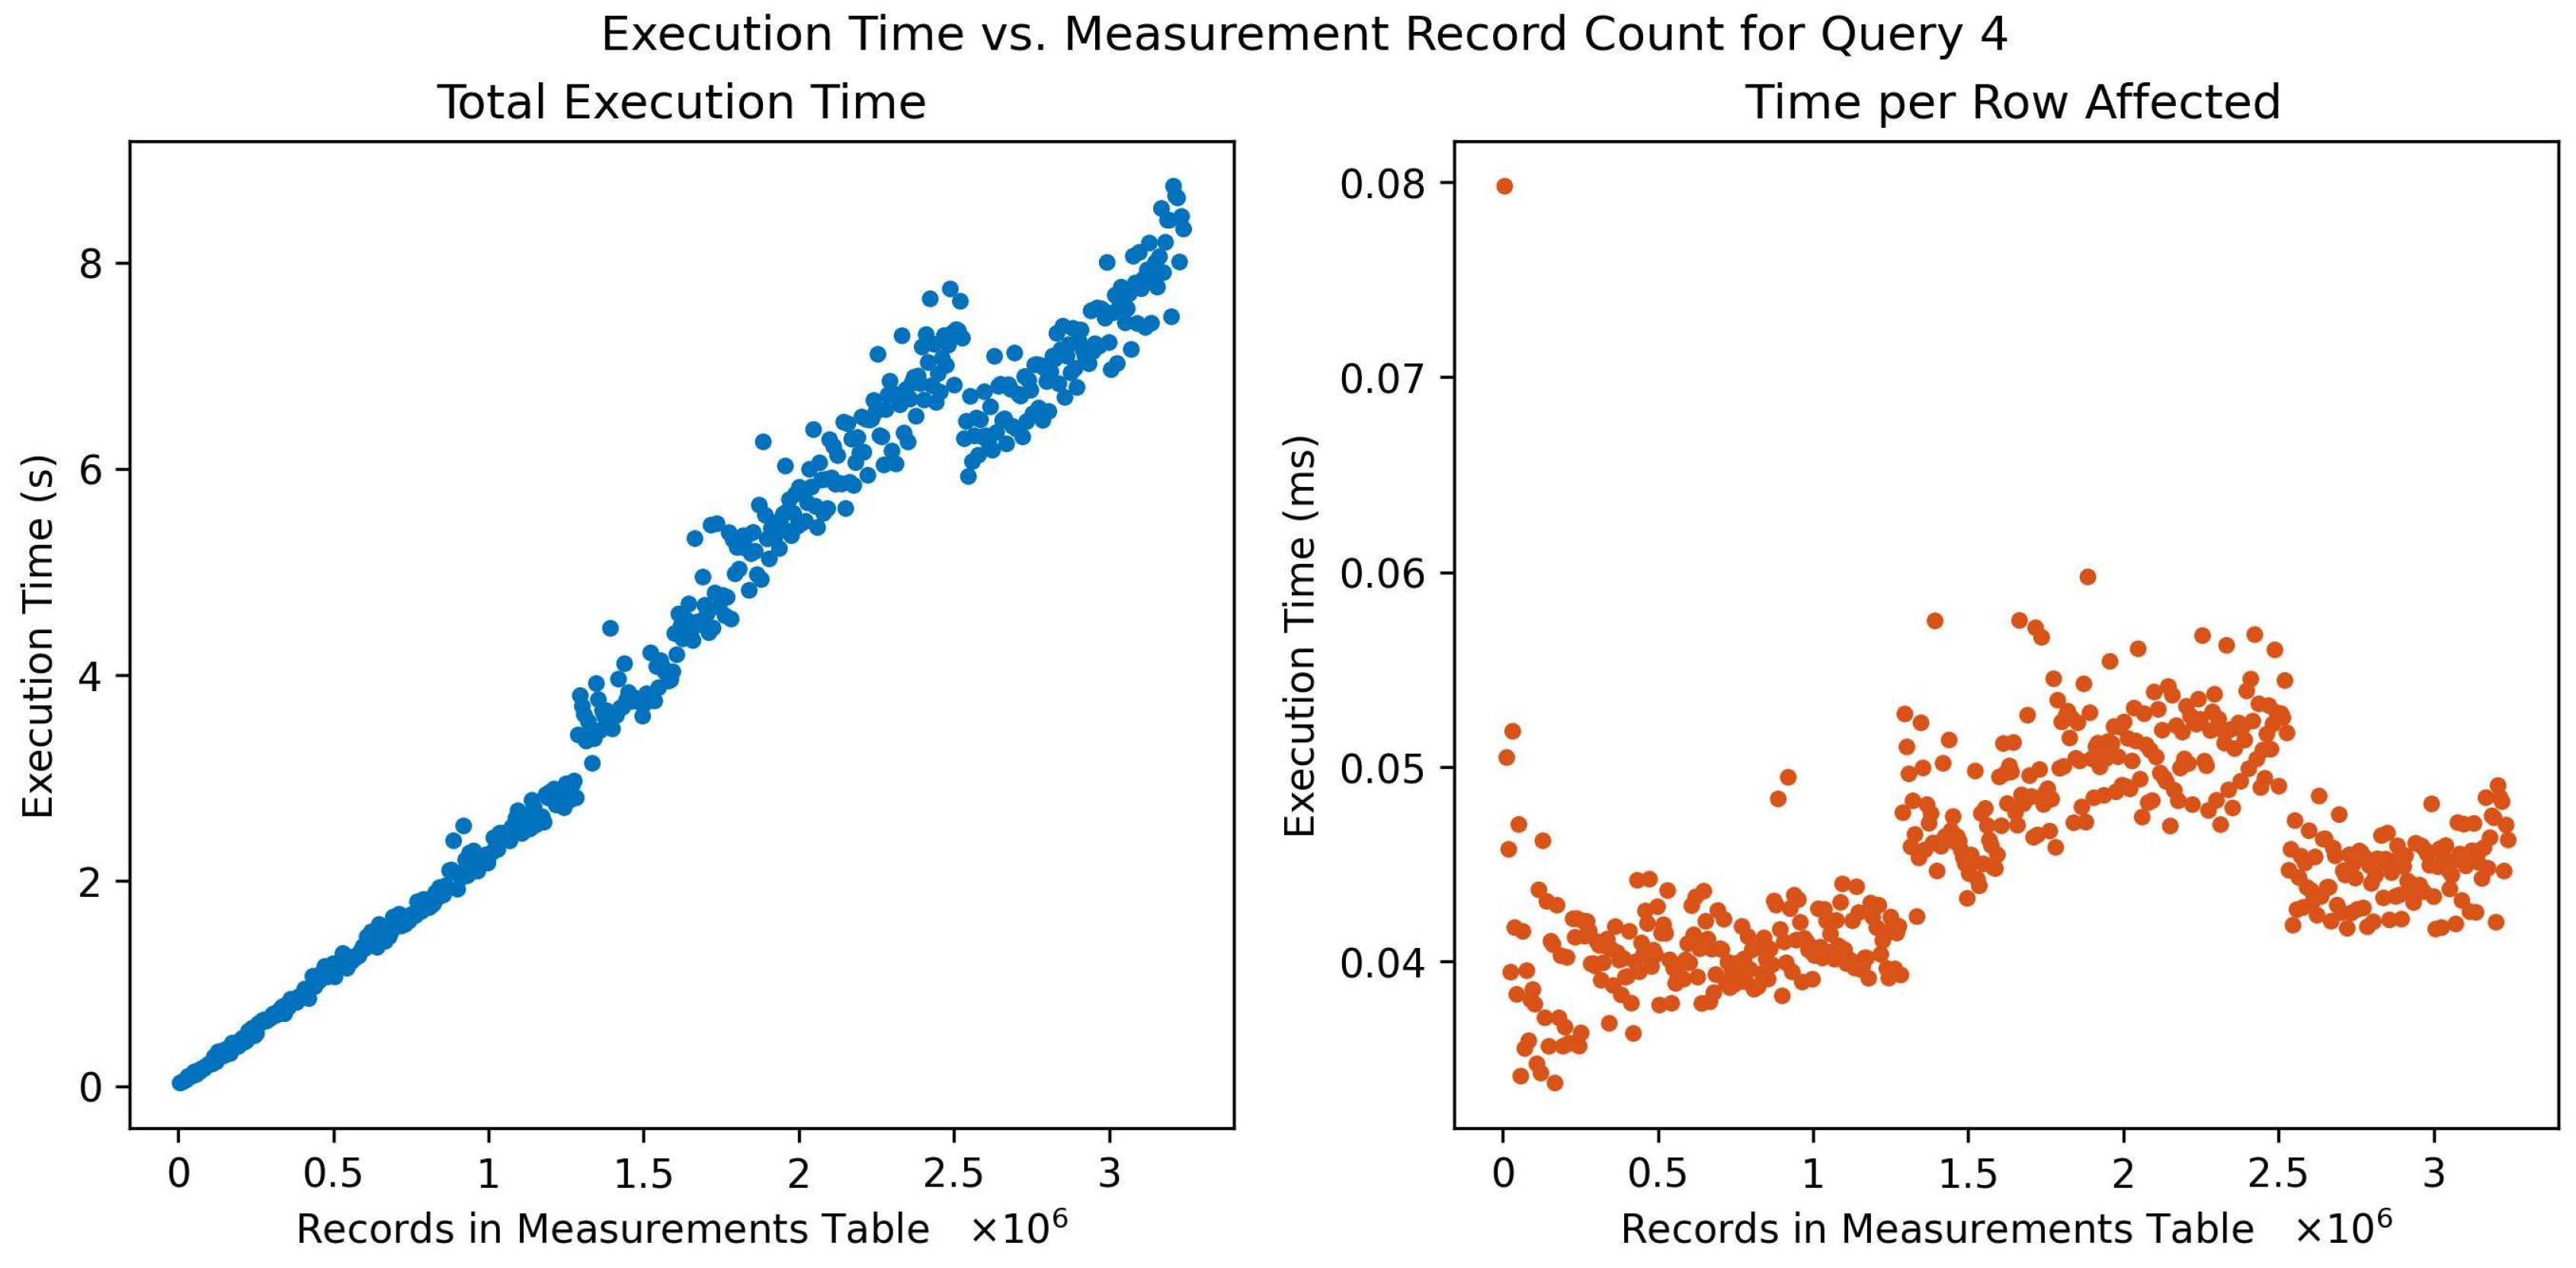
Figure 4 presents an alternative query on the raw data, this time employing conditions linked to related metrics as a selection filter. This approach aligns with practical scenarios where interest lies primarily in specific data subsets that conform to predetermined criteria. Much like the findings in
Figure 3, the trends identified in the execution of this query share similar characteristics.
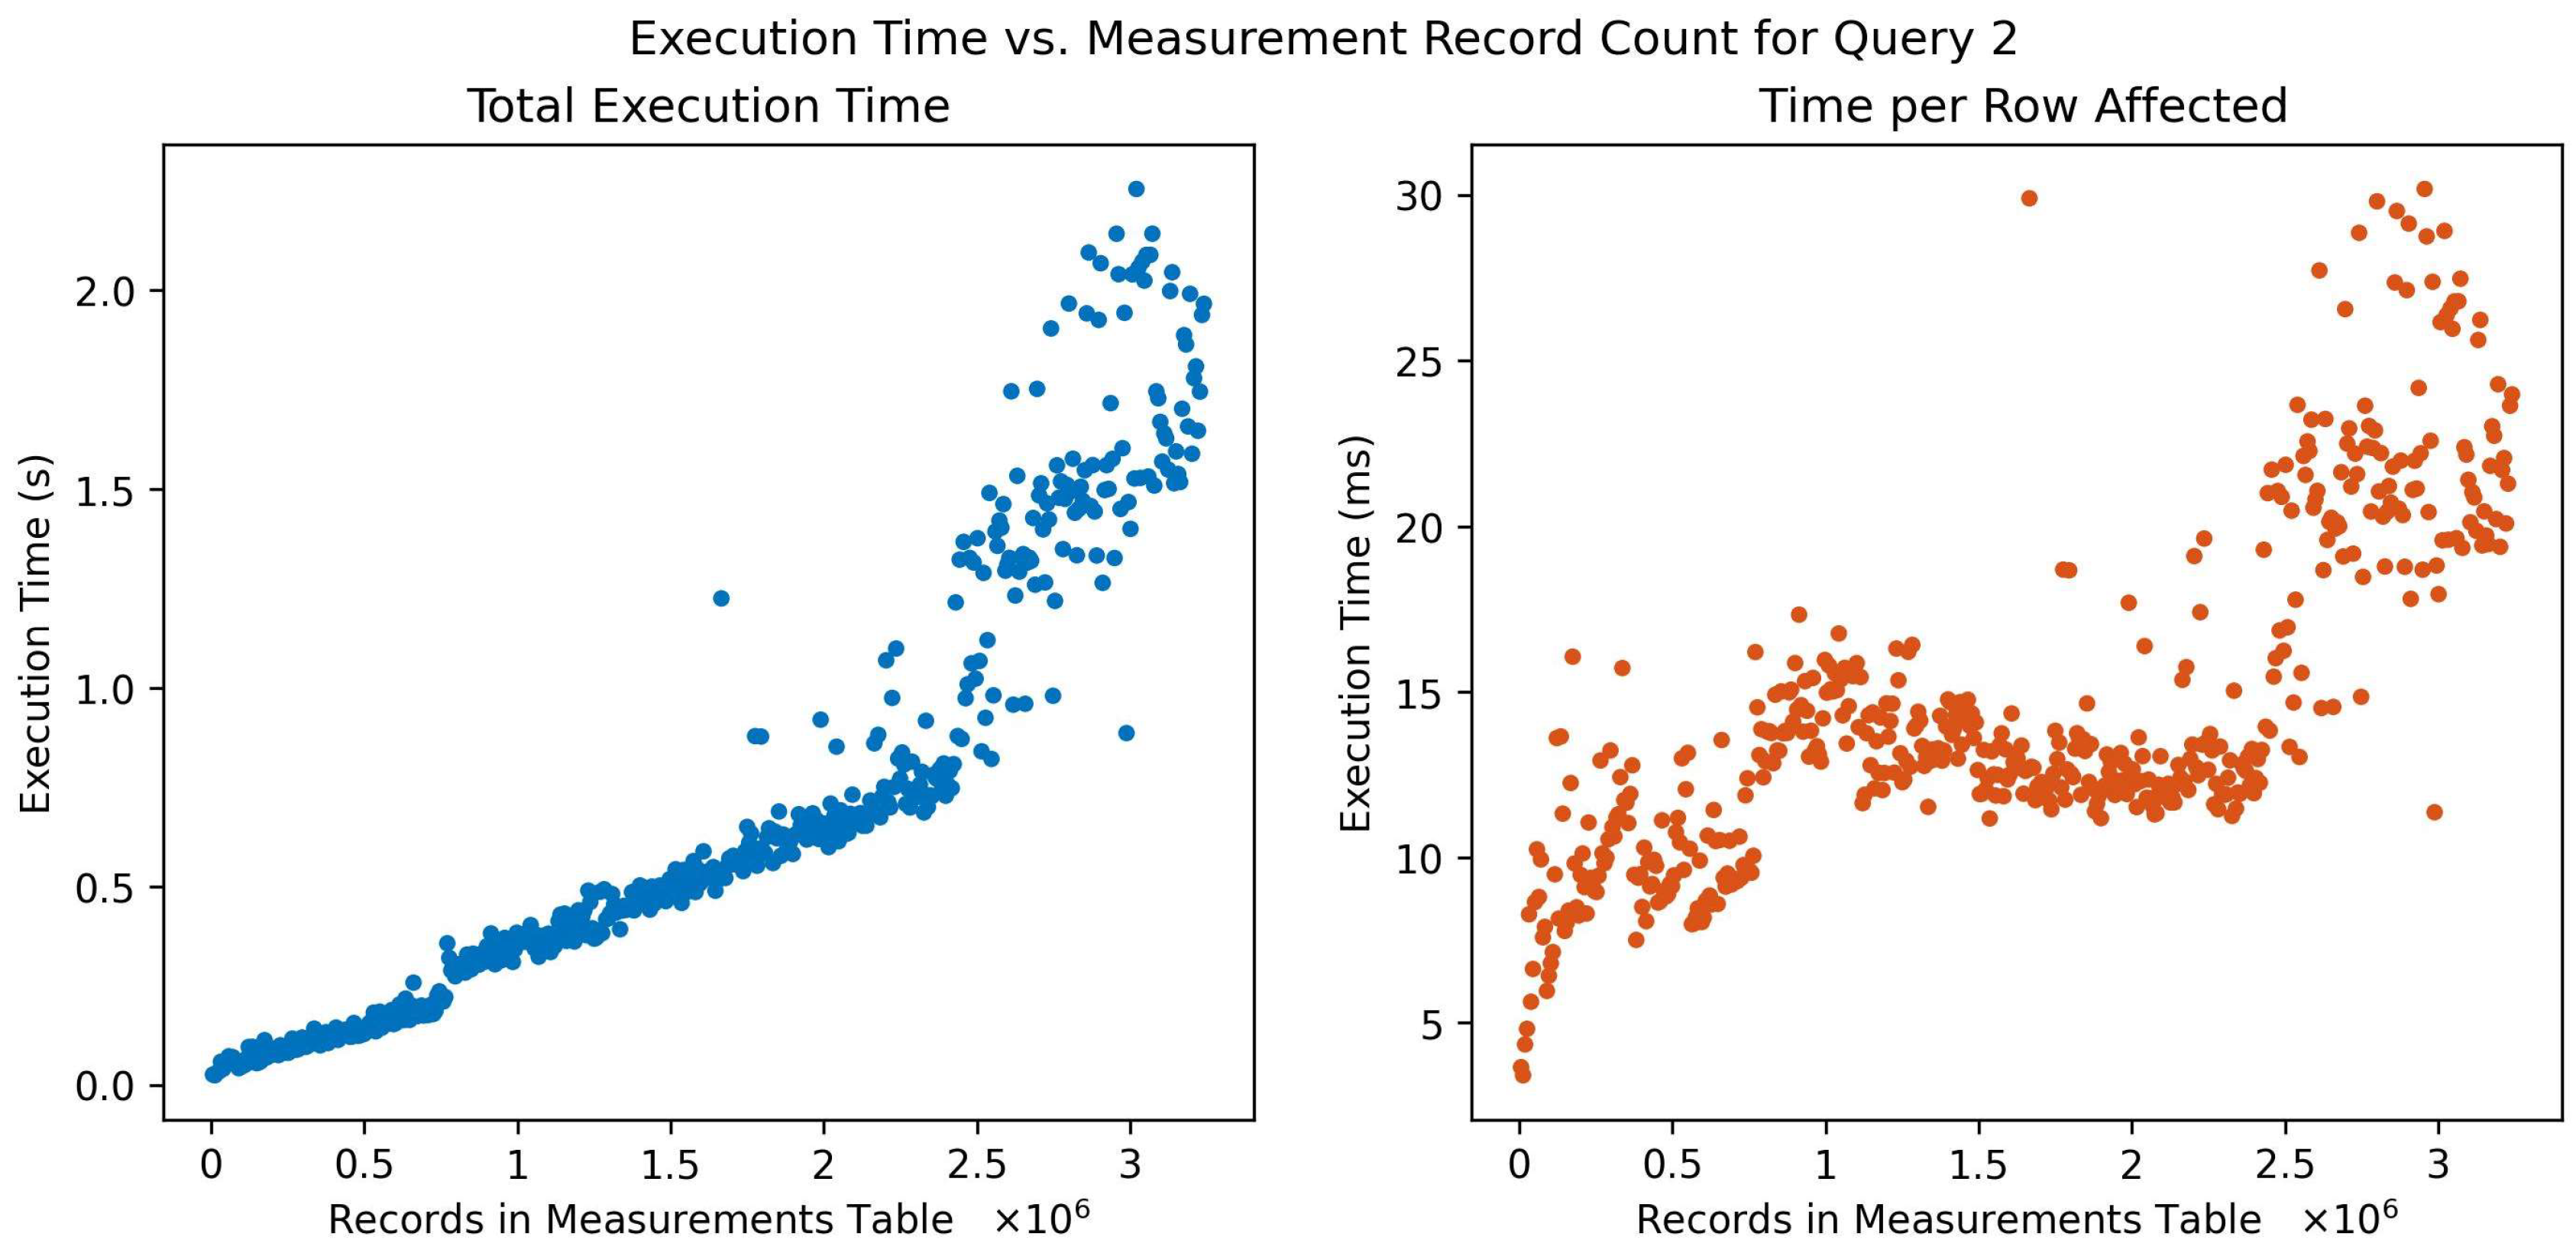
Figure 5 shows the results for a query on metrics involving six joins and four conditions. The conditions are related to the type of metric, time of the measurement (there being a measurement tag of a certain value), and the machine name. This query represents a use case where the user might seek specific metrics of interest for a particular machine within a certain timeframe, perhaps triggered by a specified event or condition, effectively allowing for a nuanced and tailored analysis of machine performance over time. The results show that the total time and time per row returned grows non-linearly as the number of records stored in the DB grows. This demonstrates a potential limitation of the demonstrated implementation.
Figure 6 shows results for inserting measurement tags conditional on the user related to the sensor that produced the measurement and the time of the measurement. The ability of users to sort and label their data by applying tags to filtered subsets of data is an important feature of the schema. The execution time per row affected remains approximately constant initially and increases after around 2 M measurement records. Over time, the volume of measurements (and corresponding tags) will naturally grow, especially as more sensors are deployed or more machines are brought under monitoring. This could represent a potential scalability concern in scenarios where frequent, user-specific tagging of a rapidly growing number of measurements may be a key requirement.
Figure 7 shows results for a deletion query. Raw_data entities are deleted, conditional on the identity of the user associated with them. Also involving several join operations, this query might be used to clear data from outgoing or inactive users. This query resulted in the quickest execution times and follows a piecewise, linear trend. Discontinuities might have been caused by background processes running on the host machine impacting resource allocation. These background processes may have impacted other queries as well but have a more pronounced impact on faster queries.
6. Discussion
The proposed ontology for ML-driven PHM applications involving sensor networks monitoring various industrial machines is a significant contribution to the field. In this discussion, the effectiveness and potential benefits of the proposed ontology are evaluated.
The proposed ontology offers a structured framework for organizing and representing data in PHM applications. By defining entities such as measurements, raw data, metrics, measurement tags, events, sensors, sensor models, components, machines, and gateways, the ontology provides an interconnected view of the data ecosystem used in PHM. This allows for a unified perspective on data structure, reducing the barrier to data and model sharing among the PHM community.
One of the strengths of the proposed ontology is its extensibility and adaptability to different use cases. It accommodates various types of measurements, including temperature, vibration, current draw, and more. The inclusion of raw data and metrics enables researchers and practitioners to leverage different data representations and feature engineering techniques for both traditional ML methods and deep learning algorithms. This is crucial, as different ML approaches may require diverse input representations derived from raw measurements.
Furthermore, the ontology reflects the importance of contextual information and temporal aspects of data in PHM. The inclusion of measurement tags and events allows for the annotation of measurements with additional information (e.g., operational status, health state, or predicted condition states). This contextual information becomes valuable for training and validating ML models, as well as for tracking and analyzing the health of machinery over time.
The proposed ontology also addresses the challenges of storage and database selection for ML-driven PHM. By acknowledging the advantages and considerations of both relational and non-relational databases, the benefits of relational databases for efficient data retrieval in ML and artificial intelligence (AI) applications are emphasized. By implementing the proposed ontology on a PostgreSQL database and loading it with large auto-generated fictitious data, the feasibility and practicality of the ontology in real-world scenarios is demonstrated. The performance evaluation and measurement of CRUD operations provide insights into the efficiency and effectiveness of the ontology in handling common condition monitoring questions.
7. Conclusions
This paper proposes an ontology for PHM applications in industrial asset condition monitoring, with a focus on the data requirements and database selection for ML-driven PHM. The importance of large, organized repositories of real-world data to facilitate the continued improvement of ML-driven PHM is emphasized. Furthermore, this paper addresses the need for a unified perspective on data structure to reduce barriers to data and model sharing within the community.
This paper challenges the common wisdom of using non-relational databases (NoSQL) for PHM applications, advocating for the use of relational databases due to their data uniformity and intuitive structure, as well as the efficiency of retrieving data for ML and AI purposes using SQL scripting. At the same time, the proposed ontology incorporates the best of NoSQL data management systems (i.e., flexibility).
The proposed schema and ontology provide a framework for organizing the data related to sensors, measurements, raw data, metrics, events, sensor models, components, machines, and gateways. The relationships between these entities are provided and the flexibility and scalability of the schema to accommodate different use cases and applications are highlighted.
Overall, this paper underscores the underlying data foundation required for ML and AI in PHM applications and emphasizes the need for better structured repositories. The proposed ontology and schema provide a valuable foundation for researchers and practitioners working in the field of PHM, enabling better data management, model sharing, and advancements in ML-driven prognostics and health management.
While the proposed ontology offers a solid foundation for organizing data in ML-driven PHM applications, there are a few aspects that could be explored further. For instance, in this paper the scalability and distributed nature of data storage in large-scale cloud network CM scenarios are not addressed. Future research could investigate how the proposed ontology can be extended to support distributed data storage and processing in IoT environments. Additionally, future work will benchmark the developed PostgreSQL implementation against common noSQL engines in the literature. To demonstrate the schema, this paper presented an implementation in PostgreSQL. This has some weaknesses, and future work may investigate alternative implementations, including other TSDBs. Lastly, to aide in the proper use of the schema and to facilitate interoperability, the development of an API to provide efficient and permissible data transactions should be considered.


