Article

Improving Animal-Human Cohabitation with Machine Learning in Fiber-Wireless Networks

Department of Electrical and Computer Engineering, Technische Universität Carolo-Wilhelmina zu Braunschweig, 38106 Braunschweig, Germany
*
Author to whom correspondence should be addressed.
J. Sens. Actuator Netw. 2018, 7(3), 35; https://doi.org/10.3390/jsan7030035
Submission received: 15 June 2018 / Accepted: 26 July 2018 / Published: 9 August 2018

Abstract

:
In this paper, we investigate an animal-human cohabitation problem with the help of machine learning and fiber-wireless (FiWi) access networks integrating cloud and edge (fog) computing. We propose an early warning system which detects wild animals near the road/rail with the help of wireless sensor networks and alerts passing vehicles of possible animal crossing. Additionally, we show that animals’ detection at the earliest and the related processing, if possible, at sensors would reduce the energy consumption of edge devices and the end-to-end delay in notifying vehicles, as compared to the scenarios where raw sensed data needs to be transferred up the base stations or the cloud. At the same time, machine learning helps in classification of captured images at edge devices, and in predicting different time-varying traffic profiles— distinguished by latency and bandwidth requirements—at base stations, including animal appearance events at sensors, and allocating bandwidth in FiWi access networks accordingly. We compare three scenarios of processing data at sensor nodes, base stations and a hybrid case of processing sensed data at either sensors or at base stations, and showed that dynamic allocation of bandwidth in FiWi access networks and processing data at its origin lead to lowering the congestion of network traffic at base stations and reducing the average end-to-end delay.

1. Introduction

With every passing year the animal habitat is shrinking, and new transport infrastructures (e.g., highways, railways, etc.) are built across densely forested areas to connect cities. Thus, wild animals often stray into human habitats, cross roads or rails, and sometimes results into deaths of humans as well as animals due to various reasons, including non-intentional, e.g., animal-vehicle collision. Apart from Asia and Africa, where animal-human conflict is common [1], according to a statistic [2] in Germany alone 194,410 animals were involved in animal-vehicle collision in the years 2015–2016. Even though the technological advancements in the computing and networking are today utilized to build smart cities, rails, etc., these systems have not been considered for animal-human cohabitation [3]. Various sensors such as infrared cameras, optical fiber sensors, radars, etc. could be added to the smart hot zones near the roads/rails or adjoining areas (to human habitation) to detect the movement of animals and warn humans/vehicles in advance for a likelihood of animals forage. Although there are a few notable works that studied some aspects of the animal-human cohabitation problem [1,4,5,6,7,8,9,10,11,12,13], a warning system that could intelligently process data at various layers of networking architecture—from Internet-of-Things (IoT) devices, e.g., sensors, to fog-to-cloud—has not been integrated into the system. The processing of raw data near sensors can be helpful in some scenarios, where the energy consumption is an issue due to limited source of energy on the end devices. The reason that the unprocessed large sensed data takes longer transmission time than the processed relevant data, thus longer transmission could consume more energy of constrained end devices. However, the data processing at constrained end devices, e.g., Raspberry Pi, with limited compute and storage capability could result in more false alarms, longer processing time, and the processing task also consumes energy. Thus, an important aspect in a smart early warning system is to study a trade-off between the amount of data to be processed at the end devices and the data to be sent to upper layers for making inference (and generating alerts), such that consumed energy and end-to-end latency in transmission and processing tasks are minimum.
To take advantage of today’s smart systems to integrate early warning systems, we consider three recent trends: fog-to-cloud distributed computing, artificial intelligence methods, and fiber-wireless (FiWi) networks. With fog-to-cloud distributed computing, we can intelligently store, process and communicate among various layers of edge, fog and cloud [14]. The ability of fog computing to process data locally is critical for an early warning system which is latency-sensitive. Artificial intelligence (AI) techniques, such as machine learning, would on the other hand help alleviate network congestion by processing raw data at AI-enabled edge devices and transmitting only useful information to fog nodes (e.g., base stations) using its inbuilt capabilities of learning, analysis and decision making [3,15]. For instance, a small computing edge device, e.g., Raspberry Pi, integrated with a global positioning system (GPS), a camera and other sensors could run customized AI algorithms to transfer only relevant data to the cloud, which could reduce the overall energy consumption in the data capturing, processing and transmission. Finally, we propose to integrate the concept of passive optical and wireless networks, known as fiber-wireless (FiWi) networks, to build an early warning system network. This is because passive optical network (PON) is economical not only to provide broadband services, but also an access to the next generation (5G) mobile networks.
In this paper, we propose and study an early warning system using the IoT-fog-to-cloud system comprising of IoT devices (cameras, sensors), base stations (BSs) and the cloud. In the proposed system, we first detect movements of animals at sensor nodes, then transfer sensor data to fog nodes (at BSs) over wireless sensor aggregation networks, and finally to the cloud for further processing over a passive optical network. The information processed is then distributed to humans (or vehicles) that are living (or passing by) near areas of animal habitats. Since an early warning system is a latency-critical application, the main question we try to answer is whether to transfer all data to higher layers for better inference (with respect to classification or alert accuracy) or to process data at edge devices before transferring to the fog nodes (e.g., base stations). At the same time, however, processing of data at its origin, i.e., edge devices (that would result in transferring lesser data) could result in false alarms being generated due to the limited store and computing power of edge devices. Thus, first we try to find the trade-off between communication cost and computation/processing cost through an experimental setup by showing the average amount of current drawn (or energy consumed) during image capturing, processing and transmission. Then, we show the trade-off between end-to-end latency (time between animal appearance to notification) and data volume transferred for each animal detection event in our distributed computing and AI-enabled early warning system through a simulation. Our experimental results show that data processing at end devices could save around 57% energy.

Related Work

Animal-human cohabitation is a worldwide problem, which is increasing with human population and our desire to build more and more infrastructures at the cost of loss of animal habitats [16]. Many researchers proposed non-technical as well as technical solutions to cope with this problem. Some of the solutions include building walls, fences, etc, in the periphery of animal habitation or around rail/road transportation infrastructures to reduce wildlife-human collisions [17]. However, a manual fencing solution is unfeasible in difficult terrains and also uneconomic. [18] proposed an interesting solution, which is also profitable, wherein authors employ bees to deter elephants from damaging the vegetation and trees in Africa. A few notable past works [1,4,5,6,7,8,9,10,11,12,13] have tackled the issues of animal behavior monitoring and proposed technical solutions, mainly warning systems. Ujvari and D’Angelo studied behavioral responses of deer to different colors of wildlife warning reflectors [4,5]. The authors concluded that wildlife warning reflectors are ineffective in changing deer behavior, so deer-vehicle collisions might not be prevented. The reason is that reflectors and whistles lack the spatial and temporal precision of association between warning signal and approaching vehicles. Suman used fiber sensors—buried in the ground (within 2 m depth)—to identify the intruding animals/humans based on the characteristic signature of the intruder (animal/human) that walks over the ground where the fiber sensor is buried [1]. A smart fault detection system [6] was proposed to detect breakages in electric fences, which keeps wild elephants away from humans in order to protect both humans and animals in Sri Lanka. Wireless sensor network (WSN) system has been widely used in the past to deal with the animal-human conflict problem. A WSN system that uses passive nodes and infrasonic sounds was deployed in India, as reported by [7] to deter elephants from crossing railways. The use of infrared sensors and seismic sensors was proposed in [8] for detecting wild elephants entering villages. A new WSN system [9,11] was developed to protect both animals and humans by alerting drivers about possible wildlife crossing.
Recently, there has been a growing interest in research community to employing learning-based algorithms in warning systems, and get benefited from learning-based prediction and classification of animals’ behavior [12,13]. Morales et al. [12] used a wireless sensor network to collect information about animals’ behaviors using a neural-network-based classification algorithm, which led to lower power consumption and better behavior monitoring. Backs et al. [13] proposed a warning system that emits flashes of light and bell sounds before train arrival, which is predicted with the help of classification of patterns recorded with vibration spectrograms. Despite all the previous proposed solutions, there is a lack of proposals for smart management of animal-human cohabitation that could integrate IoT-fog-to-cloud networks, as the one presented in this paper which also considers the study of resource usage and machine learning.
The rest of this paper is organized as follows. Section 2 and Section 3 briefly describe the suitability of FiWi networks and machine learning, respectively, in the proposed animal-human cohabitation system. Section 4 shows the communication and computation costs through experimental measurements. We describe implementation details of an early warning system in Section 5, and evaluate the performance in Section 6. Finally, we conclude the paper in Section 7.

2. FiWi Networks

The dependency on cloud-based services is growing, and so is the amount of network traffic from IoT devices to the cloud, and vice versa. Thus, hybrid fiber-wireless networks present a viable solution to ensure high capacity, high flexibility and low-cost broadband access to cloud-based services [19]. A typical architecture of a FiWi network is an integrated passive optical network and wireless networks, where each optical network unit (ONU) is connected to several wireless nodes (e.g., sensors, smartphones) through a wireless gateway (e.g., base station).
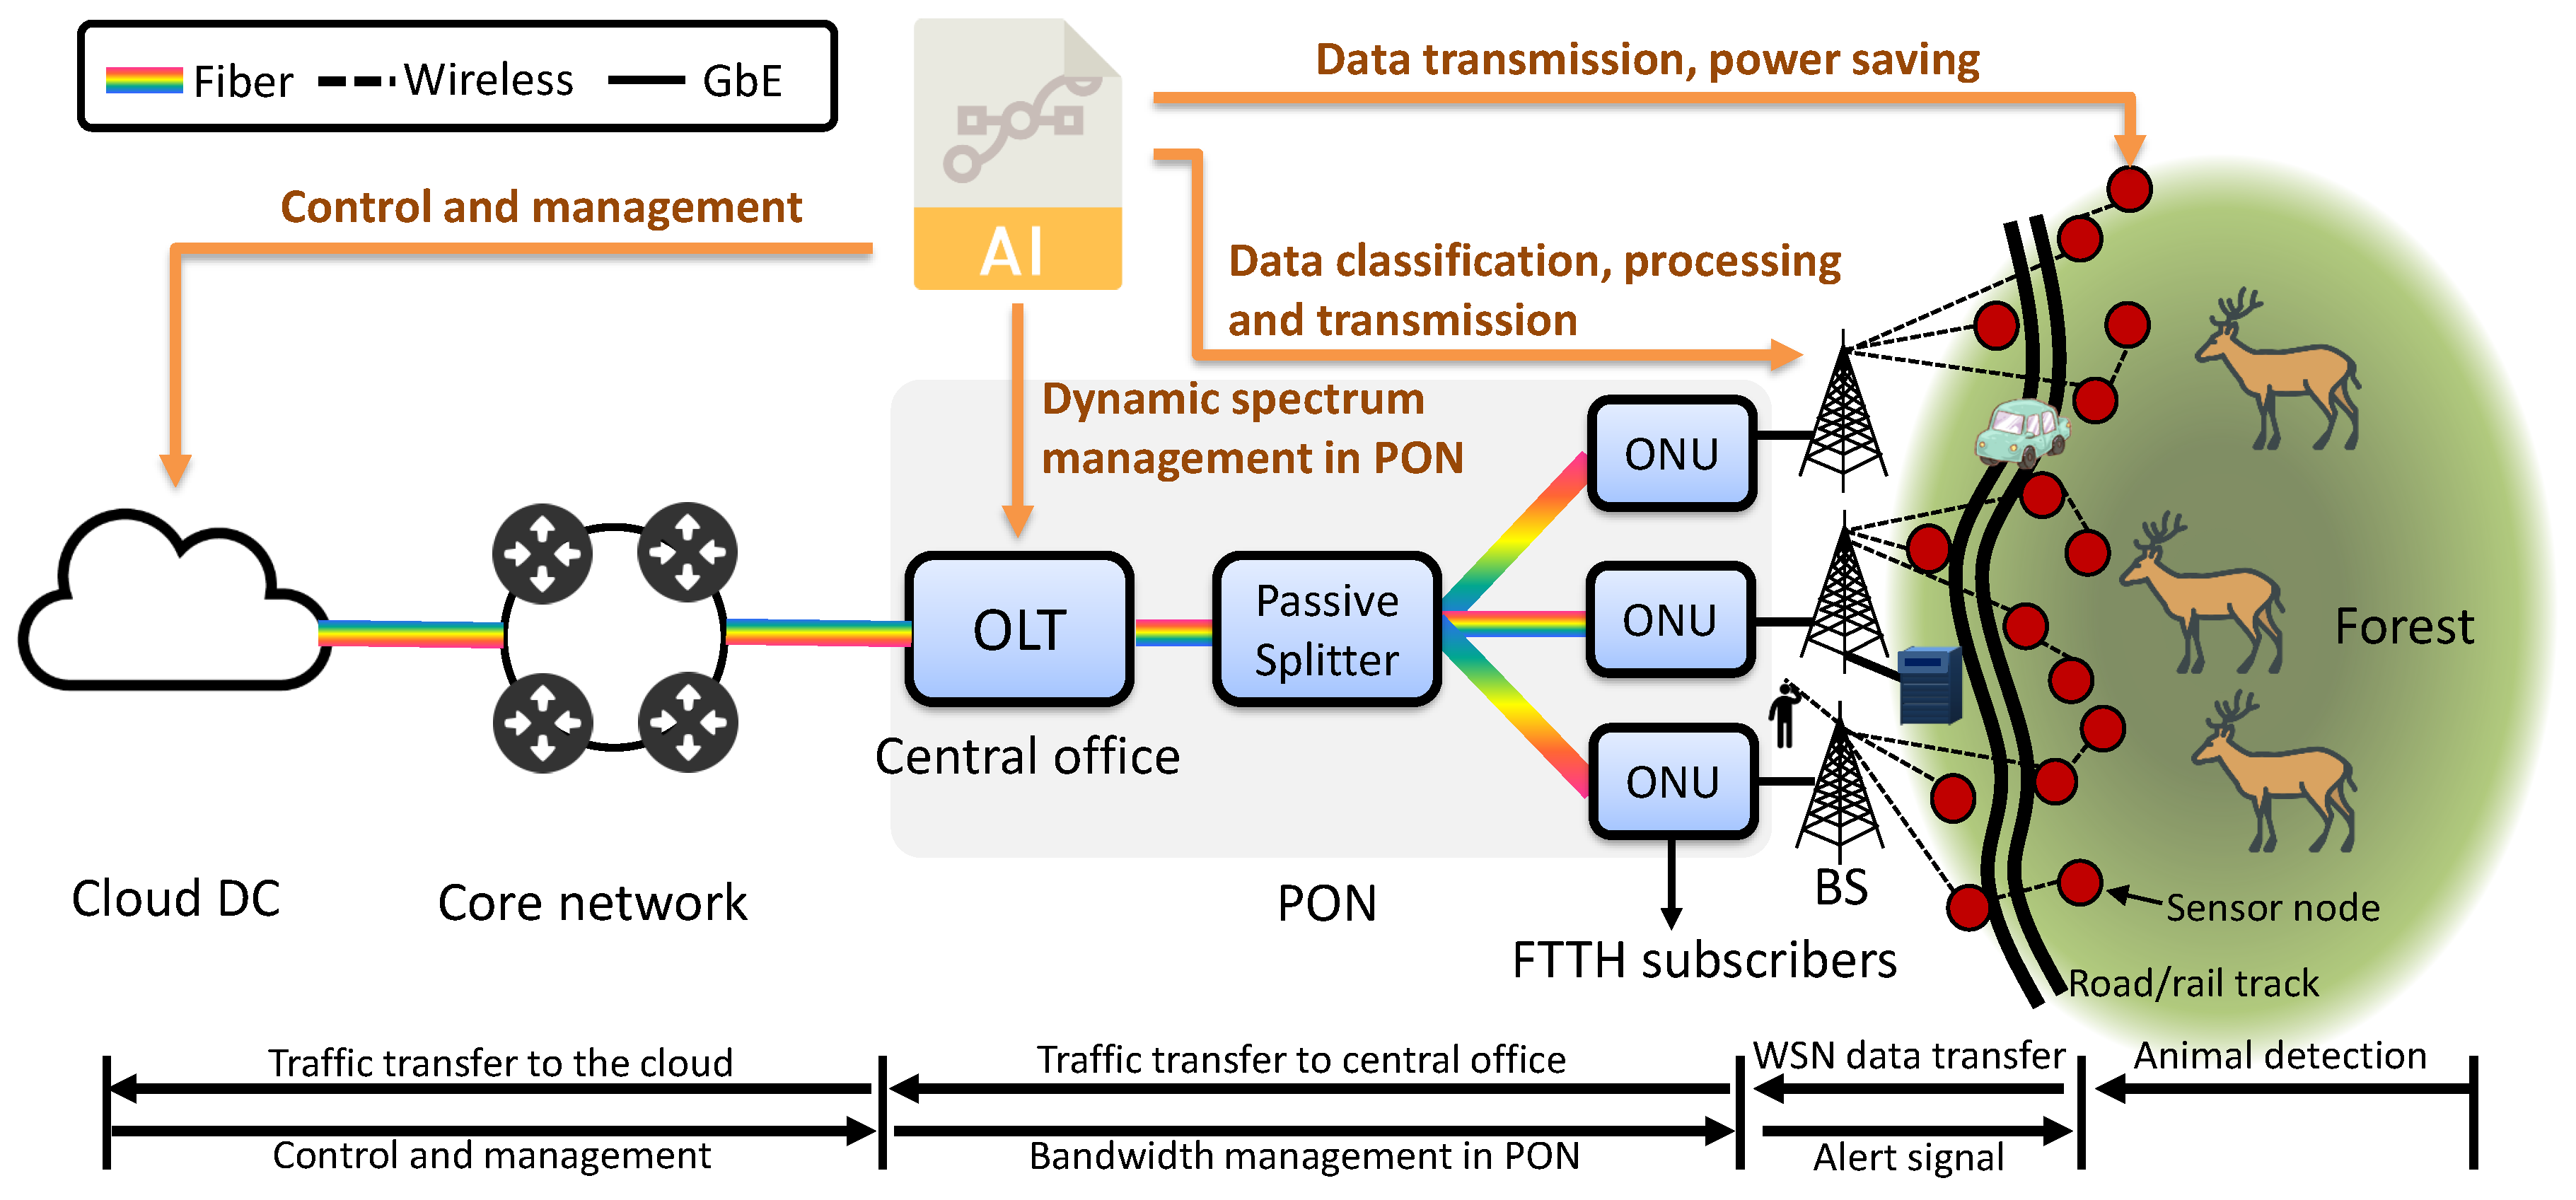
Figure 1 illustrates an envisioned FiWi architecture that integrates a passive optical network (PON) and wireless sensor networks (WSNs), and shows an example of network subsystems in all three layers: edge (sensors), fog (BSs, ONUs), and the cloud. As a main block of a FiWi network, a PON consists of an optical line terminal (OLT) at the service provider’s central office, a passive splitter and optical network units (ONUs). An OLT is a terminal equipment that includes a gateway router to connect PON to the fiber backbone or core networks. Additionally, its main function is to define transmission window and allocate bandwidth to ONUs which are near the end users. ONUs are expected to serve heterogeneous traffic of end-devices, since they would connect to wired, e.g., fiber-to-the-home (FTTH) subscribers, and wireless traffic through BSs in the 5th generation mobile networks. A single or a group of passive splitters allows to share a PON network among many end users by means of splitting power in Ethernet PON and/or demultiplexing wavelengths in wavelength-division multiplexing (WDM) PONs.
In this paper, we use an orthogonal frequency-division multiplexing (OFDM)-PON architecture, where each ONU processes only its assigned fraction of the OFDM spectrum generated by the OLT. This is because of its known better performance in terms of latency and synchronization compared to other PON technologies [20]. Also, dynamic bandwidth allocation techniques used in the OFDM-PON fully exploit the spectrum flexibility. This motivates us to use the system such that we allocate subcarriers’ bandwidth based on the traffic volume of each class (cellular, FTTH and animal) within each ONU. At the same time, however, segregation of bandwidth requires the classification and prediction of traffic volumes, which in fact can be done through AI techniques. Various AI-based applications can be envisioned in Figure 1, including the management of network devices and bandwidth allocation. For instance, instead of running a centralized bandwidth management of PON subsystems at the cloud, a central office (OLT) could dynamically allocate spectrum in PON subsystems based on the traffic predicted at its ONUs. This would help improve the bandwidth management and also latency.
In Figure 1, wireless sensor nodes (edge devices) form an aggregation network along the road (e.g., to mimic a point of human-animal conflict) and they are wirelessly connected with the so-called sinks, denoted as base stations (BSs). Whenever a WSN node detects animals’ presence, it tries to send sensed data (e.g., picture/video) of its surroundings to a nearest BS. The energy aspect is also relevant for systems that are not connected with power grid and are, for example, either battery-based, or solar-powered. Another advantage of AI techniques is that they could also relieve the network congestion by avoiding the unnecessary data transfers, which also improves the end-to-end delay of those transfers that need to go over the network. On the other hand, a limited processing and storage resource pool at sensors would also have negative impact on the accuracy of classification and prediction. In contrast, a cloud-based infrastructure connected to the ONUs could deduce information from the animals’ raw data with more accuracy in classification and prediction. This makes it interesting to investigate the role and placement of AI-based methods in animal welfare and human-animal cohabitation systems based on FiWi.

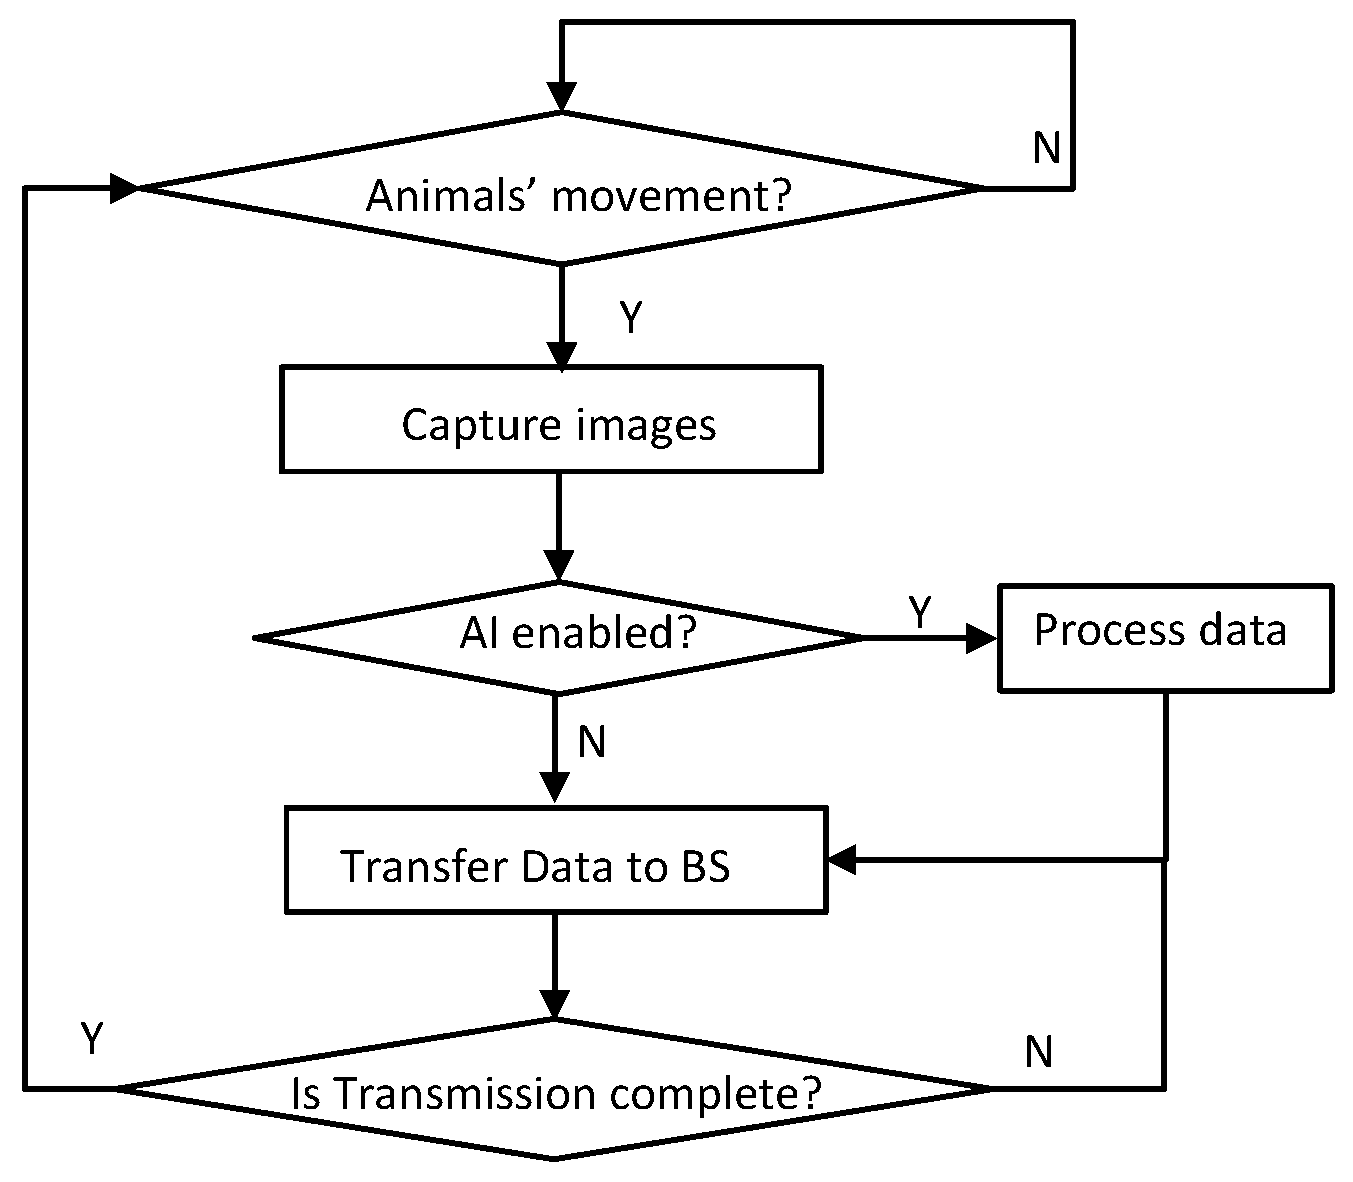
3. The Role of Machine Learning

AI techniques, especially machine learning (ML), are mainly used in networking to make a distributed computing system intelligent enough to take decision on its own on various aspects, for example traffic engineering; changing device setting based on collected and processed data; how much data to transmit from edge devices to fog nodes and/or to the cloud, etc. Machine learning helps particularly in identification of animals’ movement using image classification algorithms, and predicting animals’ movement or traffic in general, correlate it with human movement and traffic, or classifying animals’ behavior. Additionally, based on the network data traffic predicted, a hybrid approach of processing and communication could be used. In other words, animals’ data could be processed at the source sensor (or end device) when the animal movement is predicted as more likely to happen. On the other hand, when animal movement is less likely to happen, during that period, most of the data collected could be transferred to fog nodes (e.g., server, mini-cloud) for more accurate processing, since a fog node with enough compute and storage capability can run heavyweight deep neural network models (e.g., ImageNet [21]) that generally have more hidden layers and neurons than the lightweight models. At the same time, and as previously mentioned, attention needs to be paid to the accuracy of the classification and the prediction, which is a challenge.
Machine learning has also been successfully used in optical transmission systems and networks, as presented in a survey [15]. In our OFDM-PON architecture, machine learning could also split optical resources flexibly based on predicted traffic demands of heterogeneous services. For example, in a PON, upstream flow scheduling at ONUs is more critical due to lower data rate (e.g., 2.5 Gb/s) as compared to downstream traffic at OLT with higher data rate (e.g., 10 Gb/s). Moreover, an ONU needs to allocate OFDM subcarriers in an OFDM-PON or time slot in an Ethernet-PON to various types of application demands based on their requirements (latency, bandwidth). As observed in the literature, peak and low of various traffic patterns could occur at different times during a day. Thus, learning-based traffic prediction could allocate just-enough bandwidth to data traffic demands [22]. In 5G, for example, cellular connections would need to satisfy latency in the order of milliseconds. Therefore, a set of dedicated but flexible frequency bands and slots must be assigned for latency-sensitive applications. More importantly, a lightweight image classification model, such as MobileNet [23], can be run on power and resource constrained end devices, and they could be helpful in identifying animals’ presence or absence, and other related information.
To address the issue of the said granularity of traffic patterns, we consider multi-class (three) traffic scenarios and use machine-learning-based traffic prediction to allocate bandwidth as per traffic demands of each class. Specifically, we use a long short-term memory (LSTM) network model—a recurrent neural network with LSTM units [24], for the time-series traffic prediction, since it is capable of learning long-term dependencies. More importantly, it avoids vanishing gradients, which is a common problem in machine learning algorithms where the gradient of error functions decreases quickly without improving the learning process. To get a good prediction, a machine learning algorithm needs to be trained with many and different traffic patterns, and depending on the number of hidden layers, neurons per layer and training datasets, it predicts (also classify) the future events. In our approach, we first generated a time-varying mean and variance, and used lognormal distribution to generate a set of traffic data samples [22]. The time-varying mean values (data) is obtained using the superposition of sinusoidal functions, as given by Equation (1), where α is an amplitude constant, β k and ϕ k are frequency-dependent constants, and n is the number of frequency components ( ω k ).
m ( t ) = α + k = 1 n β k × s i n ( ω k t + ϕ k )
We generated 43,200 traffic data samples per traffic class for training, validation and testing of the prediction model, out of which 67% is used for training, and remaining 33% for validation and testing of a LSTM network model, which consists of an input layer, a hidden layer with 4 LSTM blocks, and an output layer that makes a single value prediction. Each LSTM block has a memory cell for storing a value for long or short time periods and gates (input, output, and forget) for acting on signals (x) they receive using sigmoid (shown in Equation (2)) and tanh activation functions. We used an Adam optimizer to automatically set learning rate and to update network weights.
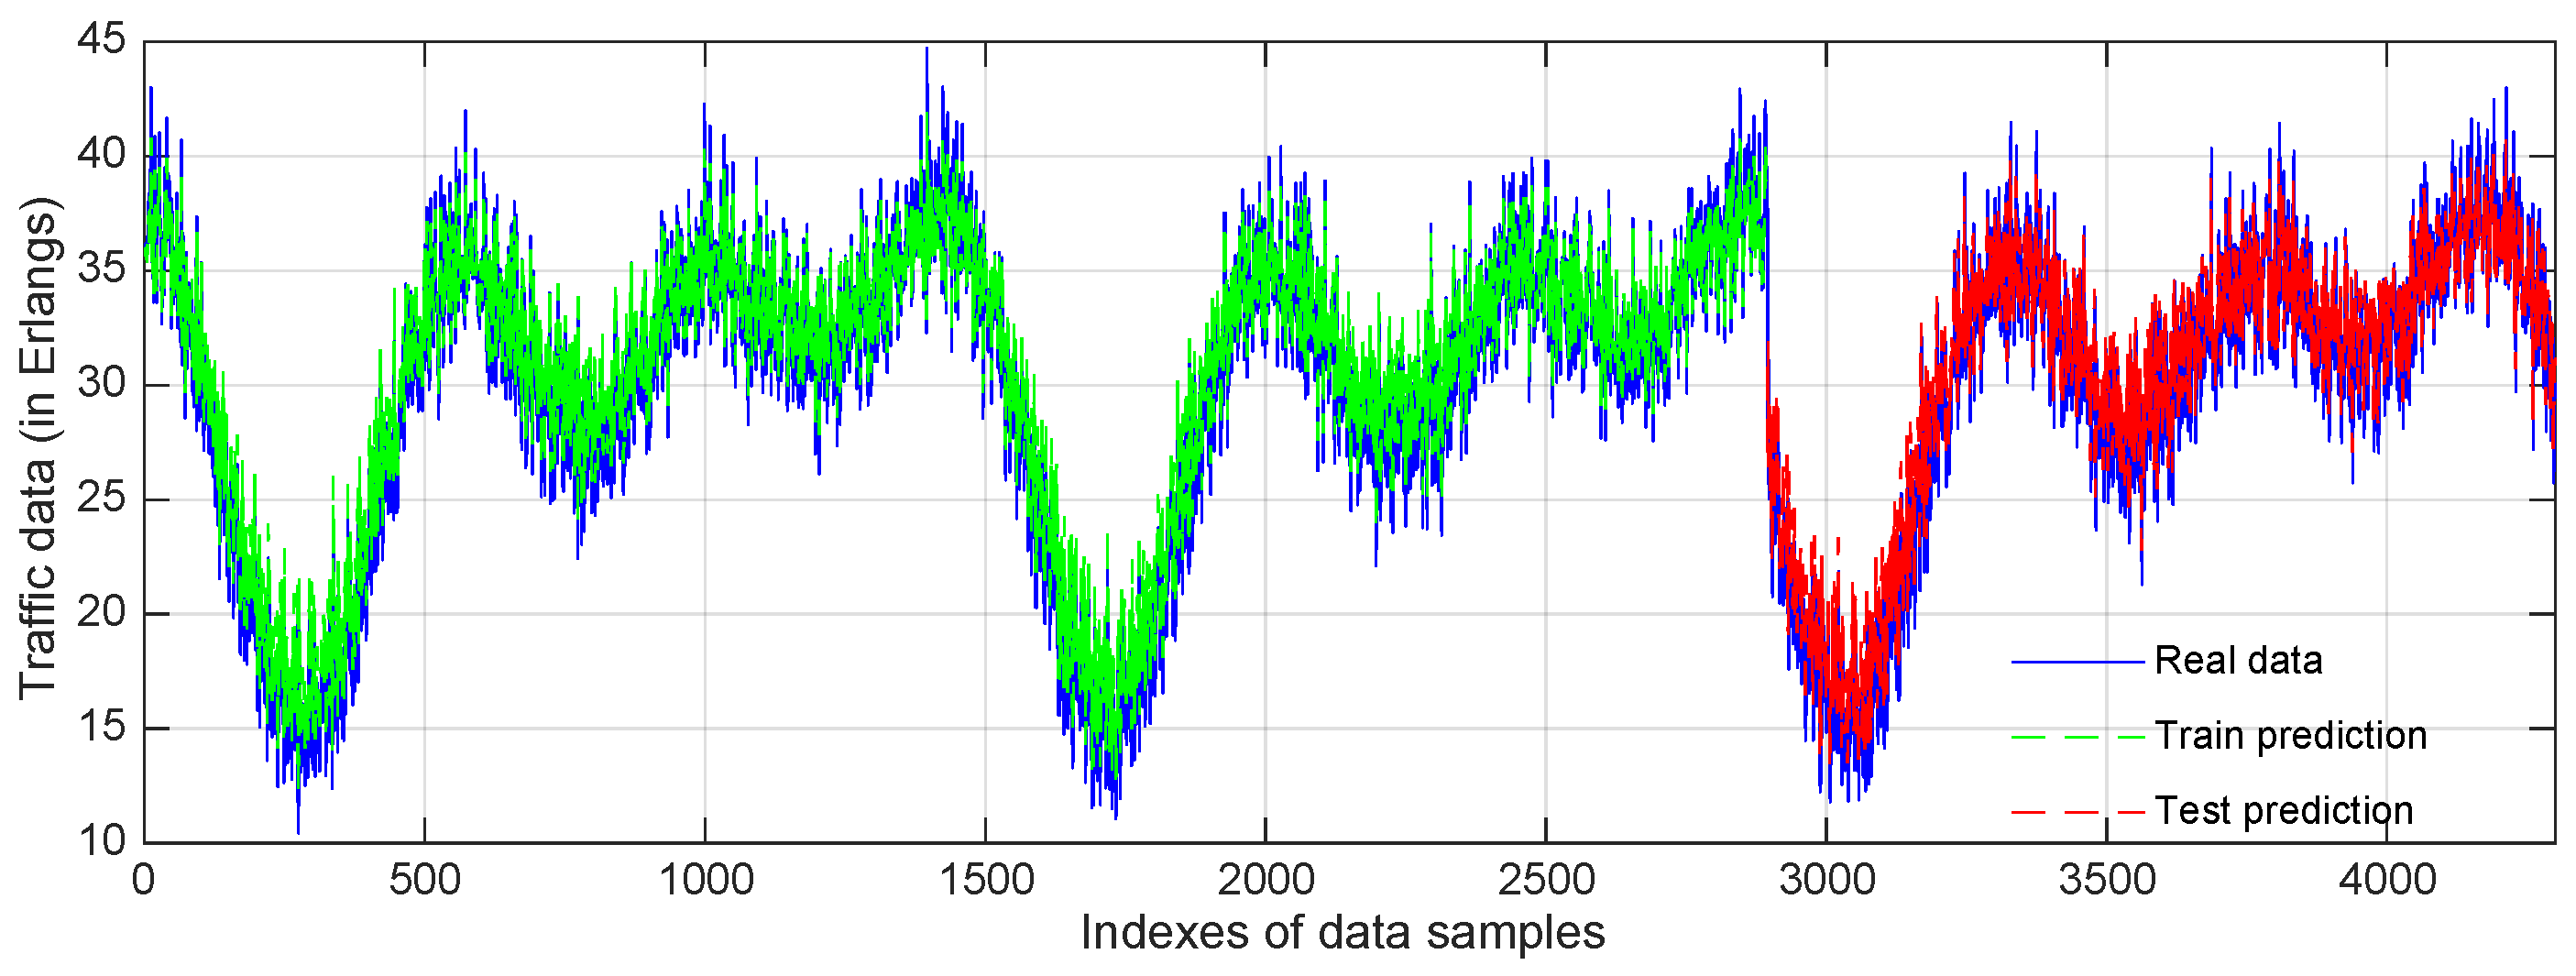
f ( x ) = 1 1 + e x
In Figure 2, a small fraction of real traffic data and predicted data during training and testing is shown against the indexes of traffic values to illustrate the prediction accuracy of a traffic class using the LSTM network model. We can see that the LSTM neural network-based prediction is very good, since root mean square errors during the training and the testing are very low (3.04 and 3.08 respectively). Thus, LSTM networks can learn various traffic patterns to predict the future traffic, which is the reason we propose to use it in allocating spectrum proportionately to different classes of traffic. Additionally, for animal identification on end devices (Raspberry Pi) connected with sensors, we use a MobileNet model [23] which is proposed recently for image processing on resource and power constrained devices, such as smart phones. The MobileNet model utilizes convolutional neural networks (CNN), wherein depth-wise separable convolutions are used to build lightweight deep neural networks.

4. Computation vs. Communication

With the increasing availability of low cost and computing capable end devices, there is a paradigm shift from cloud computing to edge or fog computing today. Nevertheless, the end devices are mostly resource constrained and also power constrained when they are remotely located. Therefore, an important aspect in an animal-human cohabitation system based on an IoT-fog-to-cloud architecture is to analyze the trade-off between the computation cost and the communication cost in terms of energy consumption at end devices. In this section, we show this trade-off through an experimental setup and measurement results. Throughout this paper, we assume that an edge (end) device, e.g., Raspberry Pi (R-Pi), has some computational capability and it can also communicate to other edge devices or upper layer nodes, e.g., base stations or servers. The end devices are integrated with various sensors.

Experimental Setup and Measurement Results

The experimental setup is shown in Figure 3. A R-Pi 3 (model B) as an end device is connected to a passive infrared (PIR) sensor to detect the movement of animals, and the PIR sensor is used to wake up a 5 megapixel (MP) camera module to capture images of animals. Additionally, we utilize a low-power ZigBee communication protocol to transfer data between an end device and a server (PC) without any packet retransmission. For which, we use two XBee transceiver modules, one is configured as an end device and connected to the R-Pi, and another is configured as a coordinator and it is connected to the server situated a few meters apart. Since the R-Pi can process images with the help of a convolutional neural network (CNN) image classification algorithm, we evaluate two scenarios: (i) capture-transfer, and (ii) capture-process-transfer. The capture-transfer scenario captures an image at the end device and then transfers its binary data to the server. On the other hand, the latter scenario captures an image, processes it to detect whether animals are present or not and their types, and finally the end device transfers a message about the animals’ presence in its vicinity. For the image processing and classification on the R-Pi, we install a pre-trained CNN model (trained on a PC) using a TensorFlow framework [25] which is widely used in the community on the R-Pi. The experimental setup to measure the current drawn during the operation of the two scenarios is shown in Figure 3. We use an oscilloscope to measure the amount of current drawn by the R-Pi module. The current is measured from the voltage drop across a very low shunt resistor (1 Ohm), which is connected in series to the R-Pi module.
To find the trade-off between the communication and the computation costs in terms of average consumption of energy, let us evaluate individual parts associated with both scenarios. Figure 4a shows the average current required to capture an 89 Kilobytes (KB) image, which is triggered when a PIR sensor detects a movement around it. The amount of current drawn depends on various parameters: camera resolution, picture size, color quantization, image compression (raw, jpeg, png), etc. For this measurement, we used a 5 MP camera and set it up to capture 299 × 299 pixel color images. We used jpeg as a compression format. The average time required for the camera to capture an 89 KB image is around 0.84 s. The second part in the capture-transfer scenario is the transmission of the image captured in the previous step to the server. The energy consumed (or current drawn) by the system during the transmission varies depending on the amount of data transmitted, distance between the sender and the receiver, and the selected working mode, since the XBee transceiver module can work in different modes: coordinator, router or end device. In this setup we evaluate a single-hop transmission, i.e., one XBee is configured as an end device (integrated with the R-Pi) and another as a coordinator (attached to a PC by a USB connector). Figure 4b shows the average current drawn by the R-Pi module while transmitting an 89 KB image. The transmission time for this operation is around 19.33 s. Therefore, the average transmission rate achieved in our experiment is only ∼37 Kbit/s, which is much lower than the maximum data rate that a ZigBee (or IEEE 802.15.4) end device can transfer, i.e., 250 Kbit/s in a 2.4 GHz spectrum band. Moreover, the average per packet latency is around 22 milliseconds if we ignore the control packets, which is negligible as compare to 89 KB data, since each data packet carries approximately 100 bytes of payload, and the transmission time of 89 KB data is around 19.33 s. Therefore, the energy consumed in the capture-transfer scenario at 5 V is approximately given as 5 × ( 0.44 × 0.84 + 0.39 × 19.33 ) =39.5 J, which uses the average current 0.44 A for the image capturing, and 0.39 A for its transmission.
For the capture-process-transfer scenario we process a captured image before transmitting some relevant information. Figure 4c shows the average current required to process an image. For the image classification (processing), we used one of the widely used CNN models on constrained devices: MobileNet. MobileNet is a small size CNN that can support different input image resolutions. The classification accuracy improves with higher resolutions, however, at the expense of more processing time. The model is retrained to recognize two classes of images: the presence and the absence of animals inside the captured image. The classification time for an 89 KB image is around 6.8 s. Finally, a 12 bytes data message about the presence or absence of animals and their types are transferred from the end device to the server, for which the average drawn current is shown in Figure 4d, which takes 0.05 s. The total runtime for the three operations shown in Figure 4a,c,d is around 7.6 s, and the energy consumed in the capture-process-transfer scenario at 5 V is around 5 × ( 0.44 × 0.84 + 0.44 × 6.8 + 0.40 × 0.05 ) = 16.9 J, which results in ∼57.2% energy saving as compare to the capture-transfer scenario. Thus, we can conclude that the communication cost in power constrained devices could be very high if they require to transfer more data. Notice also that the necessary time to realize the capture-transfer scenario is much higher (around 20 s) than the second scenario (7.7 s). Therefore, it is better to compute and process at the end devices, if possible, and transfer only relevant information to the server. It should be noted that the energy consumption can be further reduced by processing data near sensor nodes using lightweight machine learning algorithms, such as hidden Markov model, support vector machine, etc. However, the classification accuracy would be reduced, which might result in generating more false alarms [26].

5. A Framework for an Early Warning System

In this section, we present a framework for an early warning system, and describe its implementation details.

Implementation Details

To analyze the performance of the proposed network system, we design the following subsystems, earlier illustrated in Figure 1: (i) animal detection; (ii) message transfer to fog nodes (BSs); (iii) alert vehicles/humans, when necessary; and (iv) bandwidth allocation subsystem in the OFDM-PON, located between fog nodes and the cloud. Let us now present and discuss each subsystem one-by-one.
Animal detection subsystem is the most crucial part of the animal-human cohabitation system. As energy is a major issue in remote sensors, only a few sensors need to continuously detect the animal crossing events by sensing surrounding movement, pressure, vibration etc. At the same time, disturbances caused by the wind and other events that can create false alarms (such as large birds) need to be differentiated from relevant animal events. It has been shown earlier that fiber- or infrared-based sensors are most suitable for this purpose [1]. Once animals are detected, the animal triggering sensors (e.g., PIR) would wake up other sensors (camera) to capture mainly images, which then needs to be processed to find animals’ size, position, speed, numbers, direction and other specific features. As we discussed before, the processing of raw data either at origin (end devices) or at higher layers (fog or cloud) depends on the capability of sensor nodes as well as on network ability to transfer data without congestion. Even though a capable end-device with various sensors could process the raw data, in case of images, the processed data need to be sent to fog nodes (see Figure 5), which can reprocess it to decide whether to generate an alert message or not.
The second subsystem is responsible for transferring of the processed or unprocessed data to fog (BS) nodes. For this purpose, whenever a sensor detects movements of animals, it tries to send raw data (e.g., pictures, GPS signal) or just relevant (processed) data to a sink node, i.e., BS. Whether to send raw or only relevant data depends on the AI running capability of end devices. A flow chart in Figure 5 describes various sub-tasks of the first two subsystems. It starts with animal detection, then images are captured, and data is processed at end devices if they could run processing algorithms. At last (un)processed data is transferred from end devices to BSs. We utilize a low-power ZigBee communication protocol to transfer data from sensor nodes to BSs, which specifies a maximum 250 Kbit/s data rate and transmits 128 bytes per packet (where approximately 100 bytes can be the data payload) over unlicensed spectrum of 2.4 GHz. As the sensor nodes are assumed to be deployed along rail/road tracks, and ZigBee utilizes the shortest path to send a packet from a sensor to a BS, we use tree topology in Riverbed (earlier known as OPNET) Modeler simulator [27]. The simulator models three different kind of nodes: End Devices, Routers and Coordinators. End Devices only act as sensor nodes without routing capabilities, while routers can play both sensor and forwarding roles. Finally, coordinators, acting as sinks, are responsible for the connection among all nodes, and are also capable to act as sensor or router nodes.
The third subsystem is dedicated to transfer alert messages to humans/vehicles, and to this end, it may need to be designed to process the data further at fog nodes (BSs) and to trigger the alarm (notification) signal, when necessary. Although the alert signal is generated at BSs, animals’ related traffic still needs to be sent to the cloud for long-term statistics and efficient execution of notification messages by sharing them with neighboring BSs. Therefore, we assume that the fog nodes (BSs, ONUs) locally connect to servers or a mini-cloud for processing and classification of various traffic (cellular, FTTH, animal). In this way, the mini-cloud is also the part of a fog computing system, able to replacing the cloud functions in the system, which is fog’s salient feature.
As can be seen in Figure 1, each BS is connected directly to an ONU through a Gigabit Ethernet interface, and the OLT schedules the ONU’s traffic by allocating required bandwidth as per their overall traffic demand. However, it should be noticed that various types of traffic share the ONU’s upstream bandwidth. Thus, as mentioned in Section 3, the forth subsystem utilizes the predicted traffic to dynamically allocate bandwidth of OFDM subcarriers per traffic class at ONUs. A new service request is routed over an existing lightpath that has free sufficient bandwidth, otherwise a new lightpath is created to carry traffic of a new request if sufficient resources (spectrum, transceiver) are free. It should also be noted that the cellular and other connection requests are blocked if resources are not sufficient to satisfy the demand. The exception to this is animals’ traffic, as it needs to be transferred to the cloud for long-term statistics. In our approach, the animal’s traffic is transferred either immediately or whenever resources are free, therefore we assume that a queue can be maintained at ONUs/BSs with sufficiently large size to store animals’ data.

6. Performance Evaluation

In this section we evaluate the performance of an integrated IoT-fog-to-cloud early warning system by three performance metrics: average end-to-end per packet latency, notification time, and connection blocking. The average end-to-end packet latency is measured as the average time required to transmit a sensor data packet from an edge device to a BS, which mainly depends on the congestion in WSN networks. The notification time is measured as the average time difference between the animals’ detection and the alert message disbursed to the passing vehicles/humans. The connection blocking happens in the OFDM-PON when ONUs tries to reserve required bandwidth for a certain duration to transfer data of a traffic class.
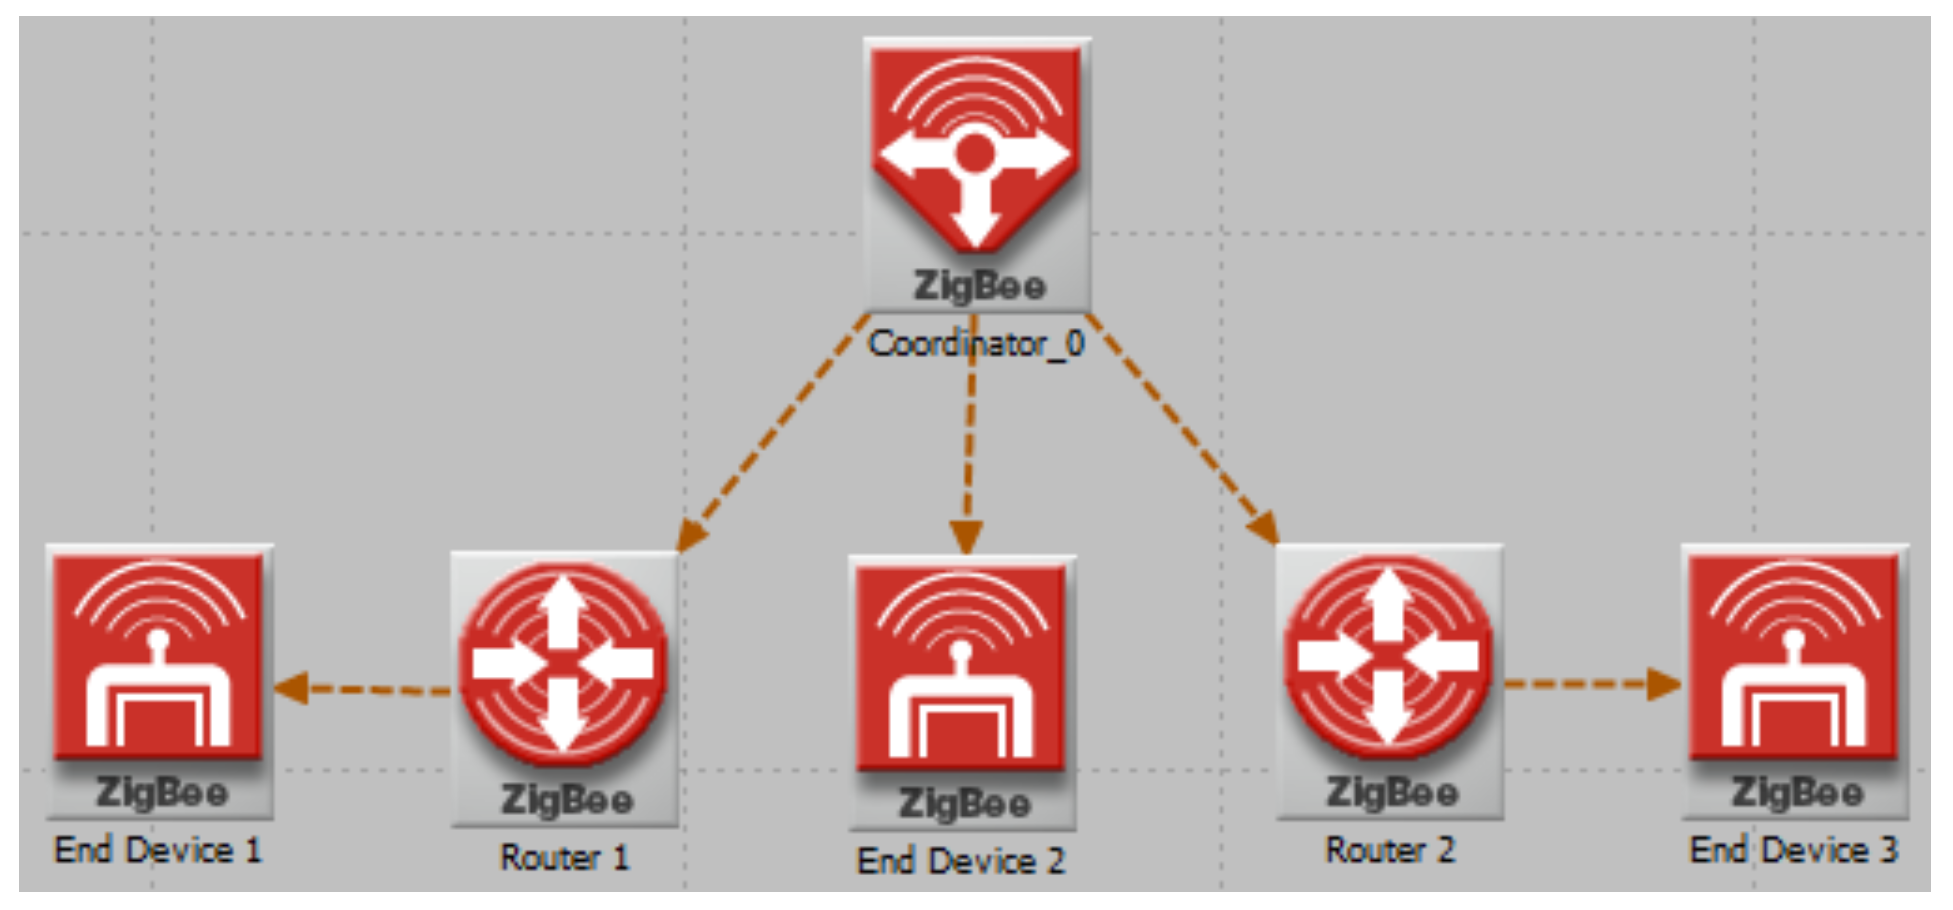
The scenario we analyze using the Riverbed Modeler simulator consists of three end-devices and two routers per coordinator (BS), as shown in Figure 6. End-devices act as sensor nodes, and routers act as relay as well as sensors, detecting the animal presence and capturing images of surroundings to deduce animal information, including animal position, movement direction, speed etc. Data is split into packets of 100 bytes payload (ZigBee), which are queued for transmission. The packets are consecutively forwarded to the coordinator acting as a sink (BS). The OFDM-PON as an optical access network is simulated with 16 ONUs. We assume that a WSN network with 5 sensors is connected to each base station with shortest routing path, and each base station is directly connected to an ONU. The WSN topology is an aggregation-based network, as shown earlier in Figure 1, where the BSs act as sink nodes. Wireless link capacity is assumed to be 250 kilobits per second (Kbit/s) in ZigBee protocol without any packet retransmission. We assume fiber capacity as 4 THz in the OFDM-PON, which is divided among 320 spectrum slices, each with granularity of 12.5 GHz. Each spectrum slice could support a maximum of 25 Gb/s using a QPSK modulation format. All 16 ONUs share equal proportion of fiber upstream bandwidth, i.e., each ONU can reserve 20 spectrum slices.
We evaluate the performance of our animal-human cohabitation system by means of latency observed (i) with AI, that transfers the processed data from sensors to BSs (ii) without AI, that transfers raw sensed data, and (iii) the so-called hybrid approach that transfers most of the data during low traffic condition and only relevant information during busy hour.
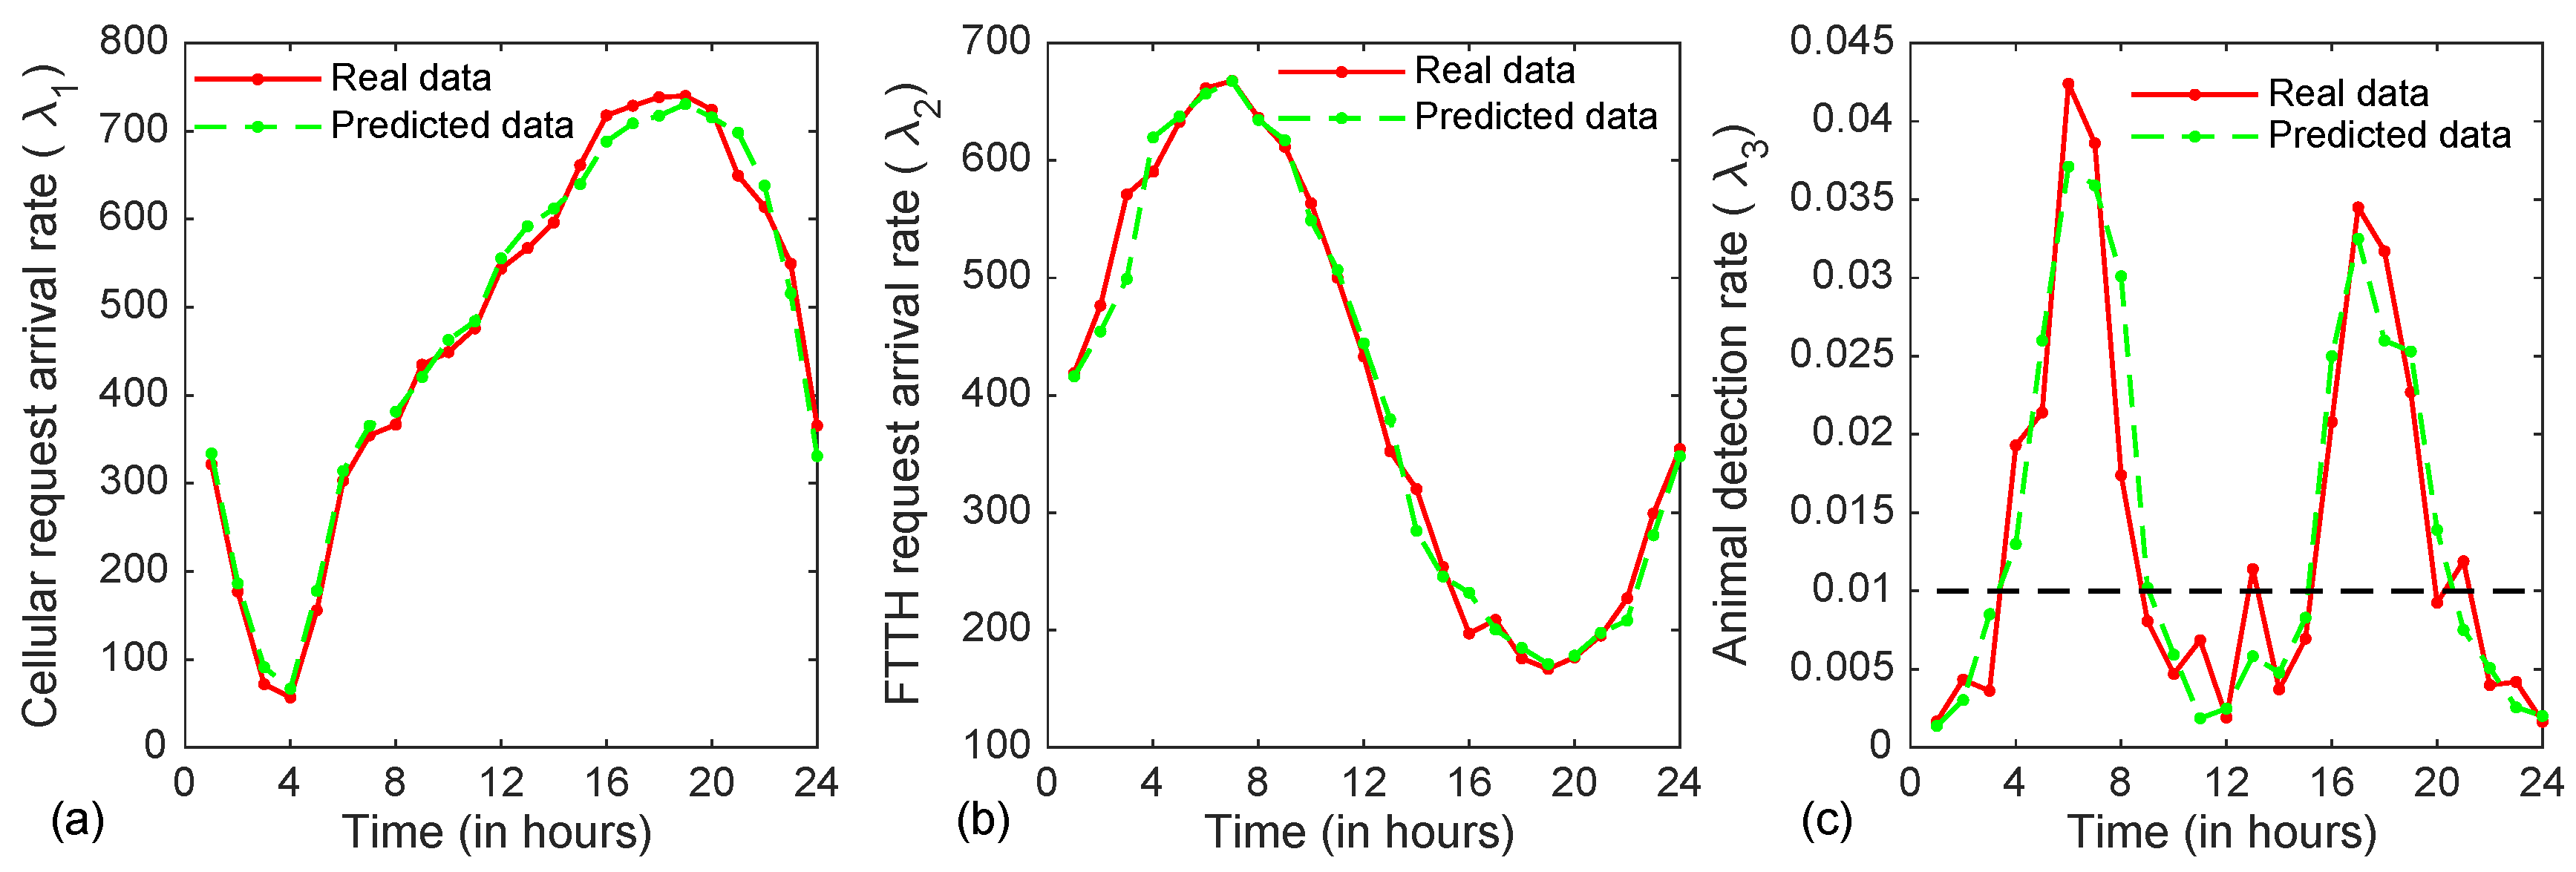
We consider three classes of services: cellular or call (class-1), FTTH (class-2) and animal traffic (class-3). Figure 7 illustrates the real and the predicted time-varying mean traffic arrival rates of these three classes. The simulation parameters are listed in Table 1. It should be noted that mean traffic arrival rates vary with time t, and the traffic per class is calculated as T r k ( t ) = ( N λ k ( t ) / μ k ) , where N is the number of class-k traffic sources, λ k is the class-k mean arrival rate at the source of traffic, and 1 / μ k is the mean holding (service) time of class-k connections that reserves upstream bandwidth between ONUs and a central office. We assume traffic arrival for each class as a Poisson process with time-varying mean arrival rates shown in Figure 7, where the mean arrival rate of a class-k traffic is changed every hour. The mean holding times of class-1 and class-2 traffic are assumed to be exponentially distributed with mean 10 minutes as shown in Table 1. For each animal appearance event at a sensor, its corresponding ONU tries to reserve a 250 Kbit/s bandwidth between the ONU and a central office. Therefore, the mean holding time required to transfer packets of each animal event at ONUs is kept as a constant (40 milliseconds, i.e., 0.00067 minute), since the data volume (processed) of each animal connection that needs to be transferred from an ONU to the central office is fixed as 1 KB, and the required bit rate is assumed to be 250 Kbit/s. The animal appearance events are generated at sensors (end devices), and the cellular and the FTTH arrival events are generated at each BS/ONU. The number of simulated arrival events for every hour varies with the time, since the arrival rate for each class changes after every hour. Furthermore, we are focused on upstream reservation, therefore, all results presented here are based on upstream reservation from edge devices to BSs to central office. We maintain a sufficiently large fixed size queue to store data packets of animal class at each ONU. Other latency-sensitive classes of traffic (cellular and FTTH) are either served immediately or blocked.
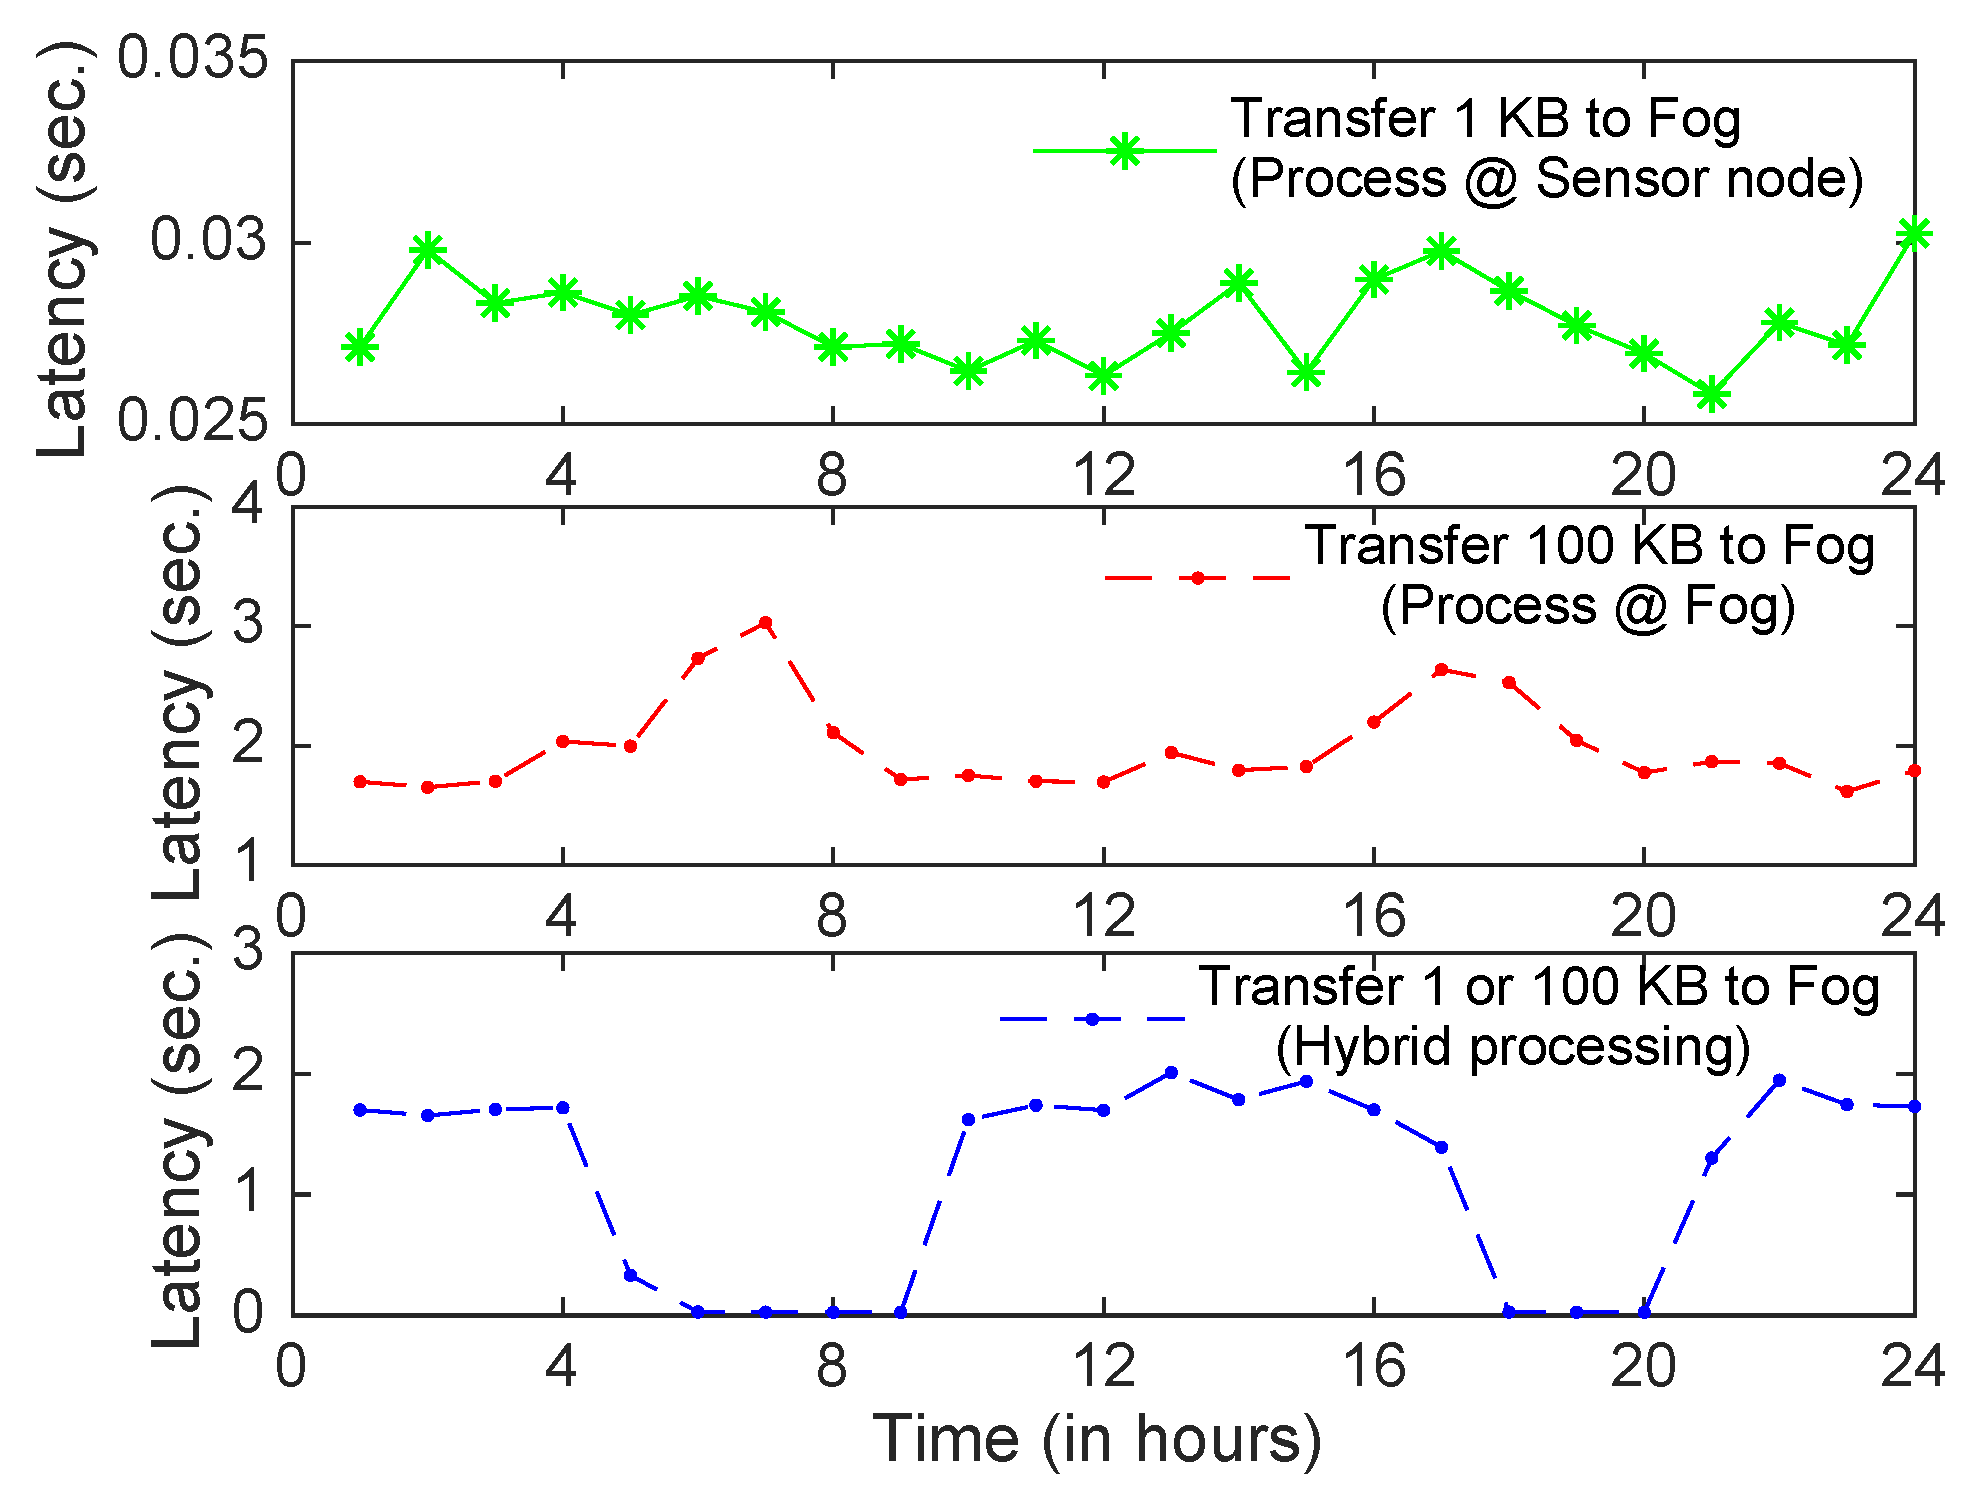
Figure 8 illustrates the average per packet delay (latency) between sensors and BSs of animal traffic under three data transmission scenarios: 1 KB, 100 KB and hybrid (i.e., a mix of 1 and 100 KB) using the ZigBee protocol. These scenarios also depict the case of the data processing at different layers: edge (sensors), fog (BS) and a hybrid approach, i.e., processing either at the edge or at BSs. We could also compare these scenarios with the cloud processing, where raw sensed data is sent to the cloud for the processing and decision making. However, we ignore this scenario, as we did not simulate the core networks and the cloud. However, it is obvious that the latency obtained in the cloud processing will be much higher than that of the other three scenarios presented here. Furthermore, we assume that the given specified data volume is transmitted for every animal detection event at sensors. In the first scenario, we assume that sensors are attached to a processing unit (e.g., R-Pi), thus they run a simple machine learning model (e.g., MobileNet) to detect and classify animals’ related data and transmit only 1 KB of data (around 10 data packets) for every detection, as we have also shown through an experimental setup in Section 4. In the second scenario, end devices (sensors) leave the processing task to the fog layer (BSs) and transmit 100 KB data (around 1000 data packets) to BSs. The hybrid case, on the other hand, takes predicted animal traffic into the account to decide whether to process data at the edge layer (sensors) or at the fog layer (BSs). The decision threshold is shown by a black dotted line in Figure 7c, and it could be set or even varied by monitoring the congestion or by predicted animal traffic. In the hybrid case, we enforce processing at sensor nodes (1 KB transmission) when the predicted arrival rate is higher than the threshold, otherwise the end devices transfer 100 KB data per animal detection.
From Figure 8 we observe that when end devices process the raw data and transfer only 1 KB data to BSs per animal detection event, then the average packet latency varies between 26 to 30 milliseconds. Thus, in this case it can be deduced that WSNs are not congested (i.e., queuing delay is negligible). Therefore, we can compare it with the one-hop transmission in experimental setup in Section 4, where the average per packet latency is obtained as 22 milliseconds. We observe that both results are comparable. However, it also depends on the distance between a transmitter and a receiver. Unlike the experimental setup, the maximum distance between end devices and routers/coordinator is kept in the simulator environment, so a small propagation delay also contributes to the latency obtained in the simulation environment. Furthermore, the effect of congestion on packet latency can be seen in the 100 KB transmission case, and the latency increases by two order of magnitude than that of the prior scenario (1 KB transmission). Interestingly, the average packet latency in the hybrid scenario can be reduced from a few seconds to milliseconds during the congestion hours of the day by applying an intelligent control mechanism using the traffic prediction.
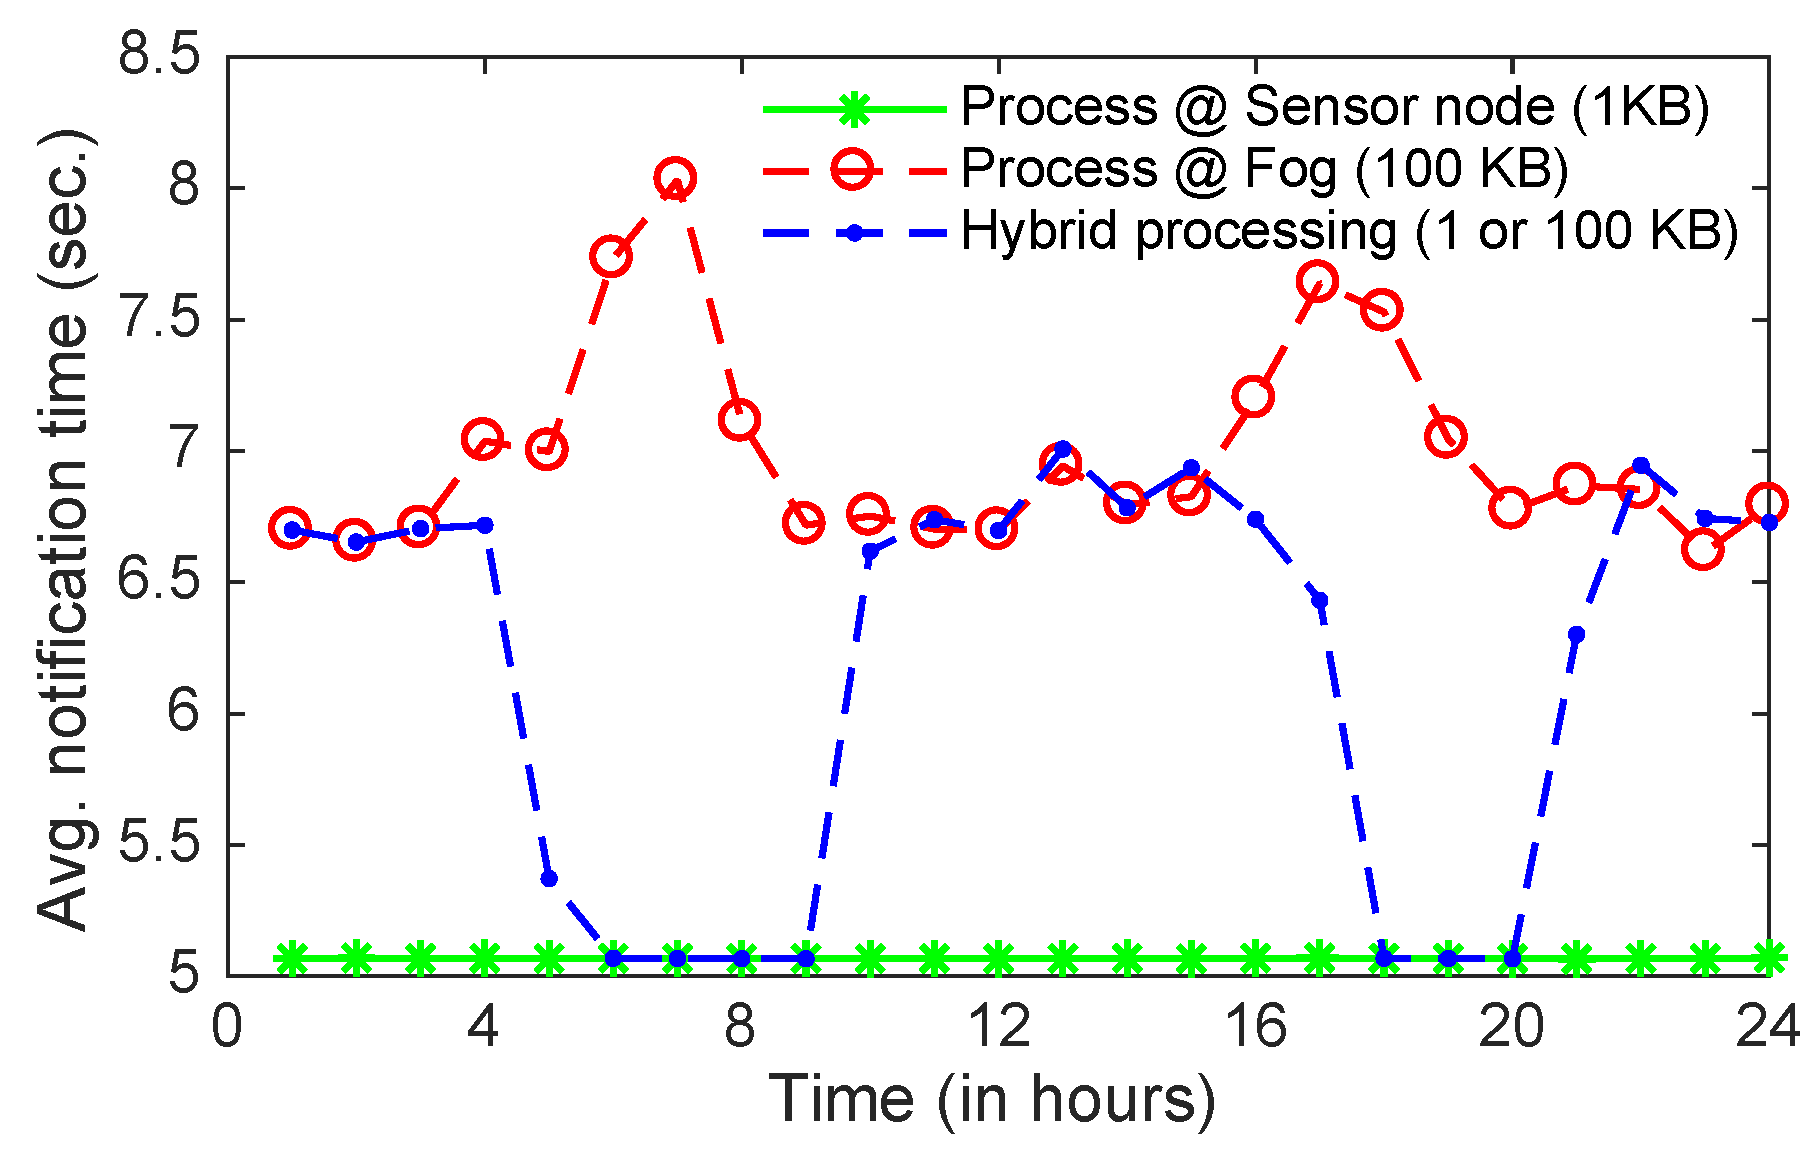
Figure 9 shows the approximate average notification time, which is the average value of the time difference between the arrival of an animal detection event and an alert message disbursed to the passing vehicles/humans. The notification time is calculated as the sum of the data transmission time, the average packet latency and the processing time. We ignore the latency in disbursing alert messages from BSs to passing vehicles, since it is negligible as compared to other latencies and remains same in all three scenarios compared here. Furthermore, we assume that processing times at sensors and BSs are 5 s and 1 s, respectively. ZigBee transmits 100 bytes data per packet at a maximum rate of 250 Kbit/s, thus the total transmission times of 1KB (10 packets) and 100 KB (1000 packets) data are approximately 0.04 s and 4 s, respectively. As can be seen in Figure 9, the notification time in the second scenario (i.e., processing at fog and 100 KB data transmission) varies from 6.5 s to 8 s as compare to the first scenario (processing at sensors and transferring just relevant information 1 KB), which is around 5 s. It should be noted that even though the processing time at the edge layer (5 s) is selected four times longer than that of the fog layer (1 s), it is beneficial to process data at the edge layer and transfer only relevant data to higher layers during the peak hours (dawn and dusk) as done in the hybrid processing, especially in WSNs with low power communication protocol (e.g., ZigBee), since the packet latency and the transmission time are the main contributors in the notification time.
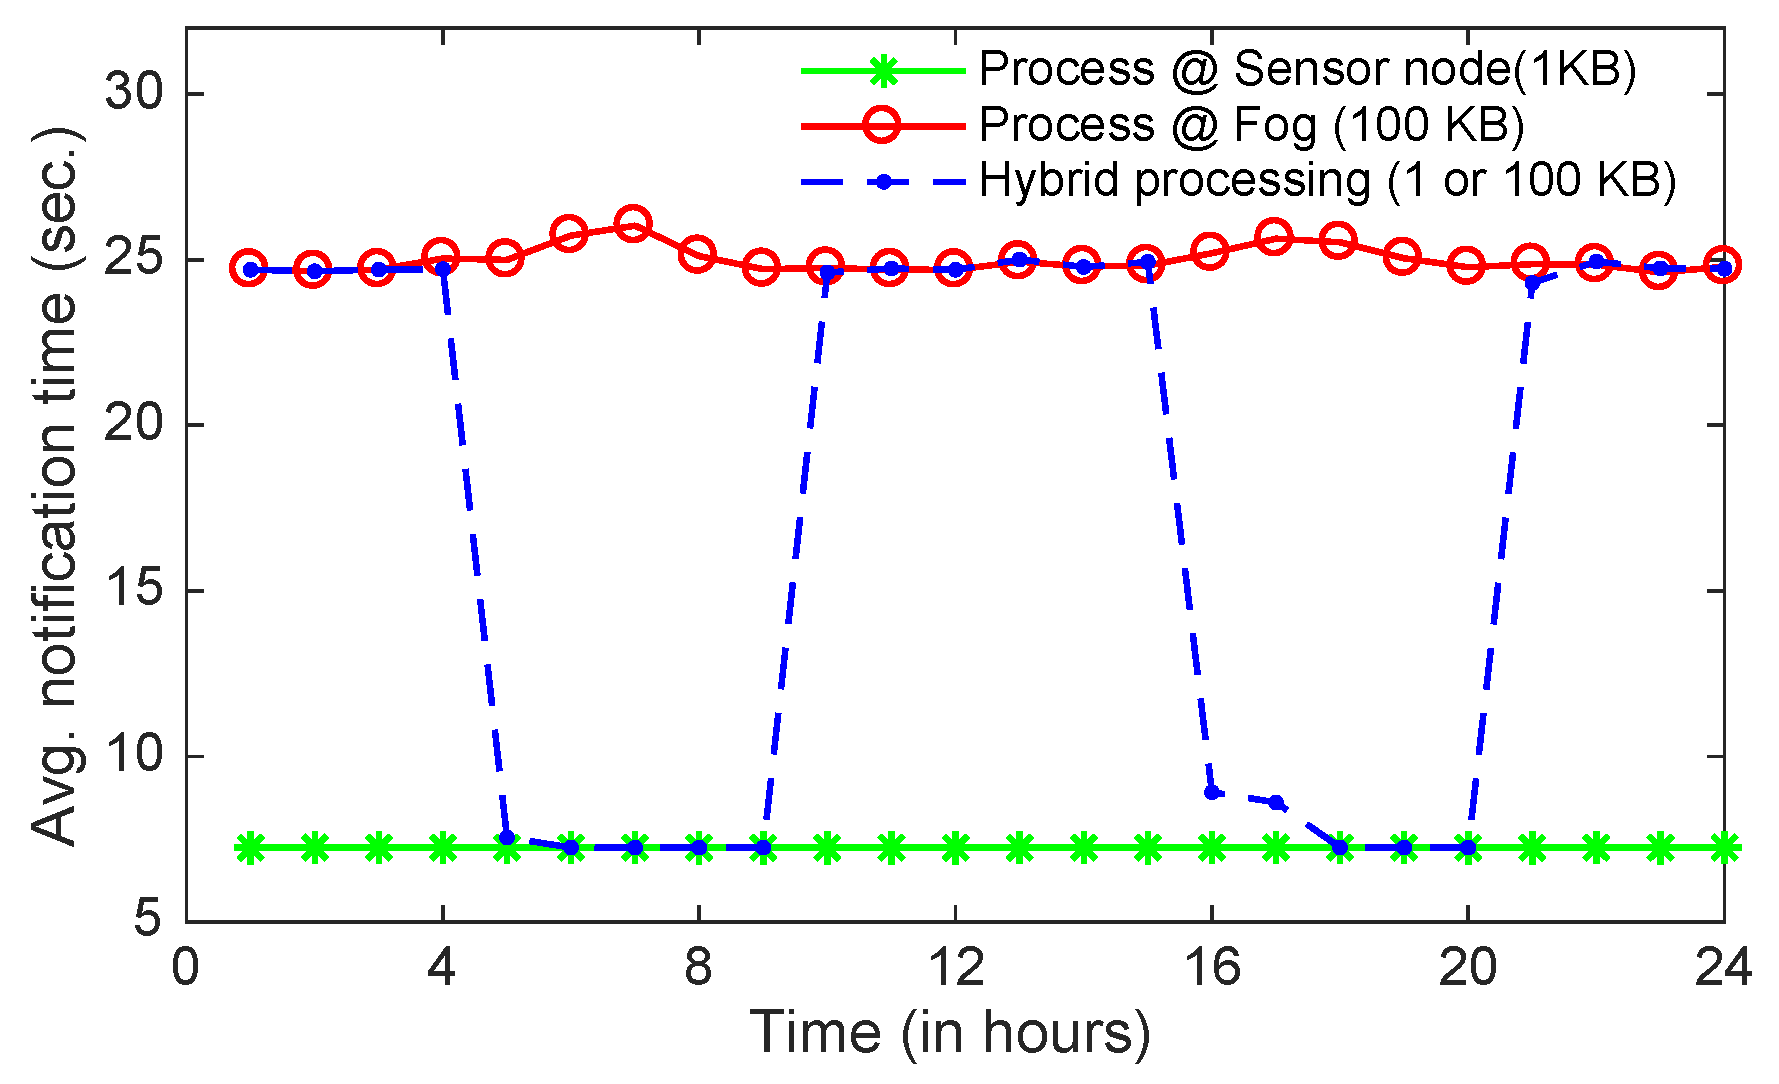
The above observation would be further reinforced when we plot the notification time using the average data rate obtained through the experiments (i.e., 37 Kbit/s) with ZigBee transmission protocol, which is much lower than the maximum achievable data rate (250 Kbit/s). Therefore, at 37 Kbit/s data rate the total transmission times of 1 KB and 100 KB data are approximately 0.22 s and 22 s, respectively. Also, using the image processing done by the pre-trained MobileNet model, the processing time of an image with size 100 KB at an end device such as Raspberry Pi is around 7 s. Let us assume that the processing time at fog nodes (BSs) remains as 1 s. The notification times for all three scenarios have been depicted in Figure 10. We conclude that it is essential to process data at end devices for most of the time when transmission time is the dominating factor in order to obtain lower notification time, lower energy consumption and to reduce animal-vehicle collisions.
Finally, 
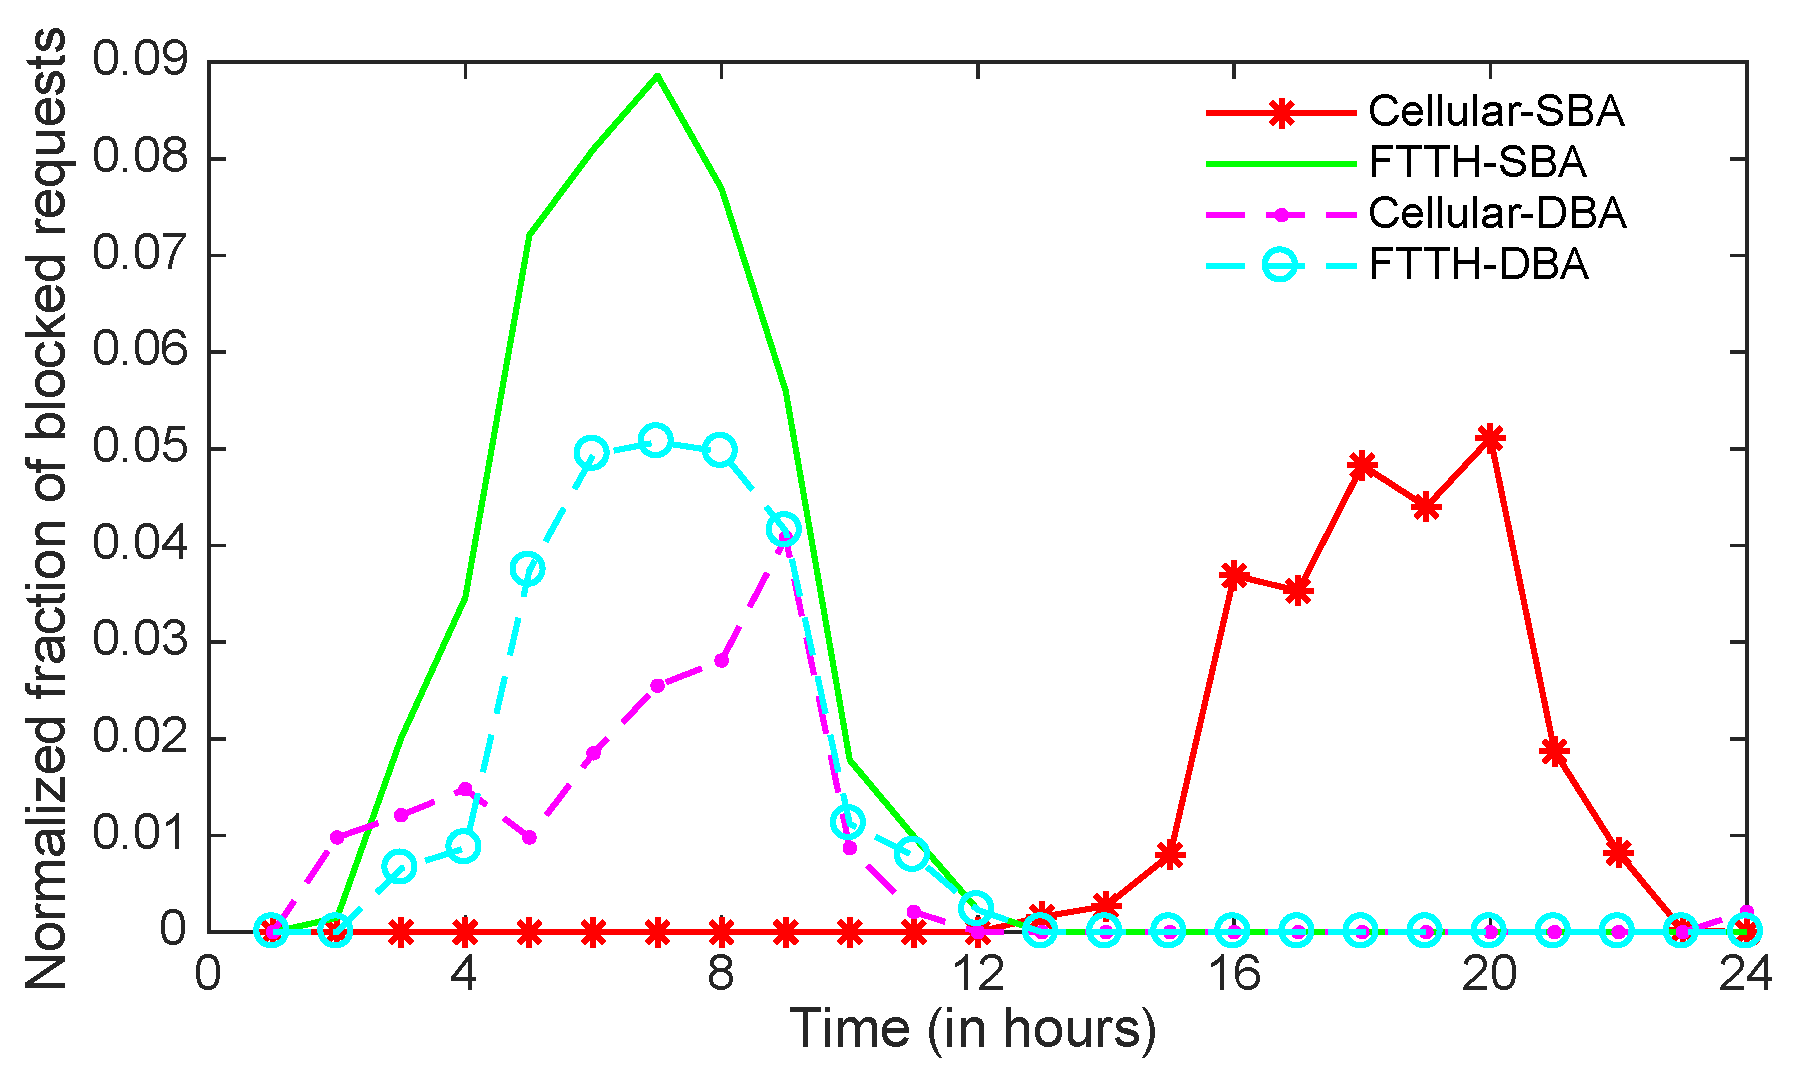
Figure 11 illustrates the normalized fraction of dropped requests due to congestion of cellular and FTTH traffic with and without machine learning-based traffic prediction and bandwidth allocation, i.e., dynamic bandwidth allocation (DBA) and static bandwidth allocation (SBA), respectively, in the OFDM-PON. Without machine learning (i.e., in SBA), the bandwidth allocated to each ONU is statically divided among the three classes of traffic based on the proportion of their long-term average traffic per day. With machine learning (i.e., in DBA), the system divides bandwidth based on the predicted traffic for every hour, thus it exploits the dynamic assignment of subcarriers. Furthermore, the animal traffic is very low as compare to the cellular and the FTTH, thus the animal (class-3) packets are stored in enough memory when they could not be sent to the central office immediately. Thus, there is no dropped packets for the class-3 traffic at ONUs/BSs. The normalized fraction of dropped requests of a class in an hour is calculated as the ratio of blocked requests in an hour and the maximum requests generated per hour during a day. Figure 11 shows that the fraction of dropped connections under the SBA policy at any time for a class (FTTH or cellular) is proportional to the traffic (or mean arrival rate) of that class. On the other hand, we also see that AI-enabled dynamic management of optical resources, i.e., DBA, decreases the fraction of dropped connections during the peak hours for both traffic classes by assigning proportional bandwidth required for the traffic classes, thus effectively utilizing the statistical multiplexing gain. More importantly, the DBA gain for one class (FTTH) could come at the cost of increasing the fraction of dropped connections for another class (cellular) during a time interval, and it depends on the accuracy of predicted traffic. This can be seen in the first 12 h of a day in Figure 11, where the fraction of dropped connections of FTTH (cellular) traffic is decreased (increased) in the DBA scheme as compare to the SBA scheme. The reason is that the DBA allocates (reserves) proportionately higher ONUs’ upstream bandwidth for the FTTH traffic in the first half of the day than the cellular traffic, since the predicted FTTH traffic is higher than the predicted cellular traffic in the first 12 h (see Figure 7).

7. Conclusions

In this paper, we proposed a novel fiber-wireless sensor network architecture for an early warning system to improve animal-human cohabitation. The proposed system detects wild animals near road/rail and transfers sensed or processed data to base stations in order to generate alert messages for passing vehicles or humans, if necessary. We compared three scenarios of processing data at sensor nodes, BSs and a hybrid case of processing sensed data at either sensors or at BSs depending on the congestion in the WSN, and showed that dynamic allocation of bandwidth in access networks and processing data at its origin could eventually lead to lowering the congestion of network traffic at base stations and, most importantly, reducing the average end-to-end delay. Furthermore, we showed that the energy consumption can be reduced by processing data at the sensor nodes.

Author Contributions

This work has been carried out in collaboration between all authors. S.K.S. conceived and designed the idea, the architecture and the experiments; S.K.S. and F.C. developed the experimental setup and simulation framework for the early warning system; A.J. supervised the overall development; and S.K.S. and F.C. with the supervision and coordination of A.J. wrote the paper.

Funding

This research received no external funding.

Acknowledgments

The authors would like to thank Mortadha Dhkar for his help in setting up the experiments.

Conflicts of Interest

The authors declare no conflict of interest.

References

  1. Suman, P.; Gupta, P.; Kassey, P.B.; Saxena, N.; Choudhary, Y.; Singh, V.; Radhakrishna, M. Identification of trespasser from the signatures of buried single mode fiber optic sensor cable. In Proceedings of the 2015 Annual IEEE India Conference (INDICON), New Delhi, India, 17–20 December 2015; pp. 1–6. [Google Scholar]
  2. Wildunfall-Statistik 2016/2017. Available online: http://www.jagdverband.de/content/wildunfallstatistik (accessed on 26 July 2018).
  3. Jukan, A.; Masip-Bruin, X.; Amla, N. Smart computing and sensing technologies for animal welfare: A systematic review. ACM Comput. Surv. 2017, 50, 1–27. [Google Scholar] [CrossRef]
  4. Ujvari, M.; Baagøe, H.J.; Madsen, A.B. Effectiveness of wildlife warning reflectors in reducing deer-vehicle collisions: A behavioral study. J. Wildl. Manag. 1998, 62, 1094–1099. [Google Scholar] [CrossRef]
  5. D’Angelo, G.J.; D’Angelo, J.G.; Gallagher, G.R.; Osborn, D.A.; Miller, K.V.; Warren, R.J. Evaluation of wildlife warning reflectors for altering white-tailed deer behavior along roadways. Wildl. Soc. Bull. 2006, 34, 1175–1183. [Google Scholar] [CrossRef]
  6. Tennakoon, E.; Madusanka, C.; De Zoysa, K.; Keppitiyagama, C.; Iyer, V.; Hewage, K.; Voigt, T. Sensor-based breakage detection for electric fences. In Proceedings of the 2015 IEEE Sensors Applications Symposium (SAS), Zadar, Croatia, 13–15 April 2015; pp. 1–4. [Google Scholar]
  7. Mathur, P.; Nielsen, R.H.; Prasad, N.R.; Prasad, R. Wildlife conservation and rail track monitoring using wireless sensor networks. In Proceedings of the 2014 4th International Conference on Wireless Communications, Vehicular Technology, Information Theory and Aerospace & Electronic Systems (VITAE), Aalborg, Denmark, 11–14 May 2014; pp. 1–4. [Google Scholar]
  8. Nakandala, M.; Namasivayam, S.; Chandima, D.; Udawatta, L. Detecting wild elephants via WSN for early warning system. In Proceedings of the 7th International Conference on Information and Automation for Sustainability, Colombo, Sri Lanka, 22–24 December 2014; pp. 1–6. [Google Scholar]
  9. Viani, F.; Rocca, P.; Lizzi, L.; Rocca, M.; Benedetti, G.; Massa, A. WSN-based early alert system for preventing wildlife-vehicle collisions in Alps regions. In Proceedings of the 2011 IEEE-APS Topical Conference on Antennas and Propagation in Wireless Communications, Torino, Italy, 12–16 September 2011; pp. 106–109. [Google Scholar]
  10. Zhang, J.; Luo, X.; Chen, C.; Liu, Z.; Cao, S. A wildlife monitoring system based on wireless image sensor networks. Sens. Transducers 2014, 180, 104. [Google Scholar]
  11. Viani, F.; Polo, A.; Giarola, E.; Robol, F.; Benedetti, G.; Zanetti, S. Performance assessment of a smart road management system for the wireless detection of wildlife road-crossing. In Proceedings of the 2016 IEEE International Smart Cities Conference (ISC2), Trento, Italy, 12–15 September 2016; pp. 1–6. [Google Scholar]
  12. Dominguez-Morales, J.P.; Rios-Navarro, A.; Dominguez-Morales, M.; Tapiador-Morales, R.; Gutierrez-Galan, D.; Cascado-Caballero, D.; Jiménez-Fernandez, A.; Linares-Barranco, A. Wireless sensor network for wildlife tracking and behavior classification of animals in Doñana. IEEE Commun. Lett. 2016, 20, 2534–2537. [Google Scholar] [CrossRef]
  13. Backs, J.; Nychka, J.; Clair, C.S. Warning systems triggered by trains could reduce collisions with wildlife. Ecol. Eng. 2017, 106, 563–569. [Google Scholar] [CrossRef]
  14. Masip-Bruin, X.; Marín-Tordera, E.; Tashakor, G.; Jukan, A.; Ren, G.J. Foggy clouds and cloudy fogs: A real need for coordinated management of fog-to-cloud computing systems. IEEE Wirel. Commun. 2016, 23, 120–128. [Google Scholar] [CrossRef]
  15. Mata, J.; de Miguel, I.; Durán, R.J.; Merayo, N.; Singh, S.K.; Jukan, A.; Chamania, M. Artificial intelligence (AI) methods in optical networks: A comprehensive survey. Opt. Switch. Netw. 2018, 28, 43–57. [Google Scholar] [CrossRef]
  16. Bashir, M.O.; Abu-Zidan, F.M. Motor vehicle collisions with large animals. Saudi Med. J. 2006, 27, 1116–1120. [Google Scholar] [PubMed]
  17. Clevenger, A.P.; Chruszcz, B.; Gunson, K.E. Highway mitigation fencing reduces wildlife-vehicle collisions. Wildl. Soc. Bull. 2001, 29, 646–653. [Google Scholar]
  18. Vollrath, F.; Douglas-Hamilton, I. African bees to control African elephants. Naturwissenschaften 2002, 89, 508–511. [Google Scholar] [CrossRef] [PubMed]
  19. Ranaweera, C.; Wong, E.; Lim, C.; Nirmalathas, A. Next generation optical-wireless converged network architectures. IEEE Netw. 2012, 26. [Google Scholar] [CrossRef]
  20. Habel, K.; Koepp, M.; Weide, S.; del Rosal, L.F.; Kottke, C.; Jungnickel, V. 100G OFDM-PON for converged 5G networks: From concept to realtime prototype. In Proceedings of the Optical Fiber Communication Conference, Los Angeles, CA, USA, 19–23 March 2017; p. 2693. [Google Scholar]
  21. Krizhevsky, A.; Sutskever, I.; Hinton, G.E. ImageNet classification with deep convolutional neural networks. In Advances in Neural Information Processing Systems 25; Pereira, F., Burges, C.J.C., Bottou, L., Weinberger, K.Q., Eds.; Curran Associates, Inc.: Red Hook, NY, USA, 2012; pp. 1097–1105. [Google Scholar]
  22. Singh, S.K.; Jukan, A. Machine-learning-based prediction for resource (Re) allocation in optical data center networks. J. Opt. Commun. Netw. 2018, 10, D12–D28. [Google Scholar] [CrossRef]
  23. Howard, A.G.; Zhu, M.; Chen, B.; Kalenichenko, D.; Wang, W.; Weyand, T.; Andreetto, M.; Adam, H. Mobilenets: Efficient convolutional neural networks for mobile vision applications. arXiv, 2017; arXiv:1704.04861. [Google Scholar]
  24. Hochreiter, S.; Schmidhuber, J. Long short-term memory. Neural Comput. 1997, 9, 1735–1780. [Google Scholar] [CrossRef] [PubMed]
  25. TensorFlow. Available online: https://www.tensorflow.org/mobile/tflite/ (accessed on 26 July 2018).
  26. Mahdavinejad, M.S.; Rezvan, M.; Barekatain, M.; Adibi, P.; Barnaghi, P.; Sheth, A.P. Machine learning for Internet of Things data analysis: A survey. Digit. Commun. Netw. 2017. [Google Scholar] [CrossRef]
  27. Riverbed. Riverbed Modeler Academic Edition Release 17.5 A PL7; Riverbed: San Francisco, CA, USA, 2014. [Google Scholar]
Figure 1. An architecture of FiWi network to carry cellular, FTTx, and animal traffic; and applications of AI techniques in different network subsystems are shown.
Jsan 07 00035 g001
Figure 2. A fraction of real data and predicted data using an LSTM neural network model.
Jsan 07 00035 g002
Figure 3. An experimental setup of a single-hop communication between two ZigBee (XBee) transceivers, one configured as an end device (WSN node) and another as a coordinator (sink). A Raspberry pi (R-Pi) as an end device is integrated with a camera, a PIR sensor, and a XBee transceiver.
Jsan 07 00035 g003
Figure 4. Average drawn current in: (a) capturing an 89 Killo bytes (KB) image; (b) transmission of 89 KB image; (c) classification of the same captured image (89 KB); (d) transmission of processed data of size 12 bytes.
Jsan 07 00035 g004
Figure 5. A program flow chart for animal detection, and data processing and transmission.
Jsan 07 00035 g005
Figure 6. WSN topology per BS simulated by Riverbed Modeler Simulator.
Jsan 07 00035 g006
Figure 7. Real traffic vs. predicted traffic of three classes of services, namely cellular, FTTH and animal are shown in (ac), respectively.
Jsan 07 00035 g007
Figure 8. Average end-to-end packet delay (latency) from sensors to BSs.
Jsan 07 00035 g008
Figure 9. Average notification time in seconds to alert human/vehicles using simulation results.
Jsan 07 00035 g009
Figure 10. Average notification time in seconds to alert human/vehicles using experimental results partially.
Jsan 07 00035 g010
Figure 11. Fraction of blocked requests of cellular and FTTH traffic.
Jsan 07 00035 g011
Table 1. Different parameters for the simulation.
ParametersValue (for Different Line Rates)
CellularFTTHAnimal
Bit rate (in Gb/s)1100.00025
Arrival rate
(Requests per second)
e x p ( λ 1 ) e x p ( λ 2 ) e x p ( λ 3 )
Holding-time
(in minutes)
e x p ( μ 1 = 10 ) e x p ( μ 2 = 10 ) 0.00067

