Human Movement Monitoring and Analysis for Prehabilitation Process Management

1
School of Engineering, Computer and Mathematical Sciences, Auckland University of Technology (AUT), Auckland 1010, New Zealand
2
School of Clinical Sciences, Auckland University of Technology (AUT), Auckland 0627, New Zealand
*
Author to whom correspondence should be addressed.
J. Sens. Actuator Netw. 2020, 9(1), 9; https://doi.org/10.3390/jsan9010009
Submission received: 18 September 2019
/
Revised: 13 January 2020
/
Accepted: 18 January 2020
/
Published: 21 January 2020
Abstract
:Cancer patients assigned for abdominal surgery are often given exercise programmes (prehabilitation) prior to surgery, which aim to improve fitness in order to reduce pre-operative risk. However, only a small proportion of patients are able to partake in supervised hospital-based prehabilitation because of inaccessibility and a lack of resources, which often makes it difficult for health professionals to accurately monitor and provide feedback on exercise and activity levels. The development of a simple tool to detect the type and intensity of physical activity undertaken outside the hospital setting would be beneficial to both patients and clinicians. This paper aims to describe the key exercises of a prehabilitation programme and to determine whether the types and intensity of various prehabilitation exercises could be accurately identified using Fourier analysis of 3D accelerometer sensor data. A wearable sensor with an inbuilt 3D accelerometer was placed on both the ankle and wrist of five volunteer participants during nine prehabilitation exercises which were performed at low to high intensity. Here, the 3D accelerometer data are analysed using fast Fourier analysis, where the dominant frequency and amplitude components are extracted for each activity performed at low, moderate, and high intensity. The findings indicate that the 3D accelerometer located at the ankle is suitable for detecting activities such as cycling and rowing at low, moderate, and high exercise intensities. However, there is some overlap in the frequency and acceleration amplitude components for overland and treadmill walking at a moderate intensity.
1. Introduction
Abdominal cancer is a major global health concern, being one of the most commonly diagnosed cancers and among the top three leading causes of cancer-related death [1]. The level of aerobic fitness prior to surgery has been identified as an important factor for determining the ability to cope with these increased demands and postoperative outcomes. After major abdominal surgery, there is a significantly increased number of metabolic demands on the body [1]. The level of aerobic fitness prior to surgery has been identified as an important factor for determining the ability to cope with these increased demands and postoperative outcomes [2]. To address fitness issues, several hospitals have developed exercise (prehabilitation) programmes to improve the aerobic capacity of this patient group prior to surgery [2]. The most common exercises in prehabilitation programmes are aerobic training activities, such as cycling, walking (treadmill and/ or outdoor), rowing, using a cross-trainer, and stepping.
The intensity of exercises prescribed in these programmes often varies from light to moderate to vigorous, and, more recently, they have included interval training, where a low intensity exercise is followed by a bout of high intensity exercise. Resistance training is also commonly used as an adjunct to aerobic training and involves exercises primarily targeting the lower (e.g., leg press) and upper limbs (e.g., chest press) at moderate repetitions (10–20 repetitions).
The monitoring of exercise and activity in abdominal cancer patients is important, as adherence to prescribed prehabilitation programmes has been associated with improved aerobic fitness and the reduction of postoperative complications [3,4]. However, activity detection in this population has been limited to step counting. This type of detection has limited value to abdominal cancer patients, as specific prehabilitation exercises cannot be detected. Furthermore, it has been difficult to detect the type and intensity of exercises these patients engage in outside of supervised settings in hospitals. This has important implications for the development of home-based exercise in the population, particularly for individuals who are geographically isolated and cannot attend supervised hospital programmes.
In the last decade, many researchers have developed devices and systems to monitor human motion and activity recognition. Although a number of these systems (e.g., 3D motion analysis) provide accurate information, they are often expensive and limited to laboratory settings [5]. Others [6,7] have used machine learning techniques, which often require the attachment of multiple inertial measurement unit (IMU) sensors to detect the motion. Whilst this may allow measurement outside of the laboratory environment, the feasibility of attaching multiple sensors in a clinical setting may be limited.
In this work a frequency-based approach has been used to analyse the frequency content and amplitude (power) related to each activity [8,9,10,11]. Different intensities of exercise have been shown to produce variations in both the frequency and amplitude measures for each activity. For example, light intensity cycling produces a common frequency of 0.75 Hz, with an amplitude of 20–30 m/s2, moderate cycling corresponds to 1 Hz at 40–55 m/s2, and vigorous to 1.25 Hz and 55–90 m/s2. However, several prehabilitation exercises for cancer patients (e.g., rowing, step up machine, cross-trainer machine, leg press, and interval training) have received less attention [12]. Whether findings from healthy young populations can be transferred to patients with abdominal cancer is questionable. In general, the majority of cancer patients are elderly, poorly conditioned, and perform activities at much lower accelerations than younger healthy individuals [13].
Therefore, the construct validity of these algorithms for older patients under prehabilitation exercise programmes is unclear. Furthermore, no studies to date have used activity and intensity recognition techniques to identify high intensity interval training in this patient group.
2. Related Work
In this section, different models of prehabilitation programmes are reviewed. This is based on the various methods which are already used in different hospitals globally.
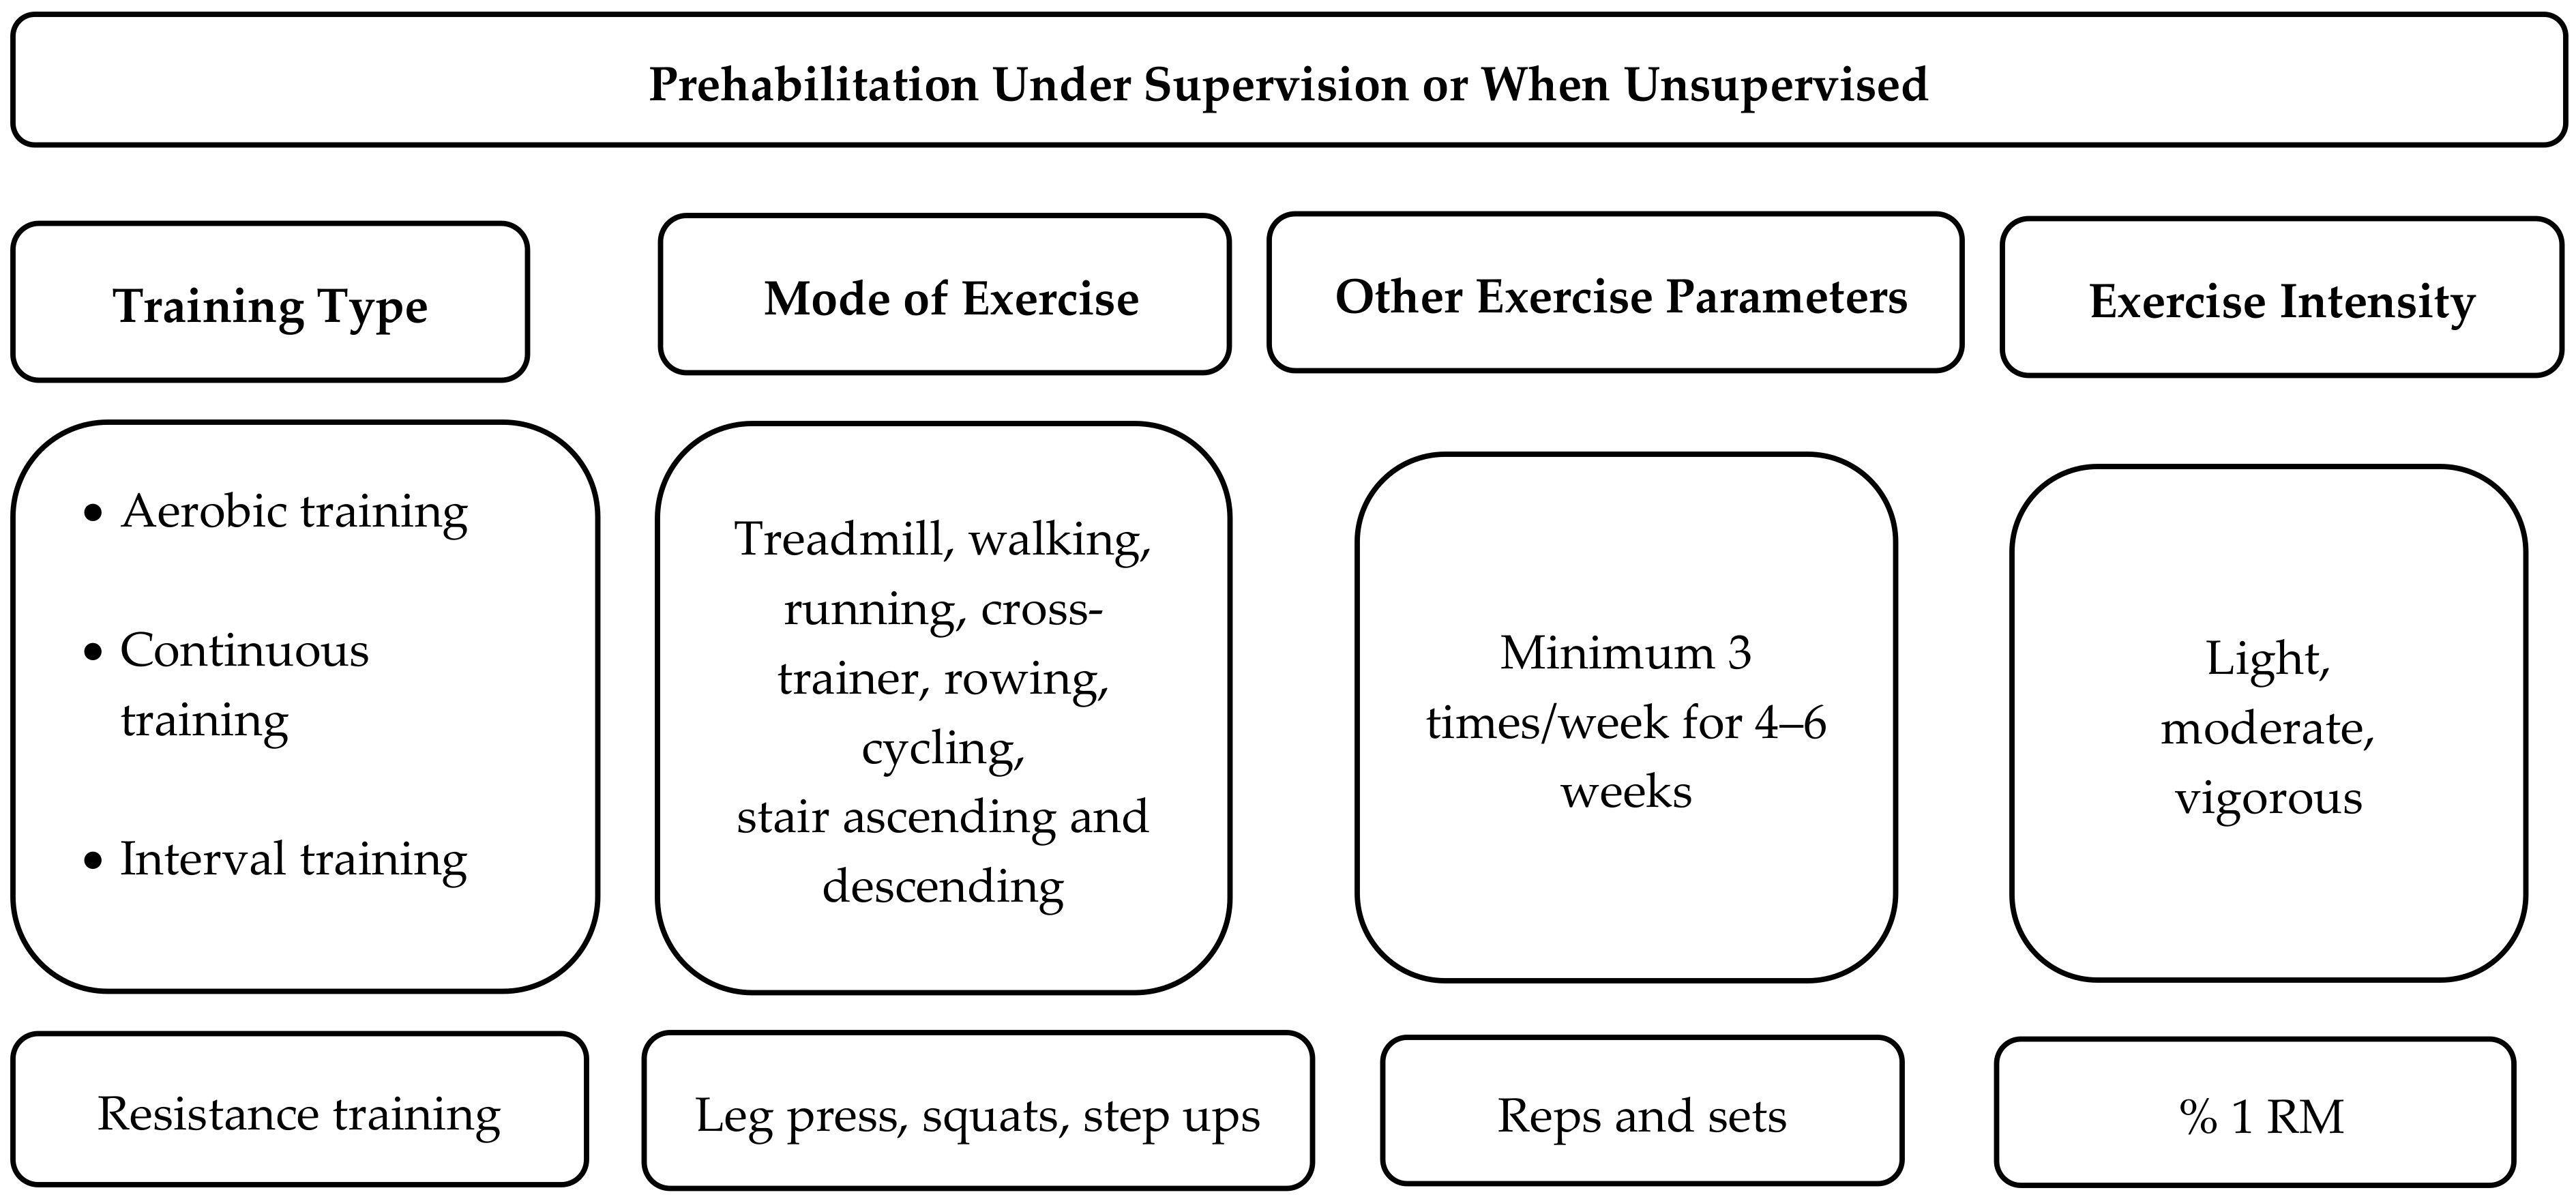
Figure 1 illustrates common exercise parameters in the prehabilitation programmes designed for abdominal cancer patients in supervised and unsupervised settings. Prehabilitation programme parameters are typically defined by the training type (aerobic and/or resistance training), the mode of exercise (e.g., cycling, walking, rowing), exercise frequency and duration parameters, and exercise intensity (Figure 1). The primary type of activity used in prehabilitation for patients undergoing major abdominal surgery is that which is directed to stressing the aerobic system. The most common aerobic exercises are cycling and walking, though a number of supervised programmes have used running, cycling, rowing, climbing stairs, and cross-training activities [2]. These aerobic exercises are often performed for at least 30 minutes in either a supervised or home setting from 2–7 times per week [14,15,16,17].
Typically, initial aerobic exercise will be performed at low or moderate intensity and progress to vigorous intensity [14,17,18]. Exercise intensity is determined using heart rate and ratings of perceived exertion. However, speed and cadence measures can also reflect exercise intensity and can be measured via an accelerometer. For instance, in older populations over the age of 60 years, walking speeds of around 3.3 km/h, 4.2 km/h, and 6 km/h have been defined as light, moderate, and vigorous intensity, respectively [19]. In addition, intensity during cycling can be increased by increasing cadence from 60 to 80 to 100 RPM, respectively [20]. Rowing intensity is often calculated by measuring the average power output (40 W—light, 80 W—moderate), but stroke rate also tends to increase as exercise intensity increases. More recently, high intensity interval training has been used to improve fitness in this patient group. This involves a 15-second to two-minute period of rapid movement (high cadence/speed) followed by a period of very slow movement or rest.
A number of prehabilitation programmes also have a resistance training component, targeting the upper and lower limbs for between 8–15 repetitions.
Prehabilitation studies have used exercise interventions in supervised and unsupervised environments. However, those studies that have developed home-based unsupervised prehabilitation programmes have tended to have much lower compliance rates than supervised hospital programmes [21]. Therefore, the development of a simple device to monitor and provide feedback on specific activities or exercise may potentially improve exercise engagement and outcomes for cancer patients who cannot regularly attend hospital-based prehabilitation programmes.
3. Activity Recognition Techniques
Most of the exercises used for abdominal cancer prehabilitation are rhythmical and have time and frequency components that can be detected via the analysis of accelerometer data. The most widely used data extraction methods used in accelerometry are time domain and frequency domain feature data analysis.
Time domain feature analysis extracts the fundamental waveform characteristics of a given signal. Waveform feature analysis does not require lag statistics and waveforms are easily extracted from raw data [22]. Frequency domain feature analysis focuses on the periodicity and structure of the signal using algorithms such as Fourier transform coefficients [22]. On other hand, the magnitude components of the fast Fourier transformation (FFT) of the signal are assumed to discriminate activities with similar energy values and are also proposed to extract primary information from the data, reducing the size of the data.
Conventionally, activities of daily living, including physical exercise, fall below 20 Hz [23]. Accordingly, frequency domain features have been used in previous research to analyse the raw acceleration data extracted from sensors attached to people performing gait and stair activities (Table 1). Pachi et al. [9] performed 800 different accelerometer tests in males and females across different age groups who walked at speeds between 4.5–5.2 km/h and found that the frequency range was between 1.4–2.1 Hz. Sharma et al. [10] investigated the frequency range of three activities (rest, walking, and running) in two subjects wearing a 3D wearable accelerometer sensor attached to the chest. The normalized FFT was then checked for the range of frequencies at the peak of the magnitude of the dominant frequency. The frequency range for rest was 0.5 Hz and between 1.5–2.5 Hz for normal walking, while the running range was 2.5–4 Hz.
In another study, Mathie et al. [24] performed 283 tests using a waist-mounted 3D accelerometer. It was concluded that different types of walking ranged from 0.7–3 Hz. Gaile et al. [11] studied the frequency components of ascending and descending a staircase by using a 3D accelerometer sensor. They found the frequency range of ascending and descending stairs was 0.9–2.4 Hz. When a subject was asked to run down a staircase, the frequency ranges (1.65–3.3 Hz) were higher than walking down stairs [25].
4. Prehabilitation Process Structure and Monitoring Requirement
Key hospitals that specialize in the treatment of cancer often use prehabilitation programmes for their patients. However, the number of the patients involved in this type of programme is low in comparison to the total numbers of abdominal patients who are assigned for surgery. A number of these programmes have been developed and supervised within hospital settings. These programmes often require each patient to attend a hospital-based session between 2–4 times per week. Many hospitals have limited resources (staff, equipment, and funding) for such programmes. Furthermore, many patients live in communities where they are unable to access a hospital or physiotherapy centre frequently. More recently, community-based prehabilitation programmes have been developed for this patient group [14,26]. Prescribed exercises are often given for a period of 2–6 weeks at home, typically performed outdoors or in a gymnasium. Community-based programmes are often unsupervised and typically involve walking, cycling, aerobic, and resistance exercise as the main exercises. Patients initially begin with low intensity exercise for 30 min per day and progress to 50 min of exercise at a moderate to vigorous intensity three times per week.
The development of an activity recognition system to detect a variety of types and intensities of exercise, both within and outside the hospital environment, is important for this patient group. This allows clinicians to effectively monitor patient activity in unsupervised environments. Accurate monitoring could also give flexibility to the patient to perform a variety of home-based activities, which could elicit similar exercise intensities. For example, the patient may subsidize some physical activities with others (e.g., replacing treadmill walking with walking, rowing, or cycling) throughout the programme and still achieve a similar volume or intensity of training [27]. The remote monitoring of activity also has the potential to reduce the impact on healthcare facilities and healthcare members as well. In addition, the system should be able to monitor and detect continuous or intermittent activities, with or without supervision. It should also accommodate activities performed in both indoor and outdoor environments. Accordingly, this work will try to construct a mixed mode activity recognition system that can detect, and record activities performed in supervised and or unsupervised prehabilitation programmes and give flexibility to the patient to do the prescribed exercises at home, or in a gymnasium, community centre, or hospital.
5. Method Used for Data Collection
This section addresses the approach of the data collection and the associated experimental environment. Initially, tests were carried out on one middle-aged volunteer participant performing all activities. Then, three participants volunteered to have the sensor attached to either their ankle or wrist while they were partaking in a supervised prehabilitation exercise session. These participants had an average age of 65 years and performed exercises including cycling, using a treadmill or cross-trainer, rowing, and leg presses. A participant aged 82 years performed cycling at only 50 rpm and rowed at a “light” intensity [17]. Recording time was on average 30–40 min. This research has been approved by the Auckland University of Technology Ethics Committee (AUTEC reference number 19/212).
5.1. Sensing Device
Figure 2 represents different components used as part of the prehabilitation monitoring process for data collection, storage, and processing. The wearable sensor hardware consisted of a sensor (Microduino-Motion (Microduino-10DOF, Arduino, Roma, Italy)) that integrates four sensors, including one 3-axis gyroscope sensor and a 3-axis accelerometer (MPU6050, TDK, Uniondale, NY, USA), one magnetic field strength sensor (HMC5883L, Honeywell, Charlotte, NC, USA), and a digital barometer sensor (BMP180, BOSCH, Gerlingen, Germany). The Microduino-10DOF has four different ranges of acceleration (±2 g, ±4 g, ±8 g, ±16 g), with different sensitivity ranges. For example, a sensitivity of ±2 g is considered more sensitive than ±4 g but has the problem of data cut-off during movements involving high accelerations. Accordingly, ±2 g was selected, where g is the acceleration due to gravity in m/s2. This level of sensitivity was chosen because the types of activities performed in prehabilitation programmes for major abdominal surgery do not involve high accelerations [28]. The Microduino core RF processor was used for computational purposes. The SD card was attached to the sensor node for real-time data collection. The test data were stored in the SD card then transferred to a computer, where the data was processed using a fast Fourier transform (FFT) by the MATLAB software package (MathWorks, Natick, MA, USA).
5.2. Sensor Placement and Data Collection Schedule
In preliminary testing, 3D accelerometers were attached to the right and left wrist and ankle of two participants during walking and stationary cycling activities. These four locations were chosen as they have been used in healthy populations to detect walking and cycling activities with good accuracy [29]. This initial testing was designed to determine the effectiveness of accelerometers in each location (wrist and ankle) to differentiate walking and cycling activities at light, moderate, and vigorous intensities. Initial data analysis indicated that during the different exercises, the sensor located at the ankle produced more consistent and accurate data than the sensor located at the wrist. Therefore, for subsequent testing, data were collected from a single 3D accelerometer attached to the left ankle.
The data were collected from five volunteer participants during cycling. The data were also collected from three participants during walking, treadmill running, cross-trainer use, staircase ascension/descension, cycling, rowing, step ups, and leg presses. Real-time 3D accelerometer data were collected at a sampling frequency of 128 Hz for each activity. This sampling frequency was considerably higher than the highest spectral frequency of 20 Hz documented during daily living activities [28] and accounted for any fast state changes during the prehabilitation exercises [30,31].
The time duration for data collection varied from 5 min to 45 min. This time is considered enough to store activity samples and provide a suitable time frame to attain enough data for a range of exercises. Furthermore, the time intervals covered the dynamic changes between activities, like slow walking to fast walking and cycling to rowing.
5.3. Data Analysis
The raw data were transferred from the sensor SD card to a computer and then the MATLAB software package for data analysis. The raw data (Figure 3a) was demeaned and the DC offset was removed. Then, the mean of the three axes of the accelerometry data was calculated (Figure 3b).
Every fourth data point was then selected from the 128 Hz processed signal, resulting in a final sampling frequency of 32 Hz [8]. From these data, four seconds was considered as the minimum time for detecting the activity without signal distortion or loss of information. Figure 4 shows how the amplitude features of the signal are influenced by the window of sampling time. There is no clear difference in amplitude measured for data analysed over a period of 4 s (Figure 4c) and 10 s (Figure 4b). However, when the sample period is limited to 3 s (Figure 4d), there is a decrease in amplitude when compared to both 4 and 10 s (Figure 4). Based on these findings, the collected test data were analysed using successive 4-second windows of time.
6. Results and Discussion
The data were collected from nine physical activities at low, moderate, and vigorous intensity. A more detailed analysis of walking and cycling is shown in Figure 5, Figure 6, Figure 7, Figure 8 and Figure 9, as these are the most common activities used in prehabilitation programmes. The remaining activities are described in Table 2, with the extracted features for each of them. The following section compares the efficacy and accuracy of the sensor located on the wrist and ankle to distinguish different walking and cycling intensities.
6.1. Walking at Different Intensities
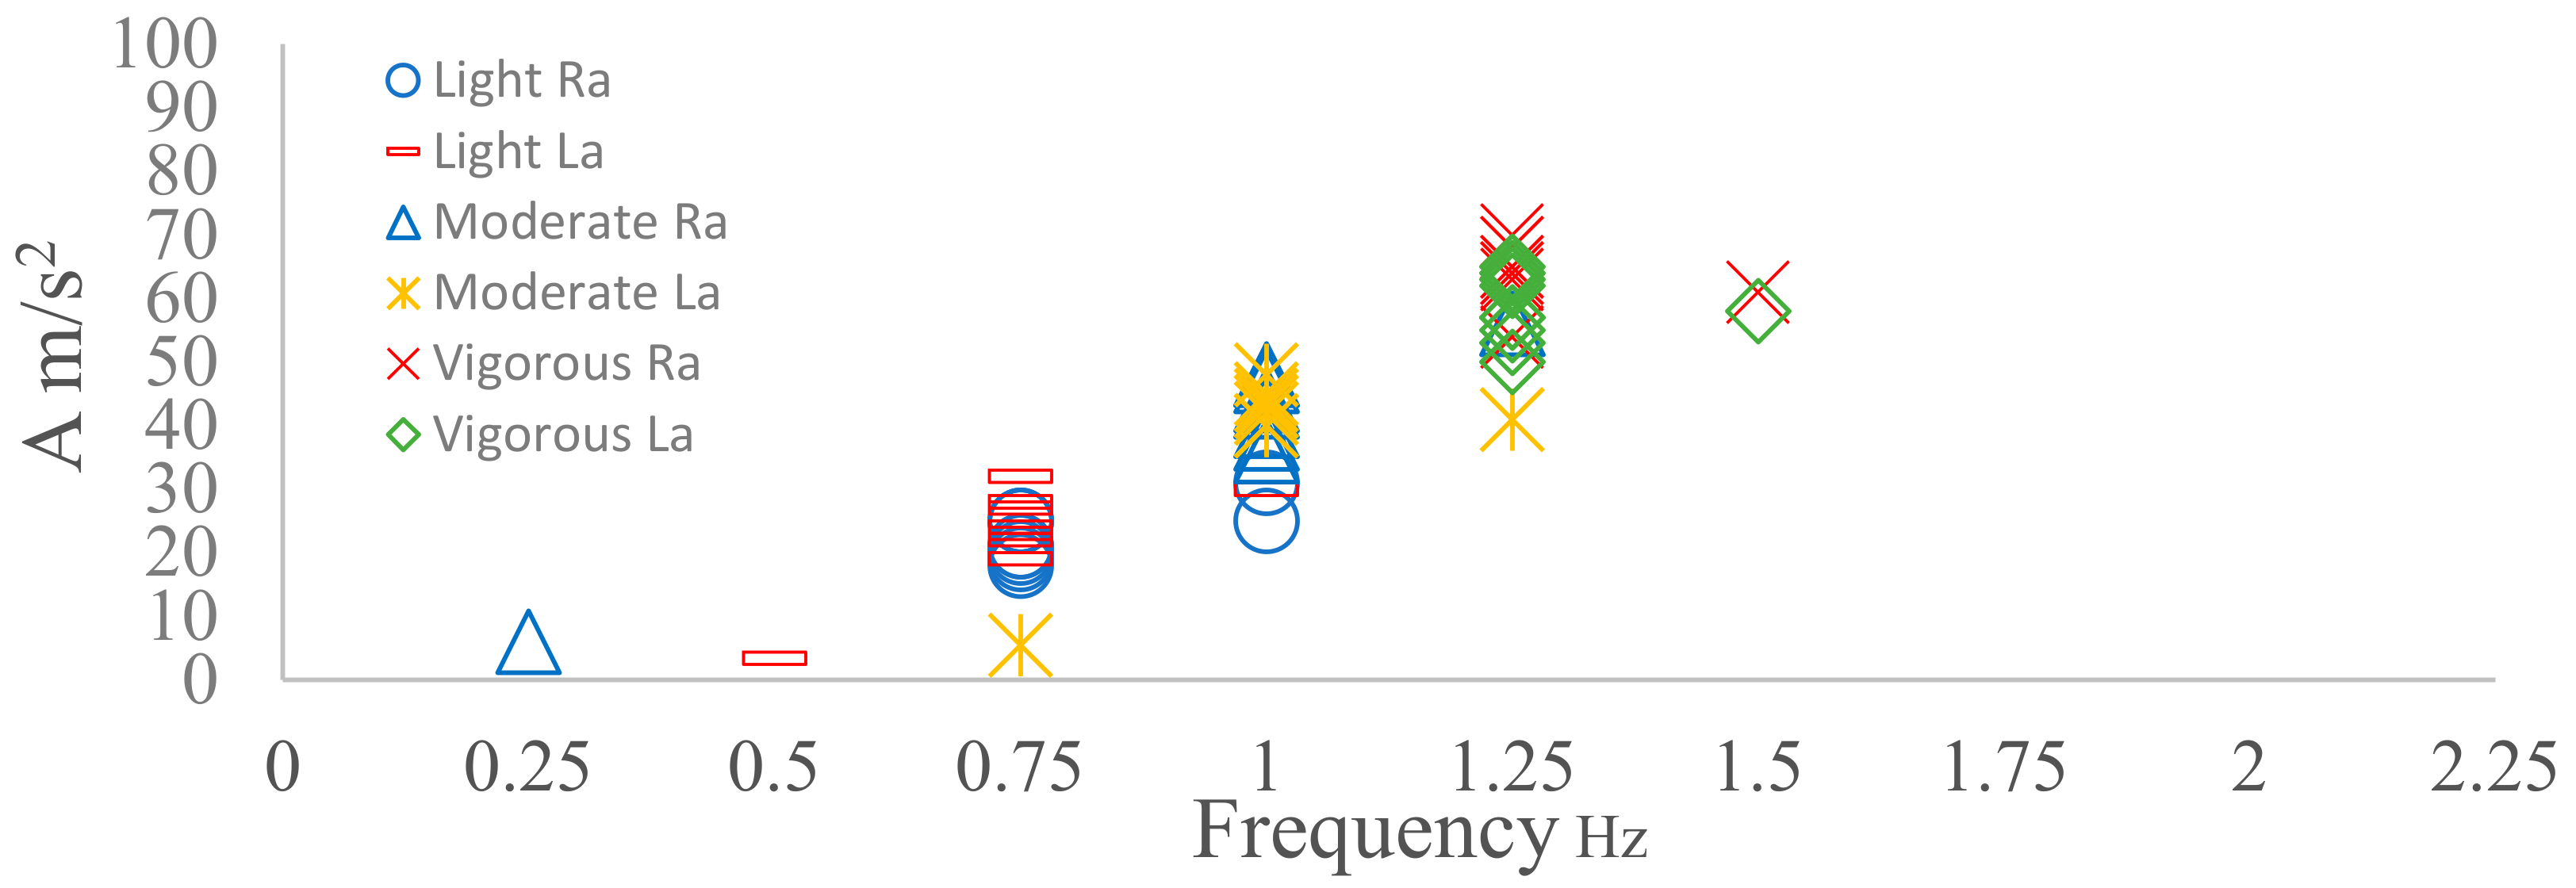
Four sensors were placed on four different locations, namely: left wrist (Lw), right wrist (Rw), left ankle (La) and right ankle (Ra). From the analysis, it was observed that both the right and left ankle produced a similar frequency with each walking intensity (Figure 5). Walking at 4 km/h produced 1.5 Hz, whereas walking at a moderate speed (5 km/h) resulted in a dominant frequency of 2 Hz and walking at a vigorous speed (6.5 km/h) produced a dominant frequency of 2.25 Hz. The frequencies found for light and moderate walking are similar to other studies [9,10,24] using speeds between 4.2–5.5 km/h. However, the dominant frequency for vigorous walking was 2.25 Hz here, which differs from the 3 Hz reported in another study [24]. The amplitude ranges of the dominant frequency were also different when walking at different intensities. The amplitude range of the peak frequency for light walking was 11–30 m/s2, the moderate walking range was 30–50 m/s2, and the amplitude range for vigorous walking was 50–75 m/s2 (Figure 5). This may indicate that the combination of the dominant frequency and amplitude may help to identify the different types of walking intensities rather than dominant frequency alone.
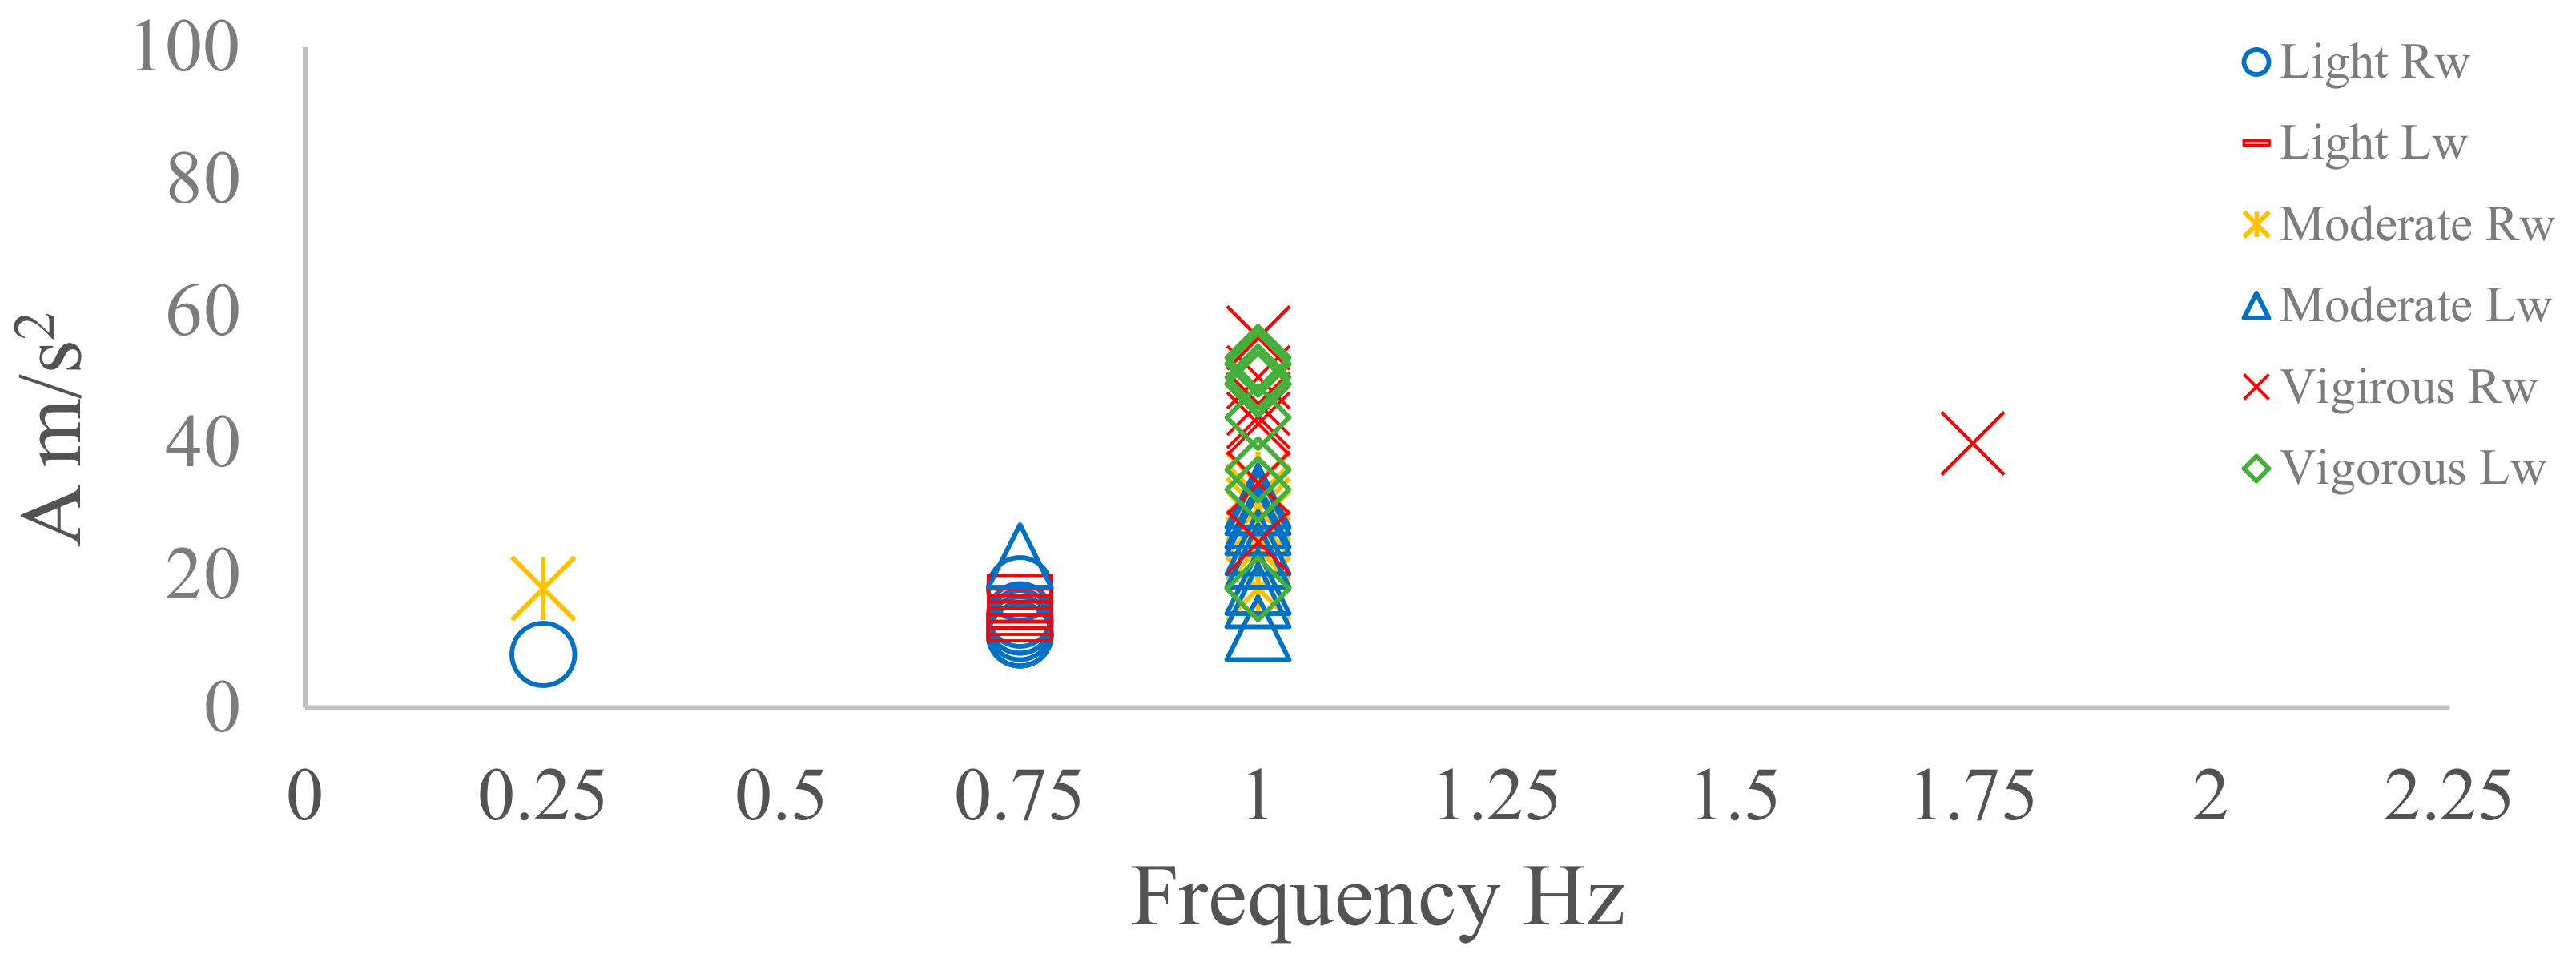
The frequency data collected from the right wrist were similar to that collected from the left wrist (Figure 6). Light walking produced a lower dominant frequency of 0.75 Hz and an amplitude range of 10–20 m/s2 (Figure 5). Moderate and vigorous walking produced a similar frequency of 1 Hz. However, the amplitude measurements during vigorous walking (range: 30–60 m/s2) were nearly twice that produced during moderate walking (range: 20–40 m/s2). There is limited data in the literature concerning the analysis of frequency and amplitude from sensors located at the wrist for walking.
The accuracy and consistency were also examined on each activity using the following equation:
Accuracy = (number of consisting test/total number of test) × 100
For light and moderate walking, the repeatability on both the ankle and wrist was approximately 90%. The vigorous walking repeatability of 80% for both the ankle and wrist is slightly less than that recorded at lower intensities.
In summary, different walking speeds could be accurately detected using dominant frequency and amplitude data from the ankle accelerometer with good accuracy. As the wrist was unable to clearly differentiate between moderate and vigorous walking, it was concluded that the ankle location is the most suitable location for the categorization of walking intensity. It should also be taken into consideration that the outliers observed during the beginning of each activity represent the transition from being stationary to moving.
6.2. Cycling at different intensities
Cycling was tested with a middle-aged participant, where the 3D sensor was placed on both the ankle and the wrist. Intensity was based on revolutions per minute (rpm). Accordingly, 50 rpm, 70 rpm, and 90 rpm were chosen to represent light, moderate, and vigorous cycling intensities, respectively. There is currently no information in the literature on the frequency and amplitudes for each cycling cadence [20]. From Figure 7, it can be observed that both the La and Ra 3D accelerometer sensors produced a similar dominant frequency within each intensity. The dominant frequencies during all intensities of cycling were located between 0.75–1.25 Hz, which is considerably lower than the frequencies observed during walking (Figure 5 and Figure 7). Figure 7 shows that the dominant frequency measures for each intensity were clearly different, increasing from 0.75 Hz at light intensity to 1 Hz at moderate intensity and 1.25 Hz at vigorous intensity. The amplitude range for the dominant frequency also increased when the intensity increased (Figure 5).
For the left and right wrist, the dominant frequency varied between 0.75–1 Hz at light intensity. At moderate and vigorous intensity, the frequency data were highly variable, and therefore it was difficult to determine a dominant frequency. The amplitudes of different intensities were lower than 5 m/s2 (Figure 8). The ankle dominant frequency data had high accuracy (90% accuracy) and repeatability, whereas the wrist frequency data were inconsistent. Therefore, for classifying cycling, the left and right ankle were considered as the best locations for recognizing cycling activity.
6.3. Cycling Activities for Five Participants at Different Intensities
Figure 9 shows the frequency and amplitude domain of five participants of different ages (P1—20 s, P2—48 s, P3—60s P4—70 s and P5—80 s) who performed the cycling activity at different intensities.
The sensor was located on La for all participants. It can be observed clearly from Figure 9 that the dominant frequency for all participants was the same for different intensities (light = 0.75 Hz, moderate = 1 Hz, vigorous = 1.25 Hz) except for P5, who could not reach 90 rpm due to limited co-ordination. Amplitude measures of the dominant frequency were lower at light intensity when compared to moderate and high intensities. However, there was considerable overlap in the amplitude measures for moderate and vigorous cycling. The dominant frequency consistency clearly appears through different intensities, with an overall accuracy of 80%. In summary, if the sensor is placed at the ankle, it can recognize the different intensities of cycling activities.
6.4. Analysis of Common Prehabilitation Activities
Table 2, shown below, presents the results of analysing the data for the most common physical activities that are likely to be prescribed for participants who are enrolled in a prehabilitation programme. The discussion here focuses on the readings extracted from the sensor placed on the ankle, as this location offers a better representation of the movements involved than when the sensor is placed on the wrist. Some activities can be easily distinguished from others by either the dominant frequency content or the amplitude related to the intensity of that dominant frequency. Examples here are light and moderate running and light and moderate leg presses. Other types of movements, such as light cross-trainer exercise, light rowing exercise, light walking or cycling exercises, and light treadmill exercise, can be recognized using both frequency and amplitude. In contrast, other activities, such as moderate walking and moderate treadmill exercises, show an overlap in both the dominant frequency and related amplitude. Furthermore, no clear consistency has been shown in staircase ascension and descension for both the dominant frequency and amplitude. In this context, additional factors, such as displacement tracking or GPS, could be applied for distinguishing those physical activities.
7. Discussion
This study highlights the key components involved in the monitoring and management of pre-operative prehabilitation programmes. These components include the type of physical activity, the duration allocated, and the related exercise intensity. This, in effect, is driving towards approaching digital health programmes through formally managing the service using online monitoring and interaction with patients. The novelty of the study comes from looking at key components involved in monitoring the process of prehabilitation and utilizing the frequency domain for activity analysis and identification.
Furthermore, it highlights the importance of 3D accelerometer sensors and their potential role in the monitoring of this type of healthcare. While the sensor board used for our research (Microduino-10DOF) contains all necessary motion sensors, we have explicitly exposed the potential of one of the main sensors to identify how far we can go with a given sensor in offering the required monitoring. This is an important design step in relation to the amount of data we are gathering, and the intensity of communication needed (hence energy and communication channel occupancy).
Based on the selected physical exercises, the lower limbs are more effective in monitoring most of the prehabilitation activities than upper limbs. Accordingly, the ankle has been selected as the most suitable place for placing the sensor. Table 2 shows the dominant frequency and amplitude of nine common prehabilitation physical activities. There are similarities between our results and previous research which has measured the dominant frequency ranges for walking at different intensities (1.5–2.25 Hz) [8,9,10]. The dominant frequency and amplitudes of other prehabilitation physical activities, such as cycling, staircase ascension and descension, and rowing, has received less attention by other researchers. The rest of the nine activities in Table 2 are not discussed by other researchers in terms of frequency domain analysis. However, our initial analysis would indicate that a number of these exercises can be distinguished through frequency and amplitude measurements. For example, activities like cycling, slow walking, and rowing can be distinguished from each other based on the FFT outcome. Other activities, like moderate walking and treadmill use, present some degree of overlap. It would also appear that both staircase ascension and descension do not have a frequency consistency, due to the mixed activity between using stairs and walking. Accordingly, further analysis is required for the development of a more involved activity recognition approach that covers a wider spectrum of activities. Aspects like personalization and machine learning may help in offering better capability for accurate recognition.
8. Conclusions
This paper has focused on prehabilitation programmes for patients with abdominal cancer that are scheduled for surgical operation. It has analysed the key activities involved in a prehabilitation programme. The analysis of the data collected is based on frequency domain analysis and has utilized the dominant frequency associated with each activity, together with the intensity of that frequency. Nine types of physical activities have been studied here. When examining the best data collection duration for the FFT algorithm, when using the 32 sample/s, 4s was found to be the minimum time that could be used without influencing the outcome. Different intensity modes were also considered for each of the activities. The results show that some activities such as walking, and rowing are easily distinguished using the dominant frequency or associated amplitude. Recognition of other activities is difficult due to the overlap of the frequency and amplitude components of the FFT windows. This, in effect, may suggest the need for additional sensors (backup sensors) or possibly more involved machine learning analysis in order to elucidate more accurate activity recognition. Although we have highlighted the need for supportive sensing, this may not necessarily suggest the use of a backup sensor(s) all the time. This may also mean the backup sensor may not necessarily be a motion sensor. For example, the additional monitoring of heart rate may help in differentiating the intensity of the activity. Localization may also help in supporting the differentiation of the type of activity through smart ideas. Our next move is to cover this optimization problem for the prehabilitation process that we are concerned with.
Author Contributions
Conceptualization, A.A.-A. and G.M.; methodology, K.A.-N., Adnan and Grant; software, K.A.-N.; validation, K.A.-N., A.A.-A. and Grant; formal analysis, K.A.-N.; investigation, K.A.-N.; resources, K.A.-N.; data curation, K.A.-N.; writing—original draft preparation, K.A.-N.; writing—review and editing, A.A.-A. and G.M.; visualization,; supervision, A.A.-A. and G.M.; project administration, A.A.-A.; All authors have read and agreed to the published version of the manuscript
Funding
This research received no external funding.
Conflicts of Interest
The authors declare no conflict of interest.
References
- Bray, F.; Ferlay, J.; Soerjomataram, I.; Siegel, R.L.; Torre, L.A.; Jemal, A. Global cancer statistics 2018: GLOBOCAN estimates of incidence and mortality worldwide for 36 cancers in 185 countries. CA A Cancer J. Clin. 2018, 68, 394–424. [Google Scholar] [CrossRef] [PubMed] [Green Version]
- Heldens, A.; Bongers, B.; de Vos-Geelen, J.; van Meeteren, N.; Lenssen, A. Feasibility and preliminary effectiveness of a physical exercise training program during neoadjuvant chemoradiotherapy in individual patients with rectal cancer prior to major elective surgery. Eur. J. Surg. Oncol. 2016, 42, 1322–1330. [Google Scholar] [CrossRef] [PubMed]
- Lawrence, V.A.; Hazuda, H.P.; Cornell, J.E.; Pederson, T.; Bradshaw, P.T.; Mulrow, C.D.; Page, C.P. Functional independence after major abdominal surgery in the elderly. J. Am. Coll. Surg. 2004, 199, 762–772. [Google Scholar] [CrossRef] [PubMed]
- Zhu, H.; Moffa, Z.; Wang, X.; Abdullah, S.; Julaiti, J.; Carroll, J. Understanding Challenges in Prehabilitation for Patients with Multiple Chronic Conditions. In Proceedings of the 12th EAI International Conference on Pervasive Computing Technologies for Healthcare, New York, NY, USA, 21–24 May 2018; pp. 138–147. [Google Scholar]
- Aissaoui, A.; Ouafi, A.; Pudlo, P.; Gillet, C.; Baarir, Z.-E.; Taleb-Ahmed, A. Designing a camera placement assistance system for human motion capture based on a guided genetic algorithm. Virtual Real. 2018, 22, 13–23. [Google Scholar] [CrossRef]
- Rodrigues, T.B.; Salgado, D.P.; Cordeiro, M.C.; Osterwald, K.M.; Teodiano Filho, F.B.; de Lucena, V.F., Jr.; Naves, E.L.M.; Murray, N. Fall Detection System by Machine Learning Framework for Public Health. Procedia Comput. Sci. 2018, 141, 358–365. [Google Scholar] [CrossRef]
- Rodrigues, T.B.; Catháin, C.Ó.; Devine, D.; Moran, K.; O’Connor, N.E.; Murray, N. An evaluation of a 3D multimodal marker-less motion analysis system. In Proceedings of the 10th ACM Multimedia Systems Conference, Amherst, MA, USA, 18–21 June 2019; pp. 213–221. [Google Scholar]
- Gupta, A.; Al-Anbuky, A.; McNair, P. Activity Classification Feasibility Using Wearables: Considerations for Hip Fracture. J. Sens. and Actuator Netw. 2018, 7, 54. [Google Scholar] [CrossRef] [Green Version]
- Ji, T.; Pachi, A. Frequency and velocity of people walking. Struct. Eng. 2005, 84, 36–40. [Google Scholar]
- Sharma, A.; Purwar, A.; Lee, Y.-D.; Lee, Y.-S.; Chung, W.-Y. Frequency based classification of activities using accelerometer data. In Proceedings of the Multisensor Fusion and Integration for Intelligent Systems, Seoul, Korea, 20–22 August 2008; pp. 150–153. [Google Scholar]
- Gaile, L.; Radinsh, I. Footfall Induced Forces on Stairs. In Proceedings of the 4th International Conference Civil Engineering’13, Jelgava, Latvia, 16–17 May 2013; pp. 60–68. [Google Scholar]
- Valkenet, K.; Trappenburg, J.C.; Schippers, C.C.; Wanders, L.; Lemmens, L.; Backx, F.J.; van Hillegersberg, R. Feasibility of exercise training in cancer patients scheduled for elective gastrointestinal surgery. Dig. Surg. 2016, 33, 439–447. [Google Scholar]
- Souwer, E.T.D.; Bastiaannet, E.; de Bruijn, S.; Breugom, A.J.; van den Bos, F.; Portielje, J.E.A.; Dekker, J.W.T. Comprehensive multidisciplinary care program for elderly colorectal cancer patients: “From prehabilitation to independence”. Eur. J. Surg. Oncol. 2018, 44, 1894–1900. [Google Scholar] [CrossRef]
- Gillis, C.; Li, C.; Lee, L.; Awasthi, R.; Augustin, B.; Gamsa, A.; Liberman, A.S.; Stein, B.; Charlebois, P.; Feldman, L.S.; et al. Prehabilitation versus REHABILITATIONA randomized control trial in patients undergoing colorectal resection for cancer. Anesthesiol. J. Am. Soc. Anesthesiol. 2014, 121, 937–947. [Google Scholar]
- Jones, L.W.; Eves, N.D.; Haykowsky, M.; Freedland, S.J.; Mackey, J.R. Exercise intolerance in cancer and the role of exercise therapy to reverse dysfunction. Lancet Oncol. 2009, 10, 598–605. [Google Scholar] [CrossRef]
- Peddle, C.J.; Jones, L.W.; Eves, N.D.; Reiman, T.; Sellar, C.M.; Winton, T.; Courneya, K.S. Effects of presurgical exercise training on quality of life in patients undergoing lung resection for suspected malignancy: A pilot study. Cancer Nurs. 2009, 32, 158–165. [Google Scholar] [CrossRef] [PubMed]
- Dworsky, J.Q.; Castle, S.C.; Lee, C.C.; Singh, S.P.; Russell, M.M. Gerofit Prehabilitation Pilot Program: Preparing Frail Older Veterans for Surgery. J. Healthc. Qual. JHQ 2019, 41, 91–98. [Google Scholar] [CrossRef] [PubMed]
- Koster, A.; Stenholm, S.; Schrack, J.A. The benefits of physical activity for older people. In The Palgrave Handbook of Ageing and Physical Activity Promotion; Springer: Berlin/Heidelberg, Germany, 2018; pp. 43–60. [Google Scholar]
- Freedson, P.S.; Melanson, E.; Sirard, J. Calibration of the Computer Science and Applications, Inc. accelerometer. Med. Sci. Sports Exerc. 1998, 30, 777–781. [Google Scholar] [CrossRef] [PubMed]
- Tapia, E.M.; Intille, S.S.; Haskell, W.; Larson, K.; Wright, J.; King, A.; Friedman, R. Real-time recognition of physical activities and their intensities using wireless accelerometers and a heart rate monitor. In Proceedings of the 2007 11th IEEE International Symposium on Wearable Computers, Boston, MA, USA, 11–13 October 2007; pp. 37–40. [Google Scholar]
- Gil-Rey, E.; Maldonado-Martín, S.; Gorostiaga, E.M. Individualized Accelerometer Activity Cut-Points for the Measurement of Relative Physical Activity Intensity Levels. Res. Q. Exerc. Sport 2019, 90, 1–9. [Google Scholar] [CrossRef]
- Yang, G.-Z.; Yang, G. Body Sensor Networks; Springer: Berlin/Heidelberg, Germany, 2006. [Google Scholar]
- Karantonis, D.M.; Narayanan, M.R.; Mathie, M.; Lovell, N.H.; Celler, B.G. Implementation of a real-time human movement classifier using a triaxial accelerometer for ambulatory monitoring. IEEE Trans. Inf. Technol. Biomed. 2006, 10, 156–167. [Google Scholar] [CrossRef]
- Mathie, M. Monitoring and Interpreting Human Movement Patterns Using A Rriaxial Accelerometer. Ph.D. Thesis, University of New South Wales Sydney, Kensington, Australia, 2003. [Google Scholar]
- Cunha, A.; Caetano, E.; Ribeiro, P. An in-situ case study of human induced vibrations on slender staircases. In Proceedings of the 9th International Conference on Structural Dynamics, EURODYN 2014, Porto, Portugal, 30 June–2 July 2014. [Google Scholar]
- Sekine, Y.; Chiyo, M.; Iwata, T.; Yasufuku, K.; Furukawa, S.; Amada, Y.; Iyoda, A.; Shibuya, K.; Iizasa, T.; Fujisawa, T. Perioperative rehabilitation and physiotherapy for lung cancer patients with chronic obstructive pulmonary disease. Jpn. J. Thorac. Cardiovasc. Surg. 2005, 53, 237–243. [Google Scholar] [CrossRef]
- Egan, B.; Ashley, D.; Kennedy, E.; O’Connor, P.; O’Gorman, D. Higher rate of fat oxidation during rowing compared with cycling ergometer exercise across a range of exercise intensities. Scand. J. Med. Sci. Sports 2016, 26, 630–637. [Google Scholar] [CrossRef]
- Parkka, J.; Ermes, M.; Korpipaa, P.; Mantyjarvi, J.; Peltola, J.; Korhonen, I. Activity classification using realistic data from wearable sensors. IEEE Trans. Inf. Technol. Biomed. 2006, 10, 119–128. [Google Scholar] [CrossRef]
- Dong, B.; Montoye, A.; Moore, R.; Pfeiffer, K.; Biswas, S. Energy-aware activity classification using wearable sensor networks. In Sensing Technologies for Global Health, Military Medicine, and Environmental Monitoring III; International Society for Optics and Photonics: Bellingham, WA, USA, 2013; Volume 8723, p. 87230Y. [Google Scholar]
- Bonomi, A.G.; Goris, A.H.; Yin, B.; Westerterp, K.R. Detection of type, duration, and intensity of physical activity using an accelerometer. Med. Sci. Sports Exerc. 2009, 41, 1770–1777. [Google Scholar] [CrossRef]
- Knight, J.F.; Bristow, H.W.; Anastopoulou, S.; Baber, C.; Schwirtz, A.; Arvanitis, T.N. Uses of accelerometer data collected from a wearable system. Pers. Ubiquitous Comput. 2007, 11, 117–132. [Google Scholar] [CrossRef]
Figure 1.
Diagram illustrating the key components of a prehabilitation programme for abdominal cancer patients. Training types include aerobic and resistance training using a variety of modes of exercise performed at light to moderate intensity at least three times per week. These exercises can be performed in a supervised or unsupervised setting. Note: Repetition maximum (RM).

Figure 2.
(a) 3D accelerometer sensor, along with the SD board and microcontroller. (b) 3D sensor on the ankle of the participant. (c) 3D sensor prototype.
Figure 2.
(a) 3D accelerometer sensor, along with the SD board and microcontroller. (b) 3D sensor on the ankle of the participant. (c) 3D sensor prototype.

Figure 3.
(a) The raw signals after applying filter techniques. (b) The raw signals before filtering.
Figure 3.
(a) The raw signals after applying filter techniques. (b) The raw signals before filtering.

Figure 4.
The outcomes of the fast Fourier transform (FFT) technique used to identify the dominant frequency and associated acceleration from 10, 4, and 3 s data collection windows.
Figure 4.
The outcomes of the fast Fourier transform (FFT) technique used to identify the dominant frequency and associated acceleration from 10, 4, and 3 s data collection windows.

Figure 5.
Right and left ankle dominant frequency and amplitude for different walking intensities.

Figure 6.
Right and left wrist dominant frequency and amplitude for different walking intensities.

Figure 7.
Right and left ankle dominant frequency and amplitude for different cycling intensities.

Figure 8.
Right and left wrist dominant frequency and amplitude for different cycling intensities.

Figure 9.
Five participants with different age groups and intensities.


Table 1.
The frequency domain ranges for different activities.
| Authors | Activity | Frequency Range Hz | Activity Mode |
|---|---|---|---|
| T. Ji and A. Pachi [9] | Walking | 1.4–2.1 Hz | Light-moderate |
| Sharma et al. [10] | Rest | 0.5 Hz | NA |
| Sharma, et al. [10] | Walking | 1.5–2.5 Hz | Light-moderate |
| Sharma et al. [10] | Running | 2.5–4 Hz | Vigorous |
| Mathie et al. [24] | Walking | 1.5–1.9 Hz | Light-moderate |
| Mathie at al. [24] | Walking | 3 Hz | Vigorous |
| Gaile et al. [11] | Ascending and descending staircase | 0.9–2.4 Hz | Light-moderate |
| Cunha et al. [25] | Descending staircase | 1.65–3.3 Hz | Vigorous |
Table 2.
Results of analysing 3D accelerometer data for nine different movements and at three different intensities collected from a sensor placed on the participant’s ankle and wrist.
Table 2.
Results of analysing 3D accelerometer data for nine different movements and at three different intensities collected from a sensor placed on the participant’s ankle and wrist.
| No. | Mode of Exercise | Intensity | Ankle | Wrist | Remarked “Measure of Intensity” | ||
|---|---|---|---|---|---|---|---|
| Frequency (Hz) | Amplitude (m/s2) | Frequency (Hz) | Amplitude (m/s2) | ||||
| 1 | Walking | Light | 1.5 | 15–32 | 0.75 | 16–19 | 4 km/h |
| Moderate | 2 | 38–60 | 1 | 23–30 | 5 km/h | ||
| Vigorous | 2.25–2.5 | 45–75 | 1 | 40–50 | 6 km/h | ||
| 2 | Running | Light | 3 | 55–70 | NA | 8 km/h | |
| Moderate | 3.25 | 55–75 | 10 km/h | ||||
| Vigorous | NA | NA | NA | ||||
| 3 | Treadmill | Light | 1.75 | 20–25 | 1.5 | 25–30 | 4.5 km/h |
| Moderate | 2 | 45–55 | 0.75 | 25–30 | 5.5 km/h | ||
| Vigorous | 2.25 | 50–60 | 1 | 25–30 | 6.5 km/h | ||
| 4 | Cycling | Light | 0.75 | 20–30 | 0.75 | 2 | 50 rpm |
| Moderate | 1 | 55–75 | 4.5 | 1–3 | 70 rpm | ||
| Vigorous | 1.25 | 55–90 | 4 | 2–4 | 90 rpm | ||
| 5 | Cross-trainer | Light | 1 | 8–13 | 0.75 | 14–16 | 50 rpm |
| Moderate | 1.25 | 20–28 | 2.25 | 27–35 | 70 rpm | ||
| Vigorous | 1.5 | 50–60 | 3 | 60–70 | 90 rpm | ||
| 6 | Rowing | Light | 0.25 | 4–6 | 0.5 | 12–14 | 50 Watt |
| Moderate | 0.5 | 11–15 | 0.75 | 30–40 | 70 Watt | ||
| Vigorous | 0.75 | 18–26 | 1.5 | 45–60 | >100 Watt | ||
| 7 | Stair ascent | Light | 0.75 and 1.25 | 30–35 and 15–25 | NA | No consistency in both F and A | |
| Stair descent | Light | 0.75 and 1.5 | 20–30 and 15–25 | ||||
| 8 | Step Ups | Light | 1.5 | 14–18 | 0.75 | 8–10 | 15 cm height |
| Moderate | 1.5 | 20–25 | 1.5 | 13–16 | 20 cm height | ||
| Vigorous | 1.75 | 22–26 | 1.5 | 15–19 | 30 cm height | ||
| 9 | Leg Press | Light | 0.25 | 5–6 | 1 | 5–8 | 90 kg, 20 times each session |
| Moderate | 1–2 | 3–5 | NA | 96 kg, 20 times each session | |||
| Vigorous | 0.5–3.75 | 0.5–5 | 115 kg, 20 times each session | ||||
© 2020 by the authors. Licensee MDPI, Basel, Switzerland. This article is an open access article distributed under the terms and conditions of the Creative Commons Attribution (CC BY) license (http://creativecommons.org/licenses/by/4.0/).
Share and Cite
MDPI and ACS Style
Al-Naime, K.; Al-Anbuky, A.; Mawston, G. Human Movement Monitoring and Analysis for Prehabilitation Process Management. J. Sens. Actuator Netw. 2020, 9, 9. https://doi.org/10.3390/jsan9010009
AMA Style
Al-Naime K, Al-Anbuky A, Mawston G. Human Movement Monitoring and Analysis for Prehabilitation Process Management. Journal of Sensor and Actuator Networks. 2020; 9(1):9. https://doi.org/10.3390/jsan9010009
Chicago/Turabian StyleAl-Naime, Khalid, Adnan Al-Anbuky, and Grant Mawston. 2020. "Human Movement Monitoring and Analysis for Prehabilitation Process Management" Journal of Sensor and Actuator Networks 9, no. 1: 9. https://doi.org/10.3390/jsan9010009
Note that from the first issue of 2016, this journal uses article numbers instead of page numbers. See further details here.