Abstract
Low Power Wide Area Networks (LPWAN) enable a growing number of Internet-of-Things (IoT) applications with large geographical coverage, low bit-rate, and long lifetime requirements. LoRa (Long Range) is a well-known LPWAN technology that uses a proprietary Chirp Spread Spectrum (CSS) physical layer, while the upper layers are defined by an open standard—LoRaWAN. In this paper, we propose a simple yet effective method to improve the Quality-of-Service (QoS) of LoRaWAN networks by fine-tuning specific radio parameters. Through a Mixed Integer Linear Programming (MILP) problem formulation, we find optimal settings for the Spreading Factor (SF) and Carrier Frequency (CF) radio parameters, considering the network traffic specifications as a whole, to improve the Data Extraction Rate (DER) and to reduce the packet collision rate and the energy consumption in LoRa networks. The effectiveness of the optimization procedure is demonstrated by simulations, using LoRaSim for different network scales. In relation to the traditional LoRa radio parameter assignment policies, our solution leads to an average increase of 6% in DER, and a number of collisions 13 times smaller. In comparison to networks with dynamic radio parameter assignment policies, there is an increase of 5%, 2.8%, and 2% of DER, and a number of collisions 11, 7.8 and 2.5 times smaller than equal-distribution, Tiurlikova’s (SOTA), and random distribution, respectively. Regarding the network energy consumption metric, the proposed optimization obtained an average consumption similar to Tiurlikova’s, and 2.8 times lower than the equal-distribution and random dynamic allocation policies. Furthermore, we approach the practical aspects of how to implement and integrate the optimization mechanism proposed in LoRa, guaranteeing backward compatibility with the standard protocol.
Keywords:
Internet of Things (IoT); Low-Power Wide Area Network (LPWAN); Mixed Integer Linear Programming (MILP); LoRaWAN; LoRa Simulator (LoRaSim); open-source; optimization; Quality- of-Service (QoS); data extraction rate; packet collision rate; energy consumption; energy efficiency; network performance; protocol overhead; performance evaluation; performance improvement; radio resource management 1. Introduction
We are at the dawn of the next generation of the Internet, which will be dominated by trillions of tiny computing devices embedded in everyday objects—the paradigm usually dubbed as Internet-of-Things (IoT). Many communication technologies can be used to interconnect IoT devices, e.g., short-range communication technologies such as Bluetooth, ZigBee, and Z-Wave. However, such technologies face critical challenges in terms of energy, cost, and complexity when applications require covering large geographical areas and feature a large number of devices, due to the need for tricky multi-hop routing in potentially harsh environments. Recent standards/technologies for Low-Power Wide-Area Networks (LPWAN) are an effective way to overcome such challenges and pave the way for new IoT applications that cover wide geographical areas over long distances [1]. LPWAN technologies such as LoRa (Long Range) [2], SigFox [3], Weightless [4], WAVIoT [5], and Wi-Fi HaLow [6] compete for an increasing market share among other IoT technologies, with a projected market worth of 65 Billion USD and smart gas and water metering applications occupying 20% of the LPWAN market by 2025 [7]. Figure 1 shows how LPWAN compares to other wireless technologies in terms of range and Bandwidth (BW).
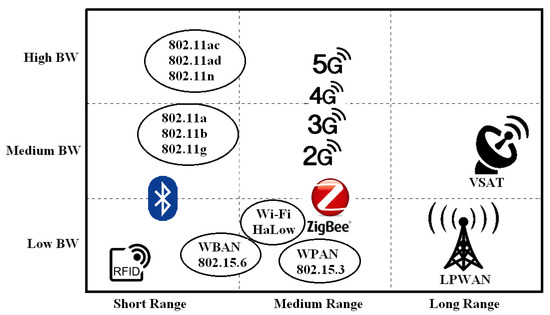
Figure 1.
Mapping radio coverage vs. bandwidth of wireless technologies [8].
This work focuses on LoRa, a proprietary physical layer protocol that affords low-power and long- distance communication through Chirp Spread Spectrum (CSS) modulation. The main advantages of LoRa over other LPWAN technologies are the open-source MAC protocol LoRaWAN specification, low-cost application availability, and community support [2]. For example, “The Things Network” is a crowd-sourced community from 85 countries building public and global IoT networks based on LoRa [9].
The configuration of LoRaWAN networks may be a challenging task, especially as the network scales up in the number of nodes. The link layer, LoRa, has some specific radio-related parameters that can be adjusted, such as Carrier Frequency (CF), Spreading Factor (SF), Bandwidth (BW), Transmission Power (TP), and Coding Rate (CR). These parameters can be tuned at a device and/or network level to enhance overall network performance, namely reducing energy consumption, improving radio coverage, and reducing radio interference and error rates. However, despite the increasing adoption of LoRa in IoT applications, the tools, methods, and models available to manage and optimize its performance are still scarce.
In this work, we propose a way to improve the Quality-of-Service (QoS) of LoRaWAN networks, specifically to increase the Data Extraction Rate (DER) and to reduce the number of collisions and energy consumption, through the formulation of a Mixed Integer Linear Programming problem, which generates optimal settings for the Spreading Factor and Carrier Frequency parameters. Our LoRaWAN-based solution takes as input a list of available CF and SF parameters to each node, allowing for pruning settings found to be inadequate (e.g., an SF that is unusable due to distance). The effectiveness of the proposed optimization procedure is demonstrated by simulations, using LoRaSim for different network scales, showing that our solution performs better than standard and other benchmarking radio parameter assignment policies.
We identify the following relevant contributions:
- (i)
- definition of a mathematical optimization formulation of the problem of assigning SF and CF parameters according to the traffic characteristics of LoRa end-devices;
- (ii)
- definition of an approximation algorithm that leads to results very close to the optimal, but with an execution time that grows much slower as the number of end-devices in the network scales;
- (iii)
- approach to implement and integrate the approximation algorithm in LoRaWAN networks and analyze the imposed overhead of the radio parameter assignment scheme to ensure compatibility with the standard protocol;
- (iv)
- implementation of the proposed optimization algorithms and of other baseline policies (benchmarks to which our method is compared against in Section 6), and as well as of the ADR mechanism (not implemented in LoRaSim) in the LoRaSim open-source simulator, making our code available to the community [10]; and
- (v)
- Comparative performance analysis of six radio parameter assignment policies, showing the merit of the two proposed parameter assignment methods in relation to the other four policies that we consider as benchmarks.
The remainder of the paper is structured as follows. Section 2 discusses relevant related work. Section 3 overviews the characteristics of the LoRa communication protocol that are most relevant within the context of this paper. In Section 4, we present a method to select optimal values to CF and SF radio parameters, based on a formulation using Mixed Integer Linear Programming. Section 5 presents the Approximation Algorithm, which can efficiently produce results very close to the optimal. Section 6 outlines the simulation setup, the evaluation metrics, and elaborates on the comparative analysis performance of our parameter optimization method against relevant benchmark policies. Finally, Section 7 concludes the paper by summarizing the main contributions and unveiling future research directions.
2. Related Work
Network performance and scalability are key factors for LoRaWAN network design. These factors are influenced mainly by the correct choice of radio parameters and by environmental conditions [11]. Several researchers defined a possible formal approach, through the analysis and comparison of performance and scalability of LoRaWAN networks, for the problem of parameter selection. In this section, we outline some relevant works that address these aspects.
The performance analysis of long-range transmission and channel attenuation, made by Petajajarvi [12], concludes that, in the best scenario, a single gateway configured using SF 12, 125 MHz BW, and data rate of 1.8 kbps, covers an area of 30 km in peripheral urban environments. Additionally, this paper concludes that low values of SF are recommended for urban scenarios due to less interference caused by the Doppler effect. In other work, Petajajarvi [13] analyzed the performance of LoRa in three experiments. The first and second experiments were performed in a LoRa end-device under the Doppler frequency shift. With TP of 14 dBm and SF12, at least 60% of the packets are received from 30 km distance on the water. The third experiment was performed on an end-device, mounted in a car, configured with a TP of 14 dBm and SF of 12. This work concludes that, in a mobile scenario, the LoRa communication worsens in a displacement speed of end-devices around 40 km/h.
In an indoor environment, Neumann [14] did a performance analysis of the LoRa network with the parameters throughout RSSI, Signal-to-Noise Ratio (SNR), packet loss, packet error, power consumption, and delay to verify how the average current consumption of one end-device impacts in the performance of LoRa network with one device and one gateway. This study concludes that the data rate affects the packet loss.
The scalability of LoRaWAN networks evaluated in ref. [15] in the ns-3 simulator, in which the error model is based on interference among various concurrent transmissions, concludes that increasing the gateway density improves the negative effect of restrained downstream in packet delivery ratio of upstream messages.
In ref. [16], the authors proposed an optimized SF parameter allocation approach, stating that it increases the probability of uplink data delivery by 20–40% at the cost of increasing power consumption by 1–8%, respectively. Due to its relevance in the context of this paper, we considered this algorithm as a benchmark (dubbed “Tiurlikova”) in the comparative performance analysis outlined in Section 6.
Bakov [17] measured the limits of a LoRaWAN network, which is about 0.1 51-byte (Frame Payload) in a network with three main channels and six data rates. That corresponds to 5000 end-devices, each node generating two messages per day. A performance analysis conducted in ref. [18] of LoRaWan end-device using the metrics uplink, throughput, and transmission time concluded that, in terms of LoRaWAN scalability, millions of devices can communicate with a reduced transfer.
Vatcharatiansakul [19], in a LoRaWAN performance evaluation carried out in internal and external environments, concluded that the LoRa signal range is affected by the properties of the antennas such as antenna gain, directional, and antenna height. Yousuf [20] measured how internal and external urban environments affect the LoRa signal. In an internal environment of a seven-story building, there was a minimal packet drop. The external coverage depends on the environment. In this experiment performed in a range of 4.4 km, there was 15% of packet drops and the packet size alter the signal range.
Toussaint [21] evaluated over-the-air performance in a Markov chain model in different traffic conditions, duty cycles, and channel availability. The expected delay and energy consumption of the LoRa network depends on the number of channels, the number of sub-bands, and gateway parameters. Feltrin [22] characterized experimentally from the link-level viewpoint and evaluated through simulations the capacity of a LoRaWAN gateway to provide communications in large rural environments. In this scenario, a gateway covering an area of 1 km, the maximum node density is 185 end-devices/hectare. However, using this gateway in an area of 46.5 km, the maximum density decreased to one node/hectare. To maximize the node density in this large area, four gateways provide 40 end-devices/hectare.
The work of Cattani [23] presents an analysis of the performance of the LoRa in relation to different configurations of PHY and environmental conditions. The analysis done in a scenario where the network nodes are at the communication limit concludes that it is more efficient to use the faster PHY configuration and higher transmission power than slower configurations that maximize the quality of the link because the faster PHY setting provides 100 times faster effective bit rate than the slower setting scenario, at the cost of a 10% lower average packet reception rate. In addition, the work concludes that environmental factors such as temperature and humidity impact the rate of reception of packets and the intensity of the received signal. In a controlled environment with a temperature of 15 C, an optimal link with 100% Packet Reception Rate becomes unusable at 60 C. Over this temperature range, the received signal strength is reduced by 6 dBm, being 1 dBm per 10 C.
Reynders et al. [24] analyzed and compared the performance of LoRa networks with a proposed MAC layer two-step lightweight scheduling in ns-3 simulator. The results conclude that, in a scenario with one gateway and 1000 end-devices, the proposed MAC layer reduces the Packet Error Ratio around 20%. In the performance analysis of LoRa network performed in ref. [25], with Additive white Gaussian noise (AWGN), a frequency selective channel of the Frequency Shift Chirp Modulation (FCSM), and the Frequency-Shift keying modulation (FSK), the authors concluded that the performance of the FCSM and FSK in an AWGN channel are equivalent. However, in a frequency selective channel, the FCSM has a superior performance.
Lim and Han [26] made a proposal and schema validation to maximize the average Packet Success Probability through SF parameters using MATLAB simulator on Massive Connectivity (MC), respectively. The projected scheme is better for all others MC in relation to Monte Carlo simulations and analysis. For example, in a 2000 end-devices LoRa network, the method provides stability for 810 end-devices, an increase of 22% in MC over the Equal-Area-Based scheme.
Differently from the studies presented, this work proposes to optimize the performance of LoRaWAN networks through a dynamic assignment policy of SF and CF parameters, which is backwards compatible with the standard protocol and ADR mechanism. The proposed policy was compared and analyzed against LoRaWAN’s default assignment policy, and the random, Tiurlikova’s, and equal dynamic assignment policies.
3. LoRa and LoRaWAN Overview
LoRa uses a radio frequency technology that allows communication over long distances, with minimal energy consumption and a proprietary Chirp Spread Spectrum physical layer and upper layers defined by an open standard—LoRaWAN. The end-devices can be sensors and actuators, while gateways provide the radio connectivity to end-devices and deliver packets to the network infrastructure composed of network servers and application servers. Network servers are responsible for functions such as checking addresses of end-devices, checking received frames for authenticity, handling acknowledgments, and forwarding application payloads. Application servers perform encryption/decryption of application payloads, manage user authorization, among other related functions [9]. Figure 2 shows the LoRaWAN network architecture, composed by end-devices, gateways, network servers, and application servers.
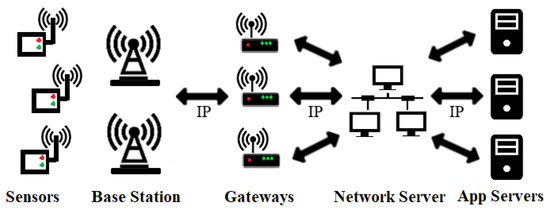
Figure 2.
LoRaWAN network architecture.
3.1. Protocol Stack
Figure 3 shows the LoRaWAN protocol stack.
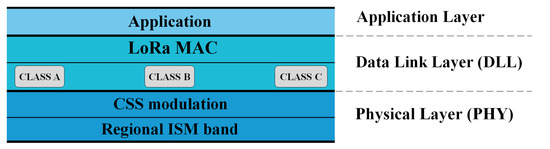
Figure 3.
LoRaWAN Protocol Stack.
As shown in Figure 3, the top layer is the Application Layer. The bottom layer is the Physical Layer (PHY), as detailed in Section 3.2, responsible for LoRa modulation and ISM band definition, which depends on the geographic region [2]. Above the PHY layer, is the Data Link Layer (DLL), defined by the LoRa Alliance. To optimize energy consumption, LoRaWAN uses a pure ALOHA [20] medium access control mechanism, encompassing three classes of end-devices, namely Classes A–C, as detailed in Section 3.3.
3.2. LoRa Physical Layer
The physical layer LoRa implements CSS transmission method. The characteristics of LoRa are based on the following configurable parameters:
Bandwidth (BW): BW is the width of the frequencies in the transmission band. Higher BW values provide a higher data transfer rate and greater sensitivity to noise. The sets of BW in LoRa are 125, 250, and 500 kHz.
Spreading Factor (SF): SF is the ratio between the symbol rate and the chip rate, which can be in the range of 7–12. Higher SF increases the SNR, transmission range, and packet airtime, therefore it decreases the data rate. SFs are imperfectly orthogonal. However, for traceability purposes in our experiments, they are considered orthogonal. If different SFs are used, the gateway can successfully decode multiple simultaneous data packets. LoRa modulation transmits the data at a chip rate equal to the programmed BW (chip-per-second-per-Hertz). The symbol rate and the bitrate are proportional to the BW. With CSS, each LoRa symbol is coded with a spreading code of chips. Then, it takes chips () to spread a symbol [27].
Carrier Frequency (CF): CF is the center frequency and can be programmed in a range of 137 MHz to 1020 MHz according to current geographic region legislation. For example, Table 1 shows the range of frequencies for each CF parameter, sub-bands, and max-duty-cycle (per hour) according to the ETSI EN300.220 European continent standard [28].

Table 1.
LoRa frequencies, sub-bands, and max-duty-cycle according to parameter CF.
Transmission Power (TP): Due to hardware limitations, the TP in a LoRa network can be configured in steps of 1 dB with a signal power between 2 and 20 dBm and a service level of 1% from 17 dBm [29].
Coding Rate (CR): LoRa modulation adds Forward Error Correction (FEC), providing protection against transmission interference by encoding 4-bit data with 5–8-bit redundancies, allowing the receiver to detect and correct errors in the message. The CR values are 4/5, 4/6, 4/7, and 4/8, proportional to the FEC. This means that, if the code rate is denoted as , where k represents useful information, and the encoder generates N number of output bits, then will be the redundant bits. Higher CR values provide greater interference protection. However, it increases the air time. LoRa devices with different CR can switch to communicate with each other through an explicit header stored in the packet header [30].
The airtime of a LoRa transmission is computed according to the payload size and the combination of several radio parameters: SF, BW, and CR. These parameters can make the transmission time vary significantly. Table 2 exemplifies the different SNR, airtime, and bitrate resulting from the different SF at a fixed payload length of 10 bytes, kHz, and .
Table 2.
LoRa Chirps, SNR, airtime, and bitrate according to parameter SF.
3.3. Class Transactions
The upper layer protocol, LoRaWAN, defines three classes of end-devices, with bidirectional communication, according to downlink latencies and power requirements. Class A devices have longer battery life because of higher latency. The downlink occurs within two windows, both with a specified delay, after an uplink transmission. Figure 4 shows a LoRaWAN Class A transaction.
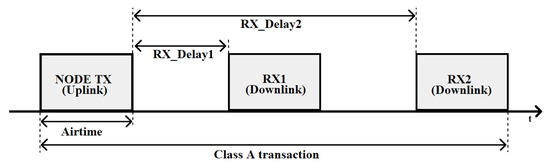
Figure 4.
LoRaWAN Class A transaction scheme.
Class B devices schedule downlink receptions from the base station at a pre-established period, determining when applications can send control messages to the end-devices. In relation to Class A, the Class B transaction has additional downlink windows, which occur at specific times following a beacon, as illustrated in Figure 5.
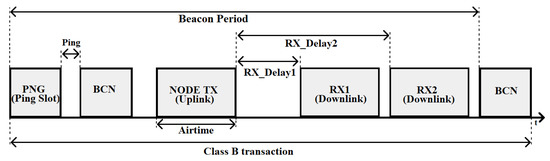
Figure 5.
LoRaWAN Class B transaction scheme.
Class C devices are grid-powered and always listening to the transmission medium and thus receive downlink transmissions with the lowest latency [11]. As can be seen in the example shown in Figure 6, it consists of receive windows that remain almost continuously open (only close during transmission).
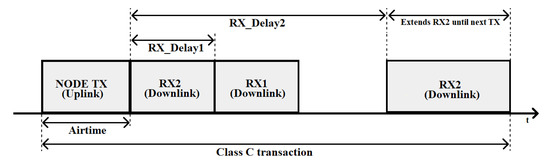
Figure 6.
LoRaWAN Class C transaction scheme.
3.4. Frame Structure
The preamble, in a range of 6–65535 symbols, initiates the LoRa packet structure. An optional header, which describes the length and Forward Error Correction (FEC) rate of the payload, specifies a 16-bit Cyclic Redundancy Check (CRC). The header is transferred with a 4/8 FEC rate. Afterwards, there is the payload in the packet structure [29]. Figure 7 shows the frame structure of LoRa.
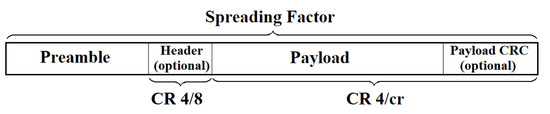
Figure 7.
LoRa frame structure.
3.5. LoRaWAN Adaptive Data Rate
The Adaptive Data Rate (ADR) mechanism is used to optimize the data transmission rate and the transmission power of the network nodes, in order to optimize network scalability and energy consumption. This mechanism runs asynchronously, with low complexity in the end-devices and with more complexity in the network server. The ADR should only be enabled by end-devices in stable RF conditions and deactivated when the end-device detect unstable RF conditions. For instance, mobile end-devices must enable the ADR only when they are static for a certain period.
The appropriate data rate is determined by measurements of uplink messages based on the frame counter, SNR, and the number of gateways [31]. As specified by the LoRa Alliance [2], after the ADR bit is set (to 1), the server analyzes the 20 most recent uplinks. If the ADR bit is reset (to 0), the previous measurements are discarded and the measurements start again when the ADR is set again. If uplink messages are not received by the gateway, the ADR algorithm in the end-devices (ADR-NODE) increases the SF value of the subsequent uplink frame, thereby reducing the data rate and increasing the probability of reaching a gateway. Algorithm 1 shows the ADR-NODE algorithm.
| Algorithm 1: ADR-NODE [32]. |
 |
The server ADR algorithm (ADR-NET) increases the data rate, consequently decreasing the SF, and modifies the TP by measuring the SNR of the received frames, estimated based on the minimum SNR needed for the demodulation, and adjusted according to the specific margin of the device. The new parameters values calculated by the algorithm are sent to the end-device through a downlink frame, in order to be used in future transmissions [33]. Algorithm 2 presents the ADR-NET algorithm.
The ADR is an important mechanism for optimizing the data transfer rate, the airtime, and energy consumption. Understanding its operation is fundamental to make the optimization of radio parameters proposed in this work backward compatible with the standard LoRa protocol (therefore with ADR), as explained in Section 5.2. Next, Section 4 describes the MILP optimization problem.
| Algorithm 2: ADR-NET [32]. |
 |
4. MILP Optimization Problem
To increase the performance of the LoRaWAN network through the optimization of radio parameters, we developed a formulation using Mixed Integer Linear Programming (MILP), a formal mathematical optimization framework. Using MILP provides a mathematical framework that allows solving complex problems by leveraging well-established theory and solution methods. Similar approaches using a MILP formulation in network parameter optimization scenarios can be found in previous work (e.g., [34,35]). It is also important to note that the optimization problem is the baseline for the approximation algorithm, allowing us to benchmark the approximation against an optimal solution.
Many objectives can be selected to improve the performance of LoRaWAN networks, e.g., reduce the individual node energy consumption, improve the reliability of data delivery, or improve overall throughput. For the purpose of this work, we aim at improving the amount of successfully delivered messages over a period of time by setting the radio parameters of the LoRaWAN devices in the network. Our performance problem for LoRaWAN, modeled as a MILP problem, assigns values to the CF and SF parameters in order to improve the performance of the network. Section 4.1 presents general aspects of the MILP, Section 4.2 introduces the notation and model used, and Section 4.3 presents our MILP problem formulation.
4.1. Background on Mathematical Optimization
Mathematical optimization has been used in a great number of fields, such as in ref. [36] for vehicle- control problems, in ref. [37] for short-term scheduling of resource-constrained multistage flow-shop batch facilities, in ref. [38] for short-term hydro scheduling and unit commitment with the head-dependent reservoir, and in ref. [39] for aircraft planning with collision avoidance. Mathematical optimization is also used for automotive applications when optimizing extensibility [40] or task activation modes [41]. The problems can be expressed by a set of integer, binary and continuous design variables, design parameters, linear equalities and inequalities representing the constraints on the solution, and a linear objective function. The main advantage consists in the possibility of leveraging a well-established theory and solution methods, which includes the availability of efficient solver engines with controllable solution accuracy and constrained computing time [38].
Linear Programming is a method for solving design problems using the formal mathematical optimization framework. A MILP optimization problem is given for a set of variables, objective function, and a set of constraints. Solving the problem attempts to find the best solution for the objective function in the set of solutions that satisfies the constraints.
4.2. Notation and Model
Consider a wireless network system with a LoRaWAN gateway and n end-devices. End-devices transmit with an average transmission rate packets/second and an average length of bytes. The time to transmit a packet of length is given by a function , which computes the time to transmit according to parameters SF, CR, BW, and payload size. For the purpose of this model, we assume a fixed BW and CR, which must be taken into account for the airtime computations.
To model our problem as an MILP problem, we define an array of tuples for each end-device, where is a list of available CFs and is a list of available SFs. The lists of SFs and CFs as input allow, e.g., reserving certain for other uses. An example input could be and indicating that the algorithm can use three CFs (868.1, 868.3, and 868.5) and 7–12 SFs in each of these channels. The tuples are arrays of booleans which indicate if an end-device i is using a given or . These are the decision variables of our problem and one of the constraints of our model must restrict the solutions to only having one value of each of the arrays set to true in each end-device, as each end-device can only have one CF and one SF value assigned.
The end-devices of the LoRaWAN networks as with and parameters communicate with gateway G. To increase network performance, multiple indexes are considered: energy consumption of the end-devices, network range, interference reduction, and errors rate. In this case, and are assigned to maximize the probability of success on a single gateway. As an input, to model the LoRaWAN network as MILP, we are given variables where N is equal to the number of end-devices.
4.3. MILP Problem Statement
Considering that SFs are orthogonal with each other, we would like to maximize the probability of success (or minimize the collision probability) for each pair. Therefore, the decision variables for each node have two Boolean arrays and that indicate the and of each N. For example, the following arrays indicate that is using and :
To express this in our MILP model, we define in Equation (1) the following objective function, which minimizes the difference between the utilization of each pair, denoted as , resulting in the minimum load for each :
where
and
subject to
and
Equation (2) computes the utilization of the pair, as defined by Equation (3), considering the number of end-devices assigned to that pair. The two constraints in Equations (4) and (5) limit the assignment and such that each end-device is only assigned one and one .
Practical Issues: Equation (3) is the product of two binary variables, which is nonlinear. This can however be made linear given
and the following additional constraints:
This problem can be solved using one of the many state-of-the-art MILP solvers. In our experiments, we used the CPLEX optimizer [42] due to the set of different options, strategic decomposition, and deactivation of heuristics that reduce the time to solve complex problems [43].
5. Approximation Algorithm
The ADR mechanism, as described in Section 3.5, improves the data rate, airtime, and power consumption of each end-device through the TP and parameters according to , TP, BW, and SNR. However, the performance of a LoRaWAN network also depends on the occurrence of simultaneous transmissions with the same SF, determined through the two-dimensional coordinates of the end-devices and the LoRaWAN network gateways.
To apply the results obtained through the MILP problem formulation, as described in Section 4.1, with backward compatibility in LoRaWAN networks, we rely on the ADR mechanism to dynamically adjust the settings of end-devices. As indicated by the standard, only end-devices with a stable RF environment should enable ADR. Our model includes provisions for defining a list of end-devices for which the SF parameter, determined by measurements (which are part of the normal LoRaWAN ADR procedure), can be changed. This is backward compatible with existing LoRaWAN networks and only the LoRa network server needs to be updated to obtain the radio parameters according to our proposed method.
5.1. Description of the Approximation Algorithm
The time to solve MILP problems grows exponentially as the number of end-devices increases. Due to scalability issues, we developed the Approximation Algorithm to provide parameter assignments (Algorithm 3). The approximation is based on a first-fit assignment of the utilization for each and combination.
| Algorithm 3: Approximation Algorithm. |
 |
The Approximation Algorithm in Algorithm 3 receives as input the average packet length in bytes (), and the average packet transmission rate (). It also receives two arrays with the available CFs and SFs, with the array being ordered from the SF with the smallest resulting airtime to the largest.
Algorithm 3 starts by creating an array of to hold the utilization of each () pair. Then, the algorithm assigns a CF and SF to each end-device by using a function which takes as input the array and returns a tuple that will result in the lowest utilization increase. That is, it will return the pair that is the . Finally, the algorithm increases the utilization for that pair.
5.2. Backward Compatibility with LoRaWAN
The LoRa Server project [44] provides a set of open-source applications for building LoRaWAN networks. It is part of a larger project that encompasses a protocol packet forwarder broker for MQTT (LoRa Gateway Bridge), and a compatible application server. The mechanisms provided by LoRa Server allow users to manage the gateways in the LoRa network, the supported applications, and the devices associated with the applications [44].
Reviewing the documentation for sending LoRa server uplink messages [45,46], the way to implement the Approximation Algorithm with backward compatibility with the standard LoRa protocol and its mechanisms, e.g., ADR (as described in Section 3.5), is to implement the Approximation Algorithm at the LoRa application layer of LoRa and devices. Thus, the application layer determines the pair individually for each node. The LoRa Server receives as input parameters the pairs by the application server (that is running the Approximation Algorithm) and transmits to the end-devices in the downlink. Then, the node executes a corresponding application to configure the node parameters.
6. Evaluation
To study the performance of different parameter selection strategies, including the ones assigned by solving the optimization problem presented in Section 4 and the algorithm in Section 5, we carried out a simulation study based on the tools developed in ref. [29]. We aimed at studying the scalability of the network, namely analyzing different performance metrics according to the number of end-devices and topologies. Building and analyzing such LoRaWAN networks would be infeasible in practice, so we opted to base our study in simulation.
6.1. Simulation Setup
The LoRa simulation tool, LoRaSim [29], allows defining model LoRa networks by setting the number of end-devices inserted in a two-dimensional area, average packet transmission rate (), the number of base stations and other radio parameters such as SF, CR, and BW. However, LoRaSim does not consider channel hopping and downlink messages.
In our experiments, we assumed that a single base station can simultaneously decode concurrent signals on all orthogonal SF and BW settings. This assumption can be supported in practice with multiple LoRa chips, such as the Semtech SX1301 [47]. We executed multiple runs, each with a random uniform node distribution in space, with a simulated time of one year for all experiments. Table 3 presents the simulations parameters common to all simulation runs.
Table 3.
Simulations parameters.
According to Table 3, the simulated scenarios run time was one year, with all devices transmitting data at an average send interval of 16.6 min. This means that each end-device transmitted 86 times a day within one year.
6.2. Evaluation Metrics
We used three evaluation metrics to evaluate the performance of a LoRaWAN network as follows: Data Extraction Rate, number of collisions, and Network Energy Consumption (NEC).
Data Extraction Rate provides a network-wide measure of the valid packets received in a numerical range between 0 and 1, wherein for optimal network deployments the value is equal to 1. Equation (10) shows how the DER can be computed, where represents the number of packets received, C the number of packet collisions, and the total number of packets sent.
The number of collisions provides further insight into the changes in the DER. Packet collisions occur when two or more network nodes attempt to send data simultaneously, resulting in collisions and possible loss of transmitted data, causing a negative effect on system performance. When two LoRa transmissions occur at the same time (perceived at the receiver), it is determined that the receiver can decode received packets simultaneously by analyzing CF, SF, energy and time conditions. The collision behavior evaluated in LoRaSim simulations depends on the following parameters:
- Reception overlap: In LoRaSim, two packets overlap when the reception intervals overlap. It is represented by .
- Carrier Frequency: It is evaluated whether transmissions with the same CF and BW parameters but different SFs can be successfully decoded. Importantly, they are available assuming two reception paths. CF collision is expressed by .
- Power (capture effect): In our simulations, the capture effect was considered, which is modeled on LoRaSim to match a Semtech SX1272. It is defined when two signals occur simultaneously at the receiver and the weakest signal is suppressed by the strongest. It is determined by .
- Timing: Experiments conducted by Bor et al. [29] conclude that packages can overlap as long as there are at least five preamble symbols intact. This defines the transmission interval that two transmission packets collide within their critical section. It is represented by .
More information on collision behavior in LoRa can be found in ref. [29].
Network Energy Consumption (NEC) is defined as the energy spent by the network to extract a message successfully, considering all network nodes. It depends on parameters such as SF, BW, CR, and TP. By definition, the NEC metric evaluates the network as a whole, not just individual node behavior, and grows proportionally as the number of end-devices increases. A low value of NEC means that the network parameters have been set efficiently [48]. Equation (12) describes the calculation of NEC in Joules, where V is the operating voltage, defined as 3 V according to Table 3. is the total number of packets sent, i is the end-device index, is the transmission power consumption of each end-device in mA, and depends on the parameters SF, CR, BW, and payload size of each end-device.
6.3. Parameter Assignment Policies
We performed experiments for the following parameter assignment policies:
- Min-airtime: The min-airtime is a default assignment used by LoRa end-devices which assigns a fixed CF in CF4 (sub-band g) and SF in SF7 so that packets have the minimum air time (see Table 2).
- Random: The random policy dynamically assigns pairs randomly, aiming at reducing concurrent transmissions (that cause packet collision).
- Equal-distribution: With a similar goal to random, the equal-distribution distributes the number of end-devices equally between pairs.
- Opt-problem: The opt-problem is the assignment resulting from solving the optimization problem presented using the CPLEX ILP solver (in Section 4).
- Approx-alg: The approx-alg policy is the result of using the Approximation Algorithm (in Section 5).
Analysis of Network Scalability of Assignment Policies
According to the ETSI EN300.220 standard, in Europe, the max-duty-cycle for g (863.0–868.0 MHz) and g1 (868.0–868.6 MHz) bands is 1% (see Table 1). The limit of utilization of these subbands is represented mathematically by Equations (14) and (15), where i is the index of each node, T is the airtime (according to Table 2), and N is the nodes numbers:
Considering a network scenario with the configuration parameters in Table 3, Table 4 shows the maximum number of nodes that can be allocated for each assignment policy, resulting from calculating the sub-band use of each pair of CF, SF through Equations (14) and (15).
Table 4.
Network scalability according to allocation policy.
The results in Table 4 show that the policies that best scaled the network are opt-problem and approx-alg. This is due to the optimization to dynamically assign to each node the () pair leading to the shortest airtime, considering the use of sub-bands g and g1. As a result, the opt-problem and approx-alg policies allow the best scaling of the network, with a maximum number of 353 nodes. The Tiurlikova allocates 64 nodes per sub-band. Using sub-bands g and g1, the number of nodes that can be allocated is 128.
In the best-case scenario, the maximum number of nodes that can be allocated with the random policy is 353 nodes if the randomly generated CF and SF values for all nodes are the same as opt-problem and approx-alg policies (regardless of their ordering). However, the random policy allows only six nodes to be allocated in the worst-case scenario, which is all nodes allocated in SF12 using only one of the sub-bands (g or g1).
The min-airtime assignment policy allocates a maximum of 176 nodes, respecting the max-duty- cycle limit of 1%, with all nodes configured in SF7 using the g sub-band. Importantly, policy min-airtime uses only the sub-band. If sub-band g1 is enabled, network scalability results are similar to opt-problem and approx-alg policies, with 353 nodes. Finally, the maximum number of nodes that can be allocated with the equal-distribution policy is 66 nodes.
6.4. Evaluation Results
To better represent the difference between assignment policies, the network scenarios used in our simulations range up to 1500 nodes with no duty-cycle restrictions. The chosen transmission range is 99 m radius, which represents a transmission range in built environments, and 350 m radius, a range chosen due to the limitation of the min-airtime policy (which uses SF7) based on the experiments performed with the simulation parameters in Table 3.
6.4.1. DER
Figure 8 shows the results of DER as a function of the number of end-devices with gateway transmission range of 99 m radius.
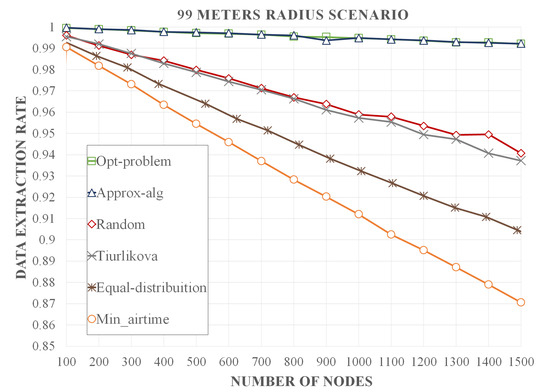
Figure 8.
DER as a function of the number of nodes in the 99 m radius scenario.
As shown in Figure 8, the policies opt-problem (green line) and approx-alg (navy blue line) show the highest DER performance with an average increase of 7.14%, 5.19%, 3.03%, and 2.82% in relation to the min-airtime (orange line), equal-distribution (brown line), Tiurlikova (silver line), and random (red line), respectively.
Figure 9 presents the results of DER as a function of the number of end-devices with gateway transmission range of 350 m.
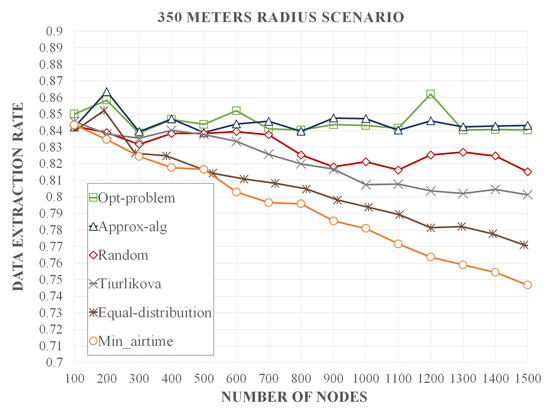
Figure 9.
DER as a function of the number of nodes in the 350 m radius scenario.
According to Figure 9, the opt-problem shows the highest DER performance with an average increase of 6.63%, 5.04%, 2.95%, 1.95%, and 0.1% in relation to the min-airtime, equal-distribution, Tiurlikova, random, and approx-alg, respectively.
6.4.2. Number of Collisions
Figure 10 illustrates the number of collisions according to the number of nodes with a gateway transmission range of 99 m radius.
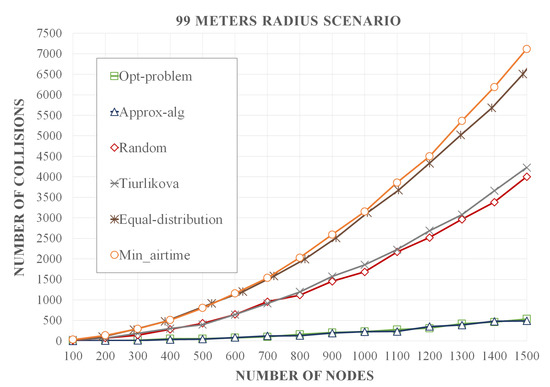
Figure 10.
Number of collisions according to the number of nodes in the 99 m radius scenario.
The results in Figure 10 show that opt-problem and approx-alg cause the lowest number of collisions, being the curves represented in the graph practically equivalent. The policies min-airtime, equal-distribution, Tiurlikova, and random lead to average collision rates 13.3, 12.7, 7.8 and 7.4 times higher, respectively, in relation to opt-problem and approx-alg. Figure 11 demonstrates the number of collisions according to the number of nodes with gateway transmission range of 350 m.
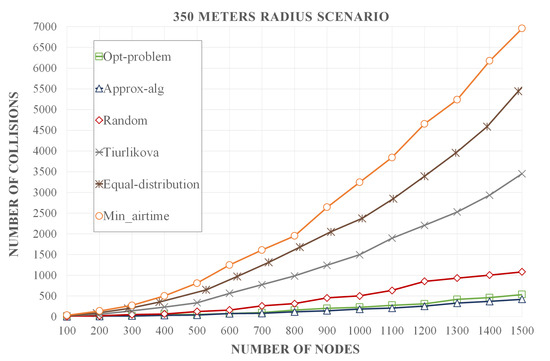
Figure 11.
Number of collisions according to the number of nodes in the 350 m radius scenario.
The results in Figure 11 indicate that opt-problem and approx-alg have the smallest number of collisions, with equivalent results. The policies min-airtime, equal-distribution, Tiurlikova, and random have average collision rates 15.4, 11.7, 8.3 and 2.5 times higher, respectively, in relation to opt-problem and approx-alg.
The results shown for a radius of 99 m differ from 350 m in the number of collisions. The number of packet collisions for 350 m is about 12% higher, and this is reflected in the DER (as shown in Equation (10), DER is a function of the number collisions).
6.4.3. Network Energy Consumption
The results for the 99 and 350 m scenarios are similar, because the calculation of Network Energy Consumption, as shown in Equation (12), depends on the number of packets sent, which is similar in the 99 and 350 m scenarios. Therefore, Figure 12 presents the Network Energy Consumption in mJ as a function of the number of nodes with gateway transmission range of 99 m.
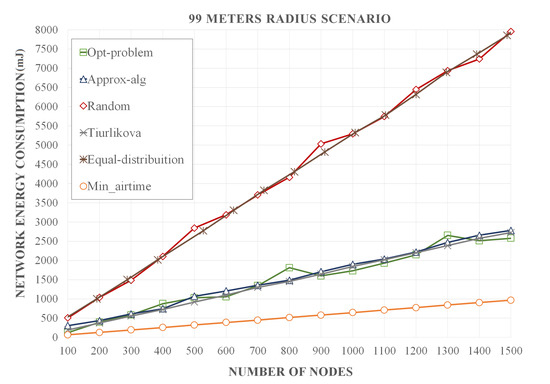
Figure 12.
Energy consumption as a function of the number of nodes in the 99 m radius scenario.
The results in Figure 12 demonstrate that equal-distribution has a three times higher energy consumption rate as opt-problem and it is 2.94 greater than approx-alg. The random policy resulted in an average energy consumption 2.84 and 2.76 times higher than opt-problem and approx-alg, respectively. Equal-distribution and random achieved similar energy consumption, being 5.5% greater for equal-distribution. The difference in the average energy consumption between opt-problem and approx-alg is 2.7%. Tiurlikova achieved energy consumption similar to opt-problem and approx-alg. Both obtained an average consumption 2.9 times greater in relation to the min-airtime. Using this policy, SF is set to SF7, which has the lowest energy consumption, as reported in Section 3. However, in opt-problem and approx-alg, dynamic values of SF are assigned to the network nodes.
The radio parameter assignment policies proposed in this paper—opt-problem and approx-alg—proved to be better than policies random, min-airtime, Tiurlikova, and equal-distribution in relation to DER and number of collisions. The results show that opt-problem and approx-alg obtained DER values above 0.98 and 0.83 for the 99 m and 350 m scenarios, respectively. The number of collisions was minimal in relation to random, min-airtime, Tiurlikova, and equal-distribution. In addition, the energy consumption of the proposed optimization schemes is similar to Tiurlikova and lower when compared to other methods of dynamic assignment of values of SF and CF: random and equal-distribution.
6.4.4. ADR Analysis and Comparison in approx-alg and random Policies
As explained in Section 5.2, the optimization of LoRaWAN network radio parameters proposed in this paper is compatible with the standard LoRa protocol, which includes the ADR mechanism. In this context, we implemented the ADR mechanism in the LoRaSim simulator to analyze its impact on the random and approx-alg dynamic assignment policies, using, according to the DER, number of collisions and Network Energy Consumption evaluation metrics.
To represent a more overloaded network scenario, keeping the network simulation settings in Table 3, the average packet transmission period was changed from 16.6 min to 1 min with a transmission range of 99 m. Figure 13, Figure 14 and Figure 15 illustrate the DER, the number of collisions, and the Network Energy Consumption, respectively, according to the number of nodes.
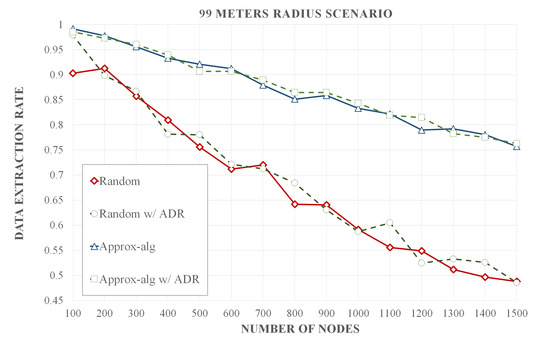
Figure 13.
DER as a function of the number of nodes in the 99 m radius scenario.
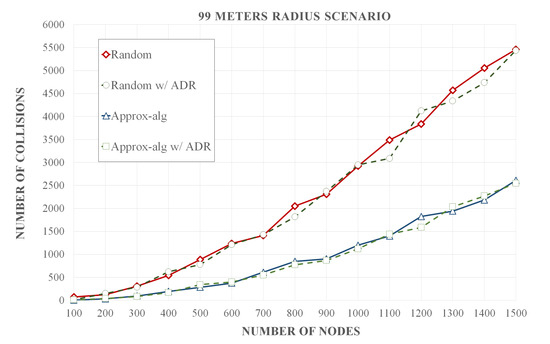
Figure 14.
Number of collisions according to the number of nodes in the 99 m radius scenario.
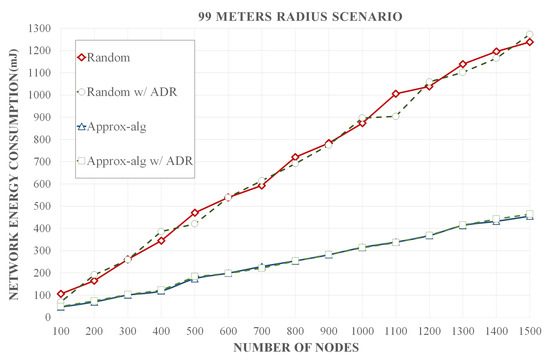
Figure 15.
Energy consumption as a function of the number of nodes in the 99 m radius scenario.
According to Figure 13, the improvement of the random policy with the ADR mechanism is 1.43% compared to without ADR. The difference in approx-alg was smaller, only 0.23%. Therefore, it was the random policy that obtained the highest gain of DER with ADR mechanism.
Figure 14 shows that the network packet collision rate decreased around 2.79% in the random and 1.89% in the approx-alg.
Figure 15 shows that average NEC decreased 1.25% in the random. Therefore, the NEC value in was very close in approx-alg with and without ADR. The results demonstrate that the random policy benefited from the ADR mechanism. However, the ADR mechanism difference in approx-alg is only noticeable in the collision rate.
6.4.5. Analysis of Overheads Inferred by the Optimization Proposed in the Standard LoRa Protocol
The microcontroller in a LoRaWAN terminal processes sensor data and interfaces with the radio chip to transmit data over the network. The microcontroller must have enough memory for radio chip drivers, sensor drivers, and application code. Based on the recommended requirements for a microcontroller in a LoRaWAN terminal using the Semtech SX1267x radio chip, namely microcontroller 16 bit or 32 bit CPU, 16 KB RAM, and 256 KB flash memory [49], we analyze the possible overheads for end-device communication with the Approximation Algorithm application running on the LoRa Server caused by additional programming code:
- (i)
- Computation Time: The Approximation Algorithm (Algorithm 3) has a linear complexity time O(n) = , in the worst-case. Thus, since the Approximation Algorithm is expected to run in the LoRaWAN Application Layer and end-devices with a time complexity that is similar to the ADR mechanism (Algorithms 1 and 2), our optimization scheme causes no significant computation (time) overhead, neither in the end-devices nor in the LoRa Server.
- (ii)
- Storage space: The most significant part of the (optimization) algorithm runs in the LoRa Server, accounting for approximately 70 lines of code, while the extra code in the end-devices is around 60 lines. Overall, the implementation of our algorithm takes less than 20 kB of storage space (4 kB in average, 20 kB worst-case, considering different situations), which is not significant considering that most commercial off-the-shelf nodes have at least 128 kB of programming/non-volatile memory (minimum requirements for a LoRaWAN microcontroller [49]);
- (iii)
- Energy consumption: The proposed optimization scheme achieves lower Network Energy Consumption compared to other dynamic allocation policies. The way the Approximation Algorithm assigns end-devices pairs of (), ordered from lowest to highest airtime, results in an improved network scalability (maximum number of nodes) ratio for lower power consumption. Regarding the min-airtime policy, which has shorter airtime due to using the SF parameter fixed in SF7, the simulation results show that the Approximation Algorithm consumed on average three times more energy.
- (iv)
- Communications: Considering with Approximation Algorithm input an array of valid (SF, CF) pairs, end-devices only receive the (SF and CF) parameter values once (generated by the Approximation Algorithm). Our simulations show that the proposed optimization has a lower network packet send rate, as well as number of collisions, compared to the assignment policies min-airtime, equal-distribution, and random. Therefore, the proposed optimization method causes no additional communication overhead.
7. Conclusions and Future Work
We propose a simple yet efficient methodology to improve the performance of LoRaWAN networks by fine-tuning their SF and CF radio parameters, through Mixed Integer Linear Programming optimization approach. This enables the LoRaWAN network designer to choose the best network configuration. Importantly, these parameter assignment policies are backward compatible with the LoRa standard protocol, meaning that they can be implemented in commercial off-the-shelf LoRa devices.
Simulation results show that our methodology optimizes the assignment of CF and SF pairs with an average increase of 6.6% of DER in relation to the standard LoRaWAN assignment, which assigns fixed CF and SF values between the end-devices so that the packets have the minimum air time. In comparison to networks where CF and SF pairs are dynamically assigned by the gateway, there is an increase of 5%, 2.9%, and 1.9% of DER in relation to the Tiurlikova’s, egalitarian, and random distribution, respectively. Furthermore, our method leads to a number of collisions that is 13.3, 12.7, 7.8, and 7.4 times smaller than standard LoRaWAN, egalitarian, Tiurlikova’s, and random distribution, respectively. In relation to the average energy consumption, the scenario with the standard LoRaWAN assignment, whose SF value was set at 7, obtained an energy consumption 2.9 times lower than the proposed optimization. However, our optimization obtained a result similar to Tiurlikova’s method, 3.92 and 2.73 times lower energy consumption than random distribution and egalitarian, respectively.
For future work, we will extend the proposed optimization to support scenarios with longer transmission distance and a larger number of gateways, comparing and analyzing with other allocation methods.
Author Contributions
Conceptualization, E.S., N.P., M.A., and M.S.; Data curation, E.S., N.P., and M.A.; Formal analysis, E.S., N.P., M.A., and M.S.; Funding acquisition, E.S., N.P., M.A., and M.S.; Investigation, E.S., N.P., M.A., and M.S.; Methodology, E.S., N.P., M.A., and M.S.; Project administration, E.S., N.P., and M.A.; Resources, E.S., N.P., and M.A.; Software, E.S., N.P., and M.A.; Supervision, E.S., N.P., M.A., and M.S.; Validation, E.S., N.P., and M.A.; Visualization, E.S., N.P., M.A. and M.S.; Writing—original draft, E.S., N.P., and M.A.; Writing—review & editing, E.S., N.P., M.A., and M.S. All authors have read and agreed to the published version of the manuscript.
Funding
This research received no external funding.
Conflicts of Interest
The authors declare no conflict of interest.
Abbreviations
The following abbreviations are used in this manuscript:
| ADR | Adaptive Data Rate |
| BW | Bandwidth |
| CF | Carrier Frequency |
| CPU | CPU – Central Processing Unit |
| CR | Coding Rate |
| CSS | Chirp Spread Spectrum |
| DER | Data Extraction Rate |
| FEC | Forward Error Correction |
| IoT | Internet of Things |
| LoRa | Low Range |
| LoRaSim | LoRa Simulator |
| LPWAN | Low Power Wide Area Network |
| QoS | Quality of Service |
| MAC | Medium Access Control |
| MILP | Mixed Integer Linear Programming |
| PHY | Physical Layer |
| SF | Spreading Factor |
| SNR | Signal to Noise Ratio |
| TP | Transmission Power |
References
- Angrisani, L.; Arpaia, P.; Bonavolontà, F.; Conti, M.; Liccardo, A. LoRa protocol performance assessment in critical noise conditions. In Proceedings of the 2017 IEEE 3rd International Forum on Research and Technologies for Society and Industry (RTSI), Modena, Italy, 11–13 September 2017; pp. 1–5. [Google Scholar]
- Committee, L.A.T. LoRaWAN 1.1 Specification. LoRa Alliance Stand 2017, 1. Available online: https://lora-alliance.org/sites/default/files/2018-04/lorawantm_specification_-v1.1.pdf (accessed on 1 September 2019).
- Sigfox. Sigfox, the World’s Leading IoT Services Provider. Available online: https://www.sigfox.com/en (accessed on 22 September 2019).
- SIG, W. What Is Weightless—Weightless. Available online: http://www.weightless.org/about/what-is-weightless (accessed on 24 October 2019).
- WAVIoT. WAVIoT LPWAN—Low-Power LONG-Range (LPWAN) Solutions for IoT and M2M. Available online: https://waviot.com/ (accessed on 13 November 2019).
- Alliance, W.F. Wi-Fi HaLow. Available online: https://www.wi-fi.org/discover-wi-fi/wi-fi-halow (accessed on 13 September 2019).
- Insights, G.M. Global LPWAN Market Size Worth over $65 Bn by 2025. Available online: https://www.gminsights.com/pressrelease/lpwan-market (accessed on 2 November 2019).
- Egli, P.R. LPWAN Low Power Wide Area Network: Overview of Emerging Technologies for Low Power Wide Area Networks in Internet of Things and m2m Scenarios. Available online: http://indigoo.com/dox/itdp/12_MobileWireless/LPWAN.pdf (accessed on 11 October 2019).
- Industries, T.T. Building a Global Open LoRaWAN Network. Available online: https://www.thethingsnetwork.org/ (accessed on 15 September 2019).
- Sallum, E.; Pereira, N.; Alves, M.; Santos, M. LoRa_CF_SF_Assignment_Optimization. Available online: https://github.com/esallum/LoRa_CF_SF_assignment_optimization (accessed on 2 October 2019).
- Raza, U.; Kulkarni, P.; Sooriyabandara, M. Low Power Wide Area Networks: An Overview. IEEE Commu. Surv. Tutor. 2017, 19, 855–873. [Google Scholar] [CrossRef]
- Petajajarvi, J.; Mikhaylov, K.; Roivainen, A.; Hanninen, T.; Pettissalo, M. On the coverage of LPWANs: Range evaluation and channel attenuation model for LoRa technology. In Proceedings of the 2015 14th International Conference on ITS Telecommunications (ITST), Copenhagen, Denmark, 2–4 December 2015; pp. 55–59. [Google Scholar]
- Petäjäjärvi, J.; Mikhaylov, K.; Pettissalo, M.; Janhunen, J.; Iinatti, J. Performance of a low-power wide-area network based on LoRa technology: Doppler robustness, scalability, and coverage. Int. J. Distrib. Sens. Netw. 2017, 13, 1550147717699412. [Google Scholar] [CrossRef]
- Neumann, P.; Montavont, J.; Noël, T. Indoor deployment of low-power wide area networks (LPWAN): A LoRaWAN case study. In Proceedings of the 2016 IEEE 12th International Conference on Wireless and Mobile Computing, Networking and Communications (WiMob), New York, NY, USA, 17–19 October 2016; pp. 1–8. [Google Scholar]
- den Abeele, F.V.; Haxhibeqiri, J.; Moerman, I.; Hoebeke, J. Scalability Analysis of Large-Scale LoRaWAN Networks in ns-3. IEEE Internet Things J. 2017, 4, 2186–2198. [Google Scholar] [CrossRef]
- Tiurlikova, A.; Stepanov, N.; Mikhaylov, K. Method of Assigning Spreading Factor to Improve the Scalability of the LoRaWan Wide Area Network. In Proceedings of the 2018 10th International Congress on Ultra Modern Telecommunications and Control Systems and Workshops (ICUMT), Moscow, Russia, 5–9 November 2018; pp. 1–4. [Google Scholar]
- Bankov, D.; Khorov, E.; Lyakhov, A. On the Limits of LoRaWAN Channel Access. In Proceedings of the 2016 International Conference on Engineering and Telecommunication (EnT), Moscow, Russia, 29–30 November 2016; pp. 10–14. [Google Scholar]
- Mikhaylov, K.; Petaejaejaervi, J.; Haenninen, T. Analysis of Capacity and Scalability of the LoRa Low Power Wide Area Network Technology. In Proceedings of the 22th European Wireless Conference, Oulu, Finland, 18–20 May 2016; pp. 1–6. [Google Scholar]
- Vatcharatiansakul, N.; Tuwanut, P.; Pornavalai, C. Experimental performance evaluation of LoRaWAN: A case study in Bangkok. In Proceedings of the 2017 14th International Joint Conference on Computer Science and Software Engineering (JCSSE), Nakhon Si Thammarat, Thailand, 12–14 July 2017; pp. 1–4. [Google Scholar]
- Yousuf, A.M.; Rochester, E.M.; Ghaderi, M. A low-cost LoRaWAN testbed for IoT: Implementation and measurements. In Proceedings of the 2018 IEEE 4th World Forum on Internet of Things (WF-IoT), Singapore, 5–8 February 2018; pp. 361–366. [Google Scholar]
- Toussaint, J.; Rachkidy, N.E.; Guitton, A. Performance analysis of the on-the-air activation in LoRaWAN. In Proceedings of the 2016 IEEE 7th Annual Information Technology, Electronics and Mobile Communication Conference (IEMCON), Vancouver, BC, Canada, 13–15 October 2016; pp. 1–7. [Google Scholar]
- Feltrin, L.; Buratti, C.; Vinciarelli, E.; Bonis, R.D.; Verdone, R. LoRaWAN: Evaluation of Link- and System-Level Performance. IEEE Internet Things J. 2018, 5, 2249–2258. [Google Scholar] [CrossRef]
- Cattani, M.; Boano, C.; Römer, K. An experimental evaluation of the reliability of lora long-range low-power wireless communication. J. Sens. Actuator Netw. 2017, 6, 7. [Google Scholar] [CrossRef]
- Reynders, B.; Wang, Q.; Tuset-Peiro, P.; Vilajosana, X.; Pollin, S. Improving Reliability and Scalability of LoRaWANs through Lightweight Scheduling. IEEE Internet Things J. 2018, 5, 1830–1842. [Google Scholar] [CrossRef]
- Vangelista, L. Frequency Shift Chirp Modulation: The LoRa Modulation. IEEE Signal Process. Lett. 2017, 24, 1818–1821. [Google Scholar] [CrossRef]
- Lim, J.T.; Han, Y. Spreading Factor Allocation for Massive Connectivity in LoRa Systems. IEEE Commun. Lett. 2018, 22, 800–803. [Google Scholar] [CrossRef]
- Noreen, U.; Bounceur, A.; Clavier, L. A study of LoRa low power and wide area network technology. In Proceedings of the 2017 International Conference on Advanced Technologies for Signal and Image Processing (ATSIP), Fez, Morocco, 22–24 May 2017; pp. 1–6. [Google Scholar]
- Industries, T.T. Duty Cycle for LoRaWAN Devices. Available online: https://www.thethingsnetwork.org/docs/lorawan/duty-cycle.html (accessed on 4 November 2019).
- Bor, M.C.; Roedig, U.; Voigt, T.; Alonso, J.M. Do LoRa Low-Power Wide-Area Networks Scale? In Proceedings of the 19th ACM International Conference on Modeling, Analysis and Simulation of Wireless and Mobile Systems, Floriana, Malta, 13–17 November 2016; ACM: New York, NY, USA, 2016; pp. 59–67. [Google Scholar]
- Navarro-Ortiz, J.; Sendra, S.; Ameigeiras, P.; Lopez-Soler, J.M. Integration of LoRaWAN and 4G/5G for the Industrial Internet of Things. IEEE Commun. Mag. 2018, 56, 60–67. [Google Scholar] [CrossRef]
- Industries, T.T. LoRaWAN Adaptive Data Rate. Available online: https://www.thethingsnetwork.org/docs/applications/mqtt/api.html#uplink-messages (accessed on 16 September 2019).
- Semtech. LoRaWAN—Simple Rate Adaptation Recommended Algorithm. Available online: https://www.thethingsnetwork.org/forum/uploads/default/original/2X/7/7480e044aa93a54a910dab8ef0adfb5f515d14a1.pdf (accessed on 9 October 2019).
- Slabicki, M.; Premsankar, G.; Di Francesco, M. Adaptive configuration of lora networks for dense iot deployments. In Proceedings of the NOMS 2018-2018 IEEE/IFIP Network Operations and Management Symposium, Taipei, Taiwan, 23–27 April 2018; pp. 1–9. [Google Scholar]
- Gounaris, C.E.; Rajendran, K.; Kevrekidis, I.G.; Floudas, C.A. Designing networks: A mixed-integer linear optimization approach. Networks 2016, 68, 283–301. [Google Scholar] [CrossRef]
- Samsatli, S.; Samsatli, N.J. A multi-objective MILP model for the design and operation of future integrated multi-vector energy networks capturing detailed spatio-temporal dependencies. Applied Energy 2018, 220, 893–920. [Google Scholar] [CrossRef]
- Earl, M.G.; D’Andrea, R. Iterative MILP methods for vehicle-control problems. IEEE Trans. Robot. 2005, 21, 1158–1167. [Google Scholar] [CrossRef]
- Méndez, C.; Henning, G.; Cerdá, J. An MILP continuous-time approach to short-term scheduling of resource-constrained multistage flowshop batch facilities. Comput. Chem. Eng. 2001, 25, 701–711. [Google Scholar] [CrossRef]
- Borghetti, A.; D’Ambrosio, C.; Lodi, A.; Martello, S. An MILP Approach for Short-Term Hydro Scheduling and Unit Commitment With Head-Dependent Reservoir. IEEE Trans. Power Syst. 2008, 23, 1115–1124. [Google Scholar] [CrossRef]
- Richards, A.; How, J.P. Aircraft trajectory planning with collision avoidance using mixed integer linear programming. In Proceedings of the 2002 American Control Conference (IEEE Cat. No.CH37301), Anchorage, AK, USA, 8–10 May 2002; pp. 1936–1941. [Google Scholar]
- Zhu, Q.; Yang, Y.; Natale, M.; Scholte, E.; Sangiovanni-Vincentelli, A. Optimizing the Software Architecture for Extensibility in Hard Real-Time Distributed Systems. IEEE Trans. Ind. Inform. 2010, 6, 621–636. [Google Scholar] [CrossRef]
- Zheng, W.; di Natale, M.; Pinello, C.; Giusto, P.; Vincentelli, A.S. Synthesis of Task and Message Activation Models in Real-Time Distributed Automotive Systems. In Proceedings of the 2007 Design, Automation Test in Europe Conference Exhibition, Nice, France, 16–20 April 2007; pp. 1–6. [Google Scholar]
- IBM. CPLEX Optimizer. Available online: https://www.ibm.com/analytics/cplex-optimizer (accessed on 30 November 2019).
- Lima, R.M.; Grossmann, I.E. Computational advances in solving mixed integer linear programming problems. Chem. Eng. Greetings Prof. Sauro Pierucci AIDAC 2011, 151, 160. Available online: https://kilthub.cmu.edu/articles/Computational_advances_in_solving_Mixed_Integer_Linear_Programming_problems/6466835/files/11895284.pdf (accessed on 23 October 2019).
- Server, L. The LoRa Server Project. Available online: https://www.loraserver.io/overview/ (accessed on 7 September 2019).
- Industries, T.T. API Reference. Available online: https://www.thethingsnetwork.org/docs/applications/mqtt/api.html#uplink-messages (accessed on 5 November 2019).
- Alliance, L. LoRa Server. Available online: https://github.com/brocaar/loraserver (accessed on 9 October 2019).
- Semtech. SX1301 Datasheet. Available online: https://www.semtech.com/uploads/documents/sx1301.pdf (accessed on 2 September 2019).
- Voigt, T.; Bor, M.; Roedig, U.; Alonso, J. Mitigating Inter-network Interference in LoRa Networks. In Proceedings of the 2017 International Conference on Embedded Wireless Systems and Networks, Uppsala, Sweden, 20–22 February 2017; pp. 323–328. [Google Scholar]
- Semtech. MCU Requirements for LoRaWAN. Available online: https://www.semtech.com/uploads/documents/AN1200.28_MCU_Requirements_for_LoRaWAN_V3.pdf (accessed on 22 September 2017).
© 2020 by the authors. Licensee MDPI, Basel, Switzerland. This article is an open access article distributed under the terms and conditions of the Creative Commons Attribution (CC BY) license (http://creativecommons.org/licenses/by/4.0/).