Article

Annual, Seasonal, and Monthly Rainfall Trend Analysis through Non-Parametric Tests in the Sebou River Basin (SRB), Northern Morocco

1
Department of Geography, Laboratoire Territoire Patrimoine et Histoire, FLSH Dhar El-Mehraz, Sidi Mohamed Ben Abdellah University, Fez 30050, Morocco
2
Department of Civil Engineering, The City College of New York, New York, NY 10031, USA
3
Department of Earth and Environmental Sciences, The City University of New York Graduate Center, New York, NY 10016, USA
*
Author to whom correspondence should be addressed.
Climate 2022, 10(11), 170; https://doi.org/10.3390/cli10110170
Submission received: 13 October 2022 / Revised: 1 November 2022 / Accepted: 3 November 2022 / Published: 5 November 2022
(This article belongs to the Special Issue Drought Early Warning)

Abstract

:
This paper explores the temporal and spatial patterns of annual, seasonal, and monthly rainfall series during the period of 1961–2018 at 15 stations in the agriculturally important Sebou river basin, northern Morocco. Trends were investigated using the classical non-parametric Mann–Kendall test and the Theil–Sen approach at 90%, 95% and 99% confidence levels. A general decreasing trend was found at the annual scale, significant at the 95% confidence level at 8 stations out of 15 (53%). A particularly large decreasing trend between −30 mm and −50 mm per decade was found in the north and eastern parts of the basin. Autumn rainfall tended to increase, but this was not statistically significant. During the winter months, rainfall tended to decrease sharply (−27 mm and −40 mm per decade) in the northern slopes of the Rif mountains, while in spring, the mountainous area of the basin recorded decreases ranging between −12 mm and −16 mm per decade. During winter and spring, negative trends were significant at ten stations (66%). Summer rainfall tends toward a decrease, but the absolute change is small. These results help to understand the rainfall variability in the Sebou river basin and allow for improved mitigation strategies and water resource plans based on a prospective view of the impact of climate change on the river basin.

1. Introduction

Morocco is considered a very vulnerable country to climate change [1]. Since the end of the 1970s and the beginning of the 1980s, the country has suffered from severe drought [2,3]. Although interspersed with some wet years [4], the impact of drying seems very clear. During drought years, such as 2021–2022, the scale of disaster becomes particularly worrisome. The decrease in rainfall and the increase in high temperatures have caused great pressure on the already scarce water resources, exacerbated by the excessive exploitation of these resources, especially underground waters, as shown by [5].
Rainfall remains the most important source of water in most ecosystems worldwide. It is not possible to imagine another source that can compensate for it. The high variability in the amounts of precipitation from year to year, as well as during each year, is one of the main characteristics of the Mediterranean climate domain, especially in North Africa [6,7]. Many studies expect a sharp drop in the amount of precipitation in the Mediterranean along with a major increase in temperatures [8,9,10,11,12,13], which means more droughts and more challenges for rain-fed agriculture and water supply management. This trend poses major problems for the agricultural sector and the drinking water supply in the expanding cities as droughts and floods become more frequent [14,15,16].
A better understanding of the trends in hydrometeorological variables is very useful for water supply management and agriculture mitigation in the context of climate change [17]. Here, the importance of studying the trends of rainfall emerges, which poses many problems related to the nature of the data [18,19,20]. Several approaches have been proposed by researchers for analyzing trends in hydrometeorological time series, among which linear regression analysis, Spearman’s rho, the Mann–Kendall (MK) test, and the Theil–Sen method are all common [21,22]. Close to our territory, in southern Spain, an investigation by [23] using the MK test showed that annual rainfall had decreased, with values ranging from 0 to 15%. In Italy, in a study carried out by [17] using the MK test, the trend seems mainly negative, both at the annual and seasonal scales. In Algeria, [24] used the MK test and Sen’s slope estimator to investigate fluctuations and trends of meteorological droughts and showed that six out of sixteen stations had significantly decreasing precipitation trends. The improved MK test or modified Mann–Kendall test used by [25] to discriminate the multi-scale variability of a unidirectional trend was proven to be more advantageous than other trend-detection methods for the rainfall time series [26]. For Saudi Arabia [27], four trend tests were compared, including MK, the modified Mann–Kendall (MMK), the trend-free pre-whitening Mann–Kendall (TFPW MK) test, and the innovative trend analysis (ITA) proposed by [28]. It was argued that the MMK test was the best-performing technique among the MK test family, while ITA appeared to be the best trend-detection technique among the four techniques. Similar conclusions are also presented in [29]. However, checks conducted by [30] showed that the ITA method is also as affected by sample size, distribution shape, and serial correlation as any parametric technique designed for trend analysis. Previous studies on Moroccan rainfall trends used the classical non-parametric Mann–Kendall test, the modified Mann–Kendall tests, and Sen’s slope estimator. In the Oum Er-Rbia (OER) River basin, the investigation by [31] showed a clear trend towards drier conditions with an abundance of deficit seasons noted, especially after 1980–1981. In the Fez-Meknes region situated mostly within the Sebou river basin, the investigation by [32] showed negative trends in the mountainous area. Country-wide indices calculated by [33] showed a negative trend in rainfall indices and an upward trend in temperature indices. Generally, none of these studies were specific to the Sebou basin, despite its key importance to national water resources (as explained below). In this paper, we decided to use just the standard nonparametric Mann–Kendall test and the closely related Sen’s slope estimator. The other techniques will be considered in future papers.
The purpose of this paper is to present the trend analysis of annual, seasonal, and monthly rainfall at 15 stations in the Sebou River Basin in Northern Morocco. We mapped the amount of change in rainfall and its patterns across the basin, then we compared our results with previous studies.

2. Study Area and Data

2.1. Study Area

The Sebou River Basin (SRB) lies between 33° N and 35° N latitude and 4° W and 7° W longitude (Figure 1). It is the most important watershed for the national economy with 30% of the national water resources and 40% of the national capacity of storage and dams (10 big dams and 44 small dams). The Sebou River Basin extends over an area of 40,000 square kilometers, with a population estimated at 6.2 million mainly engaged in agriculture spread over 17 provinces and districts, including 74 urban centers and 288 rural territorial communes [34].
The SRB has large agricultural assets, as it comprises 1.8 million hectares of agricultural land, 357,000 ha of which are irrigated land, with 92% of SRB water resources going to agricultural irrigation uses. Forests cover more than 1.8 million hectares. These great assets allow the Sebou river basin to be the largest producer of olive oil (60% of national production), sugar (50%), and leather (60%), as well as an important share of cereals and fruits. In short, the SRB is the most important agricultural region in Morocco. Despite extensive irrigation works, most agricultural activities in the SRB are rain-fed, which makes this sector very fragile to rainfall variability and climate change effects.

2.2. Data: Selection of Rainfall Series, Quality Control, and Homogenization

The 15 rain gauge stations used in this work come from a dataset of 83 monthly rainfall series, stretching from September 1961 to August 2019. We chose these 15 as they are well distributed across the SRB and represent the main zones and local specificities of the watershed area, while possessing good temporal coverage and data quality. The data were checked and quality controlled through an algorithm specifically designed for climatic data homogenization using Climatol package in the R environment (for more details, see [32]). The main provider of these data is the Sebou Hydraulic Basin Agency (ABHS, https://www.abhsebou.ma (accessed on 13 July 2022), which is the administrative authority that controls, manages, and collects data ono everything related to water in this basin. Table 1 presents the main characteristics and geographical location of the rain gauge stations with their descriptive statistics.
In this paper, we used hydrological year data from September to August and we defined seasons as autumn (September–October–November), winter (December–January–February), spring (March–April–May), and summer (June–July–August). Generally, the rainfall in SRB occurs mostly in the wet season, starting in October and ending in May, while the dry season occurs during the months of June to September. Shallow lows and thalwegs from the North Atlantic Ocean constitute the key synoptic weather system that brings rainfall and wet conditions to Morocco, and clear correlations are found between winter and spring rainfall and NAO’s negative phases [2,35]. Western Mediterranean oscillations also affect the northern coast of the country, including the SRB, especially the north and northeast parts.

3. Methodology

To check the rainfall trend in the era of climate change, we employed the widely recognized non-parametric Mann–Kendall test and the Theil–Sen Slope Estimator.
The Mann–Kendall test is one of the most common non-parametric tests used by researchers around the globe to characterize trends and their significance within hydrometeorological time series, as proposed by [36,37]. Compared to the least-squares linear regression approach, it is robust to outliers and extreme values.
The Mann–Kendall test statistic S is given by the following equation as presented by [24]:
S = k = 1 n 1 j = k + 1 n sgn ( x j x k )
where n is the number of data. X represents the data values at times j and k (j > k) and the sign function is
sgn ( x j x k ) = sgn ( R j R i ) = { + 1 ,   if   ( x j x k ) > 0 0 ,   if   ( x j x k ) = 0 1 ,   if   ( x j x k ) < 0
The variance of S is given as
V a r ( S ) = [ n ( n 1 ) ( 2 n + 5 ) ] i = 1 m t i ( t i 1 ) ( 2 t i + 5 ) 18
where ti is the number of ties of extent i and m is the number of tied rank groups. For n larger than 10, a Z test statistic that, under the null hypothesis of no correlation, approximates a standard normal distribution is computed as the Mann–Kendall test statistic as follows:
Z = { S 1 V a r ( S ) ,   if   S > 0 0 ,   if   S = 0 S 1 V a r ( S ) ,   if   S < 0
We consider 95% and 99% confidence levels using this normal approximation.
If a linear trend is present in a time series, then the true slope (change per unit time) can be estimated by using the simple non-parametric procedure developed by [38]. The slope estimates of the n(n − 1)/2 unique pairs of data are first computed by:
Q ( i , j ) = X j X i j i   f o r   i , j = 1 , 2 , , n
where xj and xi are data values at times j and i (j > i), respectively. The median of these N = n(n − 1)/2 values of Q is Sen’s estimator of the slope. After sorting the Q values, if N is even, then Sen’s estimator is calculated by:
Q m e d = 1 2 ( Q N 2 + Q N + 2 2 )
If N is odd, then Sen’s estimator is computed by:
Q m e d = ( Q N + 1 2 )
Sen’s estimator Qmed provides the rate of change and enables the determination of the total change in any variable during the analysis period. Sen’s slopes over the 58-year (1961/62–2018/19) study period are expressed here in mm/10 years.
Then, Sen’s slope values were interpolated using the spline technique, which is a deterministic interpolation method developed by [39]. It estimates values using a mathematical function that minimizes the overall surface curvature, resulting in a smooth surface that passes exactly through the input points [40,41]. There are two spline types: Regularized and tension. The first type creates a smooth, gradually changing surface with values that may lie outside the sample data range. The second type controls the stiffness of the surface according to the characteristics of the modelled phenomenon. In this case, the regularized spline is used, as implemented in ArcGIS 10.3 software (ESRI). We chose the regularized method because it consistently produced lower errors than the tension method for similar applications, as revealed by [42,43,44]. Figure 2 presents the main steps of the methods used in this paper.

4. Results

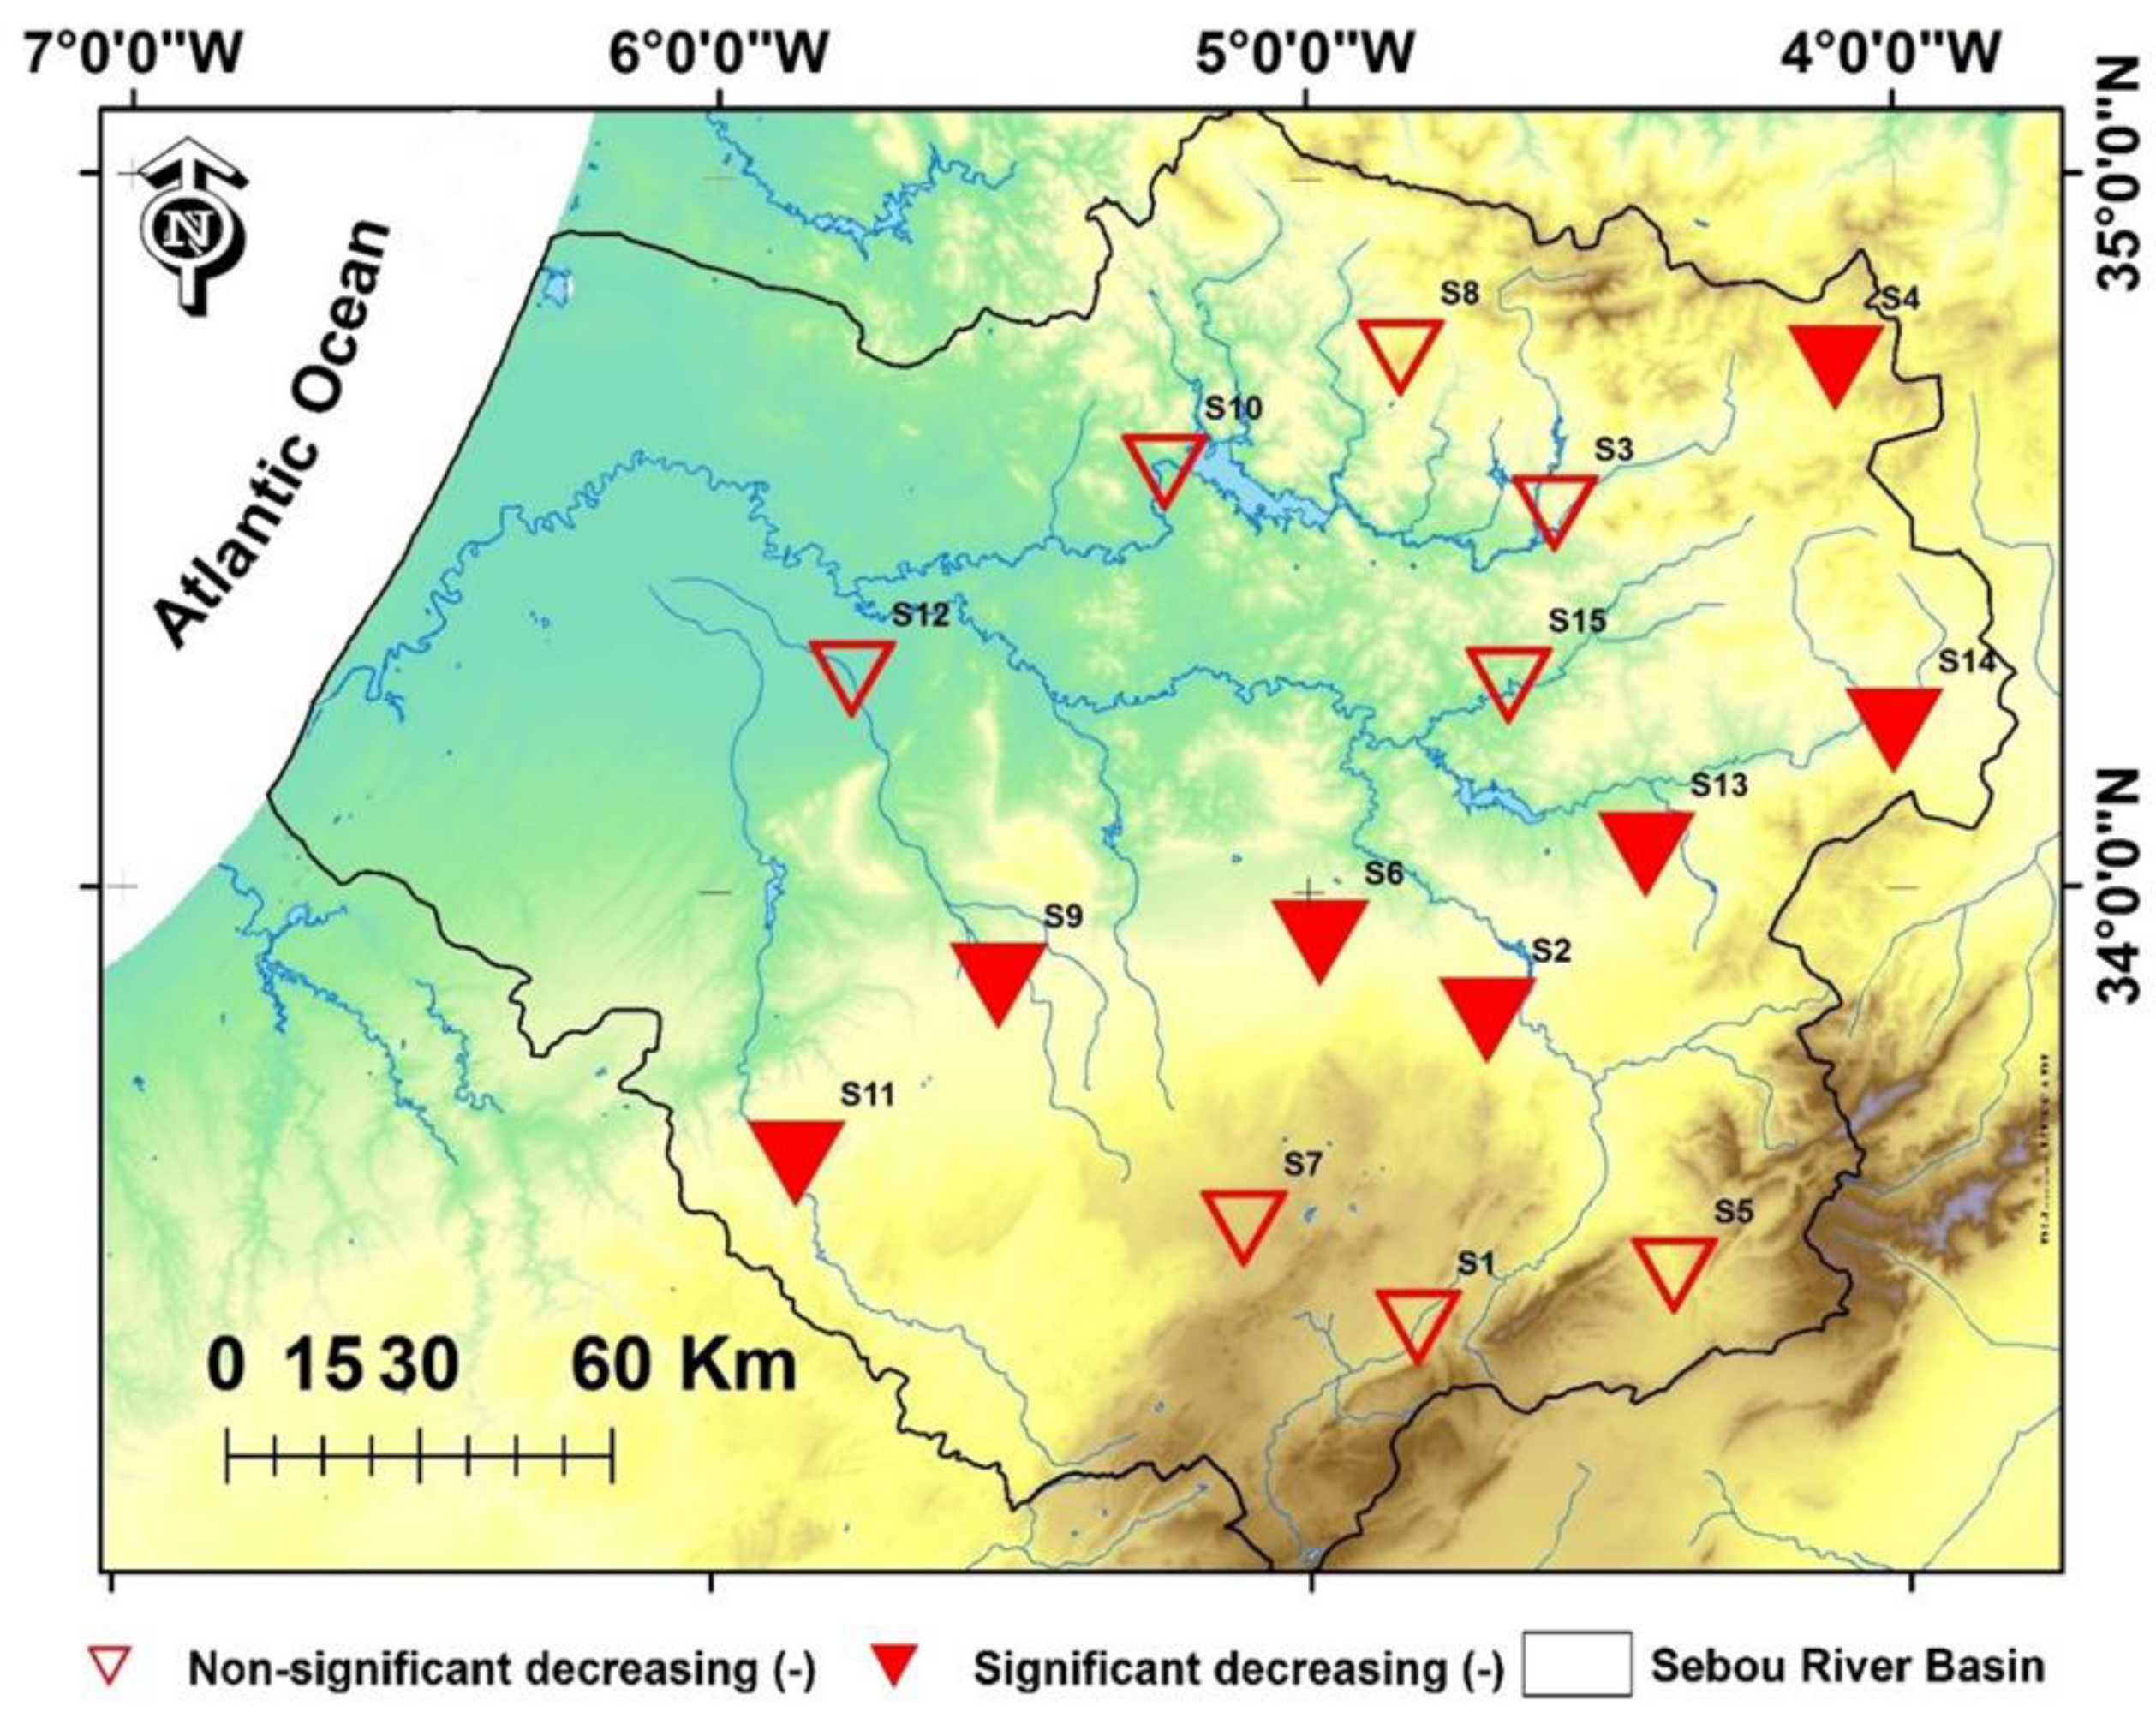
4.1. Annual Rainfall Trend

The results of the trend analysis for annual totals are presented in Table 2. All stations show negative trends, and 7 out of 15 (46%) are significant at the 95% CL. Sen slope values ranged from −9.7 mm/10 year to −58.0 mm/10 year. Specifically, the stations located in the northeastern parts of the basin (Boured, Meknes, Fez. Taza, and Tahla) recorded strong drops in the annual rainfall totals, between −25 mm/10 years and −44 mm/10 years (Figure 3). Lower slopes are observed in the Middle Atlas region with values of −9.7 mm/10 years at Ait Khabbach and −13.9 mm/10 years, −31.1 mm/10 years in Elmers and Ifrane stations, respectively. Similar slope magnitudes are noted in the lowlands of the Gharb plain in the western parts of the basin, whereas the Mann–Kendall Z values range between −1 and −2.5, validating the Theil–Sen negative slope estimates.
Significant trends are recorded along the line between Meknes (S11), Taza (S14), and Boured (S4), which are all stations located at medium altitudes, while the trend was not significant in the northern or southern areas of the basin (Figure 4).

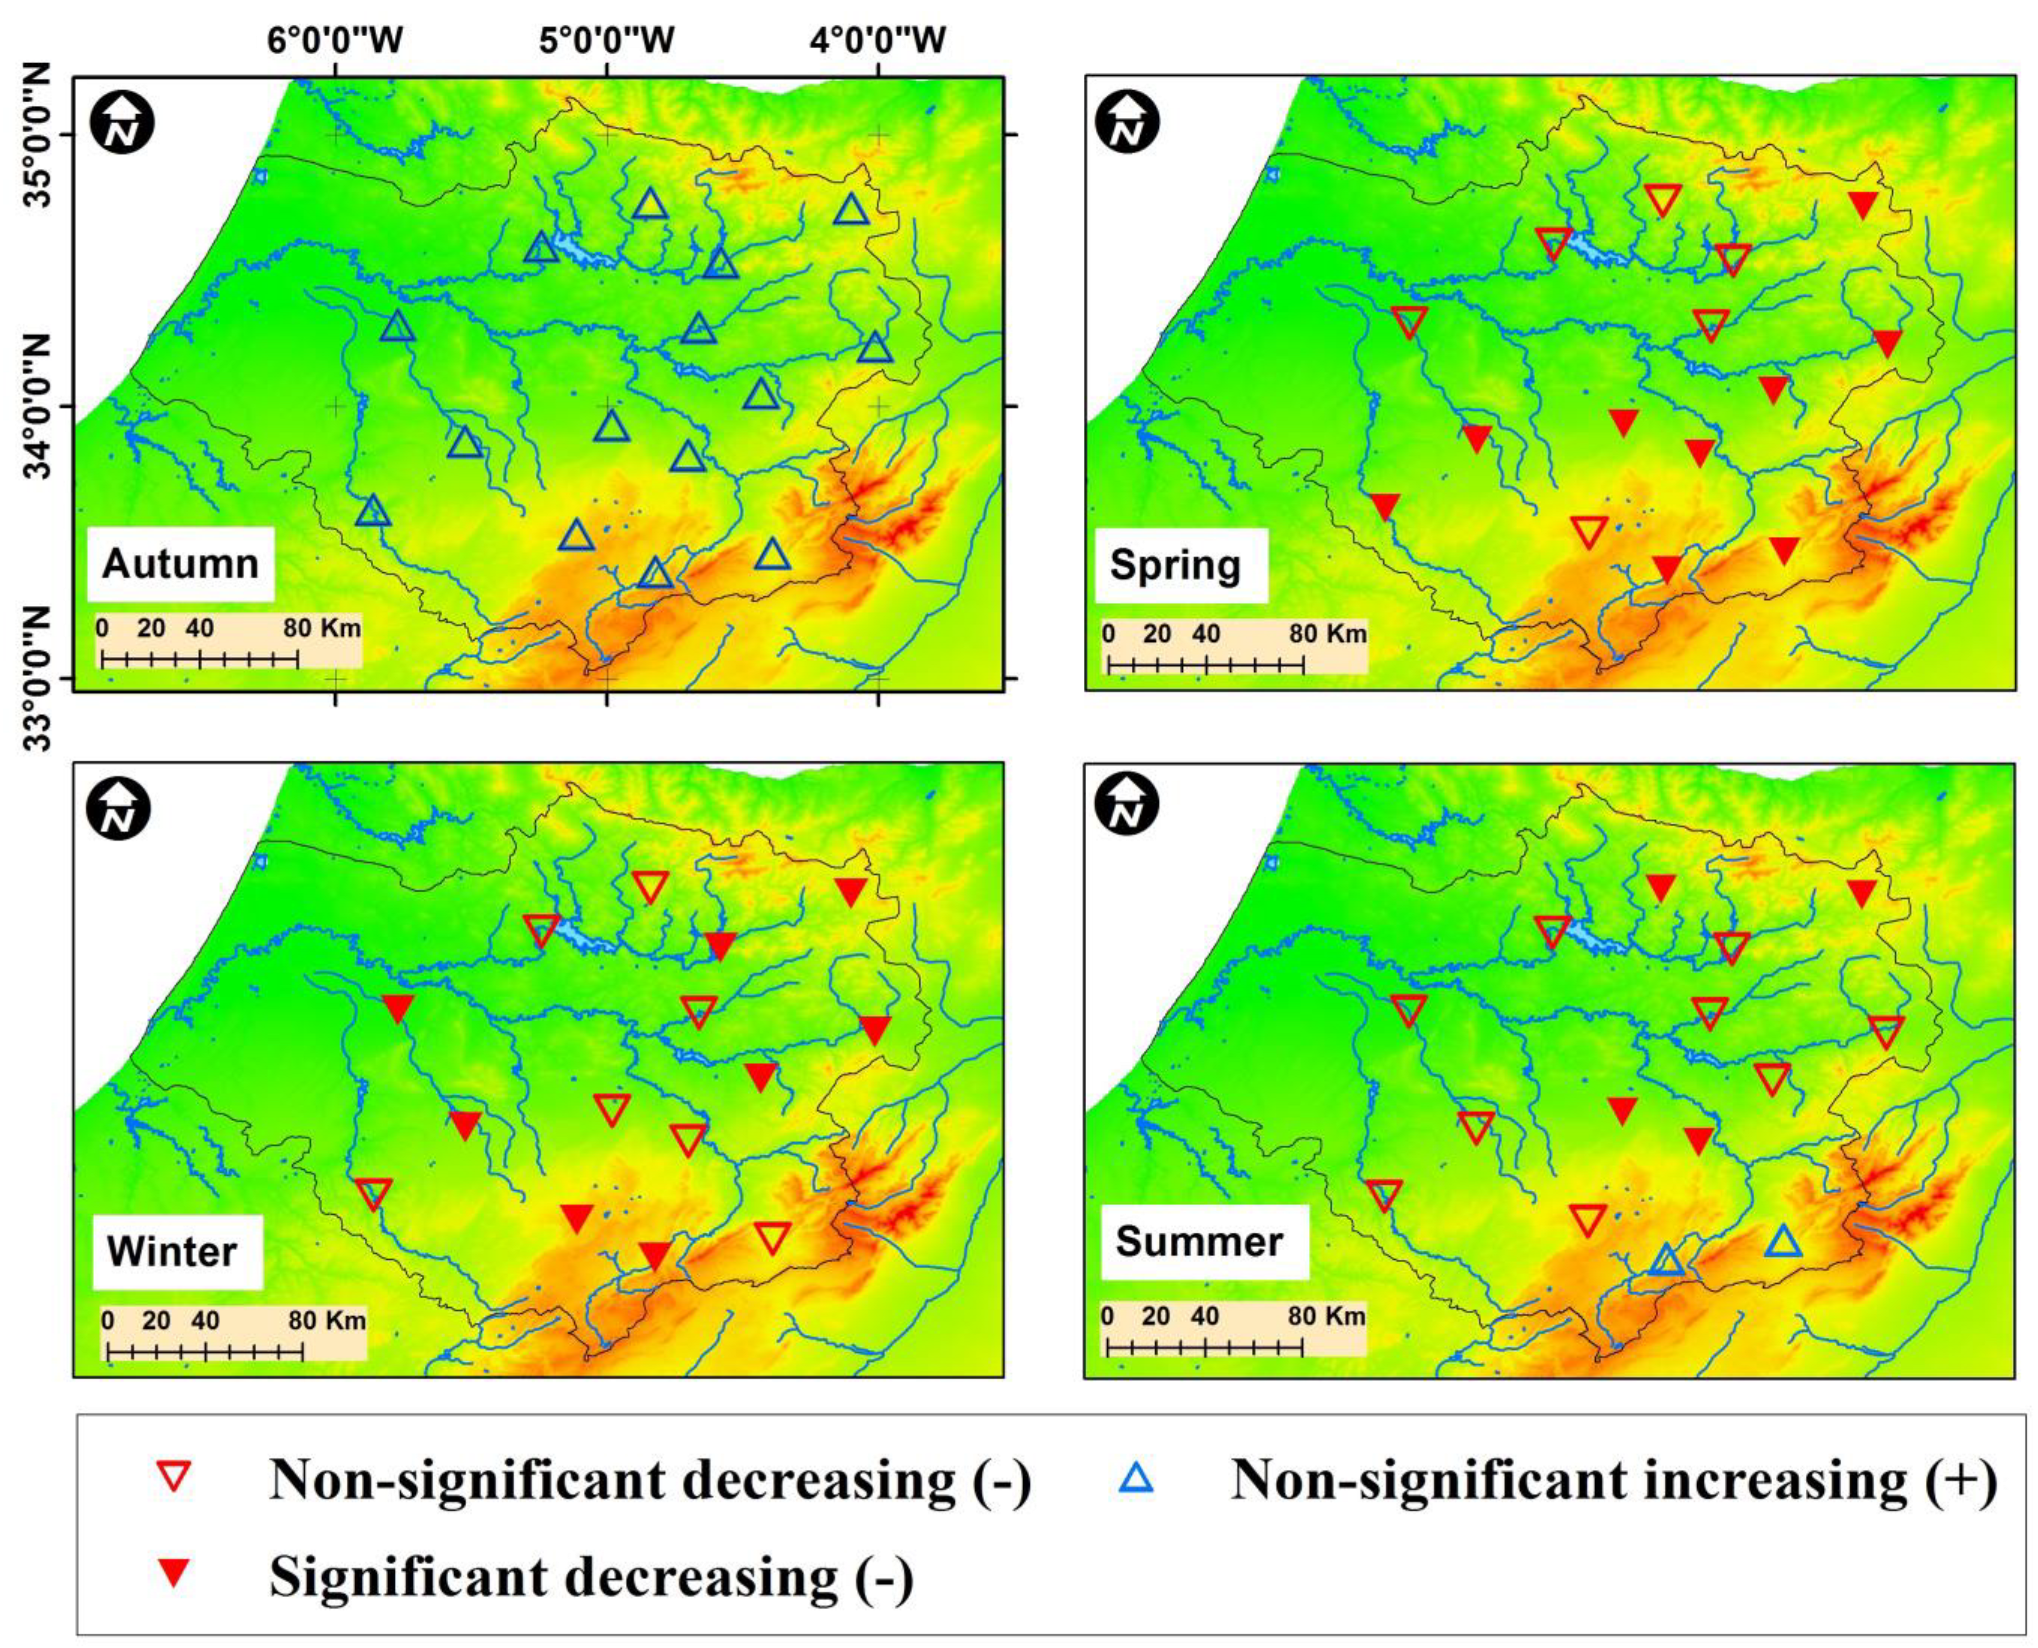
4.2. Seasonal Rainfall Trends

4.2.1. Slight Increase in Autumnal Rainfall

Autumn rainfall displays a general trend toward an increase in precipitation except for Taza station. However, this increasing trend does not reach 95% significance at any of the stations. The Theil–Sen slope values range between −0.71 mm/10 y at Taza and 7.54 mm/10 y at the Jbel oudka station, and, on average, the autumnal rainfall increased by +3.5 mm per decade. Generally, according to Figure 5, we can note that the highest increases in autumnal rainfall occur in the northwestern part of the basin, while the southern belt (Middle Atlas to Taza) recorded a slight decrease.

4.2.2. Winter Rainfall Has Sharp Decreasing Trend

Winter is the wettest season in the study area, and its rainfall is crucial for agricultural activities and water-resource renewal and management. The MK test and TSA show a declining trend in the winter rainfall in all stations, with eleven stations (73%) having significant decreases at the 90%, 95% and 99% confidence levels. The TSA finds an average decrease of approximately −19 mm per decade. The geographic pattern shows three main groups. Low reductions in winter rainfall of less than 11 mm per decade are observed in the eastern and southern edges of the Middle Atlas. A medium reduction in winter rainfall between −10 mm/10 y and −18 mm/10 y is recorded at Fez, Mjaara, Ouljet Essoultan, Souk el Had Rdom, Tahla, and Tissa stations (Figure 5). The maximum reduction is observed at Jbel Oudka station with a value of −47.5 mm/10 y.

4.2.3. Spring Rainfall Decline

Spring rainfall shows a downward trend at almost all stations, and significant decreases were recorded at 9 stations, which represent 60% of the 15 used (Figure 6). In those nine stations, the Theil–Sen Slope values for spring rainfall ranged between −11 and −16 mm/10 y, for a reduction of 64 mm to 93 mm in this season during the study period, a quantity that is very important in the Mediterranean climate context characterized by low rainfall totals. The largest decreases occurred in mountainous areas, considered Morocco’s water reservoir. The significant decrease in winter and spring rainfall affects the main agricultural crops (such as cereals and legumes), but also vegetables and fruit trees, and threatens the availability of water in river basins in a way that raises the concerns of a large number of parties, including the general population.

4.2.4. Summer Rainfall Trend

Summer rainfall represents less than 5% of the annual totals in the study area. However, in stations located in mountain areas and the southern edges of the basin, this share increases to 17% at the Ait Khabbach station. This being the dry season does not mean that there is no trend within its low rainfall. Non-significant upward trends were revealed at Ait Khabbach and Elmers stations, while downward trends were recorded at almost all other stations (Table 2). The MK test is significant at 4 out of 15 stations (27%) (Figure 5).

4.3. Monthly Rainfall Trend

Monthly rainfall was also examined using the Mann–Kendall test and Sen’s slope (Table 3 and Figure 6). There was a significant increase in September rainfall at Boured and Elmers stations. Increasing rainfall in the two months of September and October tended to explain most of the increase in autumn precipitation. November marks the beginning of the downward trend in rainfall of the wet season, which continues into the winter and spring months.
The amount of this increase remains very low during the month of September and reaches values of a few millimeters in October, approximately +1 mm per decade at Ifrane, and +5.6 mm and +9.4 mm at Bab Ounder and Jbel Oudka, respectively. This increase turns into a decline in the month of November. December reveals a negative trend in the 15 stations studied in this work, significant at the 95% level at one station (Souk el Had Rdom). A drop of −2.7 mm to −5 mm per decade is observed in Ait Khabbach, Azzaba, Boured, Mjaara, and Tissa, and between −6.8 mm and −13 mm per decade in the stations of Bab Ounder, Ifrane, Jbel Oudka, Meknes, and Souk el Had Rdom.
The month of January records both downward and upward trends at different stations, where the main increases are recorded in Azzaba, Jbel Oudka, Mjaara, and Ouljet Essoultan. In February, all the stations show a very sharp drop in rainfall ranging from −3 mm to −5 mm per decade at the stations of Ait Khabbach, Azzaba, Boured, Mjaara, Taza, and Tissa.
The decline in the precipitation of March is general to almost all stations and significant at the 95% CL at the Azzaba, Elmers and Fez stations. This reduction in precipitation is −4 mm per decade on average, while −5.2 mm per decade is recorded in Azzaba, Fez, Elmers, and Jbel Oudka and the most significant fall is −7 mm at the station of Meknes. The month of April also presents a general negative trend at all stations, significant at the 95% level at Boured and Elmers stations. The average volume of this decrease in rainfall is 3.5 mm per decade, while −5 mm was recorded at Elmers, Fez, and Ifrane stations and the maximum is −7.2 mm per decade at the Boured station (Figure 7).
May is a transition month from the wet season to the dry season. This month also recorded a small general decrease in its rainfall with an average of −2 mm per decade. Although the rainfall for the month of June is very small, it shows a significant decline of −2 mm per decade, on average, in most of the stations, of which 13 out of 15 (87%) recorded a significant decrease at 95% CL, and a similar observation is noted for July. August is the driest month with very scarce amounts of rainfall, so no trend was recorded at 12 out of the 15 stations, while there was an upward trend in the stations located in the mountains between +2 mm and +2.7 mm per decade at Ait Khabbach, Elmers, and Ifrane stations. This represents rain during sporadic summer storms at high altitudes. Overall, therefore, monthly precipitation shows a non-significant increase during the autumn months, while it decreases sharply in the other seasons, especially in the winter and spring months.

5. Discussion

A monthly rainfall time series stretching from 1961–2018 at 15 stations in the Sebou River Basin, northern Morocco, was used in this work. The non-parametric trend detection methods MK and Sen’s slope revealed a general downward trend at the annual scale in agreement with the findings of [2,45,46]. This decline in annual rainfall means more drought [33], fitting with the general consequence of global warming that dry regions become drier and drier [15]. This fact harshly affects rainfed and irrigated agriculture and the water supply for millions of people across Morocco. For example, the severe drought during 2021–2022 decreased wheat and cereal production by 67%, and it is noteworthy that as of 18 July 2022, the national average of the filling rate of the main dams in Morocco was only 29.2% according to the official ministry [47].
A limitation of this paper is the number of stations used to quantify precipitation trends over the basin. These stations are distributed to represent all the physiographic zones of the basin except the western coasts. In particular, the central mountainous area whose precipitation is a particularly important source of water for the basin is covered by stations. Our results are also consistent with those of many other studies on Moroccan rainfall and trends in adjoining areas of North Africa and southern Spain (Table 4).
The decreasing rainfall in wet seasons (winter and spring) is related to the predominance of eastward, northeastward, and anticyclonic weather types that dominate even in the wet months from November to March according to [35]. The large-scale atmospheric circulation patterns are a factor in this trend, in particular the North Atlantic Oscillation (NAO) patterns that have an immediate effect on Moroccan rainfall [50]. The positive phase of the NAO results in the predominance of the Azores high pressure above Morocco, which results in persistent drought and rainfall shortages. By contrast, the negative phase of the NAO promotes a meridional circulation and north-south flow, which allows the arrival of low-pressure systems from the North Atlantic towards Morocco with a greater chance of rainy weather in the northwest of the country [2]. Recent years are characterized by positive NAO.
At the seasonal level, we noted a slight increase in autumnal rainfall, which is not significant at the 95% confidence level at any station. Against this, there is a general downward trend in winter, spring, and summer that is significant at the 95% confidence level at many stations. The summer rainfall declining trend was confirmed by [48] in the Mediterranean domain. The increasing trend in autumn rainfall was also reported in western Algeria by [49,51]. This trend specifically concerned high rainfall intensities, which indicates an increasing concentration of rainfall over time [52], which can have a detrimental impact on soil erosion [53,54], especially after a dry and hot summer. Bare soils are the main characteristics of land cover in the Sebou basin, while forests and shrubs cover only 30% of the watershed [34]. More erosion means more siltation in dam reservoirs of −70 million cubic meters per year and economic losses for Moroccan agriculture [55,56]. Cities and other human facilities are also threatened by floods and torrential rainfall; we can note the example of Taza, Fez, and Tahla as cities that have been affected by flash floods related to heavy concentrated rainfall [57,58,59].
Due to its water and agricultural assets, the Sebou river basin is one of the most important watersheds in Morocco. The decreasing rainfall in the wet season, especially in winter and spring combined with irrational and speculative cash-crop cultivation (watermelon, avocado, etc.) with heavy irrigation poses a great threat to the already-scarce water resources in an environment suffering from water stress, and rain-fed agriculture will become more fragile if this trend continues in the future, in agreement with the conclusions of [1]. Watershed adaptation strategies should pay more consideration to the resources of mountainous areas, as we recorded a significant decrease in rainfall of mountainous regions, which constitute a water reservoir for the whole country, in agreement with the findings of [13].

6. Conclusions

To assess the trend of annual and seasonal rainfall in the Sebou watershed, which is in the Mediterranean climate area in northern Morocco, we analyzed 15 well-distributed monthly rainfall series across this basin. The nonparametric Mann–Kendall test and Sen’s slope estimator were used. The main findings of this paper were as follows:
  • A pronounced negative trend was observed for annual rainfall in almost all stations in the series, mainly concentrated in the areas between Taza and Jabal Oudka. Sen’s slope ranged between −9.7 mm and −58 mm per decade.
  • At the seasonal scale, we noted a slight increasing trend in autumn rainfall and a downward trend in summer rainfall, but most prominently, a decreasing trend in winter and spring rainfall ranging from −7 mm and −47 mm/10 years in winter months and −12 mm/10 years on average in spring.
  • Most of the winter decrease occurred in December and February, while spring rainfall decreased, especially in March and April.
The findings of this paper are important, because the negative trend revealed represents more frequent and severe drought in an area that is already under water stress, and this will threaten the water supply to cities and irrigated agriculture in the richest agricultural watershed of Morocco. Rain-fed agriculture, which is the main activity in the Sebou river basin, will become impossible if this trend continues in the future. This requires urgent actions and mitigation strategies to limit climate change and its impacts on the water and agricultural sectors and rationalize the use of water resources in cities and rural areas.

Author Contributions

Conceptualization, R.K.; methodology, R.K. and M.H.; software, R.K. and J.E.K.; formal analysis, R.K.; validation: R.K., M.H. and N.Y.K.; investigation, R.K.; data curation, R.K. and I.A.; writing—original draft preparation, R.K. and N.Y.K.; writing—review and editing, R.K., N.Y.K. and M.H.; visualization, B.E.K.; supervision, N.Y.K., M.H. and B.E.K. All authors have read and agreed to the published version of the manuscript.

Funding

This research received no external funding.

Institutional Review Board Statement

Not applicable.

Informed Consent Statement

Not applicable.

Data Availability Statement

The data presented in this study are available on request from the corresponding authors.

Acknowledgments

We would like to thank the ABHS staffs for providing data.

Conflicts of Interest

The authors declare no conflict of interest.

References

  1. Schilling, J.; Freier, K.P.; Hertig, E.; Scheffran, J. Climate change, vulnerability and adaptation in North Africa with focus on Morocco. Agric. Ecosyst. Environ. 2012, 156, 12–26. [Google Scholar] [CrossRef]
  2. Knippertz, P.; Christoph, M.; Speth, P. Long-term precipitation variability in Morocco and the link to the large-scale circulation in recent and future climates. Meteorol. Atmos. Phys. 2003, 83, 67–88. [Google Scholar] [CrossRef]
  3. Stour, L.; Agoumi, A. Sécheresse climatique au Maroc durant les dernières décennies. Hydroécol. Appl. 2008, 16, 215–232. [Google Scholar] [CrossRef] [Green Version]
  4. Ouatiki, H.; Boudhar, A.; Leblanc, M.; Fakir, Y.; Chehbouni, A. When climate variability partly compensates for groundwater depletion: An analysis of the GRACE signal in Morocco. J. Hydrol. Reg. Stud. 2022, 42, 101177. [Google Scholar] [CrossRef]
  5. Fofack, R. The social and political impact of the privatization of groundwater: Conflict and cooperation around the aquifer of Sais, Morocco. Water Soc. III 2015, 200, 11143. [Google Scholar]
  6. Luterbacher, J.; Xoplaki, E. 500-year Winter Temperature and Precipitation Variability over the Mediterranean Area and its Connection to the Large-scale Atmospheric Circulation. In Mediterranean Climate: Variability and Trends; Bolle, H.-J., Ed.; Springer: Berlin/Heidelberg, Germany, 2003; pp. 133–153. ISBN 978-3-642-55657-9. [Google Scholar]
  7. Trigo, R.; Xoplaki, E.; Zorita, E.; Luterbacher, J.; Krichak, S.O.; Alpert, P.; Jacobeit, J.; Sáenz, J.; Fernández, J.; González-Rouco, F.; et al. Chapter 3 Relations between variability in the Mediterranean region and mid-latitude variability. In Mediterranean; Lionello, P., Malanotte-Rizzoli, P., Boscolo, R., Eds.; Developments in Earth and Environmental Sciences; Elsevier: Amsterdam, The Netherlands, 2006; Volume 4, pp. 179–226. [Google Scholar]
  8. Born, K.; Fink, A.H.; Paeth, H. Dry and wet periods in the northwestern Maghreb for present day and future climate conditions. Meteorol. Z. 2008, 17, 533–551. [Google Scholar] [CrossRef]
  9. Filahi, S.; Tramblay, Y.; Mouhir, L.; Diaconescu, E.P. Projected changes in temperature and precipitation indices in Morocco from high-resolution regional climate models. Int. J. Climatol. 2017, 37, 4846–4863. [Google Scholar] [CrossRef]
  10. Zittis, G. Observed rainfall trends and precipitation uncertainty in the vicinity of the Mediterranean, Middle East and North Africa. Theor. Appl. Climatol. 2018, 134, 1207–1230. [Google Scholar] [CrossRef]
  11. Fragaszy, S.R.; Jedd, T.; Wall, N.; Knutson, C.; Fraj, M.B.; Bergaoui, K.; Svoboda, M.; Hayes, M.; McDonnell, R. Drought Monitoring in the Middle East and North Africa (MENA) Region: Participatory Engagement to Inform Early Warning Systems. Bull. Am. Meteorol. Soc. 2020, 101, E1148–E1173. [Google Scholar] [CrossRef] [Green Version]
  12. Tuel, A.; Eltahir, E.A.B. Why Is the Mediterranean a Climate Change Hot Spot? J. Clim. 2020, 33, 5829–5843. [Google Scholar] [CrossRef]
  13. Tomaszkiewicz, M.A. Future Seasonal Drought Conditions over the CORDEX-MENA/Arab Domain. Atmosphere 2021, 12, 856. [Google Scholar] [CrossRef]
  14. IPCC. Working Group, II. Third Assesment Report Climate Change 2001: Impacts, Adaptation, and Vulnerability; Cambridge University Press: New York, NY, USA, 2001. [Google Scholar]
  15. IPCC. Climate Change 2014 Synthesis Report; IPCC: Geneva, Switzerland, 2014. [Google Scholar]
  16. Driouech, F.; ElRhaz, K.; Moufouma-Okia, W.; Arjdal, K.; Balhane, S. Assessing Future Changes of Climate Extreme Events in the CORDEX-MENA Region Using Regional Climate Model ALADIN-Climate. Earth Syst. Environ. 2020, 4, 477–492. [Google Scholar] [CrossRef]
  17. Longobardi, A.; Villani, P. Trend analysis of annual and seasonal rainfall time series in the Mediterranean area. Int. J. Climatol. 2010, 30, 1538–1546. [Google Scholar] [CrossRef]
  18. Yue, S.; Wang, C.Y. Applicability of prewhitening to eliminate the influence of serial correlation on the Mann-Kendall test. Water Resour. Res. 2002, 38, 4–7. [Google Scholar] [CrossRef]
  19. Cannarozzo, M.; Noto, L.V.; Viola, F. Spatial distribution of rainfall trends in Sicily (1921–2000). Phys. Chem. Earth Parts A/B/C 2006, 31, 1201–1211. [Google Scholar] [CrossRef]
  20. Jain, S.K.; Kumar, V. Trend analysis of rainfall and temperature data for India. Curr. Sci. 2012, 102, 37–49. [Google Scholar]
  21. Becker, S.; Gemmer, M.; Jiang, T. Spatiotemporal analysis of precipitation trends in the Yangtze River catchment. Stoch. Environ. Res. Risk Assess. 2006, 20, 435–444. [Google Scholar] [CrossRef]
  22. Sonali, P.; Nagesh Kumar, D. Review of trend detection methods and their application to detect temperature changes in India. J. Hydrol. 2013, 476, 212–227. [Google Scholar] [CrossRef]
  23. Valdes-Abellan, J.; Pardo, M.A.; Tenza-Abril, A.J. Observed precipitation trend changes in the western Mediterranean region. Int. J. Climatol. 2017, 37, 1285–1296. [Google Scholar] [CrossRef] [Green Version]
  24. Achite, M.; Wałęga, A.; Toubal, A.K.; Mansour, H.; Krakauer, N. Spatiotemporal Characteristics and Trends of Meteorological Droughts in the Wadi Mina Basin, Northwest Algeria. Water 2021, 13, 3103. [Google Scholar] [CrossRef]
  25. Sa’adi, Z.; Shahid, S.; Ismail, T.; Chung, E.-S.; Wang, X.-J. Trends analysis of rainfall and rainfall extremes in Sarawak, Malaysia using modified Mann–Kendall test. Meteorol. Atmos. Phys. 2019, 131, 263–277. [Google Scholar] [CrossRef]
  26. Hu, Z.; Liu, S.; Zhong, G.; Lin, H.; Zhou, Z. Modified Mann-Kendall trend test for hydrological time series under the scaling hypothesis and its application. Hydrol. Sci. J. 2020, 65, 2419–2438. [Google Scholar] [CrossRef]
  27. Mallick, J.; Talukdar, S.; Alsubih, M.; Salam, R.; Ahmed, M.; Kahla, N.B.; Shamimuzzaman, M. Analysing the trend of rainfall in Asir region of Saudi Arabia using the family of Mann-Kendall tests, innovative trend analysis, and detrended fluctuation analysis. Theor. Appl. Climatol. 2021, 143, 823–841. [Google Scholar] [CrossRef]
  28. Şen, Z. Innovative Trend Analysis Methodology. J. Hydrol. Eng. 2012, 17, 1042–1046. [Google Scholar] [CrossRef]
  29. Seenu, P.Z.; Jayakumar, K.V. Comparative study of innovative trend analysis technique with Mann-Kendall tests for extreme rainfall. Arab. J. Geosci. 2021, 14, 536. [Google Scholar] [CrossRef]
  30. Serinaldi, F.; Chebana, F.; Kilsby, C.G. Dissecting innovative trend analysis. Stoch. Environ. Res. Risk Assess. 2020, 34, 733–754. [Google Scholar] [CrossRef]
  31. Ouatiki, H.; Boudhar, A.; Ouhinou, A.; Arioua, A.; Hssaisoune, M.; Bouamri, H.; Benabdelouahab, T. Trend analysis of rainfall and drought over the Oum Er-Rbia River Basin in Morocco during 1970–2010. Arab. J. Geosci. 2019, 12, 128. [Google Scholar] [CrossRef]
  32. Kessabi, R.; Hanchane, M.; Guijarro, J.A.; Krakauer, N.Y.; Addou, R.; Sadiki, A.; Belmahi, M. Homogenization and Trends Analysis of Monthly Precipitation Series in the Fez-Meknes Region, Morocco. Climate 2022, 10, 64. [Google Scholar] [CrossRef]
  33. Driouech, F.; Stafi, H.; Khouakhi, A.; Moutia, S.; Badi, W.; ElRhaz, K.; Chehbouni, A. Recent observed country-wide climate trends in Morocco. Int. J. Climatol. 2021, 41, E855–E874. [Google Scholar] [CrossRef]
  34. ABHS. Inventaire du degré de Pollution des Ressources en Eau dans le Bassin du Sebou. 2015. Available online: https://www.abhsebou.ma/wp-content/uploads/2016/09/Inv_degre_pollution_2007.pdf (accessed on 24 September 2022).
  35. Born, K.; Fink, A.H.; Knippertz, P.P. Meteorological Processes Influencing the Weather and Climate of Morocco. In Impacts of Global Change on the Hydrological Cycle in West and Northwest Africa; Speth, P., Christoph, M., Diekkruger, B., Eds.; Springer Science & Business Media: Berlin/Heidelberg, Germany, 2010. [Google Scholar]
  36. Mann, H.B. Nonparametric Tests Against Trend. Econometrica 1945, 13, 245–259. [Google Scholar] [CrossRef]
  37. Kendall, M.G.; Stuart, A. The Advanced Theory of Statistics; Macmillan: New York, NY, USA, 1977; Volume 1. [Google Scholar]
  38. Sen, P.K. Estimates of the Regression Coefficient Based on Kendall’s Tau. J. Am. Stat. Assoc. 1968, 63, 1379–1389. [Google Scholar] [CrossRef]
  39. Wahba, G.; Wendelberger, J. Some New Mathematical Methods for Variational Objective Analysis Using Splines and Cross Validation. Mon. Weather Rev. 1980, 108, 1122–1143. [Google Scholar] [CrossRef]
  40. Eckstein, B.A. Evaluation of spline and weighted average interpolation algorithms. Comput. Geosci. 1989, 15, 79–94. [Google Scholar] [CrossRef]
  41. Hutchinson, M.F.; Gessler, P.E. Splines—More than just a smooth interpolator. Geoderma 1994, 62, 45–67. [Google Scholar] [CrossRef]
  42. Apaydin, H.; Sonmez, F.K. Spatial interpolation techniques for climate data in the GAP region in Turkey. Clim. Res. 2004, 28, 31–40. [Google Scholar] [CrossRef] [Green Version]
  43. Bergonse, R.; Reis, E. Reconstructing pre-erosion topography using spatial interpolation techniques: A validation-based approach. J. Geogr. Sci. 2015, 25, 196–210. [Google Scholar] [CrossRef] [Green Version]
  44. Kamaruddin, S.A.; Nasir, N.A.H.A.; Rahim, N.S.; Shuhaime, N.; Hashim, M.A.; Khazali, A.S.; Aziz, K.N.A.; Roslani, M.A. A Comparative Accuracy of Regularized and Tension Spline Methods to Estimate and Model the Surface Water pH of Pulau Tuba, Langkawi, Kedah. Sci. Lett. 2021, 15, 116–134. [Google Scholar] [CrossRef]
  45. Hakam, O.; Baali, A.; Ait Brahim, Y.; El Kamel, T.; Azennoud, K. Regional and global teleconnections patterns governing rainfall in the Western Mediterranean: Case of the Lower Sebou Basin, North-West Morocco. Model. Earth Syst. Environ. 2022, 8, 5107–5128. [Google Scholar] [CrossRef]
  46. Singla, S.; Mahé, G.; Dieulin, C.; Driouech, F.; Milano, M.; El Guelai, F.Z.; Ardoin-Bardin, S. Evolution des relations pluie-débit sur des bassins versants du Maroc. IAHS-AISH Publ. 2010, 340, 679–687. Available online: https://iahs.info/uploads/dms/15275.94-679-687-340-85-T5_Singla.pdf (accessed on 29 September 2022).
  47. Benazizi, A. With Dams below Average Filling Rate, Morocco Faces Worst Drought in 40 Years. 2022. Available online: https://www.moroccoworldnews.com/2022/07/350366/with-dams-below-average-filling-rate-morocco-faces-worst-drought-in-40-years (accessed on 29 September 2022).
  48. Deitch, M.J.; Sapundjieff, M.J.; Feirer, S.T. Characterizing Precipitation Variability and Trends in the World’s Mediterranean-Climate Areas. Water 2017, 9, 259. [Google Scholar] [CrossRef] [Green Version]
  49. Bouklikha, A.; Habi, M.; Elouissi, A.; Benzater, B.; Hamoudi, S. The innovative trend analysis applied to annual and seasonal rainfall in the tafna watershed (Algeria). Rev. Bras. Meteorol. 2020, 35, 631–647. [Google Scholar] [CrossRef]
  50. Knippertz, P.; Ulbrich, U.; Marques, F.; Corte-Real, J. Decadal changes in the link between El Niño and springtime North Atlantic oscillation and European-North African rainfall. Int. J. Climatol. 2003, 23, 1293–1311. [Google Scholar] [CrossRef]
  51. Benzater, B.; Elouissi, A.; Dabanli, I.; Harkat, S.; Hamimed, A. New approach to detect trends in extreme rain categories by the ITA method in northwest Algeria. Hydrol. Sci. J. 2021, 66, 2298–2311. [Google Scholar] [CrossRef]
  52. Salhi, A.; Martin-Vide, J.; Benhamrouche, A.; Benabdelouahab, S.; Himi, M.; Benabdelouahab, T.; Casas Ponsati, A. Rainfall distribution and trends of the daily precipitation concentration index in northern Morocco: A need for an adaptive environmental policy. SN Appl. Sci. 2019, 1, 277. [Google Scholar] [CrossRef] [Green Version]
  53. Chehlafi, A.; Kchikach, A.; Derradji, A.; Mequedade, N. Highway cutting slopes with high rainfall erosion in Morocco: Evaluation of soil losses and erosion control using concrete arches. Eng. Geol. 2019, 260, 105200. [Google Scholar] [CrossRef]
  54. Benzougagh, B.; Meshram, S.G.; Abdallah, D.; Larbi, B.; Drisss, S.; Khalid, M.; Khedher, K.M. Mapping of soil sensitivity to water erosion by RUSLE model: Case of the Inaouene watershed (Northeast Morocco). Arab. J. Geosci. 2020, 13, 1153. [Google Scholar] [CrossRef]
  55. Jaafari, Y.; Benabdelhadi, M. Assessment of Rainfall Soil Loss in Allal El Fassi Watershed (Mean Atlas Morocco) Using RUSLE Method Combining to GIS and Remote Sensing. In Geospatial Technology: Application in Water Resources Management; Oulidi, H.J., Fadil, A., Semane, N.E., Eds.; Springer International Publishing: Cham, Switzerland, 2020; pp. 95–103. ISBN 978-3-030-24974-8. [Google Scholar]
  56. Rahhou, J. Siltation Causes Moroccan Dams to Lose 70 Million Cubic Meters of Water. 2022. Available online: https://www.moroccoworldnews.com/2022/06/349522/siltation-causes-moroccan-dams-to-lose-70-million-cubic-meters-of-water (accessed on 3 October 2022).
  57. El Fathi, B.; El Hassani, F.; Moukhliss, M.; Mazigh, N.; Dra, A.; Ouallali, A.; Kherbeche, A.; Taleb, A. Flood forecast and flood vulnerability modeling in case of Wadi Fez, Morocco. Arab. J. Geosci. 2022, 15, 525. [Google Scholar] [CrossRef]
  58. Benzougagh, B.; Frison, P.-L.; Meshram, S.G.; Boudad, L.; Dridri, A.; Sadkaoui, D.; Mimich, K.; Khedher, K.M. Flood Mapping Using Multi-temporal Sentinel-1 SAR Images: A Case Study—Inaouene Watershed from Northeast of Morocco. Iran. J. Sci. Technol. Trans. Civ. Eng. 2022, 46, 1481–1490. [Google Scholar] [CrossRef]
  59. Loudyi, D.; Hasnaoui, M.D.; Fekri, A. Flood Risk Management Practices in Morocco: Facts and Challenges. In Wadi Flash Floods Challenges and Advanced Approaches for Disaster Risk Reduction; Springer: Berlin/Heidelberg, Germany, 2022; pp. 35–94. ISBN 9789811629037. [Google Scholar]
Figure 1. Map of SRB and location of rain gauge stations used in this paper.
Climate 10 00170 g001
Figure 2. Methodology used in this paper.
Climate 10 00170 g002
Figure 3. Theil–Sen Slope approach (TSA) for annual rainfall expressed in mm/10 years.
Climate 10 00170 g003
Figure 4. The Mann–Kendall test results in the SRB for annual rainfall at the 95% CL.
Climate 10 00170 g004
Figure 5. Theil–Sen Slope approach (TSA) for seasonal rainfall expressed in mm/10 years.
Climate 10 00170 g005
Figure 6. Results of the MK trends test for seasonal rainfall at 15 stations in the SRB.
Climate 10 00170 g006
Figure 7. Theil–Sen Slope approach (TSA) for monthly rainfall expressed in mm per decade. Regular triangles represent rising rain and inverted triangles represent rain decreases.
Climate 10 00170 g007
Table 1. Main characteristics of the rain gauge stations used in this paper.
IDStationLat
(° N)
Long
(° W)
Elevation (m)Annual Rainfall (Mm)Interannual Standard DeviationKurtosisSkewness
S1Ait Khabbach33.39−4.821491379..2111..00.170.61
S2Azzaba33.82−4.7759368.6113.61.331.17
S3Bab Ounder34.53−4.58509703.3255.9−0.220.60
S4Boured34.73−4.10817560.9193.5−0.330.47
S5El Mers33.46−4.391242453.2136.52.071.04
S6Fez33.93−4.98569442.7143.50.530.51
S7Ifrane33.53−5.111661985.2326.30.660.95
S8Jbel Oudka34.75−4.8415891469.0526.8−0.170.55
S9Meknes33.87−5.52570539.7182.50.480.71
S10Mjaara34.59−5.24128600.4214.80.180.71
S11Ouljet Essoultan33.62−5.86334456.9132.3−0.130.51
S12Souk el Had Rdom34.30−5.7734412.2133.6−0.190.43
S13Tahla34.05−4.43571551.0170.50.280.64
S14Taza34.22−4.01522652.5207.1−0.180.43
S15Tissa34.29−4.66204538.8198.90.960.88
Table 2. Results of Theil–Sen approach (TSA) and Mann–Kendall (MK) test for annual and seasonal rainfall.
IDStation NameAnnualAutumnWinterSpringSummer
TSA
mm/10 y
MKTSA
mm/10 y
MKTSA
mm/10 y
MKTSA
mm/10 y
MKTSA
mm/10 y
MK
S1Ait Khabbach−9.71−1.210.710.23−8.46−2.30 *−4.67−1.015.351.60
S2Azzaba−17.03−2.00 *0.730.18−7.45−1.60−11.66−2.27 **−3.25−2.90 **
S3Bab ounder−31.37−1.524.910.71−27.73−2.07 *−6.23−0.60−1.00−1.58
S4Boured−44.83−2.59 **4.300.74−28.22−2.64 **−14.00−1.97 *−3.20−2.11 *
S5Elmers−13.94−1.576.291.39−6.80−1.35−11.41−1.96 *0.080.01
S6Fes DRH−24.88−2.39 *3.540.74−10.33−1.65 +−15.52−2.49 **−2.06−3.12 **
S7Ifrane−31.12−1.223.600.29−27.00−1.96 *−14.13−1.66 +−1.30−0.41
S8Jbel oudka−58.00−1.227.540.56−47.52−1.66 +−18.90−1.01−3.36−2.35 *
S9Meknes−36.53−2.62 **2.280.48−19.96−2.49 *−16.07−2.18 *−0.47−0.54
S10Mjaara−17.10−0.904.910.64−18.77−1.75 +−4.00−0.58−0.71−1.41
S11Ouljet Essoultan−22.48−1.92 +0.380.10−11.68−1.64−13.35−2.38 *−0.66−0.98
S12Souk el Had Rdom−15.00−1.416.141.07−16.86−2.51 *−7.27−1.41−0.08−1.61
S13Tahla−32.12−2.15 *5.691.14−15.26−2.07 *−16.63−2.28 *−1.43−1.49
S14Taza−41.18−2.50 *−0.71−0.08−22.27−2.21 *−15.31−2.05 *−1.09−1.43
S15Tissa−15.65−1.052.270.42−15.51−1.60−8.48−1.11−0.46−0.88
+, * and ** represent 90%, 95%, and 99% significance levels, respectively. The slope by TSA is in mm/10 year.
Table 3. Results of Mann–Kendall test for monthly rainfall; bold figures are significant at 95% CL.
IDStation SepOctNovDecJanFebMarAprMaiJunJulAug
S1Ait Khabbach1.220.69−1.60−1.55−0.36−2.45−1.54−1.540.73−1.23−1.232.69
S2Azzaba1.110.87−0.28−0.920.57−1.33−2.07−1.35−0.31−3.94−3.940.23
S3Bab Ounder1.451.780.03−1.23−0.21−1.13−0.29−0.03−0.89−2.72−2.720.52
S4Boured2.171.02−0.19−1.24−0.69−0.84−0.33−2.01−0.63−3.52−3.52−0.01
S5El Mers2.340.50−0.44−0.90−0.16−0.79−2.10−2.05−0.69−3.40−3.401.69
S6Fez−0.180.150.67−1.080.06−1.57−2.20−1.72−2.67−3.77−3.77−1.71
S7Ifrane0.550.940.01−0.860.13−1.25−0.60−0.86−1.08−2.45−2.451.66
S8Jbel Oudka0.971.450.41−0.950.27−1.33−0.710.00−1.43−3.39−3.390.50
S9Meknes0.251.29−0.03−1.70−0.35−1.52−1.68−1.24−0.52−2.02−2.021.33
S10Mjaara1.321.330.50−0.780.33−0.86−0.38−0.54−0.58−3.02−3.021.68
S11Ouljet Essoultan−0.220.80−0.42−1.330.44−0.44−1.18−1.82−1.24−2.84−2.840.42
S12Souk el Had Rdom1.441.600.41−2.06−0.14−1.18−0.93−0.26−1.51−2.50−2.500.53
S13Tahla0.531.350.77−0.79−0.10−1.71−1.60−1.33−1.41−2.63−2.63−0.37
S14Taza1.141.04−0.25−1.18−0.41−1.11−1.32−1.48−1.20−3.57−3.57−0.56
S15Tissa1.210.470.43−0.620.51−1.16−0.49−0.63−0.71−1.69−1.690.27
Table 4. Different studies using trend analysis methods compared to our results.
Country/
Region
Data/VariableMethodsKey FindingsReferences
Morocco and its vicinityRainfall data from 42 stations, NCEP reanalysis
the period
1930–2000
Precipitation
Index anomalies,
Teleconnections, Circulation weather types, models projections
The northward shift of the storm track and eastward shift of the Azores High predicted by the ECHAM model for increasing GHG concentrations would therefore be associated with decreasing
precipitation and potentially serious impacts for the future water supply for parts of Morocco.
[2]
MoroccoRainfall from 3 stations in the lower Sebou basinthe period
1948–2017
Mann–Kendall test and Theil–Sen slopeNotable downward trends were identified in early winter (December) and early spring (March) with rainfall decreases of 0.5 mm/year and 0.42 mm/year, respectively[45]
Mediterranean areaRainfall from 211 gauged stations
the period 1918–1999
Student’s t-test
Mann–Kendal test
The trends appear predominantly negative, both at the annual and seasonal scale, except for the summer period when it appears to be positive[17]
MoroccoRainfall and temperature data from 30 stations data
1960–2016
Climate indices and
Mann–Kendal test
Statistically significant increasing trends in warm temperature events and the annual mean precipitation and the standardized drought index show less spatially consistent tendencies despite the predominance of negative trends[33]
MoroccoMonthly rainfall series from 50 stations in 27 watersheds in MoroccoRegional vector
Pettit’s nonparametric method, Bayesian Lee and Heghinian method, and Hubert’s segmentation
The precipitations are correlated with the North Atlantic Oscillation West of the Atlas. they provide evidence of a generalized rainfall reduction by an abrupt change in the time series between 1976 and 1980[46]
MoroccoMonthly rainfall data from 15 stations over a 40-years period (1970–2010) in the Oum Errabia watershedStandardized Precipitation Index (SPI) and trend analysis using
Mann–Kendal test
The results show that the OER River basin tends towards drier conditions. An abundance of deficit seasons has been noticed (50 to 63% of the seasons), especially after 1980–1981.[31]
SpainDaily precipitation data were provided by the National Meteorological AgencyStudent’s t-test
Mann–Kendall test
Annual rainfall had decreased, with values ranging from 0 to 15%, dry periods had increased in length, and the number of rainy days had decreased[23]
Mediterranean area Precipitation data were obtained through NOAA’s National Climatic Data Center for the period 1975–2015Mann–Kendall test Many sites in Mediterranean-climate regions show downward trends in annual precipitation (Spain, Australia, Chile, and Northern Italy); and most of the Mediterranean basin, and Chile showed downward trends in summer precipitation.[48]
Western Algeria Monthly rainfall data from 17 stations (1970–2015)Innovative Trend Analysis (ITA) Seasonal rainfall showed a decreasing trend in winter and spring, while increasing trend is detected in summer and autumn[49]
Publisher’s Note: MDPI stays neutral with regard to jurisdictional claims in published maps and institutional affiliations.

