
A Systematic Review on Human Thermal Comfort and Methodologies for Evaluating Urban Morphology in Outdoor Spaces

 ,
,  ,
,  , ,
, ,  ,
,  and
and 
Abstract
:1. Introduction
2. Materials and Methods
- (A).
- Scopus (https://www.scopus.com/home.uri, accessed on 13 February 2024);
- (B).
- Connected Papers (https://www.connectedpapers.com, accessed on 13 February 2024);
- (C).
- Science Direct (https://www.sciencedirect.com, accessed on 13 February 2024).
3. Results
3.1. Meta-Analysis
Results of the Systematic Review
3.2. Data Meta-Analysis
4. Discussion
5. Conclusions
Author Contributions
Funding
Data Availability Statement
Acknowledgments
Conflicts of Interest
References
- Cárdenas-Jirón, L.A.; Graw, K.; Gangwisch, M.; Matzarakis, A. Influence of street configuration on human thermal comfort and benefits for climate-sensitive urban planning in Santiago de Chile. Urban Clim. 2023, 47, 101361. [Google Scholar] [CrossRef]
- Writzl, L.; Wollmann, C.A.; Costa, I.T.; Gobo, J.P.A.; Shooshtarian, S.; Matzarakis, A. Outdoor Human Thermal Comfort along Bike Paths in Balneário Camboriú/SC, Brazil. Atmosphere 2022, 13, 2092. [Google Scholar] [CrossRef]
- Vasilikou, C.; Nikolopoulou, M. Outdoor thermal comfort for pedestrians in movement: Thermal walks in complex urban morphology. Int. J. Biometeorol. 2020, 64, 277–291. [Google Scholar] [CrossRef]
- Vanos, J.K.; Kosaka, E.; Iida, A.; Yokohari, M.; Middel, A.; Scott-Fleming, I.; Brown, R.D. Planning for spectator thermal comfort and health in the face of extreme heat: The Tokyo 2020 Olympic marathons. Sci. Total Environ. 2019, 657, 904–917. [Google Scholar] [CrossRef]
- Wai, K.M.; Yuan, C.; Lai, A.; Peter, K.N. Relationship between pedestrian-level outdoor thermal comfort and building morphology in a high-density city. Sci. Total Environ. 2020, 708, 134516. [Google Scholar] [CrossRef] [PubMed]
- Oke, T.R. Boundary Layer Climates; Routledge: New York, NY, USA, 1978; 464p. [Google Scholar]
- Costa, I.T.; Wollmann, C.A.; Gobo, J.P.A.; Ikefuti, P.V.; Shooshtarian, S.; Matzarakis, A. Extreme weather conditions and cardiovascular hospitalizations in Southern Brazil. Sustainability 2021, 13, 12194. [Google Scholar] [CrossRef]
- Çağlak, S. Evaluation of the effects of thermal comfort conditions on cardiovascular diseases in Amasya City, Turkey. J. Public Health 2023, 31, 2011–2020. [Google Scholar] [CrossRef] [PubMed]
- Huang, K.T.; Li, Y.J. Impact of street canyon typology on building’s peak cooling energy demand: A parametric analysis using orthogonal experiment. Energy Build. 2017, 154, 448–464. [Google Scholar] [CrossRef]
- Givoni, B.; Noguchi, M.; Saaroni, H.; Pochter, O.; Yaacov, Y.; Feller, N.; Becker, S. Outdoor comfort research issues. Energy Build. 2003, 35, 77–86. [Google Scholar] [CrossRef]
- Stathopoulos, T.; Wu, H.; Zacharias, J. Outdoor human comfort in an urban climate. Build. Environ. 2004, 39, 297–305. [Google Scholar] [CrossRef]
- Maruani, T.; Amit-Cohen, I. Open space planning models: A review of approaches and methods. Landsc. Urban Plan. 2007, 81, 1–13. [Google Scholar] [CrossRef]
- Makaremi, N.; Salleh, E.; Jaafar, M.Z.; Ghaffarian Hoseini, A. Thermal comfort conditions of shaded outdoor spaces in hot and humid climate of Malaysia. Build. Environ. 2012, 48, 7–14. [Google Scholar] [CrossRef]
- Strømann-Andersen, J.; Sattrup, P.A. The urban canyon and building energy use: Urban density versus daylight and passive solar gains. Energy Build. 2011, 43, 2011–2020. [Google Scholar] [CrossRef]
- Ramires, J.C.; Gomes, E.R. Verticalização litorânea: Uma análise preliminar. Geografares 2002, 3, 91–107. [Google Scholar] [CrossRef]
- Scussel, M.C.B.; Sattler, M.A. Cidades em (trans) formação: Impacto da verticalização e densificação na qualidade do espaço residencial. Ambiente Construído 2010, 10, 137–150. [Google Scholar] [CrossRef]
- Auliciems, A. Human Bioclimatology; Springer: Berlin/Heidelberg, Germany, 1998; Volume 5. [Google Scholar]
- Oke, T.R.; Mills, G.; Christen, A.; Voogt, A. Urban Climates; Cambridge University Press: Cambridge, UK, 2017. [Google Scholar]
- Shooshtarian, S.; Lam, C.K.C.; Kenawy, I. Outdoor thermal comfort assessment: A review on thermal comfort research in Australia. Build. Environ. 2020, 177, 106917. [Google Scholar] [CrossRef]
- Wai, C.Y.; Tariq, M.A.U.R.; Muttil, N. A Systematic Review on the Existing Research, Practices, and Prospects Regarding Urban Green Infrastructure for Thermal Comfort in a High-Density Urban Context. Water 2022, 14, 2496. [Google Scholar] [CrossRef]
- Dissanayake, C.; Weerasinghe, U.G.D. Urban microclimate and outdoor thermal comfort of public spaces in warm-humid cities: A comparative bibliometric mapping of the literature. Am. J. Clim. Change 2021, 10, 433–466. [Google Scholar] [CrossRef]
- Stewart, I.D. A systematic review and scientific critique of methodology in modern urban heat island literature. Int. J. Climatol. 2011, 31, 200–217. [Google Scholar] [CrossRef]
- Hunt, M. How Science Takes Stock: The Story of Meta-Analysis; Russell Sage Foundation: New York, NY, USA, 1997. [Google Scholar]
- Higgins, J.; Green, S. (Eds.) Cochrane Handbook for Systematic Reviews of Interventions, Version 5.1.0; [updated March 2011]; The Cochrane Collaboration: London, UK, 2011. [Google Scholar]
- Medina, E.U.; Pailaquilén, R.M.B. A revisão sistemática e a sua relação com a prática baseada na evidência em saúde. Rev. Lat.-Am. Enferm. 2010, 18, 824–831. [Google Scholar]
- Guanilo, M.C.T.; Takahashi, R.F.; Bertolozzi, M. R Revisão sistemática: Noções gerais. Rev. Esc. Enferm. USP 2011, 45, 1260–1266. [Google Scholar] [CrossRef] [PubMed]
- Akobeng, A.K. Understanding systematic reviews and meta-analysis. Arch. Dis. Child. 2005, 90, 845–848. [Google Scholar] [CrossRef] [PubMed]
- Paul, J.; Criado, A.R. The art of writing literature review: What do we know and what do we need to know? Int. Bus. Rev. 2020, 29, 101717. [Google Scholar] [CrossRef]
- Sampaio, R.F.; Mancini, M.C. Estudos de revisão sistemática: Um guia para síntese criteriosa da evidência científica. Braz. J. Phys. Ther. 2007, 11, 83–89. [Google Scholar] [CrossRef]
- Silva, A.N.D. Interações Topoclimáticas Entre o Urbano e o Parque Natural Municipal dos Morros, em Santa Maria/RS. 2022. Dissertação (Mestrado)—Universidade Federal de Santa Maria, Centro de Ciências Naturais e Exatas, Programa de Pós-Graduação em Geografia, RS. 2022. Available online: http://repositorio.ufsm.br/handle/1/23765 (accessed on 9 February 2024).
- Writzl, L. Conforto Térmico Humano em Caminhos Disponíveis ao uso da Bicicleta em Balneário Camboriú-SC, em Situação Veranil. 2022. Writzl, L. Conforto Térmico Humano em Caminhos Disponíveis ao Uso da Bicicleta em Balneário Camboriú-SC, em Situação Veranil. 2022. Available online: http://repositorio.ufsm.br/handle/1/26320 (accessed on 9 February 2024).
- Ali-Toudert, F.; Djenane, M.; Bensalem, R.; Mayer, H. Outdoor thermal comfort in the old desert city of Beni-Isguen, Algeria. Clim. Res. 2005, 28, 243–256. [Google Scholar] [CrossRef]
- Emmanuel, R.; Johansson, E. Influence of urban morphology and sea breeze on hot humid microclimate: The case of Colombo, Sri Lanka. Clim. Res. 2006, 30, 189–200. [Google Scholar] [CrossRef]
- Ali-Toudert, F.; Mayer, H. Numerical study on the effects of aspect ratio and orientation of an urban street canyon on outdoor thermal comfort in hot and dry climate. Build. Environ. 2006, 41, 94–108. [Google Scholar] [CrossRef]
- Ma, X.; Fukuda, H.; Zhou, D.; Gao, W.; Wang, M. The study on outdoor pedestrian thermal comfort in blocks: A case study of the Dao He Old Block in hot-summer and cold-winter area of southern China. Sol. Energy 2019, 179, 210–225. [Google Scholar] [CrossRef]
- Jamei, E.; Rajagopalan, P. Urban development and pedestrian thermal comfort in Melbourne. Sol. Energy 2017, 144, 681–698. [Google Scholar] [CrossRef]
- Chatzidimitriou, A.; Yannas, S. Street canyon design and improvement potential for urban open spaces; the influence of canyon aspect ratio and orientation on microclimate and outdoor comfort. Sustain. Cities Soc. 2017, 33, 85–101. [Google Scholar] [CrossRef]
- Rodríguez-Algeciras, J.; Tablada, A.; Matzarakis, A. Effect of asymmetrical street canyons on pedestrian thermal comfort in warm-humid climate of Cuba. Theor. Appl. Climatol. 2018, 133, 663–679. [Google Scholar] [CrossRef]
- Bochenek, A.; Klemm, K. Assessment of human thermal comfort in street canyons. An example of typical structures (Lodz, Poland). Bud. O Zoptymalizowanym Potencjale Energetycznym 2020, 9, 69–76. [Google Scholar] [CrossRef]
- Gaber, N.; Ibrahim, A.; Rashad, A.B.; Wahba, E.; El-Sayad, Z.; Bakr, A.F. Improving pedestrian micro-climate in urban canyons: City Center of Alexandria, Egypt. Urban Clim. 2020, 34, 100670. [Google Scholar] [CrossRef]
- Krüger, E.L.; Minella, F.O.; Rasia, F. Impact of urban geometry on outdoor thermal comfort and air quality from field measurements in Curitiba, Brazil. Build. Environ. 2011, 46, 621–634. [Google Scholar] [CrossRef]
- Ma, X.; Fukuda, H.; Zhou, D.; Wang, M. A Study of the Pedestrianized Zone for Tourists: Urban Design Effects on Humans’ Thermal Comfort in Foshan City, Southern China. Sustainability 2019, 11, 2774. [Google Scholar] [CrossRef]
- Kakon, A.N.; Nobuo, M.; Kojima, S.; Yoko, T. Assessment of thermal comfort in respect to building height in a high-density city in the tropics. Am. J. Eng. Appl. Sci. 2010, 3, 545–551. [Google Scholar] [CrossRef]
- Lee, H.; Mayer, H.; Kuttler, W. Impact of the spacing between tree crowns on the mitigation of daytime heat stress for pedestrians inside EW urban street canyons under Central European conditions. Urban For. Urban Green. 2020, 48, 126558. [Google Scholar] [CrossRef]
- Abdelhafez, M.H.H.; Altaf, F.; Alshenaifi, M.; Hamdy, O.; Ragab, A. Achieving Effective Thermal Performance of Street Canyons in Various Climatic Zones. Sustainability 2022, 14, 10780. [Google Scholar] [CrossRef]
- Abd Elraouf, R.; Elmokadem, A.; Megahed, N.; Eleinen, O.A.; Eltarabily, S. The impact of urban geometry on outdoor thermal comfort in a hot-humid climate. Build. Environ. 2022, 225, 109632. [Google Scholar] [CrossRef]
- Abdollahzadeh, N.; Biloria, N. Outdoor thermal comfort: Analyzing the impact of urban configurations on the thermal performance of street canyons in the humid subtropical climate of Sydney. Front. Archit. Res. 2021, 10, 394–409. [Google Scholar] [CrossRef]
- Abdallah, A.S.H.; Mahmoud, R.M.A. Urban morphology as an adaptation strategy to improve outdoor thermal comfort in urban residential community of new Assiut city, Egypt. Sustain. Cities Soc. 2022, 78, 103648. [Google Scholar] [CrossRef]
- Kim, Y.J.; Brown, R.D. A multilevel approach for assessing the effects of microclimatic urban design on pedestrian thermal comfort: The High Line in New York. Build. Environ. 2021, 205, 108244. [Google Scholar] [CrossRef]
- Li, Z.; Zhang, H.; Juan, Y.H.; Wen, C.Y.; Yang, A.S. Effects of building setback on thermal comfort and air quality in the street canyon. Build. Environ. 2022, 208, 108627. [Google Scholar] [CrossRef]
- Vassiliades, C.; Savvides, A.; Buonomano, A. Building integration of active solar energy systems for façades renovation in the urban fabric: Effects on the thermal comfort in outdoor public spaces in Naples and Thessaloniki. Renew. Energy 2022, 190, 30–47. [Google Scholar] [CrossRef]
- Acero, J.A.; Koh, E.J.; Ruefenacht, L.A.; Norford, L.K. Modelling the influence of high-rise urban geometry on outdoor thermal comfort in Singapore. Urban Clim. 2021, 36, 100775. [Google Scholar] [CrossRef]
- Al Haddid, H.; Al-Obaidi, K.M. Examining the impact of urban canyons morphology on outdoor environmental conditions in city centres with a temperate climate. Energy Nexus 2022, 8, 100159. [Google Scholar] [CrossRef]
- Mahmoud, H.; Ghanem, H.; Sodoudi, S. Urban geometry as an adaptation strategy to improve the outdoor thermal performance in hot arid regions: Aswan University as a case study. Sustain. Cities Soc. 2021, 71, 102965. [Google Scholar] [CrossRef]
- Abreu-Harbich, L.V.; Labaki, L.C.; Sampaio, V.H.P.; Labaki, L.C.; Matzarakis, A. Influência de diferentes configurações urbanas no conforto térmico em cânions urbanos de Campinas, SP—Estudos de campo e simulações Computacionais. In Proceedings of the Encontro Nacional de Tecnologia do Ambiente Construído, Maceio, Brazil, 12–14 November 2014; Available online: http://dkimrg/10.17012/entac2014.275 (accessed on 9 February 2024).
- Boumaraf, H.; Amireche, L. Thermal comfort and pedestrian behaviors in urban public spaces in cities with warm and dry climates. Open House Int. 2021, 46, 143–159. [Google Scholar] [CrossRef]
- Lamarca, C.; Qüense, J.; Henríquez, C. Thermal comfort and urban canyons morphology in coastal temperate climate, Concepción, Chile. Urban Clim. 2018, 23, 159–172. [Google Scholar] [CrossRef]
- Watanabe, S.; Nagano, K.; Ishii, J.; Horikoshi, T. Evaluation of outdoor thermal comfort in sunlight, building shade, and pergola shade during summer in a humid subtropical region. Build. Environ. 2014, 82, 556–565. [Google Scholar] [CrossRef]
- Johansson, E. Influence of urban geometry on outdoor thermal comfort in a hot dry climate: A study in Fez, Morocco. Build. Environ. 2006, 41, 1326–1338. [Google Scholar] [CrossRef]
- Paolini, R.; Mainini, A.G.; Poli, T.; Vercesi, L. Assessment of thermal stress in a street canyon in pedestrian area with or without canopy shading. Energy Procedia 2014, 48, 1570–1575. [Google Scholar] [CrossRef]
- Sun, C.; Lian, W.; Liu, L.; Dong, Q.; Han, Y. The impact of street geometry on outdoor thermal comfort within three different urban forms in severe cold region of China. Build. Environ. 2022, 222, 109342. [Google Scholar] [CrossRef]
- Athamena, K. Microclimatic coupling to assess the impact of crossing urban form on outdoor thermal comfort in temperate oceanic climate. Urban Clim. 2022, 42, 101093. [Google Scholar] [CrossRef]
- Din, M.F.M.; Lee, Y.Y.; Ponraj, M.; Ossen, D.R.; Iwao, K.; Chelliapan, S. Thermal comfort of various building layouts with a proposed discomfort index range for tropical climate. J. Therm. Biol. 2014, 41, 6–15. [Google Scholar] [CrossRef]
- Gadish, I.; Saaroni, H.; Pearlmutter, D. A predictive analysis of thermal stress in a densifying urban business district under summer daytime conditions in a Mediterranean City. Urban Clim. 2023, 48, 101298. [Google Scholar] [CrossRef]
- Lau, K.K.L.; Chung, S.C.; Ren, C. Outdoor thermal comfort in different urban settings of sub-tropical high-density cities: An approach of adopting local climate zone (LCZ) classification. Build. Environ. 2019, 154, 227–238. [Google Scholar] [CrossRef]
- Yan, H.; Wu, F.; Nan, X.; Han, Q.; Shao, F.; Bao, Z. Influence of view factors on intra-urban air temperature and thermal comfort variability in a temperate city. Sci. Total Environ. 2022, 841, 156720. [Google Scholar] [CrossRef]
- Deevi, B.; Chundeli, F.A. Quantitative outdoor thermal comfort assessment of street: A case in a warm and humid climate of India. Urban Clim. 2020, 34, 100718. [Google Scholar] [CrossRef]
- Jihad, A.S.; Tahiri, M. Modeling the urban geometry influence on outdoor thermal comfort in the case of Moroccan microclimate. Urban Clim. 2016, 16, 25–42. [Google Scholar] [CrossRef]
- Limona, S.S.; Al-hagla, K.S.; El-sayad, Z.T. Using simulation methods to investigate the impact of urban form on human comfort. Case study: Coast of Baltim, North Coast, Egypt. Alex. Eng. J. 2019, 58, 273–282. [Google Scholar] [CrossRef]
- Hwang, R.L.; Lin, T.P.; Matzarakis, A. Seasonal effects of urban street shading on long-term outdoor thermal comfort. Build. Environ. 2011, 46, 863–870. [Google Scholar] [CrossRef]
- Yin, S.; Lang, W.; Xiao, Y. The synergistic effect of street canyons and neighbourhood layout design on pedestrian-level thermal comfort in hot-humid area of China. Sustain. Cities Soc. 2019, 49, 101571. [Google Scholar] [CrossRef]
- Chen, L.; Yu, B.; Yang, F.; Mayer, H. Intra-urban differences of mean radiant temperature in different urban settings in Shanghai and implications for heat stress under heat waves: A GIS-based approach. Energy Build. 2016, 130, 829–842. [Google Scholar] [CrossRef]
- Rosheidat, A.; Hoffman, D.; Bryan, H. Visualizing pedestrian comfort using ENVI-met. Proc. SimBuild 2008, 3, 198–205. [Google Scholar]
- Pioppi, B.; Pigliautile, I.; Pisello, A.L. Human-centric microclimate analysis of Urban Heat Island: Wearable sensing and data-driven techniques for identifying mitigation strategies in New York City. Urban Clim. 2020, 34, 100716. [Google Scholar] [CrossRef]
- Mirzaei, P.A.; Haghighat, F. A procedure to quantify the impact of mitigation techniques on the urban ventilation. Build. Environ. 2012, 47, 410–420. [Google Scholar] [CrossRef]
- Latini, G.; Grifoni, R.C.; Tascini, S. Thermal comfort and microclimates in open spaces. Build. XI 2010, 79, 5–9. [Google Scholar]
- Krüger, E. Impact of site-specific morphology on outdoor thermal perception: A case-study in a subtropical location. Urban Clim. 2017, 21, 123–135. [Google Scholar] [CrossRef]
- Croce, S.; D’Agnolo, E.; Caini, M.; Paparella, R. The use of cool pavements for the regeneration of industrial districts. Sustainability 2021, 13, 6322. [Google Scholar] [CrossRef]
- Yao, J.; Yang, F.; Zhuang, Z.; Shao, Y.; Yuan, P.F. The effect of personal and microclimatic variables on outdoor thermal comfort: A field study in a cold season in Lujiazui CBD, Shanghai. Sustain. Cities Soc. 2018, 39, 181–188. [Google Scholar] [CrossRef]
- Deng, X.; Cao, Q.; Wang, L.; Wang, W.; Wang, S.; Wang, L. Understanding the Impact of Urban Expansion and Lake Shrinkage on Summer Climate and Human Thermal Comfort in a Land-Water Mosaic Area. J. Geophys. Res. Atmos. 2022, 127, e2021JD036131. [Google Scholar] [CrossRef]
- Liu, Z.; Zhao, X.; Jin, Y.; Jin, H.; Xu, X. Prediction of outdoor human thermal sensation at the pedestrian level in high-rise residential areas in severe cold regions of China. Energy Procedia 2019, 157, 51–58. [Google Scholar] [CrossRef]
- Smit, W. Urbanização no Sul Global. In Em Oxford Research Encyclopedia of Global Public Health; Oxford University Press: Oxford, UK, 2021. [Google Scholar]
- Huang, T.; Li, J.; Xie, Y.; Niu, J.; Mak, C.M. Simultaneous environmental parameter monitoring and human subject survey regarding outdoor thermal comfort and its modelling. Build. Environ. 2017, 125, 502–514. [Google Scholar] [CrossRef]
- Lai, A.; Maing, M.; Ng, E. Observational studies of mean radiant temperature across different outdoor spaces under shaded conditions in densely built environment. Build. Environ. 2017, 114, 397–409. [Google Scholar] [CrossRef]
- Hegazy, I.R.; Qurnfulah, E.M. Thermal comfort of urban spaces using simulation tools exploring street orientation influence of on the outdoor thermal comfort: A case study of Jeddah, Saudi Arabia. Int. J. Low-Carbon Technol. 2020, 15, 594–606. [Google Scholar] [CrossRef]
- Sanagar Darbani, E.; Monsefi Parapari, D.; Boland, J.; Sharifi, E. Impacts of urban form and urban heat island on the outdoor thermal comfort: A pilot study on Mashhad. Int. J. Biometeorol. 2021, 65, 1101–1117. [Google Scholar] [CrossRef]
- IPCC. 2007 Climate Change: The Physical Science Basis. Summary for Policymakers; Contribution of Working Group I to the 4th Assessment Report of the Intergovernmental Panel on Climate Change; Solomon, S., Qin, D., Manning, M., Chen, Z., Marquis, M., Averyt, K.B., Tignor, M., Miller, H.L., Eds.; Cambridge University Press: Cambridge, UK, 2007; Available online: http://www.ipcc.ch (accessed on 12 February 2023).
- Bulkeley, H. Cities and climate change. In Cities and Climate Change; Taylor and Francis: Abingdon, UK, 2013. [Google Scholar] [CrossRef]
- IPCC. Special Report on Climate Change and Land. IPCC, August 2017. 2019. Available online: https://www.ipcc.ch/report/srccl (accessed on 9 February 2024).
- Aram, F.; Solgi, E.; Garcia, E.H.; Mosavi, A. Urban heat resilience at the time of global warming: Evaluating the impact of the urban parks on outdoor thermal comfort. Environ. Sci. Eur. 2020, 32, 117. [Google Scholar] [CrossRef]
- Oke, T.R. Street design and urban canopy layer climate. Energy Build. 1988, 11, 103–113. [Google Scholar] [CrossRef]
- Ali-Toudert, F.; Mayer, H. Thermal comfort in an east–west oriented street canyon in Freiburg (Germany) under hot summer conditions. Theor. Appl. Climatol. 2007, 87, 223–237. [Google Scholar] [CrossRef]
- Chen, Y.C.; Lin, P.H.; Matzarakis, A. Vertical variability of thermal comfort in urban areas: The example of Taipei 101. Meteorol. Z. 2013, 22, 753–759. [Google Scholar] [CrossRef]
- Chapman, L.; Thornes, J.E. Real-time sky-view factor calculation and approximation. J. Atmos. Ocean. Technol. 2004, 21, 730–741. [Google Scholar] [CrossRef]
- Jamei, E.; Rajagopalan, P.; Seyedmahmoudian, M.; Jamei, Y. Review on the impact of urban geometry and pedestrian level greening on outdoor thermal comfort. Renew. Sustain. Energy Rev. 2016, 54, 1002–1017. [Google Scholar] [CrossRef]
- Potchter, O.; Cohen, P.; Lin, T.P.; Matzarakis, A. Outdoor human thermal perception in various climates: A comprehensive review of approaches, methods and quantification. Sci. Total Environ. 2018, 631, 390–406. [Google Scholar] [CrossRef]
- Huang, F.; Jiang, S.; Zhan, W.; Bechtel, B.; Liu, Z.; Demuzere, M.; Huang, Y.; Xu, Y.; Ma, L.; Xia, W.; et al. Mapping local climate zones for cities: A large review. Remote Sens. Environ. 2023, 292, 113573. [Google Scholar] [CrossRef]
- Lederbogen, F.; Kirsch, P.; Haddad, L.; Streit, F.; Tost, H.; Schuch, P.; Wüst, S.; Pruessner, J.C.; Rietschel, M.; Deuschle, M.; et al. City living and urban upbringing affect neural social stress processing in humans. Nature 2011, 474, 498–501. [Google Scholar] [CrossRef]


| Research Platform | Total Articles in the First Search | Selected Titles | Rejected Titles |
|---|---|---|---|
| Scopus | 36 | 16 | 20 |
| Connected Papers | 196 | 82 | 114 |
| Science Direct | 756 | 275 | 481 |
| Total | 988 | 373 | 615 |
| Abstracts evaluated in each platform | Total Abstract evaluated | Selected Abstracts | Rejected Abstracts |
| Scopus | 16 | 14 | 2 |
| Connected Papers | 75 | 41 | 34 |
| Science Direct | 275 | 63 | 212 |
| Total | 364 | 118 | 248 |
| Articles selected for full reading | Articles selected for full reading | Articles selected for full reading (%) | Articles selected for full reading (%) |
| Scopus | 14 | 14.0 | 14.0 |
| Connected Papers | 36 | 36.0 | 36.0 |
| Science Direct | 50 | 50.0 | 50.0 |
| Total | 100 | 100.0 | 100.0 |
| Seasons | Total Searches | % Occurrence |
|---|---|---|
| Summer | 65 | 65.0 |
| Winter | 2 | 2.0 |
| Autumn | 1 | 1.0 |
| Spring | 1 | 1.0 |
| Summer/Winter | 20 | 20.0 |
| Summer/Winter/Autumn | 2 | 2.0 |
| Summer/Spring | 1 | 1.0 |
| All Seasons | 6 | 6.0 |
| Undefined | 2 | 2.0 |
| Total | 100 | 100.0 |
| Types of Simulations | Description |
|---|---|
| Software simulation | Software models were used, in which the settings of a canyon were defined as defined parameters, with settings defined by the researcher. such as height, shape, orientation, construction form. |
| Canyon simulation | Software models were used in known canyons. Calibrated the parameters of these canyons. |
| Simulation of different points in canyons | Simulation was performed in different canyons and different points for modeling the simulation of human thermal comfort through software with defined parameters. |
| Different points in canyons | Measurements were carried out in existing canyons. |
| Types of Simulations | City/Country | Description |
|---|---|---|
| Cárdenas-Jirón, L. A., Graw, K., Gangwisch, M., and Matzarakis, A. (2023). [1] | Santiago Chile | The current investigation included two interconnected methods: measurement and simulation. The street orientations were EW, NS, NE-SW, and NW-SE, with H/W ratios of 2.5, 1.5, and 0.5. HTC was calculated using the Physiologically Equivalent Temperature (Pet), Modified Physiologically Equivalent Temperature (mPET), and Universal Thermal Climate Index (Utci). Two urban development proposals were evaluated. The two urban development proposals analyzed revealed equivalent patterns of external thermal conditions, with the exception of H/W = 2.5 in Scheme D. Sun exposure is stronger in the winter at a low H/W ratio, but larger quantities reduce stress. For canyons with more than six stories, the NS street axis is favored over any other orientation, while the second-best option is NW-SE, which is also accessible for neighborhood streets with a maximum of six stories. It is appropriate for canyons with more than ten floors and a street width of 20 m on NE-SW-oriented roadways. |
| Wai, K. M., Yuan, C., Lai, A., and Peter, K. N. (2020). [5] | Hong Kong China | H/W—Recommendations for increasing porosity in tropical and subtropical climates to minimize heat stress estimated by the PET index at pedestrian level. |
| Ali-Toudert, F., Djenane, M., Bensalem, R., and Mayer, H. (2005). [32] | Beni-Isguen Algeria | The Petindex was employed in a study conducted on summer days. Streets with varying H/W dimensions were assessed. On warmer days, streets with more sky coverage produced lower values. |
| Emmanuel, R.; Johansson, E (2006). [33] | Colombo Sri Lanka | On warmer days, the authors used H/W with an examination of the Pet index. More pleasant circumstances were observed in narrow estuaries with towering structures to moderate the heat; because of their proximity to the sea, the sea breeze had a good effect. More compact urban forms with deeper street canyons gave pedestrians shade; however, the authors advised caution because night-time cooling and natural ventilation tend to diminish with increased H/W in residential areas. Deeper canyons have less dispersion of pollutants than shallower canyons, which is a drawback. |
| Ali-Toudert, F., and Mayer, H. (2006). [34] | Ghardaia Algeria | The H/W ratio was employed in the research (H/W = 0.5, 1, 2, and 4) as well as street orientation (EW, NS, NE-SW, and NW-S). Findings: The thermal environment is quite demanding and almost fully independent of orientation for broad streets (H/W = 0.5). In the case of EW orientation, it is significantly more stressful. The combination of NS orientation and a high aspect ratio equal to or more than H/W = 2 results in a much-improved thermal environment with lower Pet maxima and markedly shorter times of high stress. Because wall shading is more effective in these situations, NE-SW or NW-SE street orientations give better comfort conditions for the same aspect ratio H/W = 2. |
| Ma, X., Fukuda, H., Zhou, D., Gao, W., and Wang, M. (2019). [35] | Tai Zhou China | H/W and SVF were used. A thermal calendar for tourist visitation is presented, which demonstrates that the entire region is not pleasant for visiting from 8:00 a.m. to 6:00 p.m. in summer. The results show that a deeper canyon (increasing building height: ratio constituted of a high Height × Width ratio (H/W) and a reduced Sky View Factor (SVF)) correlates with a lower level of Pet throughout the day. In severe heat, the combination of morphological tactics and increased plant cover results in more visits in the mornings (between 8:00 and 11:00 a.m.) and after 6:00 p.m. |
| Jamei, E., and Rajagopalan, P. (2017). [36] | Melbourne Australia | SVF and H/W were used. The aim of the “Melbourne Plan” was to increase human thermal comfort. In deeper canyons with higher aspect ratios and lower Sky View Factors, in the future scenario, the mean radiant temperature was 42.0–64.0 °C and in the current scenario, the mean radiant temperature was (49.0–64.0 °C) 0–60.0 °C, which were shown to contribute to a lower level of mean radiant temperatures. The “Increased building height” scenario improved the Physiological Equivalent Temperature (Pet) by 1.0–4.0 °C. The study also found that changing the ratio of H/W was the most effective technique for reducing Tmrt and Pet during the day. |
| Chatzidimitriou, A., and Yannas, S. (2017). [37] | Thessaloniki Greece | H/W and street orientation were used. Findings: Because their axis is diagonal to the prevailing winds, NS and EW canyons with high aspect ratios are preferred for combining summer sun protection with winter wind protection. If there is an efficient presence of vegetation, aspect ratios between 1.0 and 2.0 appear to be the most advantageous for thermal comfort in NW-SE and NE-SW canyons. |
| Rodríguez-Algeciras, J., Tablada, A., and Matzarakis, A. (2018). [38] | Camagüey Cuba | H/W and street direction. Principal findings: The street orientations with the least amount of heat stress hours have high facade profiles—NS, NE-SW, EW, and SE-NW. Thermal stress is greatest in EW canyons, with high Pet values near 36.0 °C. |
| Bochenek, A., and Klemm, K. (2020). [39] | Lotz Poland | Set, Pmv, Pet, and Utci were all evaluated. The NS and EW canyons were mostly characterized by “cold” and “slightly cool” temperatures. |
| Gaber, N., Ibrahim, A., Rashad, A. B., Wahba, E., El-Sayad, Z., and Bakr, A. F. (2020). [40] | Alexandria Egypt | Based on a case study in a dense historic urban neighborhood, the paper reports on measurements and simulation findings in a street canyon aligned perpendicular to the prevailing wind. It is a coastal city; however, it has nothing to do with the shore. |
| Krüger, E. L., Minella, F. O., and Rasia, F. (2011). [41] | Curitiba Brazil | The influence of urban geometry was evaluated using the SVF to describe the urban environment and the Pet index. In the SVF analysis, it was discovered that on days with higher temperatures, sites with less blockage of the sky, that is, with a higher SVF value, lead to increased heat pain. Wind speed analysis showed that in subtropical locations like the research area, excessive wind speeds during winter might induce thermal discomfort for walkers. |
| Ma, X., Fukuda, H., Zhou, D., and Wang, M. (2019). [42] | Foshan China | On the warmest day of the year, they measured travelers’ thermal sensations in the microclimate of the commercially vital pedestrian zone. Seven separate evaluation points were used. During the day, from 10 a.m. to 7 p.m., none of the selected sites were inside the Pet index comfort zone; moreover, in the early morning (8 a.m. to 10 a.m.), all points were pleasant, with the exception of the point with the most open sun access. According to the authors, some ideas for managers and designers based on prior studies that might increase thermal comfort for visitors in connection to open areas are as follows: (A) Increase the average height of buildings to provide greater shade and reduce radiation for tourists. (B) Increase the rate of tree and grass cover to increase cooling and minimize thermal stress. (C) Reduce the rate of paved ground covering to alleviate thermal stress. |
| Kakon, A. N., Nobuo, M., Kojima, S., and Yoko, T. (2010). [43] | Dhaka Bangladesh | The Temperature Humidity Index (THI) was used to investigate the influence of high buildings on outdoor thermal comfort during the day in summer. The authors utilized an existent urban canyon as well as a canyon model with increased building height (H/W increased and SVF lowered). Because the air temperature in the canyon reduced to some amount as the building’s height increased, the Thi became more pleasant as the building’s height increased. The temperature lowered and wind speed increased (H/W increased and SVF decreased) at certain hours of the day. The authors note that increasing building height can provide better HTC conditions up to a limit, depending on if there are thermal challenge circumstances to do with urbanization, particularly in densely populated places. |
| Lee, H., Mayer, H., and Kuttler, W. (2020). [44] | Freiburg Germany | The Pet index was utilized to simulate pedestrian-focused human thermal comfort scenarios on the tree-lined sidewalks of a shallow and deep EW roadway canyon. The gain in thermal comfort was larger in areas with smaller tree spacing (better canopy coverage). The shallow street canyon (H/W = 0.5) had greater HTC mitigation than the deep one (H/W = 2.0). |
| Abdelhafez, M. H. H., Altaf, F., Alshenaifi, M., Hamdy, O., and Ragab, A. (2022). [45] | Alexandria and Aswan Egypt | Aspect ratios (H/W) and street canyon orientations, as well as Physiological Equivalent Temperature (Pet), were determined in Alexandria and Aswan, Egypt. The ratios H/W = 2.5 and H/W = 2 in all indicated street canyon orientations in both cities can provide the highest degrees of thermal comfort. |
| Abd Elraouf, R., Elmokadem, A., Megahed, N., Eleinen, O. A., and Eltarabily, S. (2022). [46] | Harbin China | Three typical communities were explored, each with a distinct urban density and traffic layout. Three areas were chosen to symbolize the core area’s shared roles and layout: the historic low-rise commercial pedestrian strip (the modern high-rise shopping center, and a medium-sized residential neighborhood). The results showed that the higher the H/W, the greater the comfort level (models with H/W = 2.5 are superior to those with H/W = 1.5 and 1). For street orientations that give shade and the lowest Tmrt, as well as the direction of prevailing breezes, the comfort level can be increased (NS and NW-SE are the most favored street orientations, whereas EW is a poorer orientation than NE-SW). |
| Abdollahzadeh, N., and Biloria, N. (2021). [47] | Liverpool Australia | The purpose of this research was to assess the thermal efficiency of roadways in residential neighborhoods in a subtropical environment in order to increase the Pet index. Street orientation (NS, EW, NE-SW, SE-NW), aspect ratio (0.5, 1, 1.5, 2), building type, and surface coverage were all simulated using computer techniques. The results show that street canyon direction (46.42%), followed by percentage (30.59%), is the most influential component. |
| Abdallah, A. S. H., and Mahmoud, R. M. A. (2022). [48] | New Assiut Egypt | External characteristics in various canyon proportions ranging from 0.24 to 0.6 H/W, as well as modeling of covering with grass, trees, and semi-shade (50%). Outdoor areas in deep canyons accomplish a significant Pet reduction with an H/W ratio of 0.6 compared to shallow canyons with an H/W ratio of 0.24. The three hybrid scenarios that involve the addition of grass, trees, and semi-shade might lower the temperature of the deep canyon by 19.10 °C, 15.0 °C, and 13.6°C, respectively. With an H/W ratio of 0.24, increasing trees or semi-shading by 50% might lower Pet by 17.1 °C and 17.5 °C, respectively. |
| Kim, Y. J., and Brown, R. D. (2021). [49] | New York USA | For pedestrian transect measurements with urban morphology employing H/W and SVF, the human body in Comfort Formula (COMFA index) was employed. The majority of the most thermally unpleasant locations were spatially paired with roadway segments with high SVFs, low H/W ratios, less greenery, and low-density blocks. Thermal stress was quite high on streets with high SVFs, low H/W ratios, and less vegetation with low-density blocks. Terrestrial radiation from walls and the ground surface was the main contribution to thermal loads at the pedestrian level in a deep canyon. |
| Li, Z., Zhang, H., Juan, Y. H., Wen, C. Y., and Yang, A. S. (2022). [50] | Hong Kong China | The effects of horizontal and vertical setbacks on external thermal comfort and air quality were studied concurrently in an urban canyon of low-rise (H/W = 1) and tall (H/W = 2) buildings. The main results were that horizontal setback improves average wind speed at pedestrian level to leeward in the low street canyon (H/W = 1). Furthermore, the average concentration of pollutants on both sides (windward and leeward) at pedestrian level can be lowered by up to 61%. In order to create better outdoor ecosystems, buildings with vertical setbacks are better adapted to canyons. |
| Vassiliades, C., Savvides, A. and Buonomano, A. (2022). [51] | Naples Italy Thessaloniki Greece | As a consequence of the integration of active solar energy systems on existing facades, HTC with Pet in public spaces is being assessed in two coastal towns, Naples and Thessaloniki. The areas are classified using H/W and the direction of the street facade. The effect findings on thermal comfort were better in both cities around the spring equinox. In the summer and fall, Naples has higher heat pain, but Thessaloniki has more vertical shade systems. In the winter, Naples offers better comfort conditions, but Thessaloniki has dismal results. The North–South Street axis is the finest category for both cities. |
| Acero, J. A., Koh, E. J., Ruefenacht, L. A., and Norford, L. K. (2021). [52] | Singapore Singapore | There were 21 scenarios studied, with four H/W ratios (1.5, 2.5, 3, and 3.5) and four distinct street axis orientations (NS, N E-SW, EW, NW-SE). The greatest outcomes for HTC were for H/W ratios between (2.5–3) and on streets with an NS direction, whereas streets with NE-SW orientation caused the most discomfort. |
| Al Haddid, H., and Al-Obaidi, K. M. (2022). [53] | Cardiff and Bristol England | The research concentrated on three unique H/W canyons in Cardiff and Bristol: Deep, Shallow, and Even. Summer Pet values are lower in the specified H/W and SVF settings, according to the results. In the winter, there was an inverse relationship between H/W and SVF, indicating considerable cold stress. |
| Mahmoud, H., Ghanem, H., and Sodoudi, S. (2021). [54] | Aswan Egypt | The Pet index was developed to assess thermal comfort in open areas in five metropolitan shapes and diverse geometric circumstances. H/W aspect ratios of 1, 2, and 4 were given to both NS and EW street orientations, with SVF ranging from 0.05 to 0.26. Thermal comfort was addressed through the development of strategies. The findings show that HTC mitigation techniques work at the pedestrian level in all circumstances. |
| Abreu-Harbich, L. V., Labaki, L. C., and Sampaio, V.H.P., Labaki, L, C., Matzarakis, A. (2014). [55] | Campinas Brazil | In a typical summer scenario, pedestrians passing through two urban canyons were questioned. The preference of pedestrians in this situation was connected to strolling through shady settings within the urban canyon. In hot weather, wind speed and the quantity of covered space were linked to higher HTC. |
| Boumaraf, H., and Amireche, L. (2021). [56] | Biskra Algeria | The behavior of individuals in diverse metropolitan contexts in summer and winter was studied using interviews and filming. The study’s key conclusion was that pedestrians spent less time in open surroundings when they were most uncomfortable, both in the cold and in the heat. |
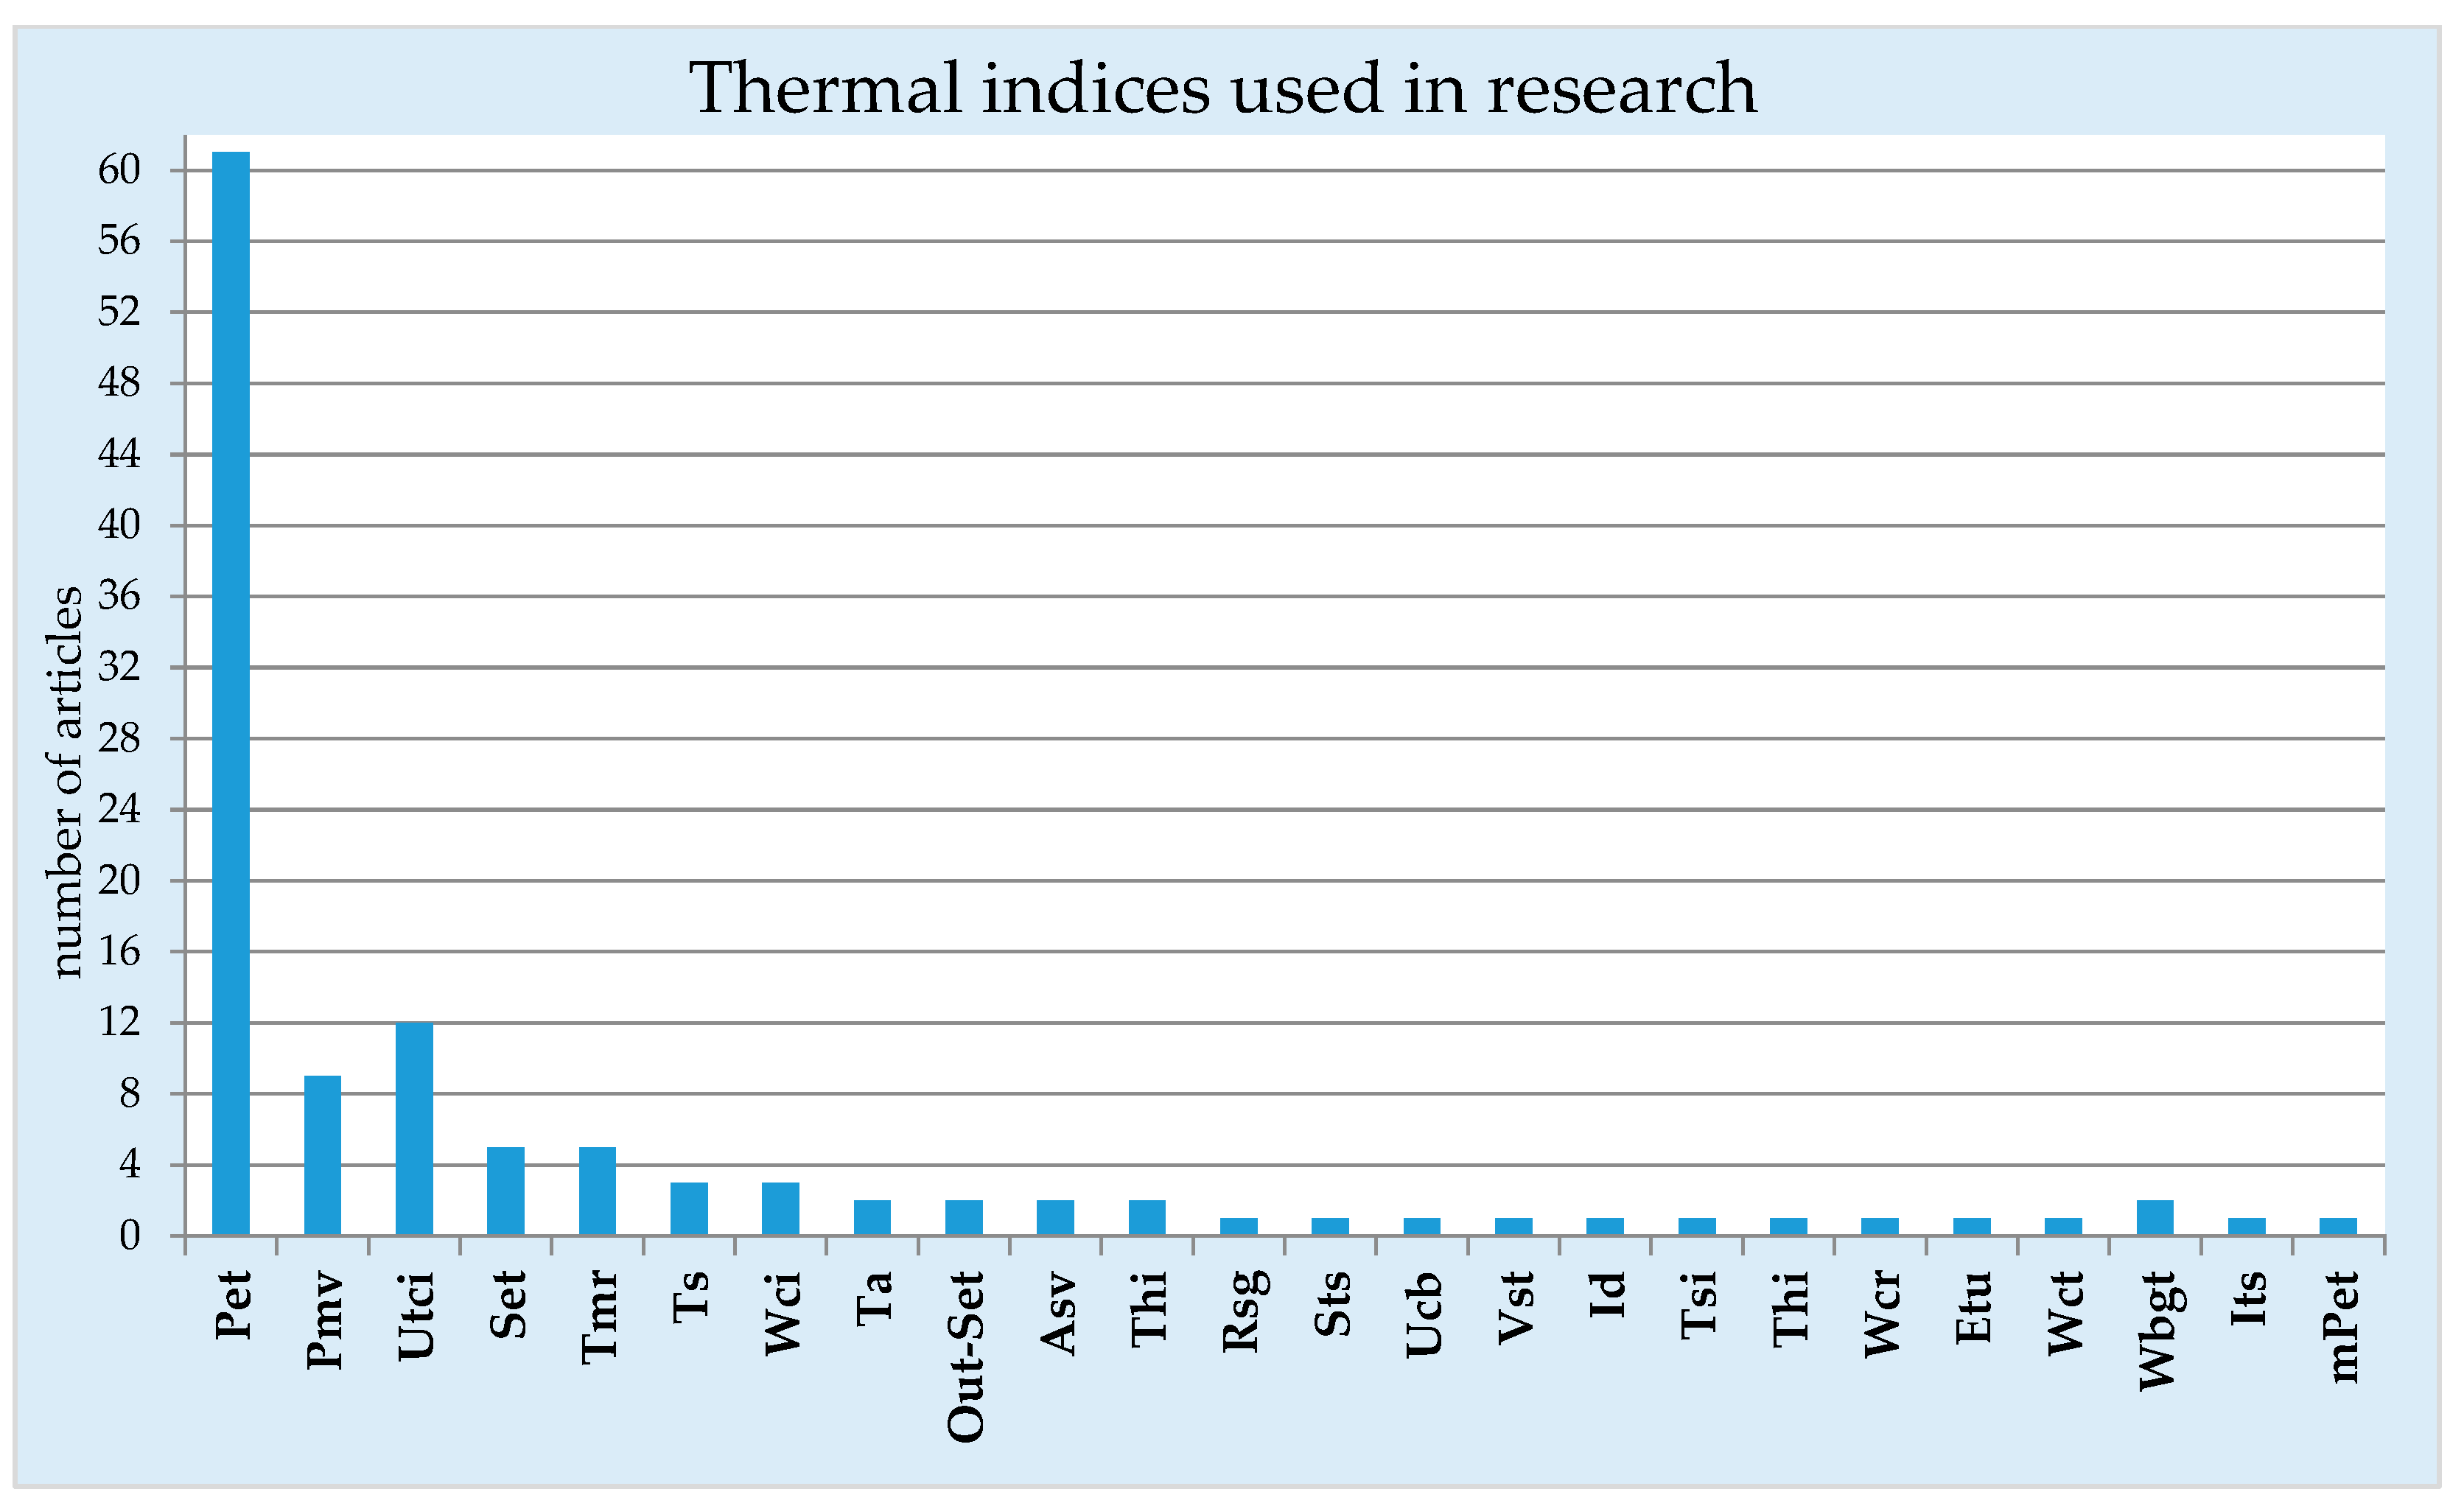
| Acronyms | Meaning | References Based on Some of the Articles Evaluated in the Systematic Review |
|---|---|---|
| Asv | Actual Sensation Vote | Lamarca, C., Qüense, J., and Henríquez, C. (2018) [57] |
| Etu | Universal effective temperature | Watanabe, S., Nagano, K., Ishii, J., and Horikoshi, T. (2014) [58] |
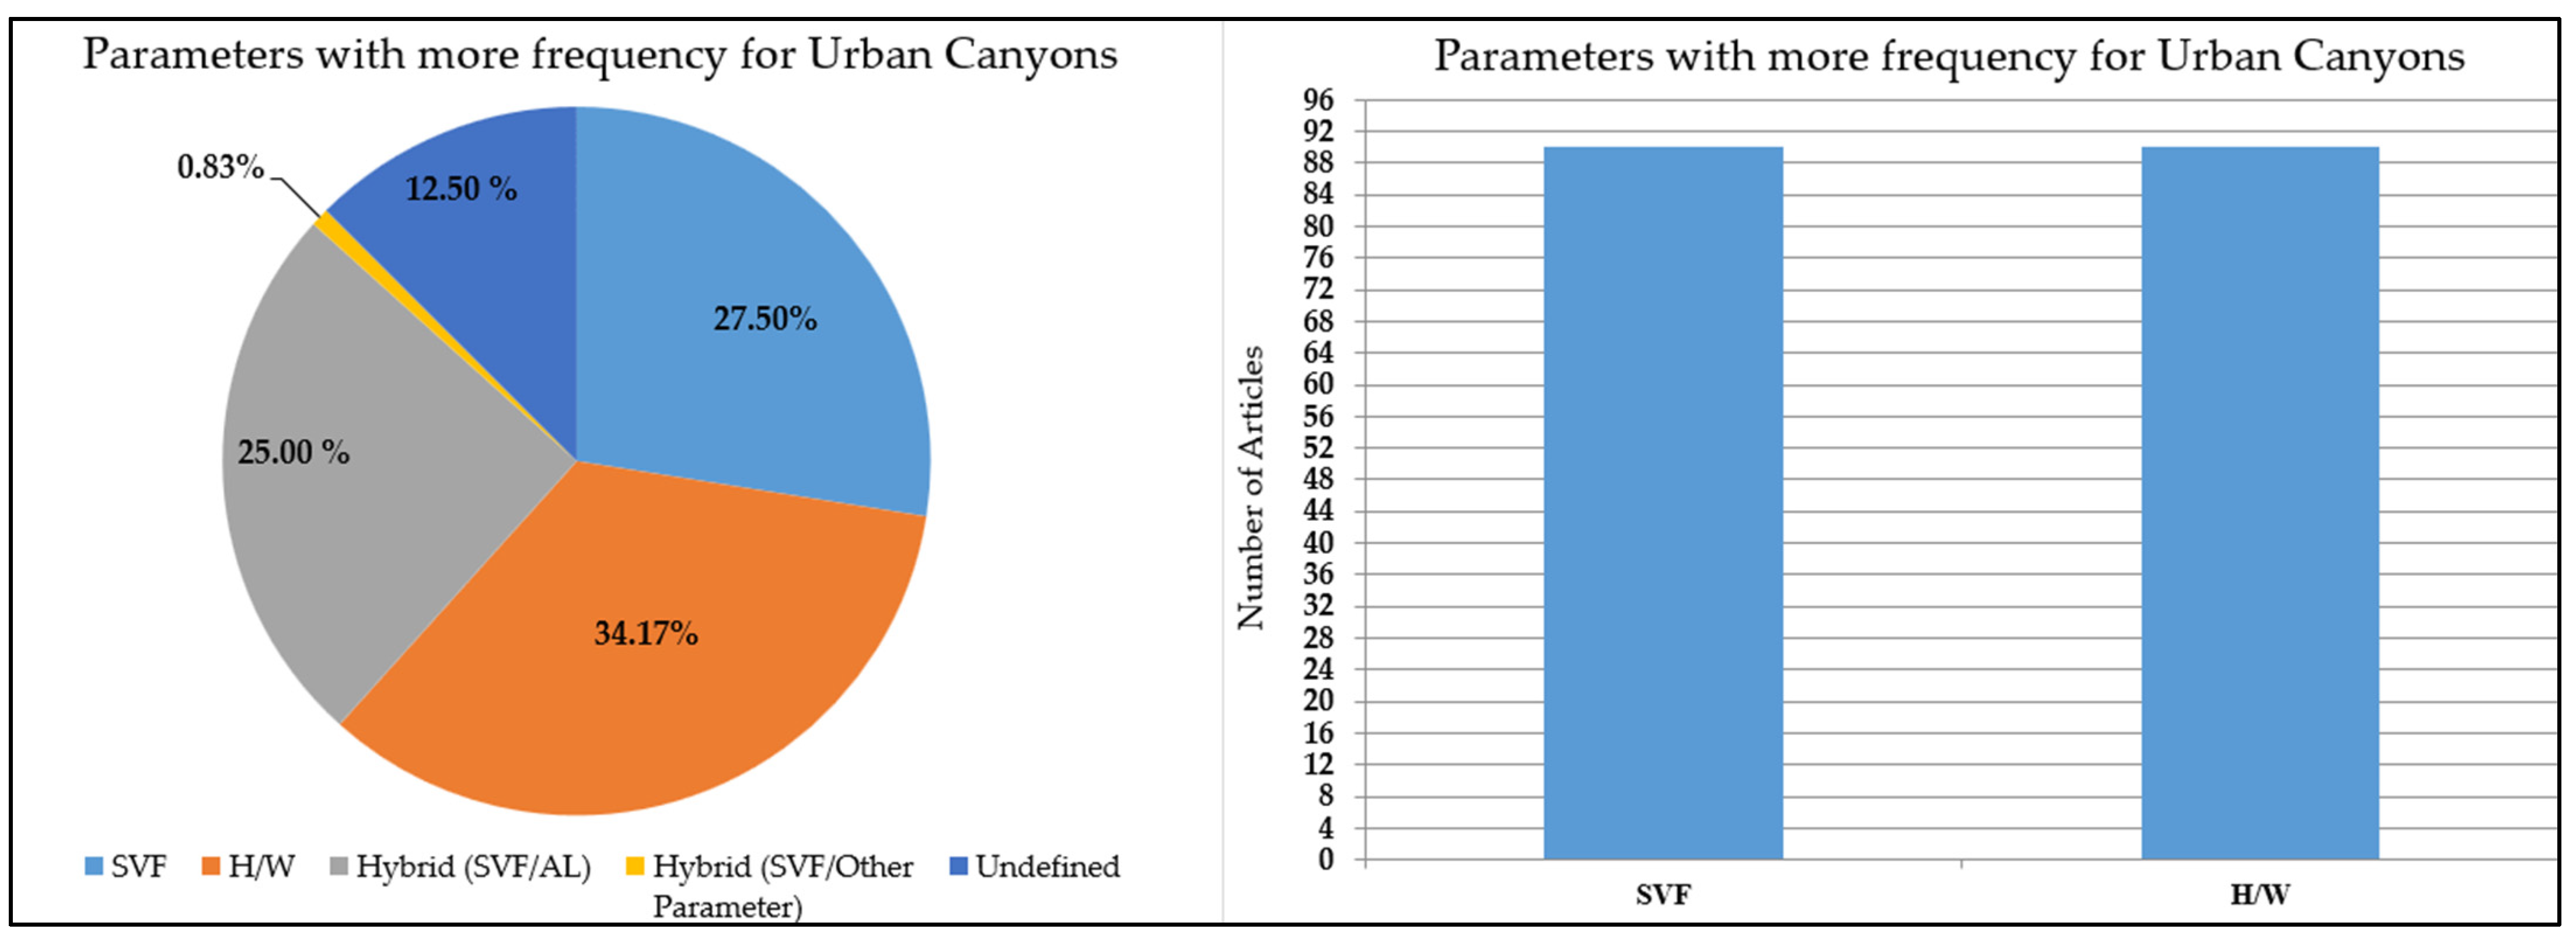
| H/W | Height × Width Ratio | Jamei, E., and Rajagopalan, P. (2017) [36]; Johansson. (2006) [59]; Paolini, R., Mainini, A. G., Poli, T., and Vercesi, L. (2014) [60]; Sun, C., Lian, W., Liu, L., Dong, Q., and Han, Y. (2022) [61]; Athamena, K. (2022) [62] |
| Id | Discomfort Index | Din, M. F. M., Lee, Y. Y., Ponraj, M., Ossen, D. R., Iwao, K., and Chelliapan, S. (2014) [63] |
| Its | Heat stress index | Gadish, I., Saaroni, H., and Pearlmutter, D. (2023) [64] |
| Lcz | Local Climate zone | Lau, K. K. L., Chung, S. C., and Ren, C. (2019) [65]; Gadish, I., Saaroni, H., & and Pearlmutter, D. (2023) [64]; Yan, H., Wu, F., Nan, X., Han, Q., Shao, F., and Bao, Z. (2022) [66]; |
| mPet - | Modified Physiologically equivalent temperature | Cárdenas-Jirón, L. A., Graw, K., Gangwisch, M., and Matzarakis, A. (2023) [1] |
| Pet | Physiologically equivalent temperature | Chatzidimitriou, A., and Yannas, S. (2017) [37]; Krüger, E. L., and Rossi, F. A. (2011) [41]; Deevi, B., &and Chundeli, F. A. (2020) [67]; Kim, Y. J., & and Brown, R. D. (2021) [49]; Abreu-Harbich, L. V., Labaki, L. C., and Sampaio, V.H.P., Labaki, L, C., Matzarakis, A.(2014) [55] |
| Out-Set | Standard Effective Temperature | Watanabe, S., Nagano, K., Ishii, J., and Horikoshi, T. (2014) [58] |
| Pmv | Predicted Mean Vote | Jihad, A. S., and Tahiri, M. (2016) [68]; Gaber, N., Ibrahim, A., Rashad, A. B., Wahba, E., El-Sayad, Z., and Bakr, A. F. (2020) [40]; Limona, S.S, Al-hagla, K. S., and El-sayad, Z. T. (2019) [69] |
| Ptci | Perceptual thermal comfort index | Lamarca, C., Qüense, J., and Henríquez, C. (2018) [57] |
| Rsg | Global Solar Radiation | Hwang, R. L., Lin, T. P., and Matzarakis, A. (2011) [70]; Yin, S., Lang, W., and Xiao, Y. (2019) [71]; Chen, L., Yu, B., Yang, F., and Mayer, H. (2016) [72] |
| Set | Standard Effective Temperature | Bochenek, A., and Klemm, K. (2020) [39]; Rosheidat, A., Hoffman, D., and Bryan, H. (2008) [73]; Ali-Toudert, F., Djenane, M., Bensalem, R., Mayer, H. (2005) [32] |
| SVF | Sky View Factor | Ma, X., Fukuda, H., Zhou, D., Gao, W., and Wang, M. (2019) [42]; Jamei, E., and Rajagopalan, P. (2017) [36]; Bochenek, A., and Klemm, K. (2020) [39]; Rosheidat, A., Hoffman, D., and Bryan, H. (2008) [73] |
| Ta | Apparent temperature | Pioppi, B., Pigliautile, I., and Pisello, A. L. (2020) [74] |
| Thi | Temperature-humidity Index | Mirzaei, P. A., and Haghighat, F. (2012) [75]; Kakon, A. N., Nobuo, M., Kojima, S., and Yoko, T [43] |
| Trm | Mean radiant temperature | Boumaraf, H., and Amireche, L. (2021) [56]; Wai, K. M., Yuan, C., Lai, A., and Pe-ter, K. N. (2020) [5] |
| Ucb | Berkeley thermal comfort model | Lee, H., Mayer, H., and Kuttler, W. (2020) [44]; Huang, K. T., and Li, Y. J. (2017) [9] |
| Utci | Universal Thermal Climate Index | Paolini, R., Mainini, A. G., Poli, T., and Vercesi, L. (2014) [60]; Deevi, B., and Chundeli, F. A. (2020) [67]; Latini, G., Grifoni, R. C., and Tascini, S. (2010) [76]; Krüger, E. (2017) [77]; Croce, S., D’Agnolo, E., Caini, M., and Paparella, R. (2021) [78] |
| Vcg | Vote of general comfort | Yao, J., Yang, F., Zhuang, Z., Shao, Y., and Yuan, P. F. (2018) [79] |
| Vst | Thermal sensation votes | Yao, J., Yang, F., Zhuang, Z., Shao, Y., and Yuan, P. F. (2018) [79] |
| Wbgt | Wet Bulb Globe Temperature | Deng, X., Cao, Q., Wang, L., Wang, W., Wang, S., and Wang, L. (2022) [80] |
| Wci | Wind Chill Index | Mirzaei, P. A., and Haghighat, F. (2012) [75] |
| Wct | Wind chill temperature | Liu, Y., Jin, H., and Xu, X. (2019) [81] |
Disclaimer/Publisher’s Note: The statements, opinions and data contained in all publications are solely those of the individual author(s) and contributor(s) and not of MDPI and/or the editor(s). MDPI and/or the editor(s) disclaim responsibility for any injury to people or property resulting from any ideas, methods, instructions or products referred to in the content. |
© 2024 by the authors. Licensee MDPI, Basel, Switzerland. This article is an open access article distributed under the terms and conditions of the Creative Commons Attribution (CC BY) license (https://creativecommons.org/licenses/by/4.0/).
Share and Cite
Costa, I.T.; Wollmann, C.A.; Writzl, L.; Iensse, A.C.; da Silva, A.N.; de Freitas Baumhardt, O.; Gobo, J.P.A.; Shooshtarian, S.; Matzarakis, A. A Systematic Review on Human Thermal Comfort and Methodologies for Evaluating Urban Morphology in Outdoor Spaces. Climate 2024, 12, 30. https://doi.org/10.3390/cli12030030
Costa IT, Wollmann CA, Writzl L, Iensse AC, da Silva AN, de Freitas Baumhardt O, Gobo JPA, Shooshtarian S, Matzarakis A. A Systematic Review on Human Thermal Comfort and Methodologies for Evaluating Urban Morphology in Outdoor Spaces. Climate. 2024; 12(3):30. https://doi.org/10.3390/cli12030030
Chicago/Turabian StyleCosta, Iago Turba, Cassio Arthur Wollmann, Luana Writzl, Amanda Comassetto Iensse, Aline Nunes da Silva, Otavio de Freitas Baumhardt, João Paulo Assis Gobo, Salman Shooshtarian, and Andreas Matzarakis. 2024. "A Systematic Review on Human Thermal Comfort and Methodologies for Evaluating Urban Morphology in Outdoor Spaces" Climate 12, no. 3: 30. https://doi.org/10.3390/cli12030030