Next Issue
Volume 12, April
Previous Issue
Volume 12, February


Climate, Volume 12, Issue 3 (March 2024) – 19 articles

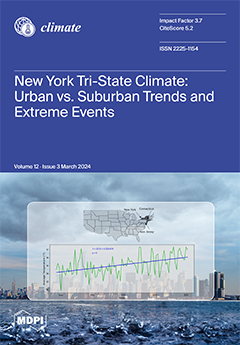
Cover Story (view full-size image): This study examines temperature and precipitation from 44 New York, New Jersey, and Connecticut weather stations to identify climatic changes. It analyzes trends, focusing on stations representing diverse climates, especially comparing urban vs. suburban areas like New York City. Findings show an overall rise in average temperatures, more pronounced in urban areas, with a significant increase in spring. This indicates climate change's growing impact. Urban regions, particularly New York City, also see more heat waves and less snowfall, aligning with the warming trend. The research suggests that temperature fluctuations are stabilizing over time. This highlights the need for further analysis of spatial precipitation trends and the varying impacts of climate change on urban and rural areas. View this paper
  • Issues are regarded as officially published after their release is announced to the table of contents alert mailing list.
  • You may sign up for e-mail alerts to receive table of contents of newly released issues.
  • PDF is the official format for papers published in both, html and pdf forms. To view the papers in pdf format, click on the "PDF Full-text" link, and use the free Adobe Reader to open them.
Order results
Result details
Section
Select all
Export citation of selected articles as:
17 pages, 1174 KiB  
Perspective
A Move towards Developing Usable Climate Change Adaptation and Mitigation Services for the Agricultural Sector
by Mokhele E. Moeletsi and Mitsuru Tsubo
Climate 2024, 12(3), 46; https://doi.org/10.3390/cli12030046 - 20 Mar 2024
Viewed by 1072
Abstract
Dryland farming is at the center of increasing pressure to produce more food for the growing population in an environment that is highly variable and with high expectations for the standard of their production systems. While there is mounting pressure for increased productivity, [...] Read more.
Dryland farming is at the center of increasing pressure to produce more food for the growing population in an environment that is highly variable and with high expectations for the standard of their production systems. While there is mounting pressure for increased productivity, the responsibility to protect the environment and diminish the agricultural sector’s carbon footprint is receiving growing emphasis. Achieving these two goals calls for a consolidated effort to ensure that the scientific community and service providers partner with farmers to create a sustainable food production system that does not harm the environment. In this paper, we studied the nature of the services present in the market and identified ways that could be used to improve the climate services available to the agricultural sector. Important factors that could increase the usability of climate services include coproduction, context-specific information, innovation, demand-driven services, timeliness of services, highly applicable information, provision of services in the correct format, services that increase user experience, specificity of services to a locale, and services that are easily accessible. Full article
(This article belongs to the Section Climate Adaptation and Mitigation)
Show Figures

Figure 1

19 pages, 8555 KiB  
Article
Temporal and Spatial Analyses of Forest Burnt Area in the Middle Volga Region Based on Satellite Imagery and Climatic Factors
by Eldar Kurbanov, Oleg Vorobev, Sergei Lezhnin, Denis Dergunov, Jinliang Wang, Jinming Sha, Aleksandr Gubaev, Ludmila Tarasova and Yibo Wang
Climate 2024, 12(3), 45; https://doi.org/10.3390/cli12030045 - 17 Mar 2024
Viewed by 1215
Abstract
Wildfires are important natural drivers of forest stands dynamics, strongly affecting their natural regeneration and providing important ecosystem services. This paper presents a comprehensive analysis of spatiotemporal burnt area (BA) patterns in the Middle Volga region of the Russian Federation from 2000 to [...] Read more.
Wildfires are important natural drivers of forest stands dynamics, strongly affecting their natural regeneration and providing important ecosystem services. This paper presents a comprehensive analysis of spatiotemporal burnt area (BA) patterns in the Middle Volga region of the Russian Federation from 2000 to 2022, using remote sensing time series data and considering the influence of climatic factors on forest fires. To assess the temporal trends, the Mann–Kendall nonparametric statistical test and Theil–Sen’s slope estimator were applied using the LandTrendr algorithm on the Google Earth Platform (GEE). The accuracy assessment revealed a high overall accuracy (>84%) and F-score value (>82%) for forest burnt area detection, evaluated against 581 reference test sites. The results indicate that fire occurrences in the region were predominantly irregular, with the highest frequency recorded as 7.3 over the 22-year period. The total forest BA was estimated to be around 280 thousand hectares, accounting for 1.7% of the land surface area or 4.0% of the total forested area in the Middle Volga region. Coniferous forest stands were found to be the most fire-prone ecosystems, contributing to 59.0% of the total BA, while deciduous stands accounted for 25.1%. Insignificant fire occurrences were observed in young forests and shrub lands. On a seasonal scale, temperature was found to have a greater impact on BA compared with precipitation and wind speed. Full article
(This article belongs to the Special Issue Forest Ecosystems under Climate Change)
Show Figures

Figure 1

15 pages, 10876 KiB  
Article
Safe Sowing Windows for Smallholder Farmers in West Africa in the Context of Climate Variability
by Sehouevi Mawuton David Agoungbome, Marie-Claire ten Veldhuis and Nick van de Giesen
Climate 2024, 12(3), 44; https://doi.org/10.3390/cli12030044 - 17 Mar 2024
Viewed by 1206
Abstract
Climate variability poses great challenges to food security in West Africa, a region heavily dependent on rainfall for farming. Identifying sowing strategies that minimize yield losses for farmers in the region is crucial to securing their livelihood. In this paper, we investigate three [...] Read more.
Climate variability poses great challenges to food security in West Africa, a region heavily dependent on rainfall for farming. Identifying sowing strategies that minimize yield losses for farmers in the region is crucial to securing their livelihood. In this paper, we investigate three sowing strategies to assess their ability to identify safe sowing windows for smallholder farmers in the Sudanian region of West Africa (WA) in the context of a changing climate. The GIS version of the FAO crop model, AquaCrop-GIS, is used to simulate the yield response of maize (Zea mays L.) to varying sowing dates throughout the rainy season across WA. Based on an average of 38 years of data per grid cell, we identify safe sowing windows across the Sudanian region that secure at least 90% of maximal yield. We find that current sowing strategies, based on minimum thresholds for rainfall accumulated over a period that are widely applied in the region, carry a higher risk of yield failure, especially at the beginning of the rainy season. This analysis shows that delaying sowing for a month to mid-June in the central region (east of Lon 8.5°W), and to early August in the semi-arid areas is a safer strategy that ensures optimal yields. A comparison between the periods 1982–1991 and 1992–2019 shows a negative shift for LO10 mm and LO20 mm, suggesting a wetter regime compared to the dry periods of the 1970s and 1980s. On the contrary, we observe a positive shift in the safe window strategy, highlighting the need for precautions due to erratic rainfall at the beginning of the season. The precipitation-based strategies hold a high risk, while the safe sowing window strategy, easily accessible to smallholder farmers, is more fitting, given the current climate. Full article
Show Figures

Figure 1

17 pages, 3026 KiB  
Article
Space–Time Characterization of Extreme Precipitation Indices for the Semiarid Region of Brazil
by Ana Letícia Melo dos Santos, Weber Andrade Gonçalves, Lara de Melo Barbosa Andrade, Daniele Tôrres Rodrigues, Flávia Ferreira Batista, Gizelly Cardoso Lima and Cláudio Moisés Santos e Silva
Climate 2024, 12(3), 43; https://doi.org/10.3390/cli12030043 - 13 Mar 2024
Viewed by 1447
Abstract
Various indices of climate variability and extremes are extensively employed to characterize potential effects of climate change. Particularly, the semiarid region of Brazil is influenced by adverse effects of these changes, especially in terms of precipitation. In this context, the main objective of [...] Read more.
Various indices of climate variability and extremes are extensively employed to characterize potential effects of climate change. Particularly, the semiarid region of Brazil is influenced by adverse effects of these changes, especially in terms of precipitation. In this context, the main objective of the present study was to characterize the regional trends of extreme precipitation indices in the semiarid region of Brazil (SAB), using daily precipitation data from the IMERG V06 product, spanning the period from 1 January 2001 to 31 December 2020. Twelve extreme precipitation indices were considered, which were estimated annually, and their spatial and temporal trends were subsequently analyzed using the nonparametric Mann–Kendall test and Sen’s slope. The analysis revealed that the peripheral areas of the SAB, especially in the northwest and extreme south regions, exhibited higher intensity and frequency of extreme precipitation events compared to the central portion of the area. However, a negative trend in event intensity was noted in the north, while positive trends were identified in the south. The frequency of extreme events showed a predominance of negative trends across most of the region, with an increase in consecutive dry days particularly throughout the western SAB. The average total precipitation index was above 1000 mm in the north of the SAB, whereas in the central region, the precipitation averages were predominantly below 600 mm, with rainfall intensity values ranging between 6 and 10 mm/day. Over the span of 20 years, the region underwent an average of 40 consecutive dry days in certain localities. A negative trend was observed in most of the indices, indicating a reduction in precipitation intensity in future decades, with variations in some indices. The dry years observed towards the end of the analyzed period likely contributed to the observed negative trends in the majority of extreme precipitation indices. Such trends directly impact the intensity and frequency of extreme weather events in the SAB. The study is important for highlighting and considering the impacts of changes in precipitation extremes in the semiarid region of Brazil. Based on the obtained results, we advocate the implementation of public policies to address future challenges, such as incorporating adaptations in water resource management, sustainable agricultural practices, and planning for urban and rural areas. Full article
Show Figures

Figure 1

21 pages, 2595 KiB  
Review
Impacts of Climate Change Scenarios on the Corn and Soybean Double-Cropping System in Brazil
by Tiago Bigolin and Edson Talamini
Climate 2024, 12(3), 42; https://doi.org/10.3390/cli12030042 - 12 Mar 2024
Viewed by 1592
Abstract
Brazil is one of the main producing and exporting countries of corn and soybean and a continental country with climatic diversity that allows the cultivation of these crops in various agricultural systems. Double cropping is a widely adopted system throughout the national territory, [...] Read more.
Brazil is one of the main producing and exporting countries of corn and soybean and a continental country with climatic diversity that allows the cultivation of these crops in various agricultural systems. Double cropping is a widely adopted system throughout the national territory, where it is possible to cultivate soybeans at the beginning of the growing season, followed by corn in succession, in the same growing season. The present study aims to systematize the scientific knowledge about the impacts of future climate change scenarios on yield and on the double-cropping system of soybean + corn in Brazil. Systematic review procedures were adopted. The soybean yield is projected to increase in all regions of Brazil under all climate scenarios. Corn yields under future climate scenarios are projected to decline, with the subtropical climate region being less affected than the northern regions. The double-cropping systems of soybean + corn tend to present increasing climate risks in tropical climate regions. Climate change scenarios point to a delay in the start of the rainy season that will delay the sowing of soybeans, consequently delaying the sowing of corn in succession, resulting in fewer rainy days to complete its cycle. Full article
Show Figures

Figure 1

33 pages, 6780 KiB  
Article
What Cities Want to Measure: Bottom-Up Selection of Indicators for Systemic Change toward Climate Neutrality Aligned with Sustainable Development Goals (SDGs) in 40 European Cities
by Rohit Mondal, Sabrina Bresciani and Francesca Rizzo
Climate 2024, 12(3), 41; https://doi.org/10.3390/cli12030041 - 08 Mar 2024
Viewed by 1837
Abstract
Cities are taking action to respond to climate change by designing and implementing sustainable solutions which provide benefits and challenges to citizens. Measuring the progress and effects of such actions at the urban level, beyond mere greenhouse gas (GHG) emissions quantification, is still [...] Read more.
Cities are taking action to respond to climate change by designing and implementing sustainable solutions which provide benefits and challenges to citizens. Measuring the progress and effects of such actions at the urban level, beyond mere greenhouse gas (GHG) emissions quantification, is still an emerging research area. Based on data from the 40 European cities belonging to 20 pilot city programmes within the EU-funded NetZeroCities (NZC) project, cities’ selections and preferences for indicators for assessing their climate actions are analysed in relation to the Sustainable Development Goals (SDGs). This study provides bottom-up evidence of cities’ selection of non-GHG indicators through different levers of change, including participatory governance and social innovation, for assessing progress and the co-benefits of actions toward climate neutrality taken at the urban level. The resulting list of indicators, classified according to the SDGs, provides evidence of cities’ priorities and can be utilised by cities’ climate transition teams and also by researchers, as it highlights gaps and opportunities compared to extant literature. Full article
Show Figures

Figure 1

26 pages, 8702 KiB  
Article
Multifaceted Linkages among Eco-Climatic Factors, Plankton Abundance, and Gonadal Maturation of Hilsa Shad, Tenualosa ilisha, Populations in Bangladesh
by Mobin Hossain Shohan, Mohammad Abu Baker Siddique, Balaram Mahalder, Mohammad Mahfujul Haque, Chayon Goswami, Md. Borhan Uddin Ahmed, Mohammad Ashraful Alam, Md. Abul Bashar, Yahia Mahmud, Mahamudul Alam Chowdhury, Md. Mahmudul Hasan and A. K. Shakur Ahammad
Climate 2024, 12(3), 40; https://doi.org/10.3390/cli12030040 - 08 Mar 2024
Viewed by 1767
Abstract
An integrated multivariate approach was applied to gain a deeper understanding of the feeding biology of hilsa shad, Tenualosa ilisha, collected from six different aquatic habitats across Bangladesh. This approach involved linking climatic factors, ecological factors, plankton abundance in water, reproductive traits, [...] Read more.
An integrated multivariate approach was applied to gain a deeper understanding of the feeding biology of hilsa shad, Tenualosa ilisha, collected from six different aquatic habitats across Bangladesh. This approach involved linking climatic factors, ecological factors, plankton abundance in water, reproductive traits, and plankton ingestion data. Climatic data were obtained from the National Oceanic and Atmospheric Administration (NOAA) and Climate Data Online (CDO) databases on a monthly basis. Water quality parameters were observed on-site at various sampling sites. Plankton data from water bodies and hilsa guts were collected monthly from the study areas and analyzed in the laboratory. The results obtained were averaged for each month. The correlation tests, multivariate approaches, cluster analyses, and regression analyses revealed that the gonadosomatic index was primarily influenced by climatic factors, the abundance of ingested gut plankton, and heir compositions. The analysis of selectivity indices confirmed that plankton preferentially ingested selective taxa. Thirteen plankton groups were identified in the water column of six different hilsa habitats. The dominant phytoplankton groups were Bacillariophyceae (34–53%), Chlorophyceae (31–50%), Cyanophyceae (4–8%), and Euglenophyceae (1–3%). Additionally, Copepoda, Rotifera, and Cladocera were the most numerous zooplankton groups. Hilsa shad primarily consumed Bacillariophyceae (38–57%), Chlorophyceae (35–53%), and Cyanophyceae (4–6%). However, they also exhibited selective ingestion of higher quantities of Bacillariophyceae and Chlorophyceae to fulfill specific and unique metabolic needs. Cluster analysis revealed the variability of phytoplankton and zooplankton abundance in water and gut in relation to diverse locations. Combining all the datasets, a principal component analysis (PCA) was applied. The first two principal components explained more than 54% of the variability. The first component explained the association between the gonadosomatic index and eco-climatic factors, while the second component extracted the cluster of ingested gut plankton in relation to salinity and pH. Pearson’s correlations and linear regression analyses showed that the number of gut plankton had a positive influence on the gonadosomatic index (GSI). Finally, the outcomes from these extensive datasets have provided a better understanding of the selective feeding behavior and the influence of feeding biology on the gonadal maturation of T. ilisha. This understanding is likely to be useful for maintaining and improving the growth and productivity of the existing production systems for this transboundary species. Full article
(This article belongs to the Special Issue Climate Impact on Species Composition and Structure)
Show Figures

Figure 1

29 pages, 14175 KiB  
Article
The Importance and Scientific Value of Long Weather and Climate Records; Examples of Historical Marine Data Efforts across the Globe
by Jürg Luterbacher, Rob Allan, Clive Wilkinson, Ed Hawkins, Praveen Teleti, Andrew Lorrey, Stefan Brönnimann, Peer Hechler, Kondylia Velikou and Elena Xoplaki
Climate 2024, 12(3), 39; https://doi.org/10.3390/cli12030039 - 07 Mar 2024
Viewed by 1392
Abstract
The rescue, digitization, quality control, preservation, and utilization of long and high quality meteorological and climate records, particularly related to historical marine data, are crucial for advancing our understanding of the Earth’s climate system. In combination with land and air measurements, historical marine [...] Read more.
The rescue, digitization, quality control, preservation, and utilization of long and high quality meteorological and climate records, particularly related to historical marine data, are crucial for advancing our understanding of the Earth’s climate system. In combination with land and air measurements, historical marine records serve as foundational pillars in linking present and past weather and climate information, offering essential insights into natural climate variability, extreme events in marine areas, baseline data for assessing current changes, and inputs for enhancing predictive climate models and reanalyses. This paper provides an overview of rescue activities covering marine weather data over the past centuries and presents and highlights several ongoing projects across the world and how the data are used in an integrative and international framework. Current and future continuous efforts in data rescue, digitization, quality control, and the development of temporally high-resolution meteorological and climatological observations from oceans, will greatly help to further complete our understanding and knowledge of the Earth’s climate system, including extremes, as well as improve the quality of reanalysis. Full article
(This article belongs to the Special Issue The Importance of Long Climate Records)
Show Figures

Figure 1

15 pages, 1528 KiB  
Article
Climate Change Paradox: The Least Responsible for It Encounters the Most of Its Implications
by Hadi Allafta and Christian Opp
Climate 2024, 12(3), 38; https://doi.org/10.3390/cli12030038 - 06 Mar 2024
Viewed by 1815
Abstract
Carbon dioxide (CO2) emissions are a major cause of climate change. However, CO2 emissions data for 178 countries from 1960 to 2018 revealed inequality in global CO2 emissions. For example, we found that 50% of the world’s population (ca. [...] Read more.
Carbon dioxide (CO2) emissions are a major cause of climate change. However, CO2 emissions data for 178 countries from 1960 to 2018 revealed inequality in global CO2 emissions. For example, we found that 50% of the world’s population (ca. 3.75 billion people) was responsible for just 8.9% of the global cumulative carbon emissions. These people are concentrated in low- and middle-income countries. Conversely, 10% of the world’s population (ca. 757 million people), concentrated in high-income countries, were responsible for 46.8% of the global emissions. Furthermore, the literature review disclosed evolution of CO2 emission inequalities within countries. A significant (p < 0.001) negative (r2 = −0.52) correlation was detected between carbon emissions and climate change impacts on national incomes. Such correlation indicated that countries most likely to experience the greatest effects of climate change are also those who make the smallest contributions to its underlying causes. Similar disparities were observed within countries where low-income groups who make the smallest contributions to climate change are subjected to its worst implications. Evaluations of the data from the literature showed that migration could be the result of climate change, though such migration does not happen in isolation. In other words, this kind of migration is frequently linked to other issues such as the fragility and lack of adaptability of the communities. Furthermore, reviews showed that climate change catalyzes instability and conflict. On the other hand, conflict damages the environment and climate in multiple ways. Therefore, it is necessary to collaborate to resolve these two issues concurrently. Full article
Show Figures

Figure 1

16 pages, 3462 KiB  
Article
Reducing Fossil Fuel Dependence and Exploring Just Energy Transition Pathways in Indonesia Using OSeMOSYS (Open-Source Energy Modelling System)
by Laksmita Dwi Hersaputri, Rudolf Yeganyan, Carla Cannone, Fernando Plazas-Niño, Simone Osei-Owusu, Yiannis Kountouris and Mark Howells
Climate 2024, 12(3), 37; https://doi.org/10.3390/cli12030037 - 04 Mar 2024
Cited by 1 | Viewed by 2034
Abstract
Indonesia’s commitment to the Paris Agreement and its Nationally Determined Contribution (NDC) is not adequately reflected in the significant CO2 emissions from fossil-fuel-intensive energy sectors, despite the enormous potential of renewable energy sources in the country. The ongoing coal regime has led [...] Read more.
Indonesia’s commitment to the Paris Agreement and its Nationally Determined Contribution (NDC) is not adequately reflected in the significant CO2 emissions from fossil-fuel-intensive energy sectors, despite the enormous potential of renewable energy sources in the country. The ongoing coal regime has led to electricity oversupply and air pollution problems. Despite the huge challenges for Indonesia, a just energy transition away from fossil fuel is crucial. This study aims to explore the ideal energy mix and key emission reduction pathway in Indonesia in achieving a just energy transition using the least-cost optimisation energy modelling tool OSeMOSYS. Six scenarios are modelled over the period 2015–2050 including coal phase-out, NDC, the Just Energy Transition Partnership (JETP), and carbon tax implementation. The results highlight that solar power, geothermal power, and hydropower are the alternatives for coal decommissioning. Despite the large-scale investment in renewable energy under the NDC and JETP scenarios, emissions could be reduced by 55% and 52%, respectively, by 2050. Moreover, Indonesia’s current carbon tax rate will not lead to a significant emission reduction. Three recommended policies include (1) accelerating CFPP retirement; (2) imposing an aggressive carbon tax rate; (3) prioritising investment in solar technologies. Full article
Show Figures

Figure 1

12 pages, 246 KiB  
Article
Predictors of Knowledge, Attitudes and Practice Regarding Heat Waves: An Exploratory Cross-Sectional Study in Greece
by Ioannis Moisoglou, Aglaia Katsiroumpa, Antigoni Kolisiati, Evangelia Meimeti, Ioanna Prasini, Maria Tsiachri, Olympia Konstantakopoulou, Parisis Gallos and Petros Galanis
Climate 2024, 12(3), 36; https://doi.org/10.3390/cli12030036 - 03 Mar 2024
Viewed by 1359
Abstract
Heat waves are a significant consequence of climate change, threatening public health by increasing morbidity and mortality. The aim of this study was to estimate individuals’ knowledge, attitudes and practice related to heat waves. We conducted an exploratory cross-sectional study in Greece during [...] Read more.
Heat waves are a significant consequence of climate change, threatening public health by increasing morbidity and mortality. The aim of this study was to estimate individuals’ knowledge, attitudes and practice related to heat waves. We conducted an exploratory cross-sectional study in Greece during September 2023. We employed a convenience sample of 1055 participants. We used the heat wave knowledge, awareness, practice and behavior scale (HWKAPBS) to measure our outcome. We measured several socio-demographic variables, such as gender, age and educational level, as potential determinants. Mean scores for the knowledge, awareness, practice and behavior factors were 12.5, 22.7, 22.2 and 12.1, respectively. Females had higher scores for the four factors compared with males. We found a positive relationship between self-perceived health status and awareness, practice and behavior concerning heat waves. Similarly, we identified a positive relationship between self-perceived financial status, and awareness and behavior concerning heat waves. Increased age was associated with an increased practice score, while increased educational level was associated with an increased knowledge score. Additionally, the behavior score was higher among participants in urban areas than those in rural areas. We found statistically significant positive correlations between the four factors. Levels of knowledge, awareness, practice and behavior concerning heat waves were high in our sample. Several socio-demographic variables affect participants’ knowledge, awareness, practice and behavior concerning heat waves. Full article
25 pages, 5425 KiB  
Article
Global Solar Radiation and Its Interactions with Atmospheric Substances and Their Effects on Air Temperature Change in Ankara Province
by Jianhui Bai, Xiaowei Wan, Erhan Arslan and Xuemei Zong
Climate 2024, 12(3), 35; https://doi.org/10.3390/cli12030035 - 01 Mar 2024
Viewed by 1410
Abstract
On the analysis of solar radiation and meteorological variables measured in Ankara province in Türkiye from 2017 to 2018, an empirical model of global solar radiation was developed. The global solar radiation at the ground and at the top of the atmosphere (TOA) [...] Read more.
On the analysis of solar radiation and meteorological variables measured in Ankara province in Türkiye from 2017 to 2018, an empirical model of global solar radiation was developed. The global solar radiation at the ground and at the top of the atmosphere (TOA) was calculated and in good agreement with the observations. This model was applied to compute the losses of global solar radiation in the atmosphere and the contributions by atmospheric absorbing and scattering substances. The loss of global solar radiation in the atmosphere was dominated by the absorbing substances. The sensitivity test showed that global solar radiation was more sensitive to changes in scattering (described by a scattering factor S/G, S and G are diffuse and global solar radiation, respectively) than to changes in absorption. This empirical model was applied to calculate the albedos at the TOA and the surface. In 2017, 2018, and 2019, the computed albedos were 28.8%, 27.8%, and 28.2% at the TOA and 21.6%, 22.1%, and 21.9% at the surface, which were in reasonable agreement with satellite retrievals. The empirical model is a useful tool for studying global solar radiation and the multiple interactions between solar energy and atmospheric substances. The comparisons of global solar radiation and its loss in the atmosphere, as well as meteorological parameters, were made at some representative sites on the Earth. Some internal relationships (between G and the absorbing and scattering substances, air temperature and atmospheric substances, air temperature increase and latitude, etc.) were found. Thus, it is suggested to thoroughly study solar radiation, atmospheric substances, and climate change as a whole system and reduce the direct emissions of all atmospheric substances and, subsequently, secondary products (e.g., CO2 and non-CO2) in the atmosphere for the achievement of slowing down climate warming. Full article
Show Figures

Figure 1

14 pages, 1581 KiB  
Article
Statistical Analysis and Modeling of the CO2 Series Emitted by Thirty European Countries
by Alina Bărbulescu
Climate 2024, 12(3), 34; https://doi.org/10.3390/cli12030034 - 29 Feb 2024
Viewed by 1359
Abstract
In recent decades, an increase in the earth’s atmospheric temperature has been noticed due to the augmentation of the volume of gases with the greenhouse effect (GHG) released into the atmosphere. To reduce this effect, the European Union’s directives indicate the action directions [...] Read more.
In recent decades, an increase in the earth’s atmospheric temperature has been noticed due to the augmentation of the volume of gases with the greenhouse effect (GHG) released into the atmosphere. To reduce this effect, the European Union’s directives indicate the action directions for reducing these emissions, among which carbon dioxide (CO2) recorded the highest amount. In this context, the article analyzes the CO2 series reported in 1990–2021 by 30 European countries. The Kruskal-Wallis test rejected the hypothesis that the series comes from the same underlying distribution. The Anderson-Darling test rejected the normality hypothesis for seven series out of thirty, and Sen’s procedure found a decreasing trend slope only for 17 series. ARIMA models have been built for all individual series. Grouping the series (by the k-means and hierarchical clustering) provided the base for building the Regional series (RegS), which describes the CO2 pollution evolution over Europe. The advantage of this approach is to provide the synthetic image of the regional evolution of the CO2 emission volume (mt), incorporating information from 30 series (one for each country) in only one—RegS. It is also shown that selecting the number of clusters involved in building RegS and assessing their stability is essential for the model’s goodness of fit. Full article
Show Figures

Figure 1

13 pages, 1543 KiB  
Systematic Review
A Systematic Review of Agroecology Strategies for Adapting to Climate Change Impacts on Smallholder Crop Farmers’ Livelihoods in South Africa
by Mashford Zenda and Michael Rudolph
Climate 2024, 12(3), 33; https://doi.org/10.3390/cli12030033 - 27 Feb 2024
Viewed by 1761
Abstract
This systematic review identified the prevalence, effectiveness, and potential benefits of agroecology strategies in promoting sustainable agriculture practices implemented by smallholder crop farmers in South Africa. The review carried out a comprehensive literature search across various academic databases, including PubMed, Scopus, and Web [...] Read more.
This systematic review identified the prevalence, effectiveness, and potential benefits of agroecology strategies in promoting sustainable agriculture practices implemented by smallholder crop farmers in South Africa. The review carried out a comprehensive literature search across various academic databases, including PubMed, Scopus, and Web of science. The relevant studies were screened and selected based on predetermined inclusion criteria where a total of 262 articles were extracted and reduced to 30 articles for this systematic review. Data were extracted and synthesised to classify patterns and trends in the adoption of agroecology elements. The results obtained from the review of this study highlights the identification of specific strategies such as indigenous crop varieties, conservation agriculture, intercropping, agroforestry, drought-tolerant crop varieties, and water management strategies. These outcomes demonstrated insights into the prevalence of different strategies applied by smallholder crop farmers in South Africa. Furthermore, the review determined the reported benefits, such as increased crop resilience, improved soil fertility, and enhanced water use efficiency. These benefits were assessed on the available evidence from the selected studies. This review contributes to a better understanding of agroecology practices in South African. The results can inform policymakers, researchers, and farmers in developing appropriate strategies to enhance sustainable agricultural practices. Full article
Show Figures

Figure 1

17 pages, 9175 KiB  
Article
Historical Climate Trends and Extreme Weather Events in the Tri-State Area: A Detailed Analysis of Urban and Suburban Differences
by Sameeha Malikah, Stephanie Avila, Gabriella Garcia and Tarendra Lakhankar
Climate 2024, 12(3), 32; https://doi.org/10.3390/cli12030032 - 26 Feb 2024
Viewed by 1756
Abstract
This study analyzes daily temperature and precipitation data collected from 44 weather stations throughout New York, New Jersey, and Connecticut to assess and quantify the historical climatic changes within these states. The study conducts a detailed examination of spatial and temporal trends, focusing [...] Read more.
This study analyzes daily temperature and precipitation data collected from 44 weather stations throughout New York, New Jersey, and Connecticut to assess and quantify the historical climatic changes within these states. The study conducts a detailed examination of spatial and temporal trends, focusing on specific stations that best represent the climatic diversity of each area. A critical analysis aspect involves comparing temperature trends in urban and suburban areas, mainly focusing on New York City. The findings reveal a significant upward increasing trend in average temperatures across all seasons, with urban areas, especially NYC, exhibiting the most marked increases. This trend is notably sharp in the spring, reflecting climate change’s escalating influence. The study also observes an increase in the annual average temperatures and a concurrent decrease in the variability of temperature ranges, suggesting a stabilization of temperature fluctuations over time. Also, we identified a notable increase in heat wave frequency, more so in urban locales than in their suburban counterparts. Analysis of precipitation patterns, particularly in NYC, reveals a decline in snowfall days, consistent with the general warming trend. The results demonstrate significant trends in seasonal average temperatures, a decrease in the variability of temperatures, and a rise in heat wave occurrences, with urban areas typically experiencing warmer conditions. This comprehensive study highlights the need for a more in-depth analysis of spatial precipitation trends. It underscores the importance of continued research in understanding the multifaceted impacts of climate change, particularly in differentiating urban and rural experiences. Full article
Show Figures

Figure 1

13 pages, 545 KiB  
Article
Tackling Complexity: Integrating Responses to Internal Displacements, Extreme Climate Events, and Pandemics
by Roberto Ariel Abeldaño Zuñiga, Gabriela Narcizo de Lima and José Carlos Suarez-Herrera
Climate 2024, 12(3), 31; https://doi.org/10.3390/cli12030031 - 24 Feb 2024
Viewed by 1573
Abstract
Background: During 2020 and 2021, over 50.2 million individuals were forced to leave their homes to escape the impacts of climate-related disasters, unable to practice social isolation or self-quarantine. A considerable proportion of them reside in densely populated areas with a lack of [...] Read more.
Background: During 2020 and 2021, over 50.2 million individuals were forced to leave their homes to escape the impacts of climate-related disasters, unable to practice social isolation or self-quarantine. A considerable proportion of them reside in densely populated areas with a lack of basic services such as water and sanitation and limited access to essential healthcare. This study aimed to estimate the internal displacements during 2020 and 2021 due to climate-related events, and review the evidence for proposing policy recommendations. Methods: Data from the Internal Displacement Monitoring Centre were used for assessing internal displacement by disasters during 2020 and 2021. In addition, the authors conducted a bibliographic review to analyse the responses to internal displacements in climate-related disasters. Results: There were 883 severe storms and 1567 flood events resulting in 50.2 million internal displacements globally. Through the documents reviewed, the legal framework, the vulnerabilities and current challenges of internally displaced persons, and the response policy recommendations were analysed. Conclusions: The increased awareness of displacement and migration, particularly driven by climate-related factors, aligns with international agreements emphasising coordinated action. This recognition becomes even more critical in the context of the convergence of climate-related displacements and the potential for future pandemics. Full article
Show Figures

Figure 1

24 pages, 5982 KiB  
Article
A Systematic Review on Human Thermal Comfort and Methodologies for Evaluating Urban Morphology in Outdoor Spaces
by Iago Turba Costa, Cassio Arthur Wollmann, Luana Writzl, Amanda Comassetto Iensse, Aline Nunes da Silva, Otavio de Freitas Baumhardt, João Paulo Assis Gobo, Salman Shooshtarian and Andreas Matzarakis
Climate 2024, 12(3), 30; https://doi.org/10.3390/cli12030030 - 24 Feb 2024
Viewed by 1635
Abstract
The exponential growth of urban populations and city infrastructure globally presents distinct patterns, impacting climate change forecasts and urban climates. This study conducts a systematic review of the literature focusing on human thermal comfort (HTC) in outdoor urban environments. The findings indicate a [...] Read more.
The exponential growth of urban populations and city infrastructure globally presents distinct patterns, impacting climate change forecasts and urban climates. This study conducts a systematic review of the literature focusing on human thermal comfort (HTC) in outdoor urban environments. The findings indicate a significant surge in studies exploring HTC in open urban spaces in recent decades. While historically centered on Northern Hemisphere cities, there is a recent shift, with discussions extending to various metropolitan contexts in the Southern Hemisphere. Commonly employed urban categorization systems include Sky View Factor (SVF), Height × Width (H/W) ratio, and the emerging Local Climate Zones (LCZs), facilitating the characterization of urban areas and their usage. Various thermal indices, like Physiological Equivalent Temperature (PET), Predicted Mean Vote (PMV), Universal Thermal Climate Index (UTCI), and Standard Effective Temperature (SET), are frequently utilized in evaluating external HTC in metropolitan areas. These indices have undergone validation in the literature, establishing their reliability and applicability. Full article
Show Figures

Figure 1

21 pages, 21741 KiB  
Article
Explosive Cyclone Impact on the Power Distribution Grid in Rio Grande do Sul, Brazil
by Marcely Sondermann, Sin Chan Chou, Renata Genova Martins, Lucas Costa Amaro and Rafael de Oliveira Gomes
Climate 2024, 12(3), 29; https://doi.org/10.3390/cli12030029 - 24 Feb 2024
Viewed by 1319
Abstract
Southern Brazil is a region strongly influenced by the occurrence of extratropical cyclones. Some of them go through a rapid and intense deepening and are known as explosive cyclones. These cyclones are associated with severe weather conditions such as heavy rainfall, strong winds, [...] Read more.
Southern Brazil is a region strongly influenced by the occurrence of extratropical cyclones. Some of them go through a rapid and intense deepening and are known as explosive cyclones. These cyclones are associated with severe weather conditions such as heavy rainfall, strong winds, and lightning, leading to various natural disasters and causing socioeconomic losses. This study investigated the interaction between atmospheric and oceanic conditions that contributed to the rapid intensification of the cyclone that occurred near the coast of South Brazil from 29 June to 3 July 2020, causing significant havoc. Hourly atmospheric and oceanic data from the ERA5 reanalysis were employed in this analysis. The results showed that warm air and moisture transportation were key contributors to these phenomena. In addition, the interaction between the jet stream and the cyclone’s movement played a crucial role in cyclone formation and intensification. Positive sea surface temperature anomalies also fueled the cyclone’s intensification. These anomalies increased the surface heat fluxes, making the atmosphere more unstable and promoting a strong upward motion. Due to the strong winds and the heavy rainfall, the explosive cyclone caused substantial impacts on the power services, resulting in widespread power outages, damaged infrastructure, and interruptions in energy distribution. This work describes in detail the cyclone development and intensification and aims at the understanding of these storms, which is crucial for minimizing their aftermaths, especially on energy distribution. Full article
(This article belongs to the Section Weather, Events and Impacts)
Show Figures

Figure 1

31 pages, 17066 KiB  
Article
Atmospheric Patterns in Porto Velho, Rondônia, Southwestern Amazon, in a Rhythmic Context between 2017 and 2018
by Graziela T. Tejas, Dorisvalder D. Nunes, Reginaldo M. S. Souza, Carlos A. S. Querino, Marlon R. Faria, Daiana C. B. Floresta, Emerson Galvani, Michel Watanabe and João P. A. Gobo
Climate 2024, 12(3), 28; https://doi.org/10.3390/cli12030028 - 20 Feb 2024
Viewed by 1273
Abstract
This paper aims to analyze the weather conditions in Porto Velho (Rondonia, Brazil, Western Amazon) and the influence of air masses on the climatic elements between 2017 and 2018, using rhythmic analysis. Climatic data were obtained through the official weather station, tabulated and [...] Read more.
This paper aims to analyze the weather conditions in Porto Velho (Rondonia, Brazil, Western Amazon) and the influence of air masses on the climatic elements between 2017 and 2018, using rhythmic analysis. Climatic data were obtained through the official weather station, tabulated and statistically organized, and processed in R Studio programming language. The monitoring of air masses occurred through the synoptic charts of the Navy Hydrography Center. The results were analyzed by dry–rainy transition season, rainy season, wet–dry transition season, and dry season. Thus, the results point out that the Tropical Continental mass (mTc) acted up to 62.9%, responsible for the low precipitation index in October 2017. Although the mass has characteristics of warm and unstable weather, it is even lower than the action of the mEc. In January 2018, there was an 85.5% prevalence of the Continental Equatorial Mass (mEc), added to the action of the South Atlantic Convergence Zone (ZCAS), which contributed to an accumulated rainfall of 443 mm/month. In April 2018, the mEC acted with 56.7%, reaching 35.5% in August. Another highlight was the performance of the Tropical Atlantic mass (mTa) (27.4%) and mTc (19.4%), both of which had a crucial role in the dry season, followed by the Polar Atlantic mass (mPa) (17.7%), that contributed to the phenomenon of “coldness” in the region. Therefore, the mEc is extremely important in the control of the relative humidity of the air and the precipitations, while the mTc is a dissipator of winds that, at times, inhibits the performance of the mEc. Full article
Show Figures

Figure 1

Previous Issue
Next Issue
Back to TopTop