
Safe Sowing Windows for Smallholder Farmers in West Africa in the Context of Climate Variability

Water Management Department, Delft University of Technology, PO Box 5048, 2600 GA Delft, The Netherlands
*
Author to whom correspondence should be addressed.
Climate 2024, 12(3), 44; https://doi.org/10.3390/cli12030044
Submission received: 12 February 2024
/
Revised: 12 March 2024
/
Accepted: 13 March 2024
/
Published: 17 March 2024
(This article belongs to the Special Issue Changing Rainfall Patterns and Food Insecurity: Vulnerable Regions and Adaptation Strategies)
Abstract
:Climate variability poses great challenges to food security in West Africa, a region heavily dependent on rainfall for farming. Identifying sowing strategies that minimize yield losses for farmers in the region is crucial to securing their livelihood. In this paper, we investigate three sowing strategies to assess their ability to identify safe sowing windows for smallholder farmers in the Sudanian region of West Africa (WA) in the context of a changing climate. The GIS version of the FAO crop model, AquaCrop-GIS, is used to simulate the yield response of maize (Zea mays L.) to varying sowing dates throughout the rainy season across WA. Based on an average of 38 years of data per grid cell, we identify safe sowing windows across the Sudanian region that secure at least 90% of maximal yield. We find that current sowing strategies, based on minimum thresholds for rainfall accumulated over a period that are widely applied in the region, carry a higher risk of yield failure, especially at the beginning of the rainy season. This analysis shows that delaying sowing for a month to mid-June in the central region (east of Lon 8.5°W), and to early August in the semi-arid areas is a safer strategy that ensures optimal yields. A comparison between the periods 1982–1991 and 1992–2019 shows a negative shift for LO10 mm and LO20 mm, suggesting a wetter regime compared to the dry periods of the 1970s and 1980s. On the contrary, we observe a positive shift in the safe window strategy, highlighting the need for precautions due to erratic rainfall at the beginning of the season. The precipitation-based strategies hold a high risk, while the safe sowing window strategy, easily accessible to smallholder farmers, is more fitting, given the current climate.
1. Introduction
There is growing pressure on water resources to sustain food production and to reduce the food security gap in several parts of the world [1,2,3]. In particular in West Africa, rapid population growth and the central role of rain-fed agriculture for food production have exacerbated food insecurity [4]. Climate change may increase threats to the already vulnerable communities. With more and more vulnerable regions being affected by increasingly extreme climatological conditions, such as drought and flooding, many vital sectors are impacted, and adaptation measures are of paramount importance [5,6,7]. Climate variability in West Africa and the subsequent uncertainties in the context of a changing climate have been the focus of several studies [8,9,10,11,12]. This has led to providing remarkable insights and knowledge about the characteristics of the rainy season (onset, duration, and cessation) and its implication for local farmers to support adaptation measures.
In the farming systems of West Africa, more than 90% of farmers depend on seasonal rainfall, which guides the planning of farming and the selection of crop types (drought-resistant/tolerant) and varieties (long/short maturation) [13,14]. As a result, the success (or failure) of a growing season strongly rests on identifying the right (or wrong) planting date. However, due to the lack of accurate climate information services, the sector is becoming more vulnerable, and farmers have been reporting the phenomenon of the so-called “false start” of the rainy season [15]. The false start or “false onset” is a consequence of the unpredictable rainfall pattern and is characterized by erratic rain events at the beginning of the season followed by intermittent dry spells of various lengths [16,17].
The issue of the false start of the rainy season in the savanna region has not only challenged local knowledge but also alarmed agro-meteorologists. As a result, two approaches to safe sowing strategies at a local scale are available in the region, each with its uncertainties: a precipitation-based strategy and a crop water requirement-based strategy. The precipitation-based strategies consider empirical thresholds of accumulated rainfall totals over a period of time (control period) to identify the start of the rainfall season and ensure sufficient water availability for crop development [18,19,20]. Crop water requirement-based strategies use crop simulation modeling to evaluate expected yields to determine appropriate sowing windows that minimize stresses and optimize crop yield [21].
How well do these sowing strategies determine realistic sowing dates, and are they able to identify the false starts of the rainy season? Which strategy results in optimal yields, and what are the associated risks attached? This paper investigates these crucial questions and provides several suggestions as to how farmers can apply them most effectively. Using 38 years of weather information across the WA region, we evaluated the yield responses based on three sowing strategies: two strategies based on rainfall amounts in a certain period and a so-called safe sowing window strategy based on predicted yields through crop modeling. The safe sowing window method is more sensitive to dry spells during the growing season. To calculate yield predictions in response to rainfall variability, we used AquaCrop-GIS, the GIS version of the FAO crop model. After an overview of the methodology used, we analyze the inter-annual as well as spatial variability of each strategy, the impact of climate change on their ability to determine realistic sowing dates, and the risk of using any of these strategies.
2. Data Description
2.1. Study Area
The study area covers the Sudanian agro-climatological region of West Africa located between latitudes 8°N and 15°N, which is characterized by a unimodal rainy season per year (see [21]). The study area covers the savanna region of West Africa extending into the Sahel region. Rainfall is convective and is associated with a northward latitudinal gradient associated with the Inter-Tropical Convergence Zone (ITCZ) [22]. The area covers locations between Chad (to the east) and Senegal (to the west).
2.2. Data Sources
The data sources required to run the model simulations in AquaCrop-GIS include rainfall, temperature, humidity, surface radiation, and wind speed (to calculate reference evapotranspiration), soil information (depth, texture, and physical properties), and information on management practices (sowing windows, soil fertility level, application of mulches, etc.). Rainfall information is extracted from the Global Precipitation Climatology Centre (GPCC), version 2020, and covers a period of 38 years (1982 to 2019) with a resolution of 1° [23]. The dataset is operated by the German Weather Service (DWD), which collects meteorological data from across the globe, and it comprises daily in situ precipitation information. Taking stock of the water, energy, and climate change (WATCH) Forcing Data methodology applied to ERA5 (WFDE5), the WFDE5 provides daily temperature, humidity, wind speed, as well as surface downwelling short/long-wave radiation necessary to compute reference evaporation, . The Makkink equation ([24]) is used to compute reference evapotranspiration with satellite data and is validated against the evapotranspiration computed using ground measurements from the TAHMO database (https://tahmo.org/ (accessed on 22 June 2021)) [25].
Soil information is derived from the Africa SoilGrids-Texture database (https://data.isric.org/geonetwork/srv/api/records/2a7d2fb8-e0db-4a4b-9661-4809865aaccf (accessed on 20 April 2023)), which comprises the textural class at six depth intervals up to 200 cm over the African continent at a resolution of 250 m. The information from the gridded product is combined with the AquaCrop default soil dataset for several soil classes to generate the soil profile of each grid cell. Information on management practices in the savanna region is the same as the details used in [21] following interviews and discussions with farmers and expert agronomists in the northern regions of Benin and Ghana, including the current practice with respect to sowing timing.
2.3. Seasonal Variability of Climate Indices in the Study Area
Annual rainfall in the region is highly influenced by the West African Monsoon (WAM) [26]. After the collision of dry air masses from the Sahara and the warm and humid air from the Atlantic Ocean, rainfall is triggered along the West African coast, i.e., the Gulf of Guinea [27]. Following a shift of the ITCZ at latitude 5° N, the rainfall maximum moves to the Savanna zone to 10° N [28,29]. Figure 1 shows the distribution of the mean seasonal rainfall across the region over the period of 1982–2019. Spatially, mean seasonal rainfall varies from about 1000 mm in the south of the region to less than 500 mm in the Sahel, reflecting the spatial and latitudinal variation of rainfall in the Sudanian region of West Africa [30]. The southwestern part of the study area, however, shows higher seasonal rainfall (±2000 mm), which is associated with the highlands and the topography of the Fouta Djallon region in Guinea [31] and the mountains of Sierra Leone. Figure 2 shows the average seasonal rainfall and evapotranspiration. The unimodal pattern of the rainfall season varies from May to October. Most of the rain falls between June and September (80% and 91% on average for the savanna and the semi-arid zones, respectively) [12].
We observe that seasonal rainfall can meet evaporative demand in most locations across the region. In part of the region, the average monthly equals or exceeds monthly rainfall even during the rainfall season.
The long-term variation is shown in Figure 2c at Lat 10.5° N, Lon 3.5° W. The dataset captures very well the drought period that the region experienced between the 1970s and 1980s in West Africa, followed by a recovery to varying degrees across the region at the beginning of the 21st century [11,15].
3. Methods
3.1. Sowing Strategies of the Growing Season
Three sowing strategies are evaluated in this study following a previous investigation on the onset of the growing season in West Africa: two rainfall-based sowing strategies widely recommended in the literature and the safe sowing window strategy suggested in [21], based on predicted yields through crop modeling, and thereby more sensitive to dry spells occurring during the growth season. Regarding the safe sowing window, for every specific location, the maximal achievable yield is evaluated using a crop simulation model (here, the FAO model AquaCrop). The “safe window” is thereafter determined by finding those sowing dates within the season that result in a yield that equals at least 90% of the maximum achievable yield of that location. The idea is to identify safe windows for sowing that ensure low yield losses for farmers, who have no or limited access to local rainfall information as is required for the rainfall-based approaches. The first rainfall-based approach, also referred to as the Local Onset (of the rainfall season, LO) approach, LO20 mm hereafter, defines the onset as one or two consecutive rainy days accumulating at least 20 mm with no 7-day dry spell occurring during the next 30 days counted from the onset [19]. This sowing strategy approach prioritizes sufficient water availability and limits the occurrence of long dry spells at the early stages of crop development but requires a long control period (30 days) before farmers can start planting. The second rainfall-based approach also referred to as agronomic onset, LO10 mm hereafter, is defined as an average of four consecutive rainy days exceeding 10 mm daily [32]. The focus of this approach is to identify the earliest moment that still ensures sufficient soil humidity to sustain seed germination after sowing [17,33,34].
Based on field surveys and rainfall patterns in the WA region, we observed that the earliest possible time for farmers to sow their crops is the beginning of May. Knowing that the season runs until October/November and that various soil types have different water-holding capacities, our goal was to assess how the crop would respond to any planting date in that range. We chose to run the simulations at 5-day intervals for computational efficiency as we ran the model simulations for the entire WA region. In a previous study for a selected number of locations, we used 1-day time intervals and found that the time response of maize crops to rainfall variability and dry spells is about 1 week. This is confirmed by another study for this region [19].
3.2. The FAO Crop Model AquaCrop
Crop development and yield response are computed using AquaCrop, the FAO crop simulation model [35]. The sowing window is evaluated by computing crop response to sowing dates ranging from 1 May to 30 November at five-day intervals at any location throughout the growing season.
Description of the Model: AquaCrop-GIS
AquaCrop, the FAO crop model, is a water-driven model that simulates daily crop biomass, which is associated with the transpired water through biomass water productivity [36]. Hence, the water-driven growth engine of AquaCrop simulates the crop green Canopy Cover (CC in %) on daily time steps from crop emergence through the development and senescence of the canopy, while the root system develops from the minimum effective rooting depth and increases to the maximum rooting depth [36]. Transpiration (1) is then converted into biomass accumulated every day, using a crop-specific water productivity parameter (2) normalized for :
where is the adjusted canopy cover, and is the coefficient for maximum crop transpiration. Further:
where, at day i, is the above-ground biomass (g), is the normalized crop water productivity (g of biomass per m2), is transpiration, and is the evaporative demand of the atmosphere ().
This normalization of for evaporative demand of the atmosphere and air carbon dioxide concentration makes the parameter approximately constant for a given crop species and applies to a wide range of climates [35,37]. Once the biomass is calculated by accumulation, yield (Y) is partitioned from flowering using (3) via the harvest index ( in %). We obtain the following:
As a water-driven model, AquaCrop introduces the effects of water stress, which affects biomass development (slows canopy expansion and accelerates senescence), reduces yield build-up, and reduces root deepening in extreme cases [38]. The water stress response is expressed as a stress coefficient that modifies the simulated component and varies in value from 1 (no stress) to 0 (full stress) as a function of the total available water (TAW, the volume of water the soil can hold between field capacity and permanent wilting point) [36].
AquaCrop-GIS version 2.1, the multi-spatial version of the FAO crop simulation model AquaCrop [35], was used to assess the regional level. It has been designed to facilitate the use of the model when a high number of simulations is needed, simplifying the task of generating input and project files and the management of output files [39]. The software generates the necessary input files, executes AquaCrop at each pixel/grid, elaborates on the results, and displays them in a geographic information system format. This simulation module of the software, however, uses AquaCrop version 4.1, which is less suitable for our study, since many upgraded functionalities in version 6.1 are missing, such as simulating calendar days and soil fertility levels. Therefore, AquaCrop-GIS version 2.1 was used to generate the simulation files, which were then modified and updated with the required region-specific parameters and run using AquaCrop version 6.1 (only the non-conservative parameters are presented here in Table 1). The parameterization of the model follows [21].
The simulations require as input weather data (precipitation, maximum and minimum temperature, , and CO2 concentration), soil information (soil profile, textures, and hydraulic properties of each layer), crop information (phenology, plant density, canopy cover, and max root depth) and management data (irrigation schedule, application of mulches, and water table).
4. Results and Discussion
4.1. Inter-Annual Variation of the Onset Approaches
We explore the inter-annual yield response to varying sowing dates and evaluate the year-to-year changes of the onset to identify any particular features. Figure 3a shows the inter-annual variation of crop response to the three sowing strategies during the growing season at Lat 11.5° N, Lon 3.5° W (southern Burkina Faso). Grey vertical bars represent the safe sowing window for each season estimated using AquaCrop. Red stars and black crosses show recommended sowing dates for strategies LO10 mm and LO20 mm, respectively. They range from the first week of May (Day 121) to the fourth week of July (Day 205), where LO10 mm tends to be conservative and recommends later sowing dates (up to 20 days on average) compared to LO20 mm. The safe sowing window, i.e., all dates yielding at least 90% of the maximum achievable yield, varies from as early as the first week of May to the last week of June, while cessation of the safe sowing window may be up to mid-November. The two purple horizontal lines delineate the intersection between all yearly safe sowing windows that are at least 2 weeks long, a period which is required by a smallholder farmer to sow an average farm of 2 ha.
All the safe sowing windows per season (38 out of 38 years) intersect with the Grid Safe Window (GSW), which spans from 25 June (Day 176) to 25 July (Day 206). LO10 mm achieves optimal yield (more than 90% of max yield) in 28 cases and leads to yield failure (≤0.2 ton/ha) in only one year (1983, one of the strongest El Niño events on record [43]). LO20 mm identifies earlier sowing dates compared to LO10 mm and, as a result, ensures optimal yield in only 10 cases, while it leads to crop failure in nearly 20% of cases (7 years out of 38), especially during the 21st century. It never fell within the GSW, thus pointing out the uncertainty of using such a strategy to determine the sowing dates. Knowing the impracticality of LO20 mm due to the control period, the safe sowing window approach is more robust and easy to implement for the smallholder farmers who might not have access to climate information, especially in the context of climate-induced changes in rainfall in recent years.
In the drier part of the study area, a different timing (onset, duration, and cessation) occurs. Figure 3b shows the inter-annual variation of the three sowing strategies during the growing season at a drier location, Lat 14.5° N, Lon 9.5° W (Southwest Mali). We observe a later start of the safe sowing window compared to Figure 3a and a more pronounced alternation between early and late safe sowing windows, with some seasons where the safe sowing window was not identified. The safe sowing window starts as early as the first week of June but, on average, occurs around the end of June. The intersection of the safe sowing windows, on the other hand, spans only the last weeks of July (Day 206 to Day 213). Regarding the rainfall-based strategies, there is an earlier estimate of the sowing dates on average around mid-June (Day 171) and early July (Day 184) for LO20 mm and LO10 mm strategies, respectively. However, both the LO10 mm and LO20 mm approaches achieve optimal yield in 20 and 13, respectively, out of 38 years. They estimate sowing dates that are in some cases too early, thereby leading to crop yield failure (≤0.2 [ton/ha]), for 10 and 14 years, respectively, for LO10 mm and LO20 mm over 38 years. It can also be concluded that 90-day maize may not be the best crop for these areas.
4.2. Safe Sowing Window across West Africa and Risks
Figure 4 shows the regional variation of the start of a safe sowing window at each grid cell. The safe sowing window refers to the intersection between yearly safe windows (90%) estimated using the crop simulation model and that are at least two weeks long. Throughout the region, the start of the safe sowing window occurs as early as 25 May (Day 145) to 21 October (Day 295). There are two axes of progression of the safe sowing window across the region. A first northward shift is observed from the savanna to the semi-arid or Sahel region. The safe window varies almost at the pace of one week per degree from the last week of June (mean = 183, std = 18 days) in the south of the savanna to late July/early August (mean = 200, std = 16 days) in the semi-arid zone. The length of the safe window also follows the latitudinal gradient and decreases from 36 days in the savanna to 15 days in the Sahel. The second shift, a northwestern shift of the safe window toward the region of the southwest of Mali and Senegal, takes place from mid-July before the safe windows occur in late July (mean = 205, std = 20 days), for an average duration of a couple of weeks.
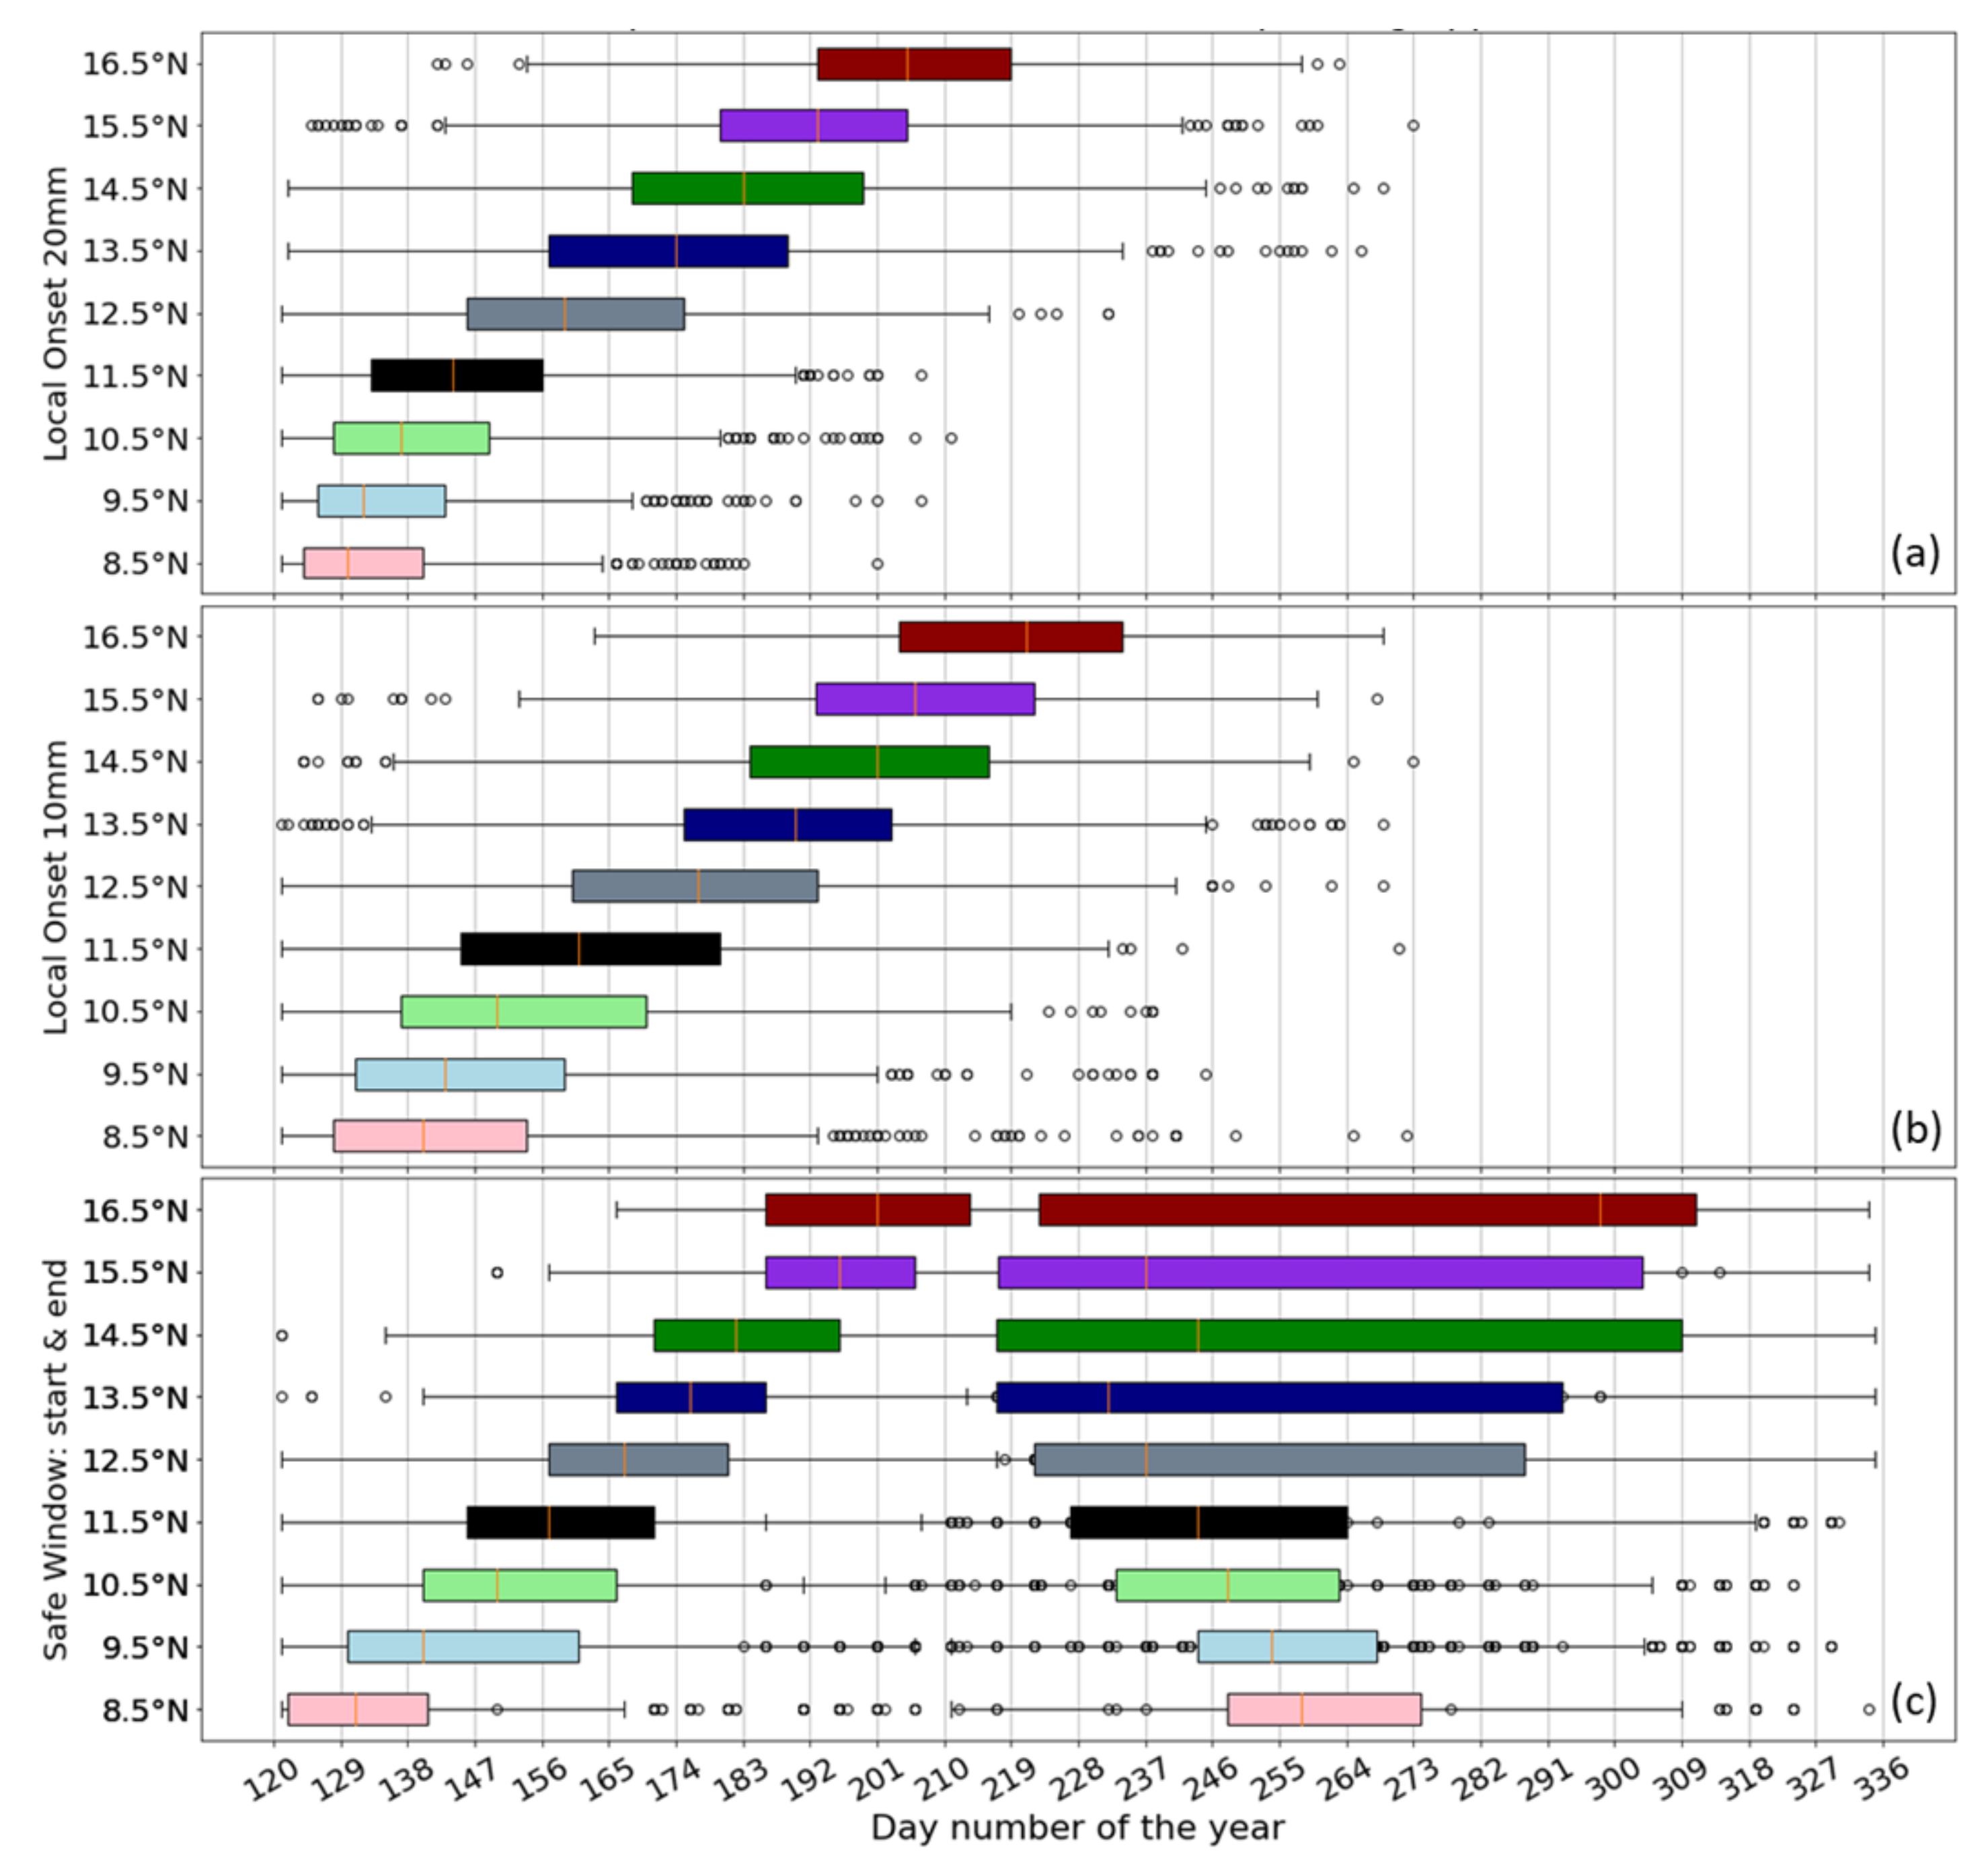
Figure 5 displays the latitudinal migration of the sowing dates that is, the start and end of the safe sowing windows using the three sowing strategies. Sowing dates gradually move from around mid-May for the lower latitudes (average date Day 133 and std = 12 days for LO20 mm; average date Day 144 and std = 22 days for LO10 mm) at Lat 8.5° N, to later dates at higher latitudes (average date Day 206, std = 21 days for LO20 mm and average date Day 220 and std = 21 days for LO10 mm) at Lat 16.5° N. LO20 mm and LO10 mm generally follow the start of the safe sowing window for the lower latitudes (Lat 8.5° N and 9.5° N). However, sowing dates for LO20 mm start about two weeks earlier relative to the start of the safe sowing window from Lat 10.5° N northward. LO10 mm shows a later start (about two weeks) than the safe sowing window from Lat 12.5° N to Lat 16.5° N. The safe sowing window (mean start to mean end) is four months long at the lower latitudes (Lat 8.5° N and 9.5° N); is shortened to two months at mid-latitudes (Lat 12.5° N, 13.5° N, and 14.5° N); and to one month at the highest latitudes (Lat 15.5° N). However, the safe sowing window at Lat 16.5° N is wider/longer and, regarding the end of the window, shows a high uncertainty for potential sowing until October.
The longitudinal migration (not shown) shows limited variation in sowing dates, except for the westernmost part of the region. For LO20 mm, the mean sowing dates in the central zone vary between mid and late May (Day 140 and 158), while on the western side, it occurs a month later than in the central zone and varies between Days 170 and 188. LO10 mm displays a similar feature, but overall, a later start of about one week to LO20 mm in each of these two zones is observed. The safe sowing window strategy shows the same behaviors as the LO20 mm strategy, but with, on average, a two-week delay at both the extreme west and east sides of the region. This suggests a northward and northwestern shift of the safe sowing window from the central region of West Africa. The safe sowing window not only varies along latitudes but also shows a western shift towards the south of Mali.
These results confirm findings from climate analysis over the West African Monsoon that identify the onset of the rainy season in the central area of the region around 150 to 160 Julian days [31]. It is also noticed that, despite spatial variation (geographical characteristics, vegetation, topography, landscape, human activities, etc.), the safe sowing window follows the latitudinal gradient of maximum rainfall. Safe sowing takes place after mid-June in the savanna for about one month, while it takes place between late July and early August in the semi-arid regions. Due to the northwestern migration of the safe sowing window, it is also safer to plant at the end of July or the beginning of August in the western part of the region. Such delayed sowing dates are consistent with other studies that correlate large rainfall reduction with the pre-monsoon and mature monsoon phases corresponding to April to June over the study area [44].
4.3. Climate Effects and Risks on the Onset of the Rainy Season between 1982 and 2019
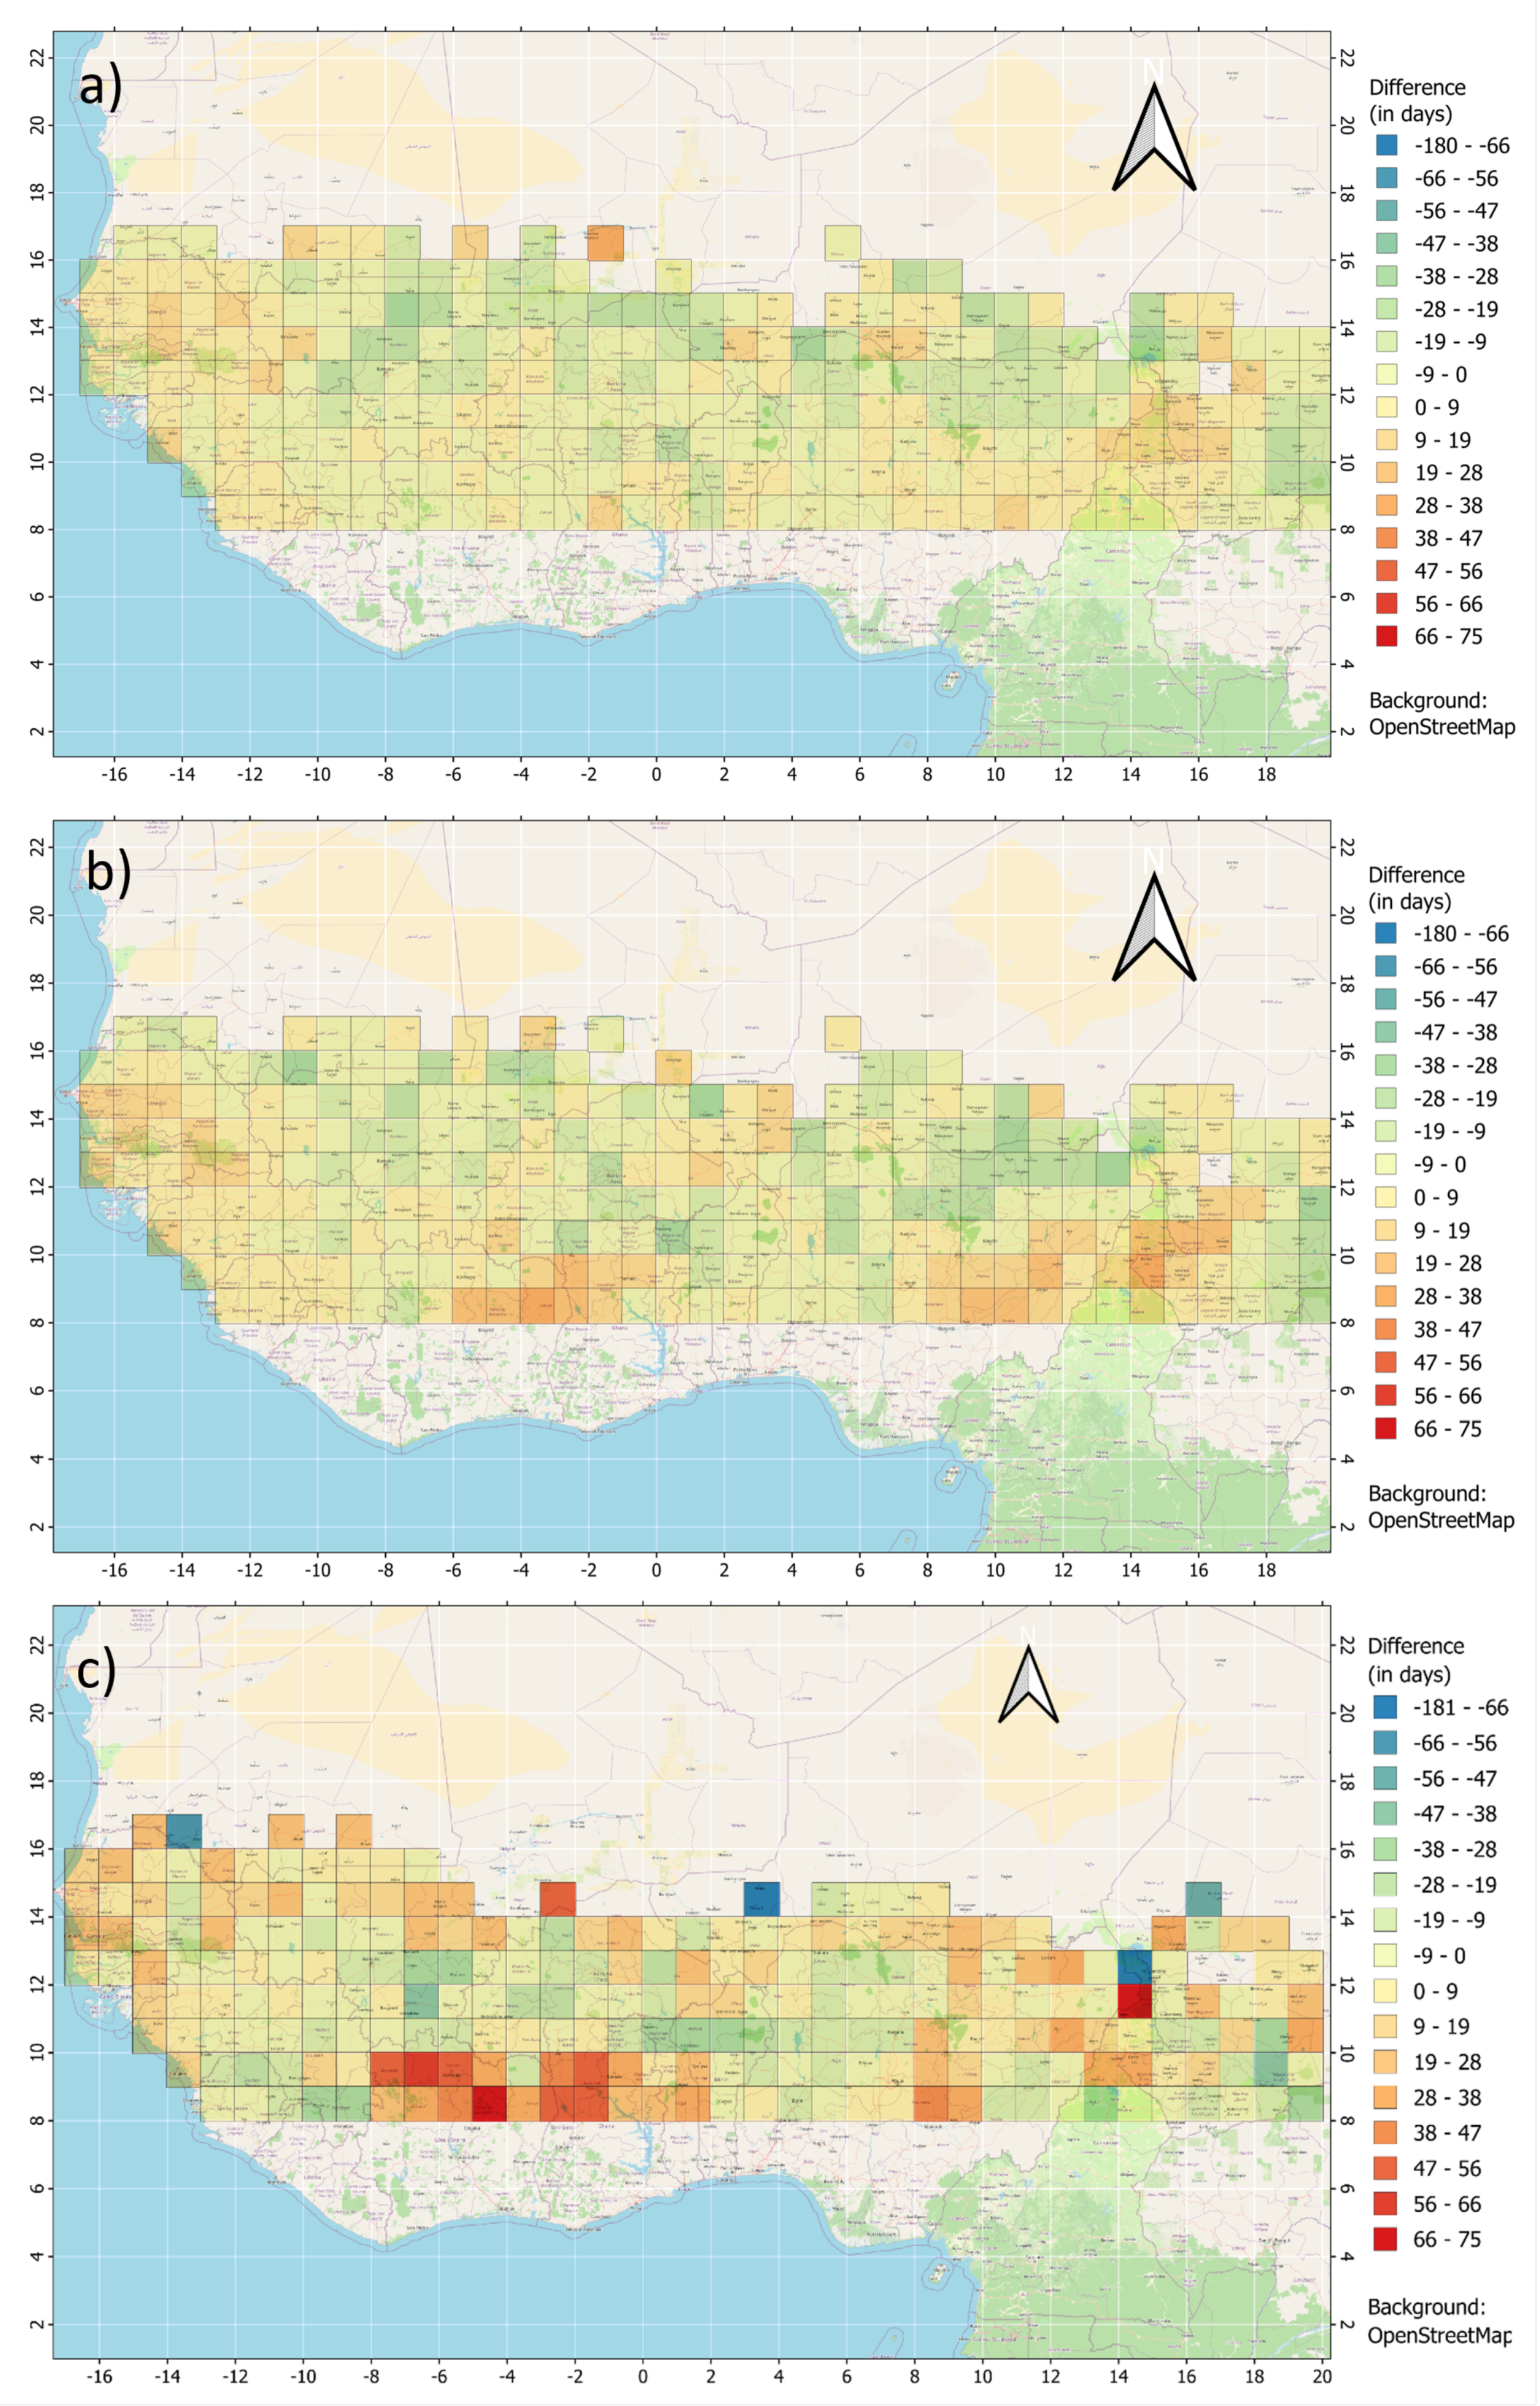
To assess the effect of climate variability on the different sowing strategies, we evaluated the differences between the recent period 2011–2019 and a reference period 1982–1990. Figure 6 shows how LO10 mm, LO20 mm, and the safe sowing window have changed over time with respect to the baseline. Both LO20 mm and LO10 mm show a general backward shift of the sowing dates to earlier dates (1 to 2 weeks) around the center of the region (except for a few grid cells), while the most western and eastern areas of the region show a slight shift toward later dates (see Figure 6a,b). The length of the inter-quartile range varies between 12 and 15 days for both strategies, but both show a mean value of −1.6 days and −3.3 days for LO10 mm and LO20 mm, respectively. Regarding the safe sowing window strategy (see Figure 6c), apart from a couple of locations around the center of the area, the map shows an overall difference of ±20 days from 1982–1990 to 2011–2019. We observe, on average, a regional shift (1 to 3 weeks) of the start of the safe sowing window to later dates for most of the region. This shift to later dates is more pronounced around the northern parts of Ivory Coast, Ghana, and Togo, where farmers have indeed reported high variation and increasing dry spells during the rainy season. The extreme values (dark blue or red) represent the grids with fewer years () with a computed safe window per decade. The interquartile of the safe sowing window range varies between −10 and +10 days, and the average value is 0.4.
The analysis of the variation between the three decades (1991–2000, 2001–2010, and 2011–2019) shows, as is to be expected, a wider range of dates. For all periods, LO20 mm and LO10 mm show more or less the same average variation, with the interquartile range progressively increasing. These changes in recent decades could result from the uneven distribution of the start of the rainy season, which has become more unpredictable. The safe sowing window, however, shows a gradual shift to later dates, caused by devastating dry spells that have become more frequent at the beginning of the season. The intra-seasonal distribution of rainfall patterns (dry spells) could also explain such a shift. Froidurot et al. [45] observed that the Sahel experiences an average of nearly one dry spell per season of 7–15 days in the middle of the rainy season. Such dry spells tend to shift the safe window to a later date to secure the maximum yield.
Overall, these results show that the safe sowing window is shifting in the Sudanian region of West Africa to later dates in the rainy season. The two local strategies, on the contrary, show earlier sowing dates, especially in the center of the region, while the periphery of the Sudanian region shows a slight shift to the later dates.
Lodoun [46] (in Burkina Faso) and later Monerie [47] (over the 21st century) noticed that the central region of West Africa will be wetter, while climate change will lead to drier conditions elsewhere. Such a trend could explain why local strategies, LO20 mm and LO10 mm, tend to lead to sowing dates that occur earlier in comparison to the safe sowing strategy. In addition, the more extreme rainfall events could also induce an early estimation of sowing dates by the two precipitation-based strategies. These two strategies focus on ensuring enough water at the start of the growing season and therefore get triggered by intense rain events at the start of the growing period in May. This corroborates the study performed across Benin, Burkina, and Niger, which exhibit intense rain events that may lead to seasonal rainfall amounts close to normal but also extreme dry spells that would cause false starts and early cessation of the cropping season [12]. By ignoring the subsequent dry spells after the control period (germination) that could potentially lead to crop failure, these strategies pose a serious risk, as observed by [21,45]. On the other hand, by computing the onset of the wet season using global climate ensemble means, Dunning et al. [44] observed that the onset is projected to become later across most of West Africa. Although this study only considered rainfall without looking at crop growth, this method avoided isolated intense rainfall followed by dry spells at the beginning of the season [31] and therefore corroborates our results using the safe sowing window strategy.
Considering delaying sowing to later dates, as suggested by the safe sowing windows for each specific area, is still recommended. This result could also explain why many farmers in several locations in the region claim that the rainy season has shortened. However, since inter-annual rainfall totals have not shown high variability [12], water-saving techniques (in the field) such as rainwater harvesting would be a valid option to conserve water and soil moisture, preventing high evaporation from topsoil and increasing the soil’s water holding capacity. This holds especially when other considerations, such as pest avoidance or labor shortages, force the farmer to sow early.
5. Conclusions
We investigated different sowing strategies through crop responses to varying sowing dates for maize across the Sudanian region of West Africa. Three strategies were evaluated over 38 years to identify safe sowing windows that can prevent smallholder farmers from falling into the trap of a false start of the rainy season and thus false sowing dates.
Strategies. LO20 mm and LO10 mm strategies identify two horizontal regions: the savanna region is situated south of Lat 11.5° N, while the semi-arid zone is located north of Lat 11.5° N. In the savanna region, LO20 mm and LO10 mm strategies identify average sowing dates around the last week of May and the first week of June, respectively, while LO20 mm estimates average sowing dates for the semi-arid zone in early July, with LO10 mm two weeks later. The safe sowing window strategy, on the other hand, displays a progressive migration from the Savanna to the semi-arid region, with an average sowing window from the last week of June to mid-July with a length of 25 days. The western area, with more variability, displays sowing dates from the last week of July to the first week of August.
Climate change. The long-term analysis highlights that the sowing dates are becoming more scattered for LO20 mm, while LO10 mm and the safe sowing window strategies show a relatively stable variance. Sowing dates estimated using the LO10 mm and LO20 mm methods are subject to a lot of variation and tend to show an early sowing, suggesting that the region is becoming wetter. The occurrence of early extreme weather events could be an explanation for why the precipitation-based sowing strategies showed a shift to early or earlier dates. Subsequent dry spells, however, affect yields, possibly leading to yield reduction/failure. The safe sowing window approach shows a positive shift, indicating that the safe sowing window is shifting to later dates. This suggests that, with more unpredictable starts for the rainy season, sowing at later dates appears to be safer for farmers. The strategy suggests that, for the wetter areas of the Sudanian region, sowing between mid-June and mid-July is best. For the drier areas, it is safer to start sowing around the end of July to the first week of August.
The method presented here can also be used for other crops and regions, as long as the necessary auxiliary data are available. It would be interesting to expand the analysis to include future climate scenarios but, presently, climate projections for West Africa show a too large variation in magnitude and signs of future changes in rainfall [48].
Author Contributions
All authors have jointly contributed to the design of this research work. Conceptualization, S.M.D.A., M.C.t.V. and N.v.d.G.; methodology, S.M.D.A., M.C.t.V. and N.v.d.G.; validation, S.M.D.A., M.C.t.V. and N.v.d.G.; resources, S.M.D.A., M.C.t.V. and N.v.d.G.; writing—original draft preparation, S.M.D.A.; writing—review and editing, M.C.t.V. and N.v.d.G.; project administration, S.M.D.A.; supervision, M.C.t.V. and N.v.d.G.; funding acquisition, S.M.D.A. and N.v.d.G. All authors have read and agreed to the published version of the manuscript.
Funding
Agoungbome, S.M.D. was supported by the Islamic Development Bank through the IsDB PhD scholarship Programme for a period of three years of his PhD research.
Informed Consent Statement
Informed consent was obtained from all participants involved in the interviews.
Data Availability Statement
Publicly available datasets were analyzed in this study. These data can be found at the above-mentioned links and upon request for research purposes.
Acknowledgments
This study is part of the TWIGA project, which is funded by the European Union Horizon2020 Program under grant #776691.
Conflicts of Interest
The authors declare no conflicts of interest.
References
- Hanjra, M.A.; Qureshi, M.E. Global water crisis and future food security in an era of climate change. Food Policy 2010, 35, 365–377. [Google Scholar] [CrossRef]
- Berners-Lee, M.; Kennelly, C.; Watson, R.; Hewitt, C.N. Current global food production is sufficient to meet human nutritional needs in 2050 provided there is radical societal adaptation. Elem. Sci. Anthr. 2018, 6, 52. [Google Scholar] [CrossRef]
- Dinar, A.; Tieu, A.; Huynh, H. Water scarcity impacts on global food production. Glob. Food Secur. 2019, 23, 212–226. [Google Scholar] [CrossRef]
- FAO; IFAD; UNICEF; WFP; WHO. The State of Food Security and Nutrition in the World 2019. Safeguarding against Economic Slowdowns and Downturns; Food and Agriculture Organization of the United Nations: Rome, Italy, 2019; p. 239. [Google Scholar]
- Tzachor, A.; Richards, C.E.; Gudoshava, M.; Nying’uro, P.; Misiani, H.; Ongoma, J.G.; Yair, Y.; Mulugetta, Y.; Gaye, A.T. How to reduce Africa’s undue exposure to climate risks. Nature 2023, 620, 488–491. [Google Scholar] [CrossRef]
- Liu, K.; Harrison, M.T.; Yan, H.; Liu, D.L.; Meinke, H.; Hoogenboom, G.; Wang, B.; Peng, B.; Guan, K.; Jaegermeyr, J. Silver lining to a climate crisis in multiple prospects for alleviating crop waterlogging under future climates. Nat. Commun. 2023, 14, 765. [Google Scholar] [CrossRef]
- Wallach, D.; Palosuo, T.; Thorburn, P.; Mielenz, H.; Buis, S.; Hochman, Z.; Gourdain, E.; Andrianasolo, F.; Dumont, B.; Ferrise, R. Proposal and extensive test of a calibration protocol for crop phenology models. Agron. Sustain. Dev. 2023, 43, 46. [Google Scholar] [CrossRef]
- Wang, G.; Alo, C.A. Changes in Precipitation Seasonality in West Africa Predicted by RegCM3 and the Impact of Dynamic Vegetation Feedback. Int. J. Geophys. 2012, 2012. [Google Scholar] [CrossRef]
- Manzanas, R.; Amekudzi, L.K.; Preko, K.; Herrera, S.; Gutiérrez, J.M. Precipitation variability and trends in Ghana: An intercomparison of observational and reanalysis products. Clim. Chang. 2014, 124, 805–819. [Google Scholar] [CrossRef]
- Amekudzi, L.K.; Yamba, E.I.; Preko, K.; Asare, E.O.; Aryee, J.; Baidu, M.; Codjoe, S.N.A. Variabilities in Rainfall Onset, Cessation and Length of Rainy Season for the Various Agro-Ecological Zones of Ghana. Climate 2015, 3, 416–434. [Google Scholar] [CrossRef]
- Nicholson, S.E.; Funk, C.; Fink, A.H. Rainfall over the African continent from the 19th through the 21st century. Glob. Planet. Chang. 2018, 165, 114–127. [Google Scholar] [CrossRef]
- Biasutti, M. Rainfall trends in the African Sahel: Characteristics, processes, and causes. WIREs Clim. Chang. 2019, 10, e591. [Google Scholar] [CrossRef]
- Adjei–Gyapong, T.; Asiamah, R.D. The interim Ghana soil classification system and its relation with the World Reference Base for Soil Resources. In Proceedings of the Quatorzième Réunion du Sous-Comité Ouest et Centre Africain de corréLation des Sols, Abomey, Bénin, 9–13 October 2000; Soil Research Institute—SRI: Kwadaso, Ghana, 2002; pp. 51–76. [Google Scholar]
- Ismaila, U.; Gana, A.S.; Tswanya, N.M.; Dogara, D. Cereals production in Nigeria: Problems, constraints and opportunities for betterment. Afr. J. Agric. Res. 2010, 5, 1341–1350. [Google Scholar]
- Sultan, B.; Gaetani, M. Agriculture in West Africa in the Twenty-First Century: Climate Change and Impacts Scenarios, and Potential for Adaptation. Front. Plant Sci. 2016, 7, 1–20. [Google Scholar] [CrossRef]
- Laux, P.; Kunstmann, H.; Bardossy, A. Predicting the regional onset of the rainy season in West Africa. Int. J. Climatol. 2008, 28, 329–342. [Google Scholar] [CrossRef]
- Silungwe, F.R.; Graef, F.; Bellingrath-Kimura, S.D.; Tumbo, S.D.; Kahimba, F.C.; Lana, M.A. The Management Strategies of Pearl Millet Farmers to Cope with Seasonal Rainfall Variability in a Semi-Arid Agroclimate. Agronomy 2019, 9, 400. [Google Scholar] [CrossRef]
- Ati, O.; Stigter, C.; Oladipo, E. A comparison of methods to determine the onset of the growing season in Northern Nigeria. Int. J. Climatol. 2002, 22, 731–742. [Google Scholar] [CrossRef]
- Marteau, R.; Moron, V.; Philippon, N. Spatial coherence of monsoon onset over Western and Central Sahel (1950–2000). J. Clim. 2009, 22, 1313–1324. [Google Scholar] [CrossRef]
- Yamada, T.J.; Kanae, S.; Oki, T.; Koster, R.D. Seasonal variation of land–atmosphere coupling strength over the West African monsoon region in an atmospheric general circulation model. Hydrol. Sci. J. 2013, 58, 1276–1286. [Google Scholar] [CrossRef]
- Agoungbome, S.M.D.; ten Veldhuis, M.C.; van de Giesen, N. Optimal Sowing Windows under Rainfall Variability in Rainfed Agriculture in West Africa. Agronomy 2023, 13, 167. [Google Scholar] [CrossRef]
- Aryee, J.; Amekudzi, L.; Quansah, E.; Klutse, N.; Atiah, W.; Yorke, C. Development of high spatial resolution rainfall data for Ghana. Int. J. Climatol. 2018, 38, 1201–1215. [Google Scholar] [CrossRef]
- Ziese, M.; Rauthe-Schöch, A.; Becker, A.; Finger, P.; Rustemeier, E.; Schneider, U. GPCC Full Data Daily Version 2020 at 1.0°: Daily Land-Surface Precipitation from Rain-Gauges Built on GTS-Based and Historic Data; Global Precipitation Climatology Centre (GPCC): Offenbach, Germany, 2020. [Google Scholar] [CrossRef]
- De Bruin, H.A.R.; Lablans, W.N. Reference crop evapotranspiration determined with a modified Makkink equation. Hydrol. Process. 1998, 12, 1053–1062. [Google Scholar] [CrossRef]
- Van de Giesen, N.; Hut, R.; Selker, J. The Trans-African Hydro-Meteorological Observatory (TAHMO). WIREs Water 2014, 1, 341–348. [Google Scholar] [CrossRef]
- Akinsanola, A.A.; Zhou, W. Understanding the Variability of West African Summer Monsoon Rainfall: Contrasting Tropospheric Features and Monsoon Index. Atmosphere 2020, 11, 309. [Google Scholar] [CrossRef]
- Quagraine, K.A.; Nkrumah, F.; Klein, C.; Klutse, N.A.B.; Quagraine, K.T. West African Summer Monsoon Precipitation Variability as Represented by Reanalysis Datasets. Climate 2020, 8, 111. [Google Scholar] [CrossRef]
- Fontaine, B.; Louvet, S.; Roucou, P. Definition and predictability of an OLR-based West African monsoon onset. Int. J. Climatol. 2008, 28, 1787–1798. [Google Scholar] [CrossRef]
- Gazeaux, J.; Flaounas, E.; Naveau, P.; Hannart, A. Inferring change points and nonlinear trends in multivariate time series: Application to West African monsoon onset timings estimation. J. Geophys. Res. 2011, 116, D05101. [Google Scholar] [CrossRef]
- Lebel, T.; Ali, A. Recent trends in the Central and Western Sahel rainfall regime (1990–2007). J. Hydrol. 2009, 375, 52–64. [Google Scholar] [CrossRef]
- Raj, J.; Bangalath, H.; Stenchikov, G. West African Monsoon: Current state and future projections in a high-resolution AGCM. Clim. Dyn. 2019, 52, 6441–6461. [Google Scholar] [CrossRef]
- Gbangou, T.; Ludwig, F.; van Slobbe, E.; Hoang, L.; Kranjac-Berisavljevic, G. Seasonal variability and predictability of agro-meteorological indices: Tailoring onset of rainy season estimation to meet farmers’ needs in Ghana. Clim. Serv. 2019, 14, 19–30. [Google Scholar] [CrossRef]
- Marteau, R.; Sultan, B.; Moron, V.; Alhassane, A.; Baron, C.; Traoré, S.B. The onset of the rainy season and farmers’ sowing strategy for pearl millet cultivation in Southwest Niger. Agric. For. Meteorol. 2011, 151, 1356–1369. [Google Scholar] [CrossRef]
- Huho, J.M. Rain-fed agriculture and climate change: An analysis of the most appropriate planting dates in Central Division of Laikipia District, Kenya. Int. J. Curr. Res. 2011, 3, 172–182. [Google Scholar]
- Steduto, P.; Hsiao, T.C.; Raes, D.; Fereres, E. AquaCrop—The FAO crop model to simulate yield response to water: I. Concepts and underlying principles. Agron. J. 2009, 101, 426–437. [Google Scholar] [CrossRef]
- Raes, D.; Steduto, P.; Hsiao, T.C.; Fereres, E. AquaCrop—The FAO crop model to simulate yield response to water: II. Main algorithms and software description. Agro. J. 2009, 101, 438–447. [Google Scholar] [CrossRef]
- Steduto, P.; Hsiao, T.C.; Fereres, E. On the conservative behavior of biomass water productivity. Irrig Sci 2006, 25, 189–207. [Google Scholar] [CrossRef]
- Vanuytrecht, E.; Raes, D.; Steduto, P.; Hsiao, T.C.; Fereres, E.; Heng, L.K.; García-Vila, M.; Moreno, P.M. AquaCrop: FAO’s crop water productivity and yield response model. Environ. Model. Softw. 2014, 62, 351–360. [Google Scholar] [CrossRef]
- Lorite, I.J.; Garcia-Vila, M.; Fereres, E. AquaCrop-GIS Version 2.1: Reference Manual, 1st ed.; FAO Land and Water: Rome, Italy, 2015. [Google Scholar]
- Abedinpour, M.; Sarangi, A.; Rajput, T.; Singh, M.; Pathak, H.; Ahmad, T. Performance evaluation of AquaCrop model for maize crop in a semi-arid environment. Agric. Water Manag. 2012, 110, 55–66. [Google Scholar] [CrossRef]
- Akumaga, U.; Tarhule, A.; Yusuf, A.A. Validation and testing of the FAO AquaCrop model under different levels of nitrogen fertilizer on rain-fed maize in Nigeria, West Africa. Agric. For. Meteorol. 2017, 232, 225–234. [Google Scholar] [CrossRef]
- Nyakudya, I.W.; Stroosnijder, L. Effect of rooting depth, plant density and planting date on maize (Zea mays L.) yield and water use efficiency in semi-arid Zimbabwe: Modelling with AquaCrop. Agric. Water Manag. 2014, 146, 280–296. [Google Scholar] [CrossRef]
- Quiroz, R.S. The climate of the “El Niño” winter of 1982–1983. A season of extraordinary climatic anomalies. Mon. Weather Rev. 1983, 111, 1685–1706. [Google Scholar] [CrossRef]
- Dunning, C.M.; Black, E.; Allan, R.P. Later Wet Seasons with More Intense Rainfall over Africa under Future Climate Change. J. Clim. 2018, 31, 9719–9738. [Google Scholar] [CrossRef]
- Froidurot, S.; Diedhiou, A. Characteristics of wet and dry spells in the West African monsoon system. Atmos. Sci. Let. 2017, 18, 125–131. [Google Scholar] [CrossRef]
- Lodoun, T.; Giannini, A.; Traoré, P.S.; Somé, L.; Sanon, M.; Vaksmann, M.; Rasolodimby, J.M. Changes in seasonal descriptors of precipitation in Burkina Faso associated with late 20th century drought and recovery in West Africa. Environ. Dev. 2013, 5, 96–108. [Google Scholar] [CrossRef]
- Monerie, P.; Pohl, B.; Gaetani, M. The fast response of Sahel precipitation to climate change allows effective mitigation action. Npj Clim. Atmos. Sci. 2021, 4. [Google Scholar] [CrossRef]
- IPCC. Climate Change 2023: Synthesis Report; Contribution of Working Groups I, II, and III to the Sixth Assessment Report of the Intergovernmental Panel on Climate Change; CoreWriting Team; Lee, H., Romero, J., Eds.; IPCC: Geneva, Switzerland, 2023; pp. 35–115. [Google Scholar] [CrossRef]
Figure 1.
Gridded map of the study area in West Africa and mean seasonal rainfall (1 May to 31 October) of each grid cell. The grid represents the latitude and the longitude. The yellow dots represent the location of the TAHMO weather stations (see [21]).
Figure 1.
Gridded map of the study area in West Africa and mean seasonal rainfall (1 May to 31 October) of each grid cell. The grid represents the latitude and the longitude. The yellow dots represent the location of the TAHMO weather stations (see [21]).
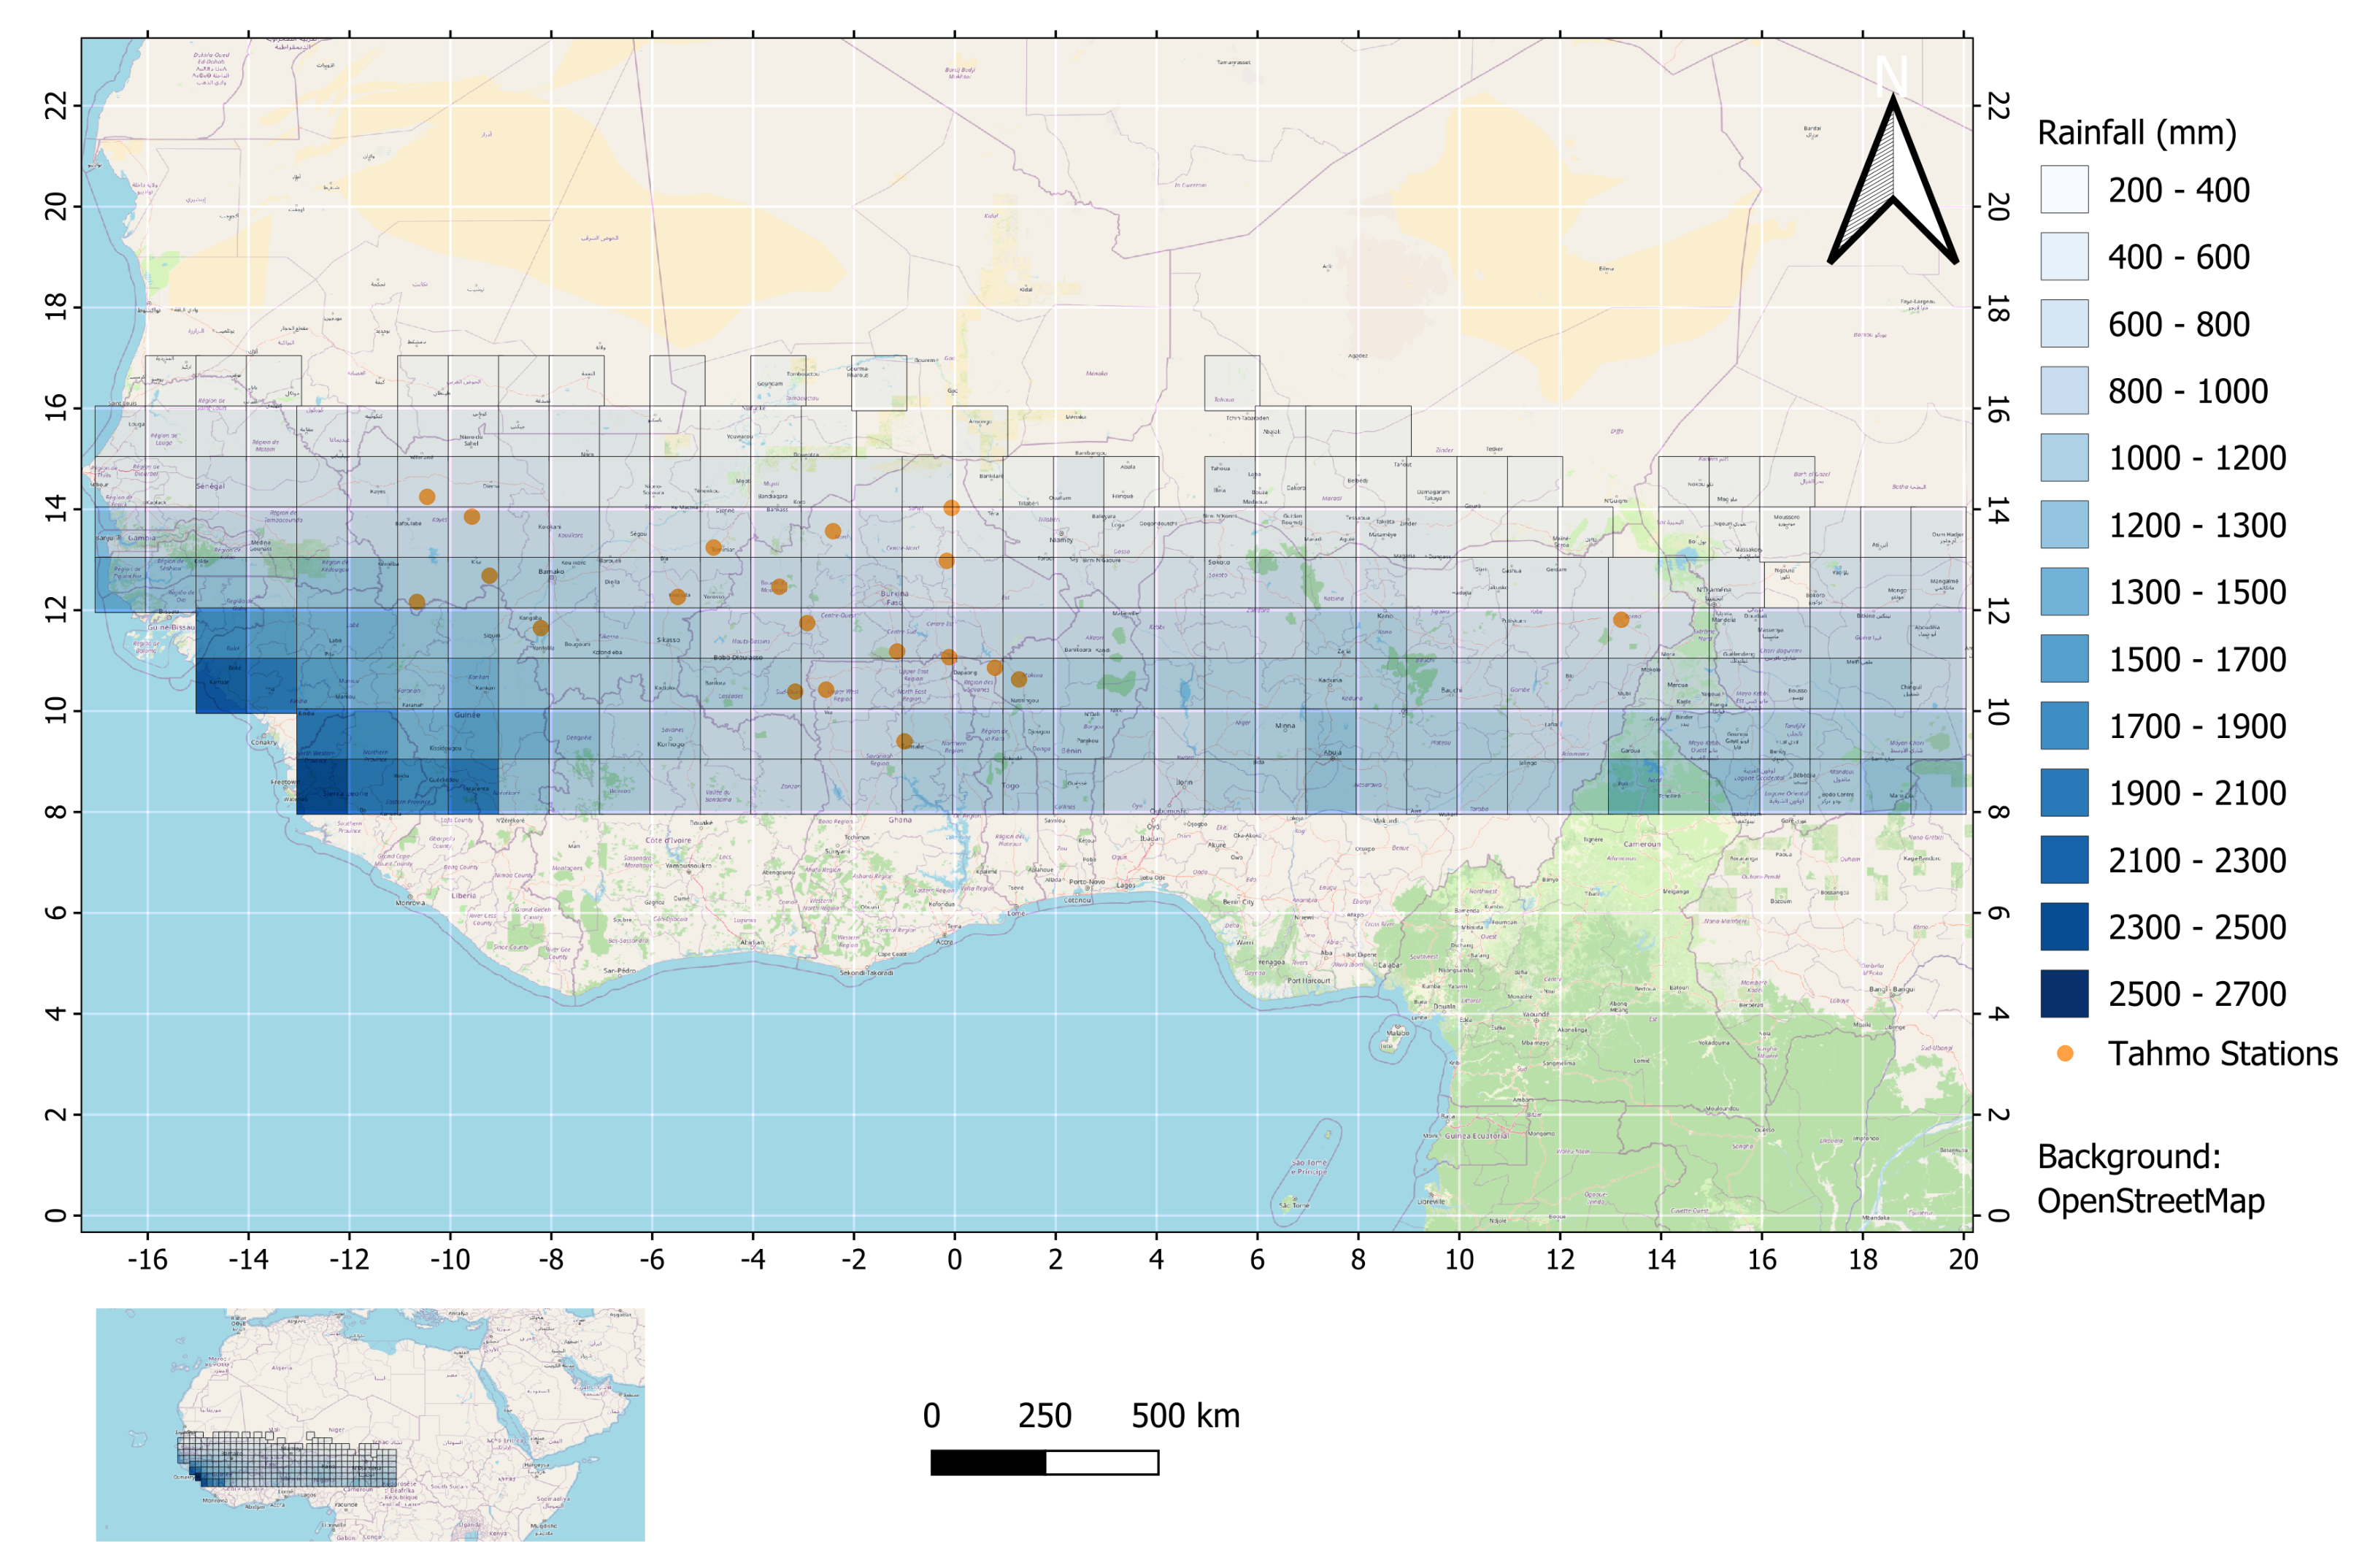
Figure 2.
Rainfall and evapotranspiration distribution at Lat 10.5° N, Lon 3.5° W: (a) average monthly variation; (b) mean regional seasonal (May to October) variation; (c) long-term seasonal variation between 1982 and 2019.
Figure 2.
Rainfall and evapotranspiration distribution at Lat 10.5° N, Lon 3.5° W: (a) average monthly variation; (b) mean regional seasonal (May to October) variation; (c) long-term seasonal variation between 1982 and 2019.

Figure 3.
Inter-annual variation of yield response to sowing dates between 1 May and 30 November at: (a) Lat 10.5° N, Lon 3.5° W, and (b) Lat 14.5° N, Lon 9.5° W. Grey bars represent yearly safe sowing window. Red stars and black crosses correspond to the estimated sowing dates for sowing strategies LO10 mm and LO20 mm, respectively. The two purple horizontal dashed lines represent the intersection of all safe windows for all years in the dataset.

Figure 4.
Start date of the safe window evaluated for the period 1982–2019. The average safe window represents the intersection of the yearly safe windows at each grid with the number of yearly windows considered for the intersection at the center of the grid.
Figure 4.
Start date of the safe window evaluated for the period 1982–2019. The average safe window represents the intersection of the yearly safe windows at each grid with the number of yearly windows considered for the intersection at the center of the grid.

Figure 5.
Boxplot of the latitude and dates of each of the different sowing approaches for the period 1982–2019, with grid cells per latitude zone as indicated in Figure 1: (a) LO20 mm, (b) LO10 mm, (c) Safe window: start and end. On the horizontal axis is the day number of the year, with 1 May equal to Day 121.

Figure 6.
Climate effect for three sowing strategies, considering the difference in recommended sowing dates and start date of the safe sowing window, between the periods 2011–2019 and 1982–1991. (a) for the LO20 mm sowing strategy, (b) for the L10 mm sowing strategy, (c) for the safe window sowing strategy.

Table 1.
Non-conservative parameters adjusted (*) based on [40] for 90 days’ maturation of maize and [41,42].
| Parameter Descriptions | Value | Units or Meaning | Source Values |
|---|---|---|---|
| Time from sowing to maturity | 90 (Fixed) | Day | 97 [40] |
| Time from sowing to emergence | 6 | Day | 6 |
| Time from sowing to start of canopy senescence | 70 * | Day | 72 |
| Time from sowing to flowering | 48 * | Day | 52 [40] |
| Duration of flowering | 10 | Day | 10 |
| Time from sowing to maximum rooting depth | 80 * | Day | - |
| Maximum effective rooting depth, Z | 1.0 | Meter | 1.0 |
| Reference harvest index, | 40 | % | 40 [41] |
| reduction | 54 * | % | 53 |
| under soil fertility stress | 45 * | % | 40–77 |
| Time to maximum canopy cover | 56 | Day | Automated or |
| Building up of | 25 | Day | recommended by |
| Minimum effective rooting depth, | 0.3 | Meter | AquaCrop (FAO) |
| Plant population | 40,000 | Plant/ha | |
| N fertilizer levels | 0 (No input) | N kg/ha | Expert |
| Weeds management | 12 | % coverage | knowledge |
Disclaimer/Publisher’s Note: The statements, opinions and data contained in all publications are solely those of the individual author(s) and contributor(s) and not of MDPI and/or the editor(s). MDPI and/or the editor(s) disclaim responsibility for any injury to people or property resulting from any ideas, methods, instructions or products referred to in the content. |
© 2024 by the authors. Licensee MDPI, Basel, Switzerland. This article is an open access article distributed under the terms and conditions of the Creative Commons Attribution (CC BY) license (https://creativecommons.org/licenses/by/4.0/).
Share and Cite
MDPI and ACS Style
Agoungbome, S.M.D.; ten Veldhuis, M.-C.; van de Giesen, N. Safe Sowing Windows for Smallholder Farmers in West Africa in the Context of Climate Variability. Climate 2024, 12, 44. https://doi.org/10.3390/cli12030044
AMA Style
Agoungbome SMD, ten Veldhuis M-C, van de Giesen N. Safe Sowing Windows for Smallholder Farmers in West Africa in the Context of Climate Variability. Climate. 2024; 12(3):44. https://doi.org/10.3390/cli12030044
Chicago/Turabian StyleAgoungbome, Sehouevi Mawuton David, Marie-Claire ten Veldhuis, and Nick van de Giesen. 2024. "Safe Sowing Windows for Smallholder Farmers in West Africa in the Context of Climate Variability" Climate 12, no. 3: 44. https://doi.org/10.3390/cli12030044
Note that from the first issue of 2016, this journal uses article numbers instead of page numbers. See further details here.