
Soil Water Potential Control of the Relationship between Moisture and Greenhouse Gas Fluxes in Corn-Soybean Field

Abstract
:1. Introduction
2. Experimental Section
2.1. Experimental Field
2.2. Soil Air Sampling and CO2, CH4 and N2O Measurements
2.3. Statistical Analysis
3. Results and Discussion
3.1. Summary Statistics for Soil Moisture at Different Matric Potentials
3.2. Summary Statistics for Measured Soil GHG Fluxes

| Statistics | Ψm = 0 | Ψm = −0.05 | Ψm = −0.1 | Ψm = −0.33 | Ψm = −15 |
|---|---|---|---|---|---|
| Mean | 0.33 | 0.21 | 0.13 | 0.12 | 0.09 |
| SD | 0.07 | 0.04 | 0.01 | 0.01 | 0.02 |
| C.V. | 21.86 | 21.61 | 9.25 | 8.61 | 18.47 |
| Minimum | 0.18 | 0.11 | 0.10 | 0.09 | 0.06 |
| Median | 0.34 | 0.21 | 0.13 | 0.12 | 0.09 |
| Maximum | 0.45 | 0.31 | 0.16 | 0.14 | 0.12 |
| Skew | −0.33 | −0.12 | −0.09 | 0.39 | 0.07 |
| Kurtosis | −1.09 | 0.71 | −0.39 | 0.30 | −1.40 |
| Statistics | CO2 (mg C-CO2 m−2·h−1) | N2O (μg N-N2O m−2·h−1) | CH4 (μg C-CH4 m−2·h−1) |
|---|---|---|---|
| Mean | 477.83 | 21.02 | 16.82 |
| SD | 125.67 | 100.87 | 292.21 |
| C.V. | 26.30 | 479.85 | 1737.10 |
| Minimum | 318.05 | −108.49 | −315.27 |
| Median | 462.37 | −15.65 | −110.04 |
| Maximum | 764.78 | 285.82 | 751.47 |
| Skew | 0.94 | 1.04 | 1.07 |
| Kurtosis | 0.03 | 0.45 | 0.20 |
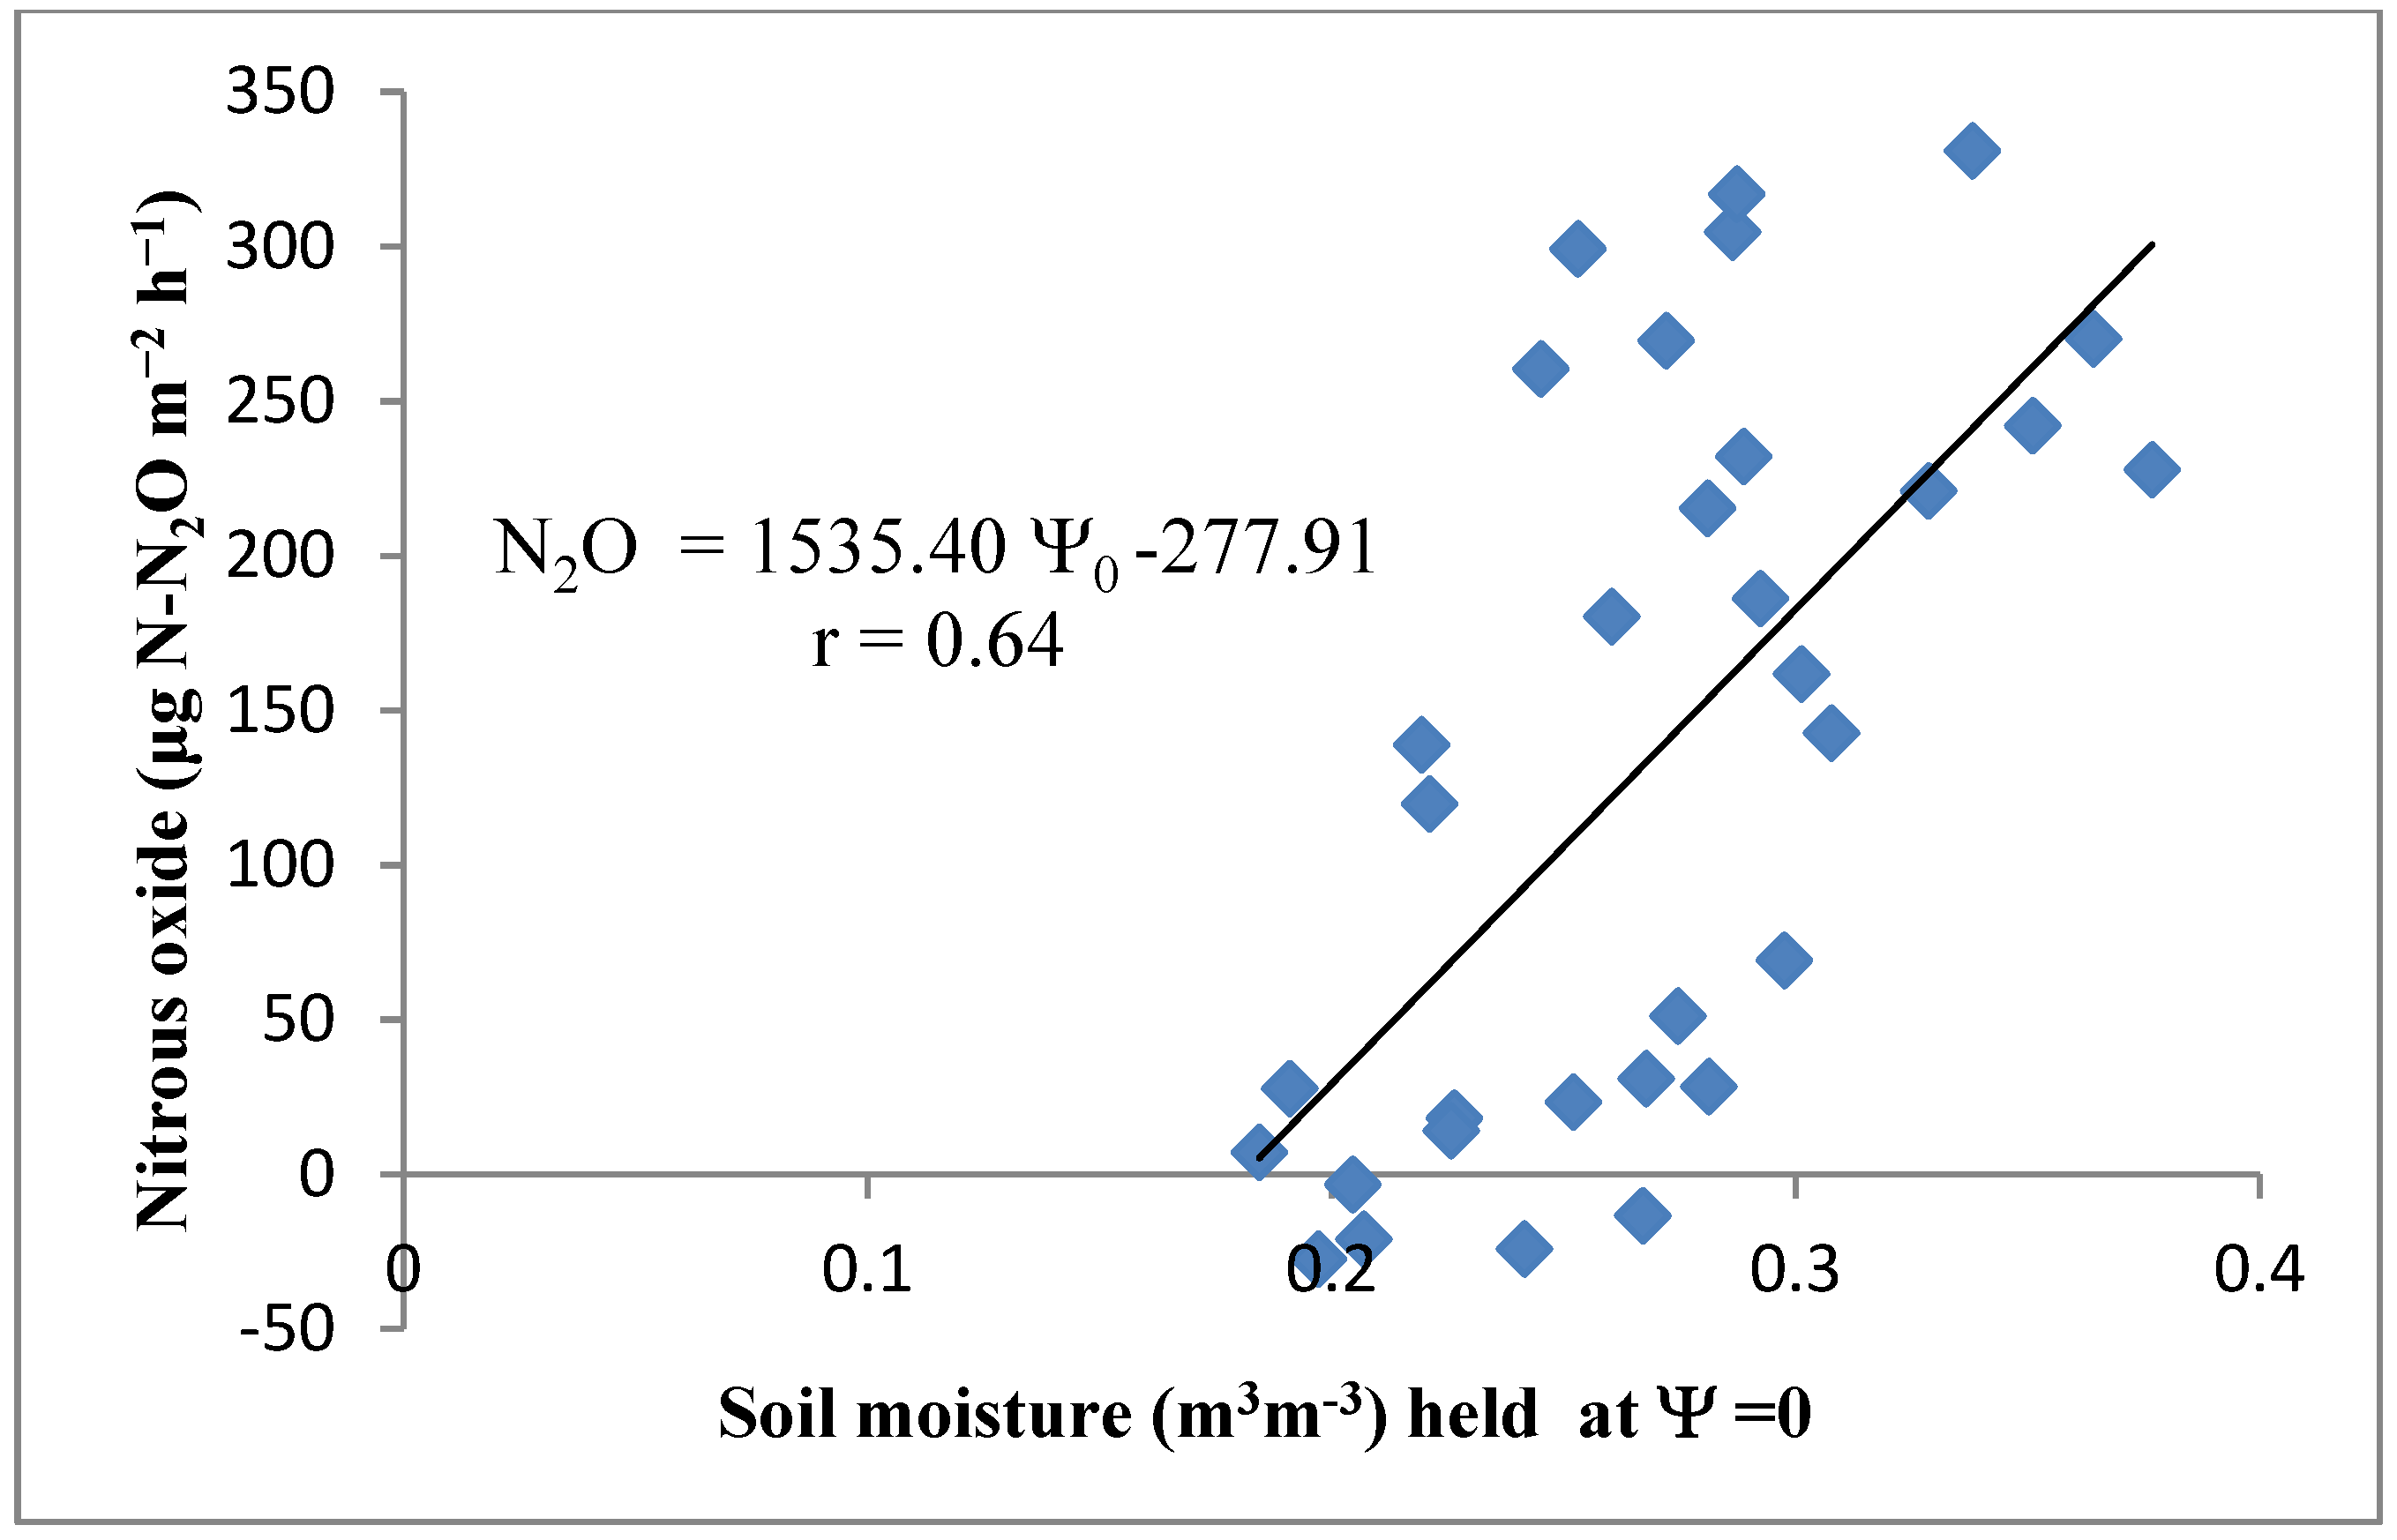
3.3. Relation between Soil Moisture and GHG Fluxes

| Y | X | A | B | F | p | R2 |
|---|---|---|---|---|---|---|
| CO2 | Ψm = 0 | 95.719 | 1800.780 | 9.530 | 0.004 | 0.241 |
| Ψm = −0.05 | 316.975 | 1323.160 | 7.420 | 0.011 | 0.230 | |
| Ψm = −0.1 | 660.242 | −1446.240 | 0.570 | 0.455 | 0.019 | |
| Ψm = −0.03 | 692.787 | −1891.690 | 0.420 | 0.520 | 0.014 | |
| Ψm = −15 | 754.336 | −2589.960 | 0.550 | 0.463 | 0.050 | |
| N2O | Ψm = 0 | −277.910 | 1535.410 | 20.810 | 0.000 | 0.410 |
| Ψm = −0.05 | −462.235 | 2259.790 | 1.280 | 0.267 | 0.041 | |
| Ψm = −0.1 | 106.962 | −681.353 | 0.200 | 0.662 | 0.007 | |
| Ψm = −0.33 | 90.396 | −610.499 | 0.070 | 0.796 | 0.245 | |
| Ψm = −15 | 24.162 | −29.411 | 0.000 | 0.992 | 0.000 | |
| CH4 | Ψm = 0 | 2391.670 | −7649.010 | 7.050 | 0.013 | 0.190 |
| Ψm = −0.05 | 90.330 | −370.831 | 0.180 | 0.672 | 0.071 | |
| Ψm = − 0.1 | −810.305 | 6557.660 | 2.300 | 0.140 | 0.071 | |
| Ψm = −0.33 | −669.196 | 6037.050 | 0.810 | 0.375 | 0.026 | |
| Ψm = −15 | −1247.560 | 11842.900 | 2.260 | 0.143 | 0.070 |
4. Conclusions
Acknowledgments
Author Contributions
Conflicts of Interest
References
- Horowitz, J.; Gottieb, J. The Role of Agriculture in Reducing Greenhouse Gas Emissions. Available online: http://www.ers.usda.gov/media/140711/eb15_1_.pdf (accessed on 07 February 2015).
- Satterthwaite, W. Cities’ contribution to global warming: Notes on the allocation of greenhouse gas emissions. Environ. Urban. 2008, 20, 539–549. [Google Scholar] [CrossRef]
- Tubiello, F.N.; Salvatore, M.; Rossi, S.; Ferrara, A.; Fitton, N.; Smith, P. The FAOSTAT database of greenhouse gas emissions from agriculture. Environ. Res. Lett. 2013, 8. [Google Scholar] [CrossRef]
- Gregorich, E.G.; Rochette, P.; VandenBygaart, A.J.; Angers, D.A. Greenhouse gas contributions of agricultural soils and potential mitigation practices in Eastern Canada. Soil Tillage Res. 2005, 94, 262–263. [Google Scholar] [CrossRef]
- Mosier, A.R.; Halvorson, A.D.; Reule, C.A.; Liu, X.J. Net global warming potential and greenhouse gas intensity in irrigated cropping systems in Northeastern Colorado. J. Environ. Qual. 2006, 35, 1584–1598. [Google Scholar] [CrossRef] [PubMed]
- Kuzyakov, Y. Sources of CO2 Efflux from soil and review of partitioning methods. Soil Biol. Biochem. 2006, 38, 425–448. [Google Scholar] [CrossRef]
- Firestone, M.K.; Davidson, E.A. Microbiological basis of NO and N2O production and consumption in soil. In Exchange of Trace Gases between Terrestrial Ecosystems and the Atmosphere; Andraea, M.O., Schimel, D.S., Eds.; John Wiley & Sons: New York, NY, USA, 1989; pp. 7–21. [Google Scholar]
- Laughlin, R.J.; Stevens, R.J. Evidence for fungal dominance of denitrification and Codenitrification in a grassland soil. Soil Sci. Am. J. 2002, 66, 1540–1548. [Google Scholar] [CrossRef]
- Davidson, E.A.; Janssens, I.A. Temperature sensitivity of soil carbon decomposition and Feedbacks to climate change. Nature 2006, 440, 165–173. [Google Scholar] [CrossRef] [PubMed]
- Conrad, R. Control of methane production in terrestrial ecosystems. In Exchange of Trace Gases between Terrestrial Ecosystems and the Atmosphere; Andraea, M.O., Schimel, D.S., Eds.; John Wiley & Sons: New York, NY, USA, 1989; pp. 39–58. [Google Scholar]
- Campbell, G.S.; Gee, G.W. Water potential: Miscellaneous methods. In Methods of Soil Analysis; Klute, A., Ed.; ASA and SSSA: Madison, WI, USA, 1986; Volume 9, pp. 619–633. [Google Scholar]
- Linn, D.M.; Doran, J.W. Effect of water-filled pore space on carbon dioxide and nitrous oxide production in tilled and nontilled soils. Soil Sci. Soc. Am. J. 1984, 48, 1267–1272. [Google Scholar] [CrossRef]
- Davidson, E.A.; Louis, V.V.; Cattanio, J.H.; Ackerman, I.L.; Carvalho, J.E.M. Effects of soil water content on soil respiration in forests and cattle pastures of Eastern Amazonia. Biogeochemistry 1998, 48, 53–69. [Google Scholar] [CrossRef]
- Orchard, V.A.; Cook, F. Relationship between soil respiration and soil moisture. Soil Biol. Biochem. 1983, 15, 447–453. [Google Scholar] [CrossRef]
- Gun-Yeob, K.; Jeong, H.; Sonn, Y.; Kim, S.; Lee, J.; Kim, P.J. Effect of soil water potential on methane and nitrous oxide emissions in upland soil during red pepper cultivation. J. Korean Soc. Appl. Biol. Chem. 2014, 57, 15–22. [Google Scholar]
- Haruna, S.; Nkongolo, N.V. Effects of tillage, cover crop and corn-soybean rotation on the Chemical and physical properties of a silt-loam soil. Master Thesis, Lincoln University of Missouri, Jefferson, MO, USA, May 2013. [Google Scholar]
- Caruso, M.; Jommi, C. Enhancement of a commercial pressure plate apparatus for soil water retention curves. Unsaturated Soils: Res. Appl. 2012. [Google Scholar] [CrossRef]
- Nkongolo, N.V.; Johnson, S.; Eivazi, F.; Schmidt, K. Greenhouse gases fluxes and soil thermal properties in a pasture in Central Missouri. J. Environ. Sci. 2010, 22, 1029–1039. [Google Scholar] [CrossRef]
- Whalley, W.R.; Ober, E.S.; Jenkins, M. Measurement of the matric potential of soil water in the Rhizosphere. J. Exp. Bot. 2013, 64, 3951–3963. [Google Scholar] [CrossRef] [PubMed]
- Cassel, D.K.; Klute, A. Water potential: Tensiometry. In Methods of Soil Analysis: Part 1. Physical and Mineralogical Methods, 9, 2nd ed.; Klute, A., Ed.; American Society of Agronomy—Soil Science Society of America: Madison, WI, USA, 1986; pp. 563–596. [Google Scholar]
- Lydie, C.L.; Wrage, N.; Metay, A.; Chotte, J.; Bernoux, M. Soils, a sink for N2O? A review. Glob. Change Biol. 2007, 13, 1–17. [Google Scholar]
- Edwards, N.T. Root and soil respiration responses to ozone in Pinus taeda L. seedlings. New Phytol. 1991, 118, 315–322. [Google Scholar] [CrossRef]
- Davidson, E.A.; Swank, W.T. Environmental parameters regulating Gaseous-N losses from two forested ecosystems via nitrification and denitrification. Appl. Environ. Microbiol. 1986, 52, 1287–1292. [Google Scholar] [PubMed]
- Ponnamperuma, F.N. The chemistry of submerged soils. Adv. Agron. 1972, 24, 29–96. [Google Scholar]
- Silvia, D.M. Principles and Applications of Soil Microbiology, 2nd ed.; Pearson Prentice Hall: Upper Saddle River, NJ, USA, 2005. [Google Scholar]
© 2015 by the authors; licensee MDPI, Basel, Switzerland. This article is an open access article distributed under the terms and conditions of the Creative Commons Attribution license (http://creativecommons.org/licenses/by/4.0/).
Share and Cite
Panday, D.; Nkongolo, N.V. Soil Water Potential Control of the Relationship between Moisture and Greenhouse Gas Fluxes in Corn-Soybean Field. Climate 2015, 3, 689-696. https://doi.org/10.3390/cli3030689
Panday D, Nkongolo NV. Soil Water Potential Control of the Relationship between Moisture and Greenhouse Gas Fluxes in Corn-Soybean Field. Climate. 2015; 3(3):689-696. https://doi.org/10.3390/cli3030689
Chicago/Turabian StylePanday, Dinesh, and Nsalambi V. Nkongolo. 2015. "Soil Water Potential Control of the Relationship between Moisture and Greenhouse Gas Fluxes in Corn-Soybean Field" Climate 3, no. 3: 689-696. https://doi.org/10.3390/cli3030689