
Drought Monitoring for Rice Production in Cambodia


1
School of Environment, Flinders University, Sturt Road, Bedfork Park, SA 5042, Australia
2
Faculty of Development Studies, Royal University of Phnom Penh, Phnom Penh 12101, Cambodia
*
Author to whom correspondence should be addressed.
Climate 2015, 3(4), 792-811; https://doi.org/10.3390/cli3040792
Submission received: 23 July 2015
/
Revised: 1 October 2015
/
Accepted: 9 October 2015
/
Published: 16 October 2015
(This article belongs to the Special Issue Climate Change on Crops, Foods and Diets)
Abstract
:Rice production underpins the national economy and the most rural livelihoods in Cambodia, but it is negatively impacted by repeated droughts. The research reported on in this paper focuses on relationships between drought occurrences in Cambodia’s most drought-prone province (Kampong Speu) and (i) damage to the annual rice harvest between 1994 and 2011, and (ii) the Niño 3.4 index. Droughts were identified using the Standardised Precipitation Index (SPI). In seven of the years between 1994 and 2006 droughts damaged >1000 ha of rice in the Kampong Speu province. Furthermore, in 11 years >200 ha of rice were damaged. A critical success index of 0.66 obtained for an analysis of SPI-defined drought and area rice damage in the province indicates a strong statistical relationship. A statistically significant correlation (r = −0.455) was achieved between Niño 3.4 and 12-month SPI values lagged by three months, this indicates the importance of ENSO linkages in explaining drought in this region. Late season droughts lead to greater rice damage than early- and mid-season droughts.
1. Introduction
Cambodia produced 9.29 million tonnes of rice in 2012. This generated a rice surplus of 4.73 million tonnes [1]. Annual surpluses of this magnitude should enable the country to achieve its stated aim of exporting 3 million tonnes per year by 2015 [2]. Rice contributes 28 percent of the GDP generated by the agriculture, fisheries and forestry sector in Cambodia [3], but production relies on rural households working small farms (national average farm size = 1.4 hectares per household) using traditional practices [4]. Over 80 percent of Cambodia’s population live in such rural communities, and rely on rice as their major income source as well as their staple food. Put simply, rice underpins the national economy and the majority of livelihoods.
Yet, rice production in Cambodia is significantly impacted by droughts and floods related to inter-seasonal and inter-decadal fluctuations in the South East Asian Monsoon (SEAM)—a subsystem of the East Asian Monsoon. Droughts have been identified by the government as one of the two most important natural hazards in the country [5,6]. Their impact on rice production and drought alleviation measures have been reviewed by Chhinh [7]. The Ministry of Environment (MoE) estimated that between 1996 and 2000 drought-related rice losses were approximately 20 percent of potential national production [8]. Since then, a severe drought in 2004 affected 300,000 hectares of paddy rice leading to an 82 percent loss of the potential harvest [9]. In response to another severe drought in 2009, the government issued a USD 12 million rescue package [10].
The occurrence of droughts and floods in Cambodia is related to the dominant climate system in Southeast Asia, the Asian-Australian Monsoon (AAM) [11,12]. The East Asian Monsoon (EAM) is one of a number of subsystems within the AAM [12,13]. Linkages between the EAM and socio-economic development have been highlighted by other researchers [11,14]; with particular attention being paid to droughts and heat waves [15], and flooding [16] (as cited in [17]). According to Huang & Zhou [17], the EAM led to production losses exceeding USD 24 billion annually in China (three to six percent of the country’s GDP) in the early 1990s fluctuations in the EAM). Strong correlations have also been found between the EAM and droughts and floods in the Yangtze and Yellow River basins [18] and along the Yangtze and Huaihe Rivers [19,20].
The aims of this research are to explore the 1) relationship between the occurrence of droughts based on the application of a drought index—the Standardised Precipitation Index (SPI)—and the areal extent of rice damage in the most drought-prone province of Cambodia (Kampong Speu); and 2) relationships between SPI values and indicator values for ENSO.
2. South East Asian Monsoon
There are contrasting views on the monsoon geography of Southeast Asia. The Asian Summer Monsoon (ASM), of which the SEAM is a sub-system, has been described as the climate system which brings rain-bearing winds that originate in the Bay of Bengal to the Indochina Peninsula and the South China Sea (SCS) [21]. Wang and Lin [22] argue that while the Indian subcontinent is influenced by the Indian Summer Monsoon (ISM), Indochina is influenced by three subsystems—the ISM, East Asian Summer Monsoon (EASM), and Western North Pacific Summer Monsoon (WNPSM). Goswami et al. [23] includes Indochina in the zone of influence of the ISM—terming it the Extended Indian Monsoon Rainfall region. Given these geographical contradictions, it is unsurprising that the Indochina region has been the focus of many regional climate studies [21,24,25,26]. In contrast Qian and Zhu [27] consider the SEAM to be a unique monsoon subsystem in which rainfall originates to both the east and west of the Southeast Asia.
Chen and Yoon [25] have proposed two key mechanisms that affect the summer monsoon in Indochina; (1) the combined SCS and Western Pacific regional climate driver, and (2) the global divergent water vapor flux. They also argue that sea surface temperatures (SST) in the western tropical Pacific are a good climate predictor for Indochina. Zhang et al. [21] argue that (1) tropical convection triggers the onset of the monsoon, and (2) that interseasonal variability is associated with the timing of monsoon’s onset which originates in the western Pacific and the SCS and propagates toward Indochina. Both Zhang et al. [21] and Chen and Yoon [25] agree that the SST anomalies influence on the onset of the monsoon. In contrast to this Pacific Ocean focus, Misra and DiNapoli [24] concluded that early onset of the SEAM is associated with moisture sources in the Andaman Sea, the Gulf of Martaban and the Gulf of Thailand, while late onset of the monsoon is associated with water fluxes from the Bay of Bengal and the Arabian Sea. Ichiyanagi et al. [28] argue that during the withdrawal of the monsoon in Indochina, the moisture source changes from the Indian Ocean to Pacific Ocean.
Nigam [29] concluded that circulation anomalies due to changes in the zonally-averaged state of the El Niño Southern Oscillation (ENSO) modulate low-level moisture fluxes over southeast Cambodia, Laos and Vietnam. ENSO and SST anomalies are linked. SST is measured at a number of locations along Equator in the Pacific Ocean, from Niño 1 in the east to Niño 4 in west [30]. Anomalies occurs when the SST is > +0.5 or < −0.5 for five consecutive 3-month running means over one of the regions of the Equatorial Pacific (positive values create the El Niño effect, and negative values the La Niña effect). This measurement is known as the Ocean Niño Index (ONI). The most commonly used region for calculating ONI for drought monitoring is Niño 3.4 [30,31]. Lyon [32] used Niño 3.4 to measure the strength of El Niño and the spatial extent of droughts in tropical regions. Gadgil, et al. [33] found that Niño 3.4 is well correlated with Indian Summer Monsoon rainfall. It has also been used in Thailand [34], Indonesia [35], Malaysia [36]. Indices have been calculated for other regions, for example, Niño 3 was used by Ashok, et al. [37], and Niño 4 [25,38] and Niño 1+2 [39] have been used as well.
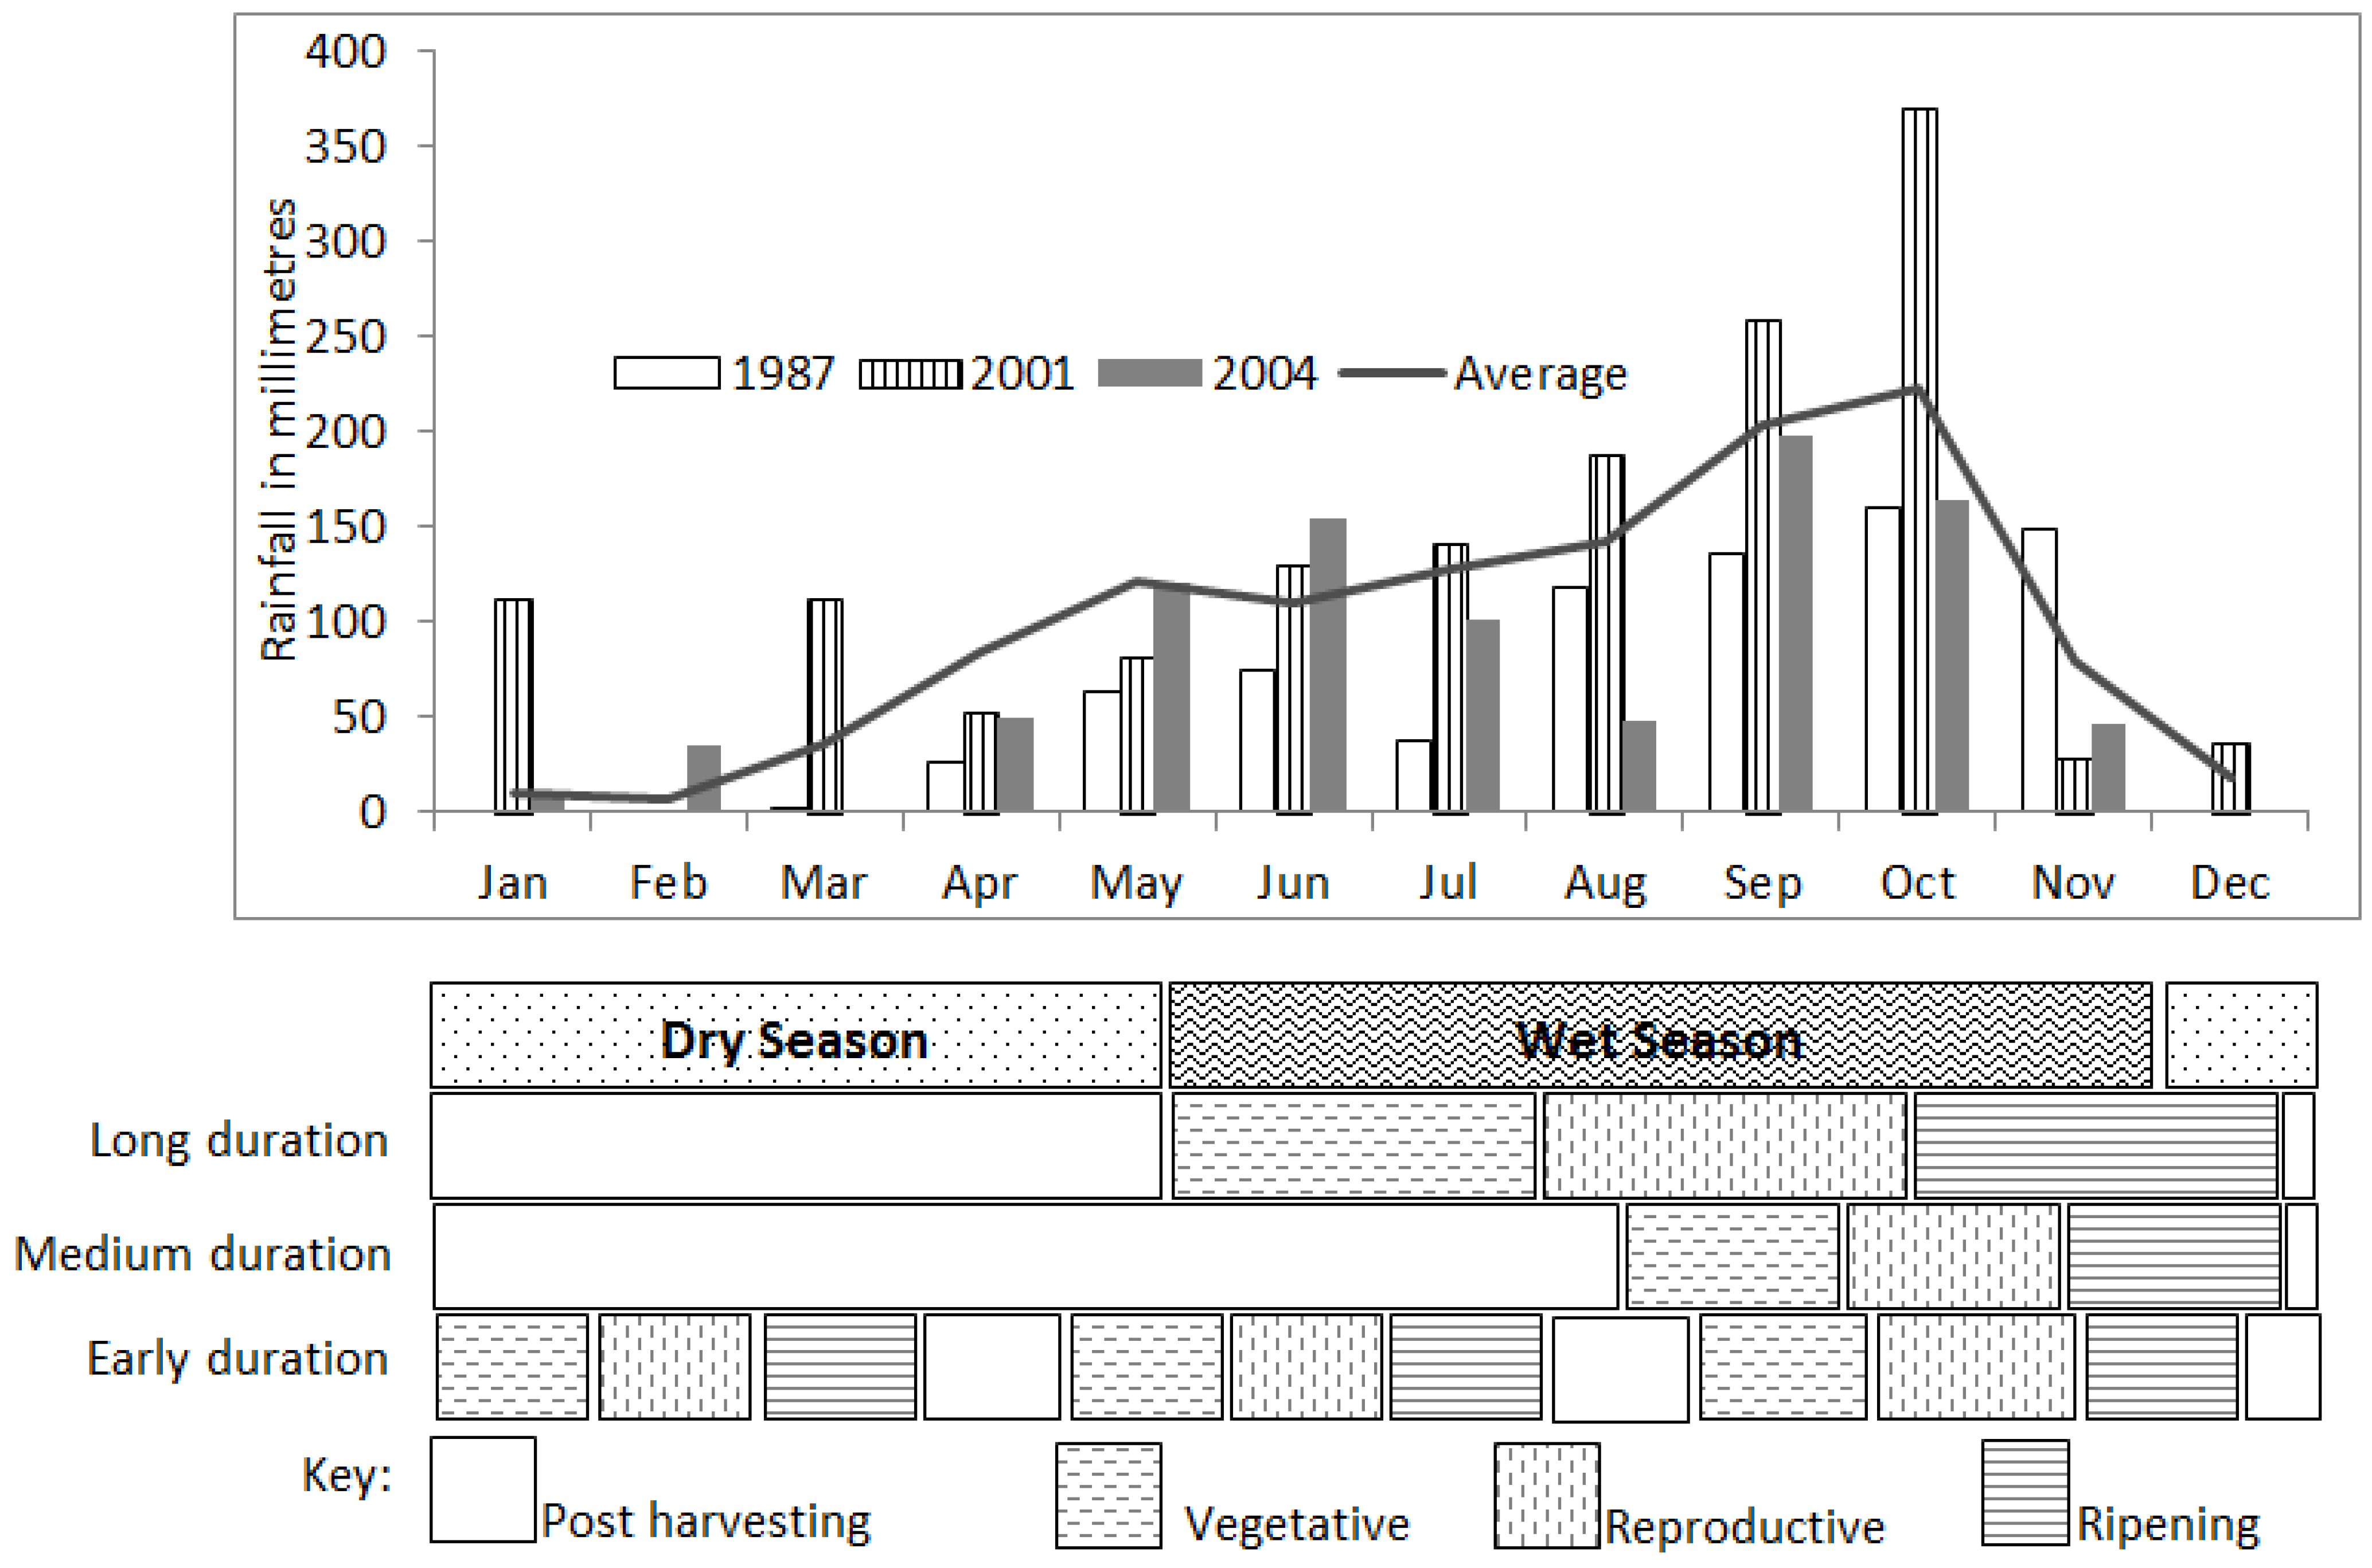
The annual rainfall regime in Cambodia (based on long term climate means) comprises a five-month dry season (December-April) and a longer wet season from the onset of the SEAM, normally May to November (Figure 1). The wet season is slightly bimodal with a dry spell that is usually centred on August. This is called Kuon Rodow Prang (the literal translation from Cambodian being the “child dry season”). More than 80 percent of the precipitation normally occurs in the wet season.
Figure 1 shows both the mean monthly rainfall for 1983–2012 for Kampong Speu and the monthly rainfall for indicative dry (1987) and wet (2001) years, and the year most impacted by drought—2004. In the two dry years—1987 and 2004—no month had more than 200 mm of rainfall and the wet seasons were marginally shorter than in 2001. The wettest year—2001—not only had more wet season rainfall than the other two years, but some ‘dry season’ months also had relatively high rainfall. The Kuon Rodow Prang dry spell varied from a pronounced decline in rainfall in August 2004 to a much less pronounced dry spell in July 1987. In 2001 there was no Kuon Rodow Prang dry spell.
Figure 1.
Kampong Speu climate station: mean monthly average rainfall (1983–2012) and monthly rainfall totals for three indicative years. Rice development phases for long-, medium- and early-season rice varieties are provided below the rainfall data. Sources: (rainfall: Department of Water Resources and Meteorology, rice development data: [fieldwork observation]).

3. Monsoon Seasonality and Rice Production
Coupling precipitation records and cropping calendars (Figure 1) illustrates how different rice varieties are adjusted to average climatic conditions and how they may be impacted by drought. The most popular rice varieties grown in Cambodia are the traditional, long maturing rice varieties, which utilise soil moisture throughout the wet season. Seedlings of these varieties are transplanted in May and the harvest takes place in late November [40]. Medium-duration varieties have mainly been cultivated in the last two decades, whereas short-duration varieties are a more recent introduction to Cambodian farming systems. Whereas medium-duration varieties are only cultivated in the wet season, albeit for a shorter cropping period than ong-maturing varieties, short season rice can be harvested approximately three months after sowing and can be grown at any time of the year. However, as Figure 1 shows, there are three times in the farming calendar when the majority of short-duration rice is cultivated: (a) December to March, at this time of year farmers utilise standing water and residual soil moisture, which can be supplemented by irrigation; (b) May to August, by utilising early wet season rains before harvesting in the Kuon Rodow Prang dry spell; and (c) September to November, when late wet season rains are exploited and the harvest coincides with that of the long- and medium-duration varieties. The proportions of the long-, medium- and short-duration rice by area planted are approximately 20, 40, and 33 percent respectively [41].
Susceptibility to drought can be argued from an examination of the crop calendars. Any significant change in wet season rainfall (e.g., precipitation amount, length of the season, or timing and length of the Kuon Rodow Prang dry spell) has the potential to affect the yields of long-maturing rice varieties. Medium-duration varieties are susceptible to the same drought-related phenomena. Short season rice is the least susceptible to drought, but nonetheless can still be affected. For example, a delayed onset of monsoon rains means that irrigation is required for the May to August crop. Helmer [42] argues that drought in Cambodia occurs at three different times: in the early and middle parts of the wet season, and at the end of the year. Failure of the late wet season rains is potentially the most problematic because all three varieties of rice are harvested in November.
In 2008, the total area under paddy cultivation in Cambodia was 2.61 million hectares. Irrigated paddy accounted for 31.6 percent (approximately 825,000 hectares). A further 239,000 hectares required supplementary wet season irrigation—mainly for May to August short-duration rice. A further 74,200 hectares relied on dry season irrigation, mainly for rice grown between December and March [5]. Even so, irrigation is limited and does not obviate the fact that drought is the most important natural hazard in Cambodia after flooding [43]. Consequently, monitoring drought and the damage it causes to agricultural production in Cambodia is a national priority in terms of food security and international trade. While the impacts of drought may be reduced by early interventions and improvements in infrastructure, these are unlikely to be effective unless droughts can be explained, predicted and monitored accurately.
4. Study Area
Kampong Speu Province (KPS) was selected for this research because of its high incidence of droughts compared to other provinces. It is located in the rain shadow of the Cardamoms and the Elephant mountain ranges and receives the least rainfall of any province in Cambodia. Mean annual precipitation ranges from 1250 to 1750 mm for the parts where rice is grown. Paddy fields on the small farms that dominate the province are rain-fed and have experienced drought damage that has ranged from loss of seedlings to almost the loss of the entire harvest over the last few decades.
The province covers 696,971 ha and the agricultural area in 2009 (based on the Provincial Data Book) was 167,771 ha, or about 26 percent of total land area. The province comprises 87 communes grouped into eight districts. The population in 2008 was 784,799. The smallest administrative unit is the village, which usually contain about 200 households. Farming is the primary occupation of 92 percent of households [44].
The rainfall records for the 18 climate stations in KPS are provided in Table 1. The majority of stations started recording data in 2000; however, there are interruptions to the records. Kampong Speu station has the longest and most complete record. Measurements were made by the Department of Agriculture (DA) from 1983 to 2003, and by the Department of Water Resources and Meteorology (DWRAM) from 2000 to the present. The interruptions in the climate records have been caused by the change in the authority responsible from data collection, flooding of the DA data archives in 2000, and the devastation caused by the 1970 to 1999 civil war.

| Station (see Figure 2) | Data range | Minimum (mm) (Year) | Maximum (mm) (Year) | Mean (mm) | Difference between Mean and Minimum | Difference between Mean and Maximum | |
|---|---|---|---|---|---|---|---|
| (a) | (b) | (c) | (a−c)/(c) | (b−c)/(c) | |||
| Kampong Speu (KPS) | 1983 | 2012 | 882.7 (1987) | 1858.0 (2000) | 1315.7 | −33% | 41% |
| Thnal Teteung (THT) | 1995 | 2009 | 631.7 (2004) | 1408.5 (1996) | 1059.4 | −40% | 33% |
| Phnom Sruoch (PSH) | 1995 | 2012 | 654.0 (1997) | 1620.8 (2000) | 1165.3 | −44% | 39% |
| Udong (UDN) | 1995 | 2012 | 901.5 (2006) | 1751.5 (2000) | 1230.3 | −27% | 42% |
| Kong Pisey (PSY) | 1995 | 2012 | 862.9 (2009) | 1501.1 (1999) | 1146.1 | −25% | 31% |
| Thpong (THP) | 1995 | 2012 | 704.6 (1997) | 1686.2 (1999) | 1271.2 | −45% | 33% |
| Borsedth (BST) | 1996 | 2012 | 574.0 (1997) | 1708.0 (1996) | 1237.4 | −54% | 38% |
| Aoral (ORL) | 1997 | 2012 | 666.5 (1997) | 1570.4 (2003) | 1169.5 | −43% | 34% |
| Prey Phdau (PPD) | 1997 | 2012 | 610.3 (1997) | 1565.3 (2001) | 1164.7 | −48% | 34% |
| Peam Khley (PKL) | 2001 | 2012 | 601.1 (2007) | 1424.3 (2001) | 884.3 | −32% | 61% |
| OTaroat (OTR) | 2001 | 2012 | 640.9 (2008) | 1336.2 (2001) | 952.7 | −33% | 40% |
| Kraing Ampil (KRA)1 | 2001 | 2011 | 370.6 (2004) | 1244.4 (2001) | 807.1 | −70% | 54% |
| Kirirom (KRM) | 2001 | 2005 | 1158.9 (2002) | 2254.9 (2001) | 1496.7 | −23% | 51% |
| Sre Khlong (SKL) | 2001 | 2011 | 924.1 (2006) | 1433.8 (2001) | 1171.5 | −21% | 22% |
| Prey Dob (PRD) | 2001 | 2012 | 622.6 (2011) | 1416.3 (2009) | 1069.8 | −42% | 32% |
| Sdock (SD) | 2001 | 2012 | 601.1 (2007) | 1424.3 (2001) | 884.3 | −32% | 61% |
| Tropeang Chor (TRC) | 2001 | 2011 | 803.1 (2007) | 1391.5 (2009) | 1066.2 | −25% | 31% |
| O Sya (OSV) | 2002 | 2011 | 797.6 (2004) | 1404.9 (2003) | 1020.1 | −22% | 38% |
1. Rainfall data from this station is suspect. The minimum rainfall records in 2005 (122.7 mm) and 2006 (184.9 mm) are anomalously low, compared to the neighbouring stations, and were not used.
5. Drought Indices
Nagarajan [45] provides detailed definitions of agricultural, hydrological, meteorological, and socio-economic droughts [46,47]. This research focuses on meteorological drought. Drought severity has been quantified in different ways. Some authors have used meteorological data (e.g., the Palmer Drought Severity Index: Buckley [48], Nguyen and Shaw [49]); some have used human perception (e.g., MoE [50]); while others have measured productivity losses using indices such as the Normalized Difference Vegetation Index (NDVI) from remotely sensed data (e.g., NCDM [51]). Quiring et al. [52] comprehensively reviewed drought indices and argue that they play an important role in providing decision makers and other stakeholders with critical information. Many benefits accrue from deploying drought indices [28,53,54,55,56,57,58,59] despite their limitations and assumptions [28,52,60].
The Standardized Precipitation Index (SPI) [61] has been used in many climate zones. It is listed as a key indicator for global drought monitoring [62,63]; and has been used for drought monitoring in the United States and India [64,65,66]. It was used in this research because it is based solely on precipitation—and therefore is the drought index of most use in the instrument-poor situation that describes most climate stations in Cambodia. KPS is no exception, as precipitation is the only data available for most of the stations in the province. A further advantage of the SPI is that it can be calculated for different time scales. This gives it a potentially important role in understanding the impacts of dry spells on crop production. SPI has also proven suitable for monitoring floods as well as droughts in many parts of the world [47,67,68].
Figure 2.
Kampong Speu Province. Sources: rainfall stations from fieldwork; major river network from Mekong River Commission; delineation of the Prek Thnot Watershed from GDEM data obtained from the HEC-GeoHMS program; elevation data from the Aster GDEM; and provincial boundaries from the National Geographic Department of Cambodia).

The SPI is a probability related to a precipitation value. The standardized precipitation (SP) is the value derived from dividing the variation from the mean precipitation of a defined time period (1, 2, 3 months etc.) and the standard deviation of the data set. For example, calculation of the SPI over a three-month timescale, labelled as June 2004, would be calculated using the total rainfall for April, May and June 2004. To estimate the probability of the distribution, the gamma function is used as it fits meteorological data very well and has zero as its lower bound value [61,69]. As posited by Thom [70], the probability density function of the gamma function for a time period of rainfall is:
where β is a scale parameter, α is a shape parameter, and Γ(α) is the ordinary gamma function of α. The equation requires α and β to be obtained from the following maximum likelihood solutions:
and
where
where n is number of precipitation and x is the amount of precipitation for a particular time period.
The probability that the precipitation is less than an amount (for a particular time period) is presented in the standard form: . Tables of the gamma distribution provide the cumulative probability of the specified period. The cumulative probabilities are converted into a Z-score (which becomes the SPI value). An SPI value is relative to a particular month [2] and indicates the drought severity over the specified time period. The original convention was that SPI values of 0 to < −2.0 were divided into four classes of drought ranging from mild to extreme [61]. However, Hao et al. [62] introduced five categories of drought starting at a -0.50 threshold rather that 0. These classes are defined as follows, SPI ≤ −0.50 to −0.79 is termed “abnormally dry”, −0.80 to −1.29 is a “moderate drought”, −1.30 to −1.59 is a “severe drought”, −0.60 to −1.99 is an “extreme drought”, and −2.0 or less is an “exceptional drought. This classification has been used in this research.
6. Results
SPI values were calculated for time periods of one, two, three ending in June, August, or November and 12 months for precipitation data for Kampong Speu station (Table 2). The time periods developed around the three months listed above relate to the average rainfall pattern, particularly the onset of the monsoon and key aspects of monsoon variability, and paddy rice growth. In terms of the mean rainfall pattern, June is early in the wet season, August is the driest month in the wet season, and November is at the end of wet season. June, August and November are also related to early, middle and late seasonal droughts cited in the literature [7,42]. In terms of paddy rice growth, June is the paddy rice vegetative period for long maturing varieties. August usually coincides with the Kuon Rodow Prang dry spell and fluctuations in precipitation at that time impact on paddy reproduction. November is the maturation and grain filling period. The 12-month periods were used when applying the critical success index to the analysis of SPI-defined drought and areal assessments of drought-related rice damage.
| 1-Month SPI | 2-Month SPI | 3-Month SPI | 12-Month SPI | |
|---|---|---|---|---|
| Base month = June | June | May June | April May June | 12 consecutive months up to June |
| Base month = August | August | July August | June July August | 12 consecutive months up to August |
| Base month = November | November | October November | September October November | 12 consecutive months up to November |
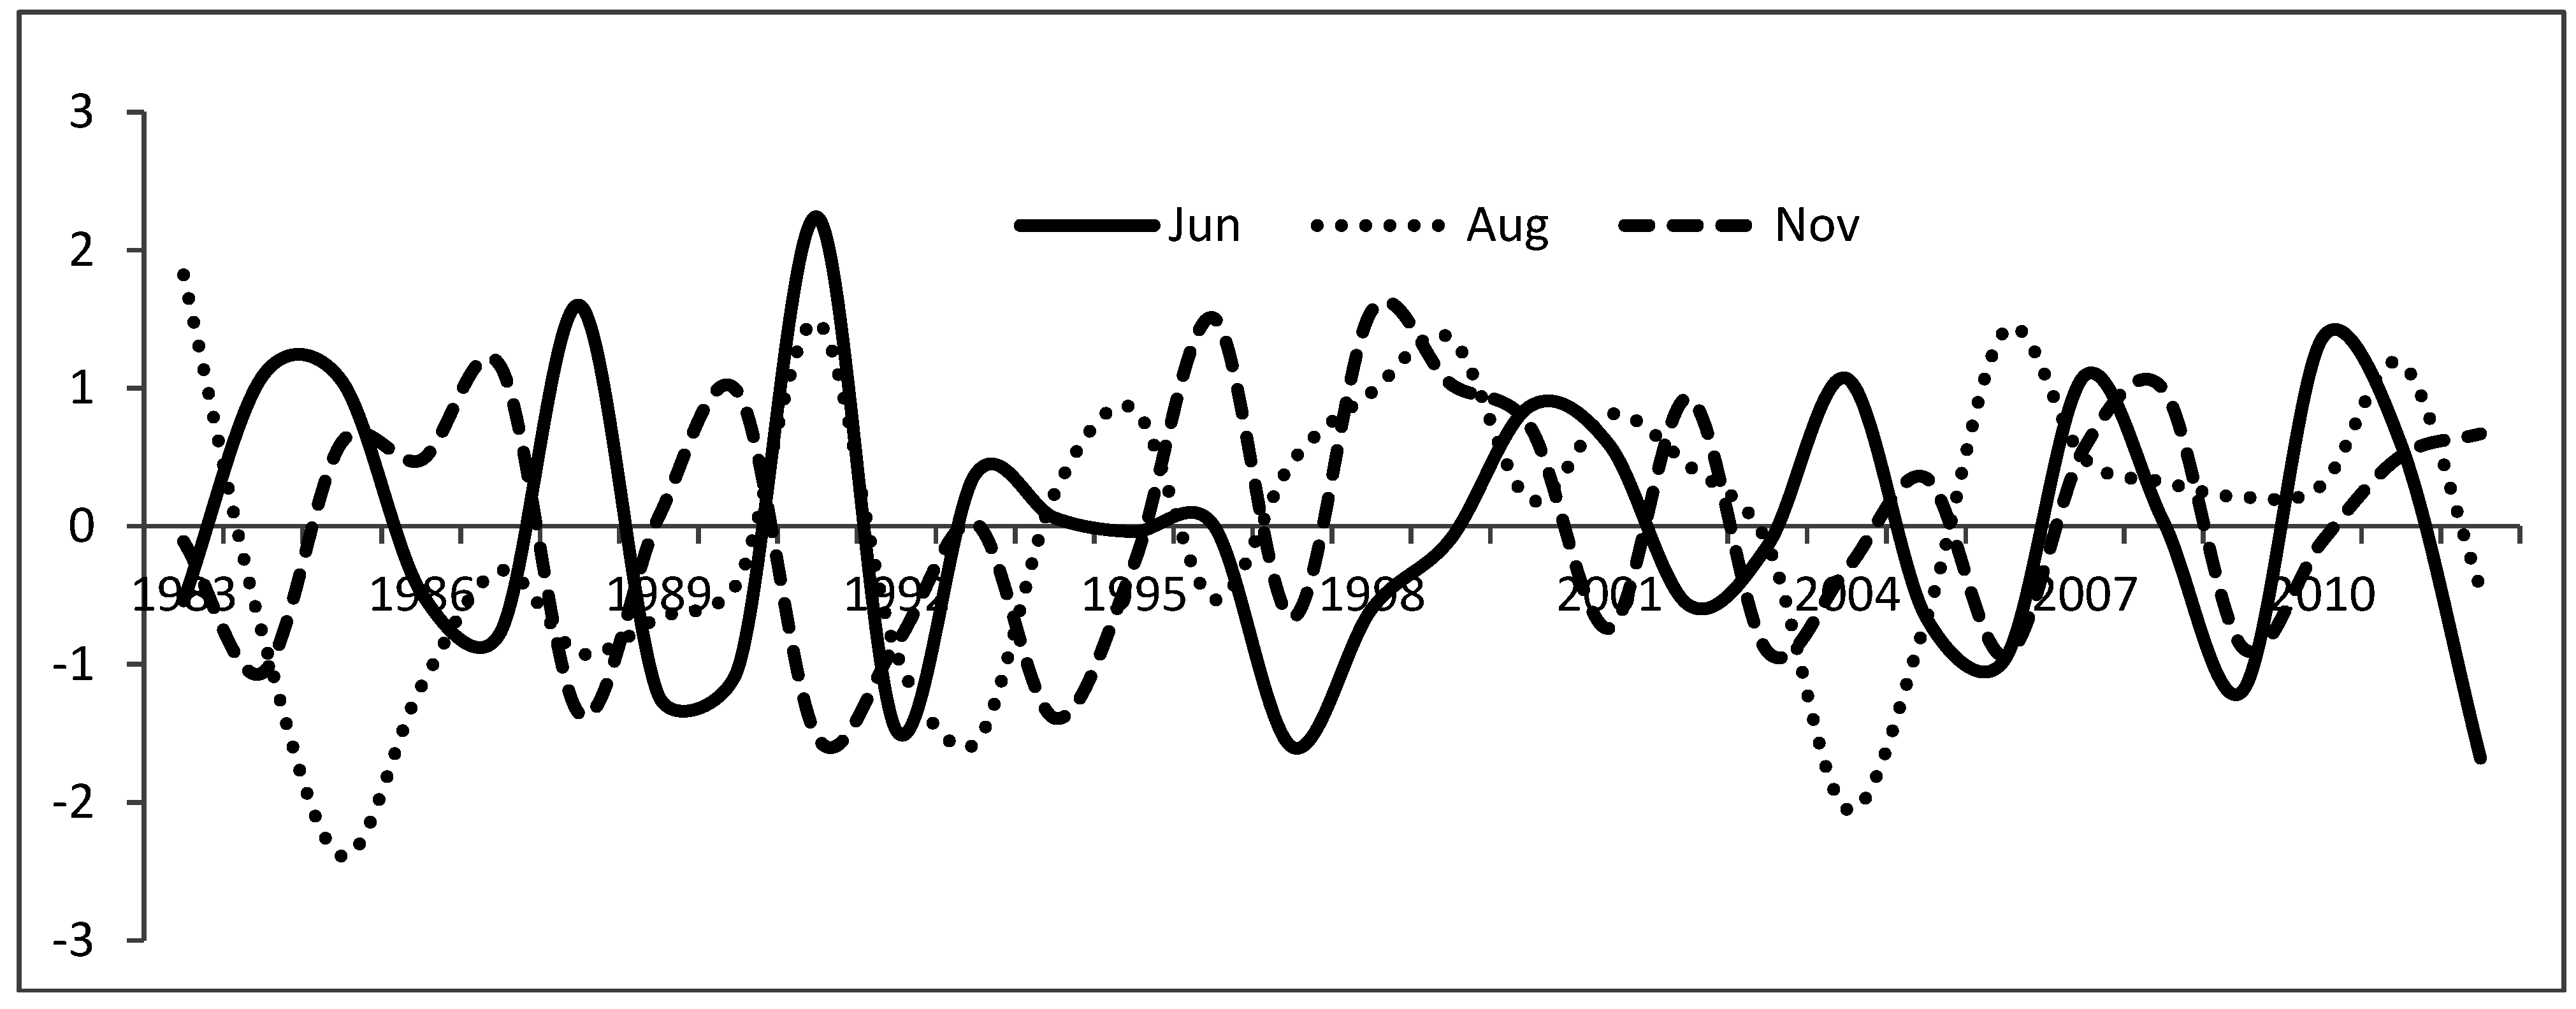
One-month timescale: Figure 3 shows one-month SPI values from 1983 to 2012. Meteorological droughts of moderate severity (SPI = −0.80 to −1.29) occurred in June 1989, 1990, and 2006. There was a severe drought (SPI = −1.30 to −1.59) in 1992, and there were extreme droughts (SPI = −1.60 to −1.99) in 1997 and 2012. June 1991 was very wet (SPI = 2.24) and it was moderately wet in 1984, 1985, 1988, 2004, 2007 and 2010. August 1985 and 2004 experienced exceptional droughts with SPI values of −2.39 and −2.05 respectively. These were the two driest months in the one-month timescale dataset. August 1983, 1991, 1999, 2006 and 2011 had positive SPI values indicating wet conditions despite the fact that most farmers argue that August coincides with the Kuon Rodow Prang dry spell. November 1987, 1996, 1998 and 1999 were wet.
Figure 3.
One-month SPI values for June, August, and November for Kampong Speu station, 1983–2012.

Two-month timescale: Figure 4 shows two-month SPI values. An exceptional drought was identified in the aggregated May and June precipitation data for 1997 (SPI = −2.35); and there were moderate May–June droughts in 1986, 1992, 1998, 2002 and 2005. A severe drought occurred in 1987 and an exceptional drought in 1997. In 1984, 1985 and 2007 May and June were very wet with SPI values of 1.89, 2.56, 1.23 and 1.04 respectively. Aggregated July and August SPI values indicate an exceptional drought in 1993, an extreme drought in 1986, and severe droughts in 1985, 1987 and 2004. The index values for this two-month period in 1983, 1991, 1998 and 2003 suggest very wet conditions. An examination of aggregated October and November data showed that severe droughts occurred in 1994 and 2006, while 1988 experienced a moderate drought. The October–November periods in 1996, 2000, 2001 and 2008 witnessed very wet conditions.
Three-month timescale: Three-month aggregated SPI values are provided in Figure 5. The aggregated precipitation for April–June 1985, June–August 1991, and September–November 1996 indicates that these three-month periods had higher than average rainfall. Extreme droughts over the April–June period were experienced in 1987 and 1997, while other extreme droughts occurred in 1986, 1987 and 1993 (June–August) and 1987 (September–November). No droughts were found in the April–June records. Abnormally dry conditions in the late wet season, i.e. September to November, characterised 1988, 1990, 1991, 1994, 2003 and 2004.
Figure 4.
Aggregated two-month SPI values based on June, August, and November for Kampong Speu station, 1983–2012.
Figure 4.
Aggregated two-month SPI values based on June, August, and November for Kampong Speu station, 1983–2012.

Figure 5.
Aggregated three-month SPI values based on June, August, and November for Kampong Speu station, 1983–2012.
Figure 5.
Aggregated three-month SPI values based on June, August, and November for Kampong Speu station, 1983–2012.

7. Drought, Rice Damage and ENSO Relationships
7.1. SPI-Defined Drought and Paddy Rice Damage
To examine the relationship between drought (defined by the SPI) and paddy rice losses, areal estimates of rice damage in the province were obtained from the Ministry of Agriculture, Forestry and Fisheries (MAFF). The following analysis and discussion focuses on the period between 1994 and 2011—the years for which consistent and rigorous assessments of rice harvests were made. These data are only available from 1994. Only fragmentary information on drought damage exist prior to this and were not used.
The areas of paddy rice damaged in the province by drought are given in Table 3. The extensive drought of 2004 affected over 38,000 hectares of rice, equivalent to approximately 46% of the normal area cultivated. This drought damaged an area almost 200% larger than the next most extensive drought, and can mainly be attributed to a severe failure of rainfall in the middle of the growing season. This extended into lower than average rainfall for the remainder of the year. The next most extensive drought—1994—and the five droughts that each caused over 1000 hectares of damage (Table 3) were associated with drought in only one part of the growing season, though the part of the cropping cycle in which the rains failed was not same in each case. In 1994, 2003 and 2006 lower than average rainfall was confined to the end of the growing season. In 1997 water deficits occurred very early in the year, while in 2002 dry conditions occurred in the middle of the growing season. The third largest area damaged, 4,744 ha, occurred in 1995. However, it is not related to a low SPI (drought) at Kampong Speu station.
SPI was tested as a drought indicator in Kampong Speu province by assessing its relationship to the drought impact data (Table 3) using the critical success index (CSI). The CSI was calculated for one, two, three and 12-month droughts labelled abnormally dry or greater [63], i.e. SPI <= −0.5, and for 1000- and 200-hectare damage thresholds. A CSI of 0.66 (where a perfect prediction is CSI = 1) was achieved for 12-month SPI values of < −0.5 and areal damage greater than 200 ha (Table 4) and indicates a strong predictive relationship between SPI-defined droughts and recorded instances of drought-related rice damage.
The longest drought in the dataset lasted from June to November 2004 and caused the most damage. Even though it only ranged from moderate to severe in intensity according to the SPI values, its duration would have led to a significant depletion of soil moisture reserves and limited recharge. As a consequence it was much more damaging than shorter, more severe droughts, e.g., 1997 and 2006. In light of the significant levels of damage witnessed in 1994, 2003 and 2004, it appears that a reduction in rainfall at the end of the growing season is more deleterious in terms of rice production than at other times of the year. In 1997 severe to extreme drought occurred early in the rice-growing season, but farmers were able to replant rice seedlings and still reap a reasonable harvest. The 1994 and 2006 droughts that affected the final months of the growing season are more difficult to explain. In both years drought severity peaked before November and this might have allowed some replenishment of soil moisture in time for grain-filling before harvest. The droughts with the least areal damage were generally shorter and only moderate in severity.
Table 3.
Drought-related rice damage in Kampong Speu province and ENSO events between 1983 and 2012.
| Year | Damaged Area (ha) | Percentage of Total Cultivated Area | Yield (t/ha) | El Niño Event at Niño 3.4 |
|---|---|---|---|---|
| 2004 | 38,257 | 46.26 | 1.57 | Weak |
| 1997 | 14,962 | 17.48 | 2.18 | Very strong |
| 1998 | 14,900 | 17.81 | 1.79 | Very strong |
| 1994 | 13,170 | 16.93 | 1.52 | Moderate |
| 1995 | 4,744 | 5.61 | 2.01 | Moderate |
| 2006 | 2,925 | 2.69 | 2.32 | Weak |
| 2002 | 1,498 | 2.29 | 1.98 | Moderate |
| 2003 | 1,103 | 1.16 | 1.90 | Moderate |
| 1999 | 539 | 0.62 | 1.78 | None |
| 2009 | 322 | 0.29 | 2.39 | None |
| 2012 | 320 | 0.29 | 3.01 | Non |
| 2000 | 223 | 0.26 | 1.75 | None |
| 2005 | 63 | 0.07 | 2.00 | None |
| 2011 | 53 | 0.05 | 3.14 | None |
| 2008 | 49 | 0.05 | 1.19 | None |
| 2001 | 16 | 0.02 | 1.70 | None |
Sources: Area and yield estimates are from the Cambodian Ministry of Agriculture, Forestry and Fisheries data. El Niño events are based on the Ocean Niño Index (ONI) from the National Weather Services [70]: a weak event is defined as a 0.5 to 0.9 SST anomaly, moderate 1.0–1.4, strong 1.5–1.9 and very strong ≥ 2.0.
| Damage > 200 ha | Damage <= 200 ha | Total SPI | |
|---|---|---|---|
| SPI <= −0.5 | 10 | 3 | 13 |
| SPI > −0.5 | 2 | 4 | 6 |
| Total Years | 12 | 7 | 19 |
| CSI: | 0.66 | ||
7.2. SPI-Defined Drought at Kampong Speu Station and ENSO
Understanding ENSO behaviour is critical to understanding indicator-driven Cambodian climate definitions, as is the case in the rest of Indochina [71]. Pearson product-moment correlation coefficients were computed for SPI values for different time periods for Kampong Speu station and assessed against a range of climate indices that other researchers have argued influence the SEAM. The highest correlations were found for Niño 3.4 [29,71] lagged by three months (Table 5, Figure 6). It is likely that the 12-month SPI values account for overall drought conditions throughout the year and that this leads to higher correlations than SPI values calculated for shorter time periods.
Table 5.
Correlation Coefficient values for SPI-defined drought at Kampong Speu station and Niño 3.4. All values are significant at p = 0.90.
| 1-Month SPI | 2-Month SPI | 3-Month SPI | 12-Month SPI | |
|---|---|---|---|---|
| Niño from May to SPI from May | −0.280 | −0.372 | −0.440 | −0.352 |
| Niño from April to SPI from May | −0.219 | −0.329 | −0.415 | −0.376 |
| Niño from Mar to SPI from May | −0.178 | −0.288 | −0.393 | −0.455 |
| Niño from Feb to SPI from May | −0.170 | −0.274 | −0.377 | −0.455 |
Figure 6.
SPI values for growing season months (i.e. May-November) and Niño 3.4 data: 1983–2012.

7.3. Linking ENSO, SPI-Defined Drought and Rice Damage in Kampong Speu Province
The results above indicate that SPI-defined drought years (based on the Kampong Speu station data) are strongly associated with droughts that cause significant damage to paddy rice; and that the 12-month SPI values are significantly correlated with major El Niño events (Table 5, Figure 6). These results also show that the impact of a drought on the rice harvest is dependent on 1) when a dry spell occurs during the growing season, and 2) its duration. Single-month SPI-defined droughts early in the growing season do not lead to large harvest losses, probably because farmers are able to transplant more rice seedlings of short-, medium- and/or long-duration varieties. However, if early season droughts extend beyond a month, significant crop damage can occur. For example, the two-month SPI-defined drought in 1998 destroyed 14,900 hectares of rice in the province. This particular early-season drought can be linked statistically to the weakening of an ENSO event in May 1998 [72]. In 1997 and 2005, the areas destroyed by drought were very different—14,962 and 63 hectares respectively—though both of these early season droughts were two to three months in length. However, drought in 1997 was more severe than the early season drought in 2005, and can be linked statistically to the ENSO 1997–1998 event.
Like single-month early-season droughts, one-month mid-season droughts (MSD) do not lead to significant a reduction in rice production. It can be argued that this is because by the middle of the growing season fields are normally flooded up to the level of the bund, and will remain waterlogged even if the rains fail for a month. However, if a meteorological drought at this time extends longer than a month, the probability of crop damage increases because fields can begin to dry out. In 2004, the two-month drought over July and August led to fields drying out in August, which in turn led to almost half of the total cultivated area being damaged, even though June rainfall was normal. This parallels the Niño 3.4 index data, which indicates an El Niño event developed in June 2004 and lasted until January 2005. Because this event extended throughout the rest of the agricultural year it also led to a late season drought (LSD) which probably compounded the harvest losses. As the damage records are not disaggregated by early-, mid- or late-season in Cambodia, the large amounts of damage cannot be unambiguously assigned to either the MSD or LSD in 2002; in reality they are likely to be a combination of middle and late season water deficits. However, in 2004 a MSD led to significant damage with 1400 hectares of rice being destroyed, even though there was no LSD.
Late season droughts cause most damage to paddy production regardless of their duration. In 1994 an LSD lasted three months and caused approximately 13,000 hectares of damage. This drought is evident in the Niño 3.4 data and corresponds to the weak EASM during 1994 [15]. The LSD in 2003 is also statistically linked with an El Niño event, although it was only of moderate severity [73]. It was associated with a three-month SPI-defined drought at Kampong Speu station that led to 1,103 hectares of paddy damage in the province. In both 2003 and 2004 the rains ceased earlier than usual in the final months of the wet season. The LSD in 2006 was shorter than those in 2003 and 2004 (as indicated by a one and a two-month, but a three-month, SPI-defined drought). The lower than normal rainfall is likely linked to the weak ENSO event in 2006. There is a high probability that rice losses due to droughts late in the monsoon is related to the fact that diminished rainfall toward the end of growing season compromises rice grain filling because of the lack of available soil water, which in turn depresses yields.
7.4. The Potential for Drought Monitoring in Cambodia
Cambodia has not introduced any early warning system for drought even though it has been noted that drought forecasting is urgently required [74]. One motivation for this research was to provide evidence that an index-based approach to drought monitoring was scientifically sound in relation to the prevailing climatology and the damage to rice due to droughts and dry spells. The variation in SPI can be explained well in relation to Niño 3.4 variability and is a good predictor of rice damage. Unlike other indices that require a more comprehensive array of meteorological observations, SPI can be readily applied widely to Cambodian climate stations with their limited range of equipment. The statistical link to ENSO is critical because, as Zhang et al. [21] have argued, monitoring ENSO is more useful in its predictive power than a rainfall index such as SPI because it provides a longer lead time for drought warning.
The SPI calculation is simple as it is based only on rainfall, but does not have the lead time of Niño 3.4. Nonetheless, having more rainfall stations throughout the country, especially one in each commune, would enable a clearer picture of drought severity and the spatial distribution of drought impacts to be measured. That in turn would lead to better understanding of the relationships between EASM variability, drought and rice damage. Therefore, it can be argued that each commune should simply record rainfall in order to improve prediction and monitoring at the local level, as well as reporting the results to provincial and national recording networks. It would be relatively straightforward for commune members to be trained in recording rainfall and calculating SPI on mobile technologies. Monitoring SPI at the commune level, particularly early in the growing season, when more rice may have to be transplanted, and in the grain-filling period, would allow communes to call for drought alleviation measures such as sourcing more rice seedlings or requesting mobile pumping stations.
Nonetheless, there are limitations. If SPI data were to be used as part of a drought monitoring system, the monitoring tools should not be based on climate data alone. Soils data would be necessary. This is because any drought severity thresholds that would need to be set should be location specific because the duration of waterlogging and extent of soil moisture reserves that can be utilised by rice plants will depend on soil properties. There are also a series of issues related to the spatial distribution of any particular drought or dry spell. This can lead to anomalies, for example the November 1998 SPI values for Kampong Speu station were positive, while the province and the entire lower Mekong suffered a drought [74]. Currently, the density of rainfall stations in Cambodia is too low, large geographical areas lack records and rainfall distributions may not be representative. More precipitation stations are required, preferably at the commune level for the reasons identified above. Furthermore, the degree of drought severity calculated by the SPI must be treated with caution as the SPI values change according to the number of data points used in their calculation.
8. Conclusions
Rice-damaging droughts in Kampong Speu province can be linked statistically to ENSO through the Niño 3.4 index. The association between ENSO and drought in the province indicates that when the Pacific Ocean warm pool moves westwards drought is likely to occur. Notwithstanding a previous study by the Ministry of Environment (MoE) which argued that flood and drought occurrences in Cambodia are not always associated with the ENSO events [8], the findings in this paper are supported by Buckley et al [48] who argued that a decline in rainfall associated with ENSO event heralded the collapse of the Angkor era. That said, the MoE study has some validity. The 1995 drought, which appears unrelated to any ENSO event in the record, damaged more than 4,000 hectares of paddy in KPS. Moreover, the three-month SPI value for this drought was high was −0.61.
Drought is a significant economic and livelihood hazard in Kampong Speu province. Droughts damaged more than 1000 hectares of paddy rice in seven of the thirteen years between 1994 and 2006. In each case the damage can be explained in terms SPI-defined droughts related to ENSO phenomena. Late growing season droughts are more damaging than early or mid-season droughts.
We argue that drought monitoring is urgently required in Cambodia if the drought alleviation measures that need to taken are to be effective. This is essential to enhance rural production systems and to improve farming household livelihoods, and to enable to government to achieve its rice export targets.
Acknowledgments
This research was made possible through a doctoral studies grant from the Department of Higher Education of Ministry of Education, Youth and Sport through the Higher Education Quality and Capacity Improvement Project (HEQCIP) of the Royal Government of Cambodia to Nyda Chhinh. We thank Chea Bora (DWRAM) for sharing rainfall data, and members of the ‘Land Lab’ at Flinders University for their comments on earlier versions of this paper. We also appreciate the highly constructive comments of the three anonymous reviewers.
Author Contributions
Nyda Chhinh collected, analysed the data, and drafted the manuscript. Andrew Millington made critical revisions to methods, suggested new lines of analysis and made major modifications during manuscript production. All authors read and approved the final manuscript.
Conflicts of Interest
The authors declare no conflict of interest.
References
- Ouk, R. Main achievement of MAFF for food security, economic growth and sustainable development. Agric. Mag. 2013, 48, 3. [Google Scholar]
- Royal Government of Cambodia. The Promotion of Paddy Production and Rice Export; Royal Government of Cambodia: Phnom Penh, Cambodia, 2010.
- International Monetary Fund. Cambodia: Statistical Appendix. Available Online: http://www.imf.org/external/pubs/ft/scr/2009/cr0948.pdf (accessed on 11 September 2014).
- Yu, B.; Fan, S. Rice production response in Cambodia. Agric. Econ. 2011, 42, 437–450. [Google Scholar] [CrossRef]
- Royal Government of Cambodia. National Strategic Development Plan Update 2009–2013; Ministry of Planning: Phnom Penh, Cambodia, 2010.
- McAndrew, J. Interdependence in Household Livelihood Strategies in Two Cambodian Villages; Cambodia Development Resource Institute: Phnom Penh, Cambodia, 1998. [Google Scholar]
- Chhinh, N. Climate change adaptation in agriculture in Cambodia. In Adaptation to Climate Change in Asia; Vachani, S., Ed.; Edward Elgar: Northampton, MA, USA, 2014; pp. 163–182. [Google Scholar]
- Ministry of Environment. Vulnerability and Adaptation Assessment to Climate Change in Cambodia; Ministry of Environment: Phnom Penh, Cambodia, 2001.
- Ministry of Agriculture Forestry and Fisheries. Agricultural Statistic 1998–2010; Ministry of Agriculture Forestry and Fisheries: Phnom Penh, Cambodia, 2010.
- Chun, S. $ 12 Million Rescue Package Deployed to Fight Drought; The Phnom Penh Post: Phnom Penh, Cambodia, 2009. [Google Scholar]
- Yihui, D. The variability of the Asian summer monsoon. J. Meteorol. Soc. Jpn. 2007, 85, 21–54. [Google Scholar]
- Ding, Y.; Liu, Y.; Song, Y.; Zhang, J. From MONEX to the global monsoon: A review of monsoon system research. Adv. Atmos. Sci. 2015, 32, 10–31. [Google Scholar] [CrossRef]
- Webster, P.J.; Magana, V.O.; Palmer, T.; Shukla, J.; Tomas, R.; Yanai, M.u.; Yasunari, T. Monsoons: Processes, predictability, and the prospects for prediction. J. Geophys. Res. Ocean. 1998, 103, 14451–14510. [Google Scholar] [CrossRef]
- Davolio, S.; Stocchi, P.; Benetazzo, A.; Bohm, E.; Riminucci, F.; Ravaioli, M.; Li, X.-M.; Carniel, S. Exceptional Bora outbreak in winter 2012: Validation and analysis of high-resolution atmospheric model simulations in the northern Adriatic area. Dyn. Atmos. Ocean. 2015, 71, 1–20. [Google Scholar] [CrossRef]
- Park, C.-K.; Schubert, S.D. On the nature of the 1994 East Asian summer drought. J. Clim. 1997, 10, 1056–1070. [Google Scholar] [CrossRef]
- Huang, R.; Xu, Y.; Wang, P.; Zhou, L. The features of the particularly severe flood over the Changjiang (Yangtze River) basin during the summer of 1998 and exploration of its cause. Clim. Environ. Res. 1998, 3, 300–313. [Google Scholar]
- Huang, R.; Chen, J.; Huang, G. Characteristics and variations of the East Asian monsoon system and its impacts on climate disasters in China. Adv. Atmos. Sci. 2007, 24, 993–1023. [Google Scholar] [CrossRef]
- Tong, J.; Qiang, Z.; Deming, Z.; Yijin, W. Yangtze floods and droughts (China) and teleconnections with ENSO activities (1470–2003). Quat. Int. 2006, 144, 29–37. [Google Scholar] [CrossRef]
- Huang, G.; Yan, Z. The East Asian summer monsoon circulation anomaly index and its interannual variations. Chin. Sci. Bull. 1999, 44, 1325–1329. [Google Scholar] [CrossRef]
- Bomin, S.; Shuqing, S. The analysis on the features of the atmospheric circulation in preceding winters for the summer drought and flooding in the Yangtze and Huaihe River Valley. Adv. Atmos. Sci. 1994, 11, 79–90. [Google Scholar] [CrossRef]
- Zhang, Y.; Li, T.; Wang, B.; Wu, G. Onset of the Summer Monsoon over the Indochina Peninsula: Climatology and Interannual Variations. J. Clim. 2002, 15, 3206–3221. [Google Scholar] [CrossRef]
- Wang, B.; Lin, H. Rainy Season of the Asian–Pacific Summer Monsoon. J. Clim. 2002, 15, 386–398. [Google Scholar] [CrossRef]
- Goswami, B.N.; Krishnamurthy, V.; Annmalai, H. A broad-scale circulation index for the interannual variability of the Indian summer monsoon. Q. J. R. Meteorol. Soc. 1999, 125, 611–633. [Google Scholar] [CrossRef]
- Misra, V.; DiNapoli, S. The variability of the Southeast Asian summer monsoon. Int. J. Clim. 2013, 34, 893–901. [Google Scholar] [CrossRef]
- Chen, T.-C.; Yoon, J.-h. Interannual variation in Indochina summer monsoon rainfall: possible mechanism. J. Clim. 2000, 13, 1979–1986. [Google Scholar] [CrossRef]
- Kane, R. El Niño timings and rainfall extremes in India, southeast Asia and China. Int. J. Clim. 1999, 19, 653–672. [Google Scholar] [CrossRef]
- Qian, W.; Zhu, Y. The comparison between summer monsoon components over East Asia and South Asia. J. Geosci. China 2002, 4, 17–32. [Google Scholar]
- Ichiyanagi, K.; Yoshimura, K.; Yamanaka, M.D. Validation of changing water origins over Indochina during the withdrawal of the Asian monsoon using stable isotopes. SOLA 2005, 1, 113–116. [Google Scholar] [CrossRef]
- Nigam, S. On the dynamical basis for the Asian summer monsoon rainfall-El Niño relationship. J. Clim. 1994, 7, 1750–1771. [Google Scholar] [CrossRef]
- NOAA. Equatorial Pacific Sea Surface Temperatures. Available Online: https://www.ncdc.noaa.gov/teleconnections/enso/indicators/sst.php (accessed on 3 June 2015).
- Kug, J.-S.; Jin, F.-F.; An, S.-I. Two Types of El Niño Events: Cold Tongue El Niño and Warm Pool El Niño. J. Clim. 2009, 22, 1499–1515. [Google Scholar] [CrossRef]
- Lyon, B. The strength of El Niño and the spatial extent of tropical drought. Geophys. Res. Lett. 2004, 31. [Google Scholar] [CrossRef]
- Gadgil, S.; Vinayachandran, P.; Francis, P.; Gadgil, S. Extremes of the Indian summer monsoon rainfall, ENSO and equatorial Indian Ocean oscillation. Geophys. Res. Lett. 2004, 31. [Google Scholar] [CrossRef]
- Ueangsawat, K.; Jintrawet, A. The impacts of ENSO phases on the variation of rainfall and streamflow in the Upper Ping River Basin, Northern Thailand. Environ. Nat. Resour. J. 2013, 11, 97–119. [Google Scholar]
- Naylor, R.L.; Falcon, W.P.; Rochberg, D.; Wada, N. Using El Nino/Southern Oscillation climate data to predict rice production in Indonesia. Clim. Chang. 2001, 50, 255–265. [Google Scholar] [CrossRef]
- Tangang, F.T.; Juneng, L. Mechanisms of Malaysian Rainfall Anomalies. J. Clim. 2004, 17, 3616–3622. [Google Scholar] [CrossRef]
- Ashok, K.; Guan, Z.; Yamagata, T. Impact of the Indian Ocean dipole on the relationship between the Indian monsoon rainfall and ENSO. Geophys. Res. Lett. 2001, 28, 4499–4502. [Google Scholar] [CrossRef]
- Lagos, P.; Silva, Y.; Nickl, E.; Mosquera, K. El Niño? Related precipitation variability in Perú. Adv. Geosci. 2008, 14, 231–237. [Google Scholar] [CrossRef]
- Bejranonda, W.; Koch, M. The role of ocean state indices in seasonal and inter-annual climate variability of Thailand. J. West. Rajabhat Univ. Nakhon Pathom Thail. 2010, 5, 5–23. [Google Scholar]
- Javier, E.L. Rice ecosystems and varieties. In Rice Production in Cambodia; Nesbitt, H.J., Ed.; IRRI: Manila, Philippines, 1997; pp. 31–81. [Google Scholar]
- CARDI (Caribbean Agricultural Research & Development Institute). Rice Varieties Released by the Varietal Recommendation Committee of Cambodia (1990–2000); CARDI: Phnom Penh, Cambodia, 2001. [Google Scholar]
- Helmers, K.; Jegillos, S. Linkages between Flood and Drought Disasters and Cambodian Rural Livelihoods and Food Security; Cambodian Red Cross: Phnom Penh, Cambodia, 2004. [Google Scholar]
- Ministry of Environment, UNDP. Building Resilience: the Future for Rural Livelihoods in the Face of Climate Change; Cambodia Human Development Report: Phnom Penh, Cambodia, 2011.
- National Institute of Statistics. General Population Census of Cambodia 2008; Ministry of Planning: Phnom Penh, Cambodia, 2008. [Google Scholar]
- Nagarajan, R. Drought Assessment; Springer: New Delhi, India, 2009. [Google Scholar]
- UN/ISDR. Drought Risk Reduction Framework and Practices: Contributing to the Implementation of the Hyogo Framework for Action; United Nations secretariat of the International Strategy for Disaster Reduction (UN/ISDR): Geneva, Switzerland, 2007. [Google Scholar]
- Wilhite, A.D.; Buchanan-Smith, M. Drought as hazard: Understanding the natural and social context. In Drought and Water Crises: Science, Technology and Management issues; Wilhite, A.D., Ed.; Taylor & Francis: Boca Raton, FL, USA, 2005; pp. 3–29. [Google Scholar]
- Buckley, B.M.; Anchukaitis, K.J.; Penny, D.; Fletcher, R.; Cook, E.R.; Sano, M.; Nam, L.C.; Wichienkeeo, A.; Minh, T.T.; Hong, T.M. Climate as a contributing factor in the demise of Angkor, Cambodia. Proc. Natl. Acad. Sci. 2010, 107, 6748–6752. [Google Scholar] [CrossRef] [PubMed]
- Nguyen, H.; Shaw, R. Adaptation to Droughts in Cambodia. Comm. Environ. Disaster Manag. 2011, 8, 49–66. [Google Scholar]
- Ministry of Environment. Vulnerability and Adaptation to Climate Hazards and to Climate Change: A Survey of Rural Cambodian Households; Ministry of Environment: Phnom Penh, Cambodia, 2005.
- National Committee for Disaster Management. Mapping Vulnerability to Natural Disasters in Cambodia. Phnom Penh; National committee for disaster management (NCDM): Phnom Penh, Cambodia, 2003. [Google Scholar]
- Quiring, S.M.; Papakryiakou, T.N. An evaluation of agricultural drought indices for the Canadian prairies. Agric. For. Meteorol. 2003, 118, 49–62. [Google Scholar] [CrossRef]
- Dai, A.; Trenberth, K.E.; Karl, T.R. Global variations in droughts and wet spells: 1900–1995. Geophys. Res. Lett. 1998, 25, 3367–3370. [Google Scholar] [CrossRef]
- Alley, W.M. The Palmer Drought Severity Index as a measure of hydrological drought. J. Am. Water Resour. Assoc. 1985, 21, 105–114. [Google Scholar] [CrossRef]
- Kumar, V.; Panu, U. Predictive assessment of severity of agricultural droughts based on agro-climatic factor. J. Am. Water Resour. Assoc. 1997, 33, 1255–1264. [Google Scholar] [CrossRef]
- Sakamoto, C.M. The Z-index as a variable for crop yield estimation. Agric. Meteorol. 1978, 19, 305–313. [Google Scholar] [CrossRef]
- Wilhite, D.A.; Rosenberg, N.J.; Glantz, M.H. Improving federal response to drought. J. Clim. Appl. Meteorol. 1986, 25, 332–342. [Google Scholar] [CrossRef]
- Karl, T.; Quinlan, F.; Ezell, D. Drought termination and amelioration: its climatological probability. J. Clim. Appl. Meteorol. 1987, 26, 1198–1209. [Google Scholar] [CrossRef]
- Lohani, V.K.; Loganathan, G. An early warning system for drought management using the Palmer Drought Index. Am. Water Resour. Assoc. 1997, 6, 1375–1386. [Google Scholar] [CrossRef]
- Wu, J.; He, B.; Lü, A.; Zhou, L.; Liu, M.; Zhao, L. Quantitative assessment and spatial characteristics analysis of agricultural drought vulnerability in China. Nat. Hazard. 2011, 56, 785–801. [Google Scholar] [CrossRef]
- McKee, T.B.; Doesken, N.J.; Kleist, J. The relationship of drought frequency and duration to time scales. In Proceedings of the 8th Conference on Applied Climatology, Boston, MA, USA, 17–22 January 1993; pp. 179–183.
- Hao, Z.; AghaKouchak, A.; Nakhjiri, N.; Farahmand, A. Global integrated drought monitoring and prediction system. Sci. Data 2014, 1. [Google Scholar] [CrossRef] [PubMed]
- Monacelli, G.; Galluccio, M.; Abbafati, M. Drought Assessment and Forecasting; World Meteorological Organization: Geneva, Switzerland, 2005. [Google Scholar]
- Pai, D.; Sridhar, L.; Guhathakurta, P.; Hatwar, H. District-wide drought climatology of the southwest monsoon season over India based on standardized precipitation index (SPI). Nat. Hazard. 2011, 59, 1797–1813. [Google Scholar] [CrossRef]
- Heim, R.R. A Review of Twentieth-Century Drought Indices Used in the United States. Bull. Am. Meteorol. Soc. 2002, 83, 1149–1165. [Google Scholar]
- World Meteorological Organization. Standardized Precipitation Index: User Guide; World Meteorological Organization: Geneva, Switzerland, 2012. [Google Scholar]
- Seiler, R.; Hayes, M.; Bressan, L. Using the standardized precipitation index for flood risk monitoring. Int. J. Clim. 2002, 22, 1365–1376. [Google Scholar] [CrossRef]
- Zhang, Q.; Xu, C.-Y.; Zhang, Z. Observed changes of drought/wetness episodes in the Pearl River basin, China, using the standardized precipitation index and aridity index. Theor. Appl. Clim. 2009, 98, 89–99. [Google Scholar] [CrossRef]
- Thom, H.C.S. Some Methods of Climatological Analysis; Secretariat of the World Meteorological Organization: Geneva, Switzerland, 1966. [Google Scholar]
- National Oceanic and Atmospheric Administration. Cold and warm episodes by season: Changes to the Ocean Nino Index. Available Online: http://www.cpc.noaa.gov/products/analysis_monitoring/ensostuff/ensoyears.shtml (accessed on 3 June 2015).
- Chang, C.-P. East Asian Monsoon; World Scientific: Singapore, 2004. [Google Scholar]
- Wolter, K.; Timlin, M.S. Measuring the strength of ENSO events: how does 1997/98 rank? Weather 1998, 53, 315–324. [Google Scholar] [CrossRef]
- Logan, J.A.; Megretskaia, I.; Nassar, R.; Murray, L.T.; Zhang, L.; Bowman, K.W.; Worden, H.M.; Luo, M. Effects of the 2006 El Nino on tropospheric composition as revealed by data from the Tropospheric Emission Spectrometer (TES). Geophys. Res. Lett. 2008, 35. [Google Scholar] [CrossRef]
- Te, N. Drought Management in the Lower Mekong Basin. In Presented at 3rd South Asia Water Forum, Dhaka, Bangladesh, 13–15 July 2007.
© 2015 by the authors; licensee MDPI, Basel, Switzerland. This article is an open access article distributed under the terms and conditions of the Creative Commons Attribution license (http://creativecommons.org/licenses/by/4.0/).
Share and Cite
MDPI and ACS Style
Chhinh, N.; Millington, A. Drought Monitoring for Rice Production in Cambodia. Climate 2015, 3, 792-811. https://doi.org/10.3390/cli3040792
AMA Style
Chhinh N, Millington A. Drought Monitoring for Rice Production in Cambodia. Climate. 2015; 3(4):792-811. https://doi.org/10.3390/cli3040792
Chicago/Turabian StyleChhinh, Nyda, and Andrew Millington. 2015. "Drought Monitoring for Rice Production in Cambodia" Climate 3, no. 4: 792-811. https://doi.org/10.3390/cli3040792