Article

Assessment of Long-Term Spatio-Temporal Rainfall Variability over Ghana using Wavelet Analysis

by
Michael Baidu
1,2,*,
Leonard K. Amekudzi
1,
Jeffery N. A. Aryee
1 and
Thompson Annor
1
1
Meteorology and Climate Science Unit, Department of Physics, Kwame Nkrumah University of Science andTechnology (KNUST), UPO, P. O. Box PMB Kumasi, Ghana
2
Earth System Physics, The Abdus Salam International Center for Theoretical Physics (ICTP), I - 34151 Trieste, Italy
*
Author to whom correspondence should be addressed.
Climate 2017, 5(2), 30; https://doi.org/10.3390/cli5020030
Submission received: 26 December 2016 / Revised: 25 March 2017 / Accepted: 27 March 2017 / Published: 31 March 2017

Abstract

:
Rainfall variability has strong impact on food security, livelihood and socio-economic activities as farming in West Africa is mainly rain-fed. The annual, seasonal and decadal rainfall variability over Ghana has been studied and their periodicities analysed using wavelet analysis. A rainfall time series from 1901–2010 from the Global Precipitation Climatology Center (GPCC) was used in this analysis. It was observed that high mean annual rainfall totals ranging from 900–1900 mm are recorded over the entire country. In addition, very high totals between 1500–1900 mm are recorded at the South-Western part of the country whereas low totals (900–1200 mm) are recorded in the Savannah and East coast of the country. In general, a decreasing trend was observed for the annual rainfall over all the agro-ecological zones except for the coastal zone, where a slight increasing trend of 0.1600 mm per year was seen. The seasonal trend analysis revealed a significant decreasing trend at 0.01 significance level in all the agro-ecological zones except for the Savannah during the DJF season indicating an intensification of the Harmattan. The Coastal zone recorded the lowest mean rainfall values for all seasons with the highest of about 150 mm in MAM. The Forest zone on the other hand recorded very high rainfall values for all seasons with the maximum of about 200 mm in JJA. The Transition zone, however, recorded almost quite stable rainfall amount for all seasons except for DJF. On the decadal time scale, below normal rainfall values were observed between the 1901–1920 and 1980–2010 periods for almost all the agro-ecological zones except for the Savannah which showed above normal rainfall values within the 1901–1940 period. Indicating that, the decreasing trend observed in recent years is not solely due to antropogenic factors but have a strong contribution from a natural climate variability. The wavelet analysis also revealed a strong annual periodicity over all the agro-ecological zones except for the Coastal and Forest zones where the annual periodicity was accompanied by 4–8 months signal. The results of both the 5 year moving average and the decadal anomaly confirm a significant decrease in rainfall amount. This will have negative consequences on agricultural practices, water resource management and food security.

1. Introduction

Rainfall variability in West Africa affects food production, livelihood and socio-economic activities. In Ghana, rainfall modulates all socio-economic activities especially considering the fact that, agriculture and its products provides employment for over 70% of Ghanaians [1] and accounts for about 28% of the Gross Domestic Product (GDP) [2].
The annual rainfall in Ghana varies highly on annual and decadal time scales making it difficult to identify long term trends [3]. Moreover periods of decreasing rainfall annual totals has been observed together with a shifting regime from the early 1970s which has shown signs of recovery after the 2000s [4,5].
According to Neilsen et al. [6] rainfall variability has impact on the crop-water-supply-demand relationship. The dependence of agricultural systems on the highly variable weather conditions accounts to a greater extent, for the apparent perennial instabilities seen in the output of agricultural products which threatens food security within the West African subregion.
In the fifth assessment report of the Inter-governmental Panel on Climate Change (IPCC), an intensification in the frequency of extreme rainfall events during the present century due to climate variability and change has been predicted [7]. These changes in climatic patterns will have a direct impact on the onset, duration and cessation of rainfall which affect crop production [8]. Assessing the impact of rainfall variability in the various agro-ecological zones in Ghana will provide a key information for adaptation mechanisms to support livelihood and food security.
A number of researches on rainfall variability have been done focusing on specific locations in Ghana, however very few studies have been conducted on the entire country. Moreover, most of these studies used data with time scales of 30–60 years which is not suitable for the analysis of decadal variability. For instance, Adiku et al. [9] used a 22–55 year data and focused on Accra and Tamale. Yengoh et al. [10], Yamba [11] used a 47 and 48 year data respectively and focused on the transition and Savannah zones of Ghana. Owusu and Waylen [12] used a 40 year data and concentrated on Wenchi and Friesen et al. [13] used a 22 year period and concentrated on Northern Ghana. Manzanas et al. [14] used 14 synoptic stations in Ghana over a period of 49 years to investigate the variability and trends in rainfall in Ghana. Furthermore, Lacombe et al. [15] used the Re-sampling-Based Mann-Kendall Test to study the trend in a 45 year rainfall pattern in 16 stations in Ghana. Although Owusu and Klutse [16] studied the spatial pattern of rainfall over the entire country using CORDEX (Coordinated Regional Climate Downscaling Experiment) only a 19 year data was used. The current study focuses on the annual, seasonal and -decadal variability of rainfall over all the agro-ecological zones in Ghana using a 110 year gridded rainfall data from GPCC.
Harmonic and Fourier analysis have been applied to rainfall data to determine the periodicities in the data [17,18,19,20]. The limitation of these methods has been the assumption of stationarity or linearity which is not always the case with some climate datasets such as rainfall [21]. Therefore in the investigation of the rainfall variability over Ghana, the current study seeks to analyse the various frequency components of the non-stationary rainfall time series as well as determine where in time these frequencies occur. To accomplish this, Wavelet Analysis was used to understand the variability in the rainfall pattern from the period 1901–2010 and their trends determined using the Mann Kendall trend test for the various zones in Ghana.
The paper is organised as follows: Section 2 describes the study area and the source of the data used in the study. Section 3 describes the various methods used in the study. The results and discussions are presented in Section 4, and finally conclusions in Section 5.

2. Study Area and Data Source
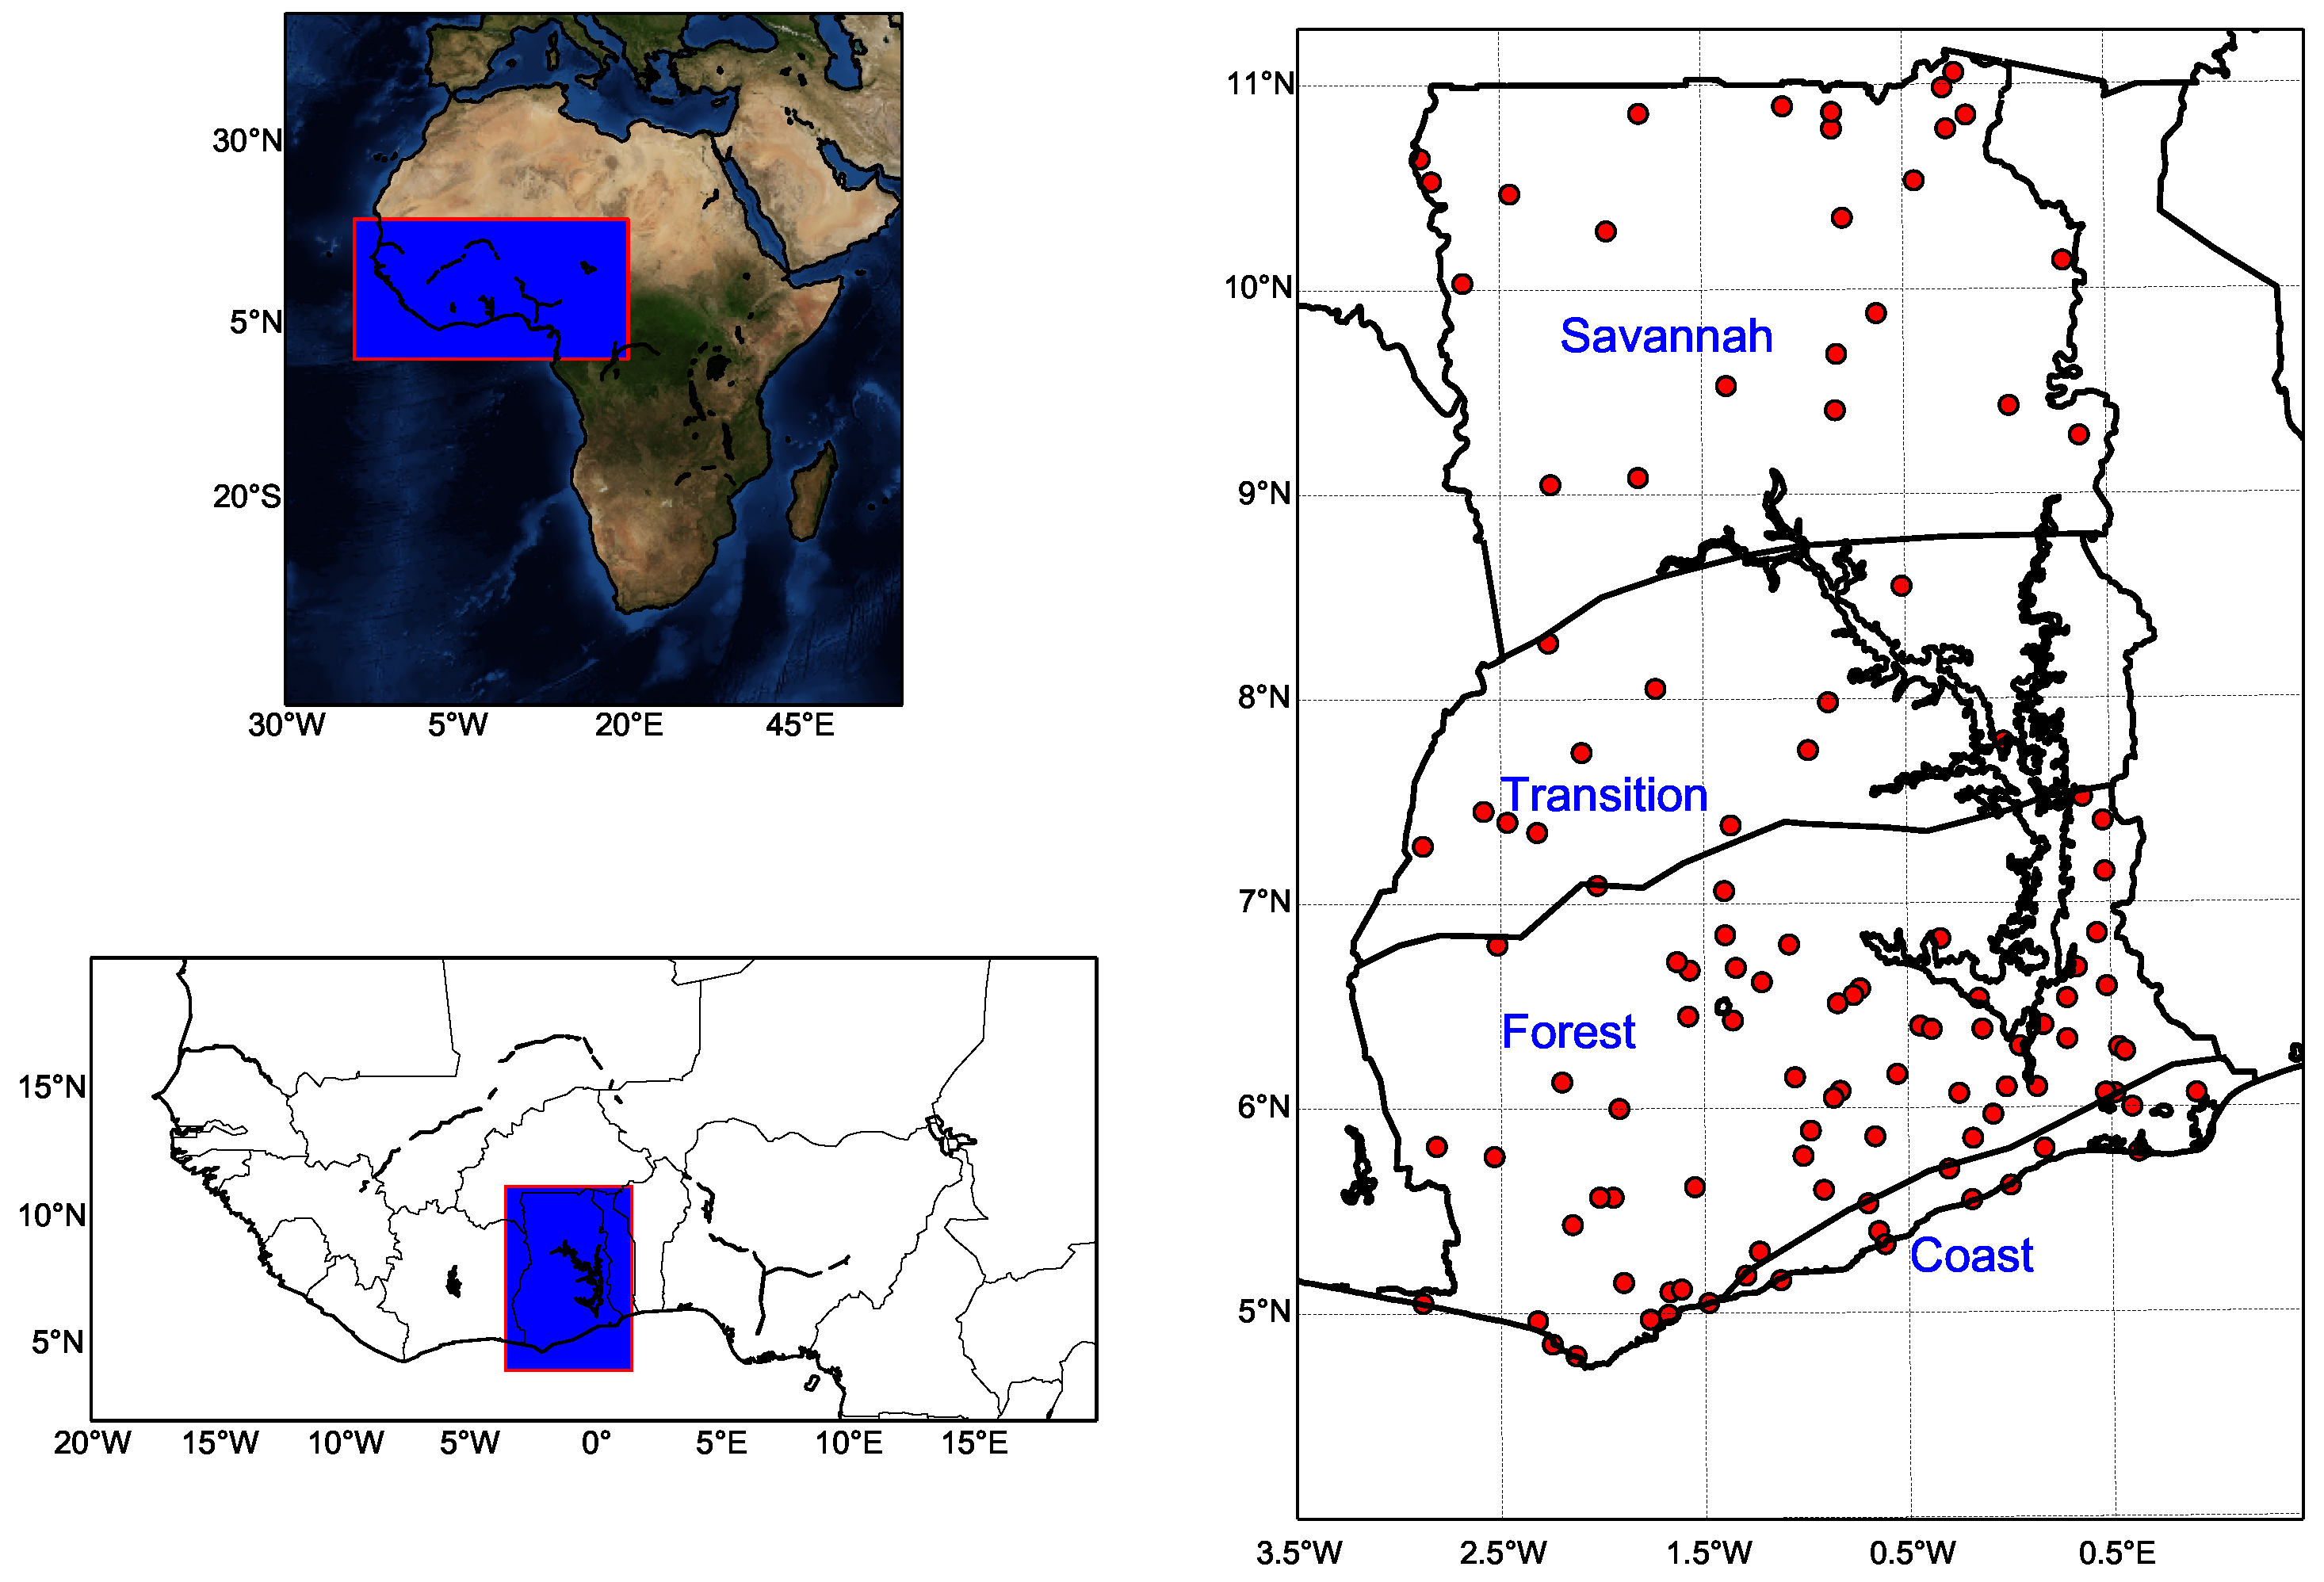
2.1. Study Area

The study area is Ghana which is located between latitude 5° N and 11° N and longitude 4° W and 2° E. It shares a boundary with Togo in the East, Cote d’Ivoire in the West, Burkina Fasso in the north and Gulf of Guinea in the south. The total area of land in Ghana is 238,540 km 2 . It extends up to about 670 km northward from the ocean and about 560 km eastward from Cote d’Ivoire. For the purpose of weather and climate application, the Ghana Meteorological Agency (GMet) has divided the country into 4 main agro-ecological zones [8], (see Figure 1). These are the Coastal, the Forest, the Transition and the Savannah Zones.
In general, rainfall in the region is mostly influenced by the migration of the Inter-Tropical Discontinuity (ITD). The ITD oscillates south to north and back and so modulates the pressure system of the West African Monsoon [8,22,23,24,25,26]. The pressure system of the monsoon is controlled by the moisture laden south westerly winds and the dry continental airmass known as the North East trade winds.
The regions located south of the ITD are dominated by southwesterly winds which blows moist air from the Gulf of Guinea onto the continent. Whereas the region north of the ITD is influenced by northeasterly winds known as the Harmattan. The Harmattan brings in dry and dusty winds from the Sahara between November and March. A single wet season is thus experienced in the Savannah and Sahel Zones of West Africa between April to October when the ITD moves to its northernmost position. The southern part of the country on the other hand experiences two wet seasons: the first one which is the major wet season from March to July and the minor wet season from September to November [8,14,16,27].
In addition to the oscillation of the ITD, local convective activities which results from the vegetation type and topography plays a critical role in the rainfall pattern [8,28]. For instance, strong convective activities due to orographic effects are experienced at the windward side of the Togo-Akwapim ranges [8]. Other mechanisms like the dynamic stability, the sea surface temperature (SST), the land surface feedback and transient tropical wave influence the rainfall of the region [29].

2.2. Data Source

Monthly total rainfall data from the Global Precipitation Climatology Centre (GPCC) from 1901–2010 was extracted over Ghana at a resolution 0.5° × 0.5° (about 117 grid points). It was validated with GMet data and then used for the study. GPCC data is made up of three datasets; (i) monitoring product which is based on quality controlled data from 2007 to present; (ii) full monthly data product from 1901–2010, based on quality controlled data from 67,200 stations around the world and (iii) the first guess at a resolution of 1°× 1° which is most up to date but has less analysed stations starting from 2012.
The GMet data used for the validation is a gridded data [30], collected from a total of 113 stations including all the synoptic, climatological and agro-meteorological stations in Ghana with less than 10% data gap and covering the period of 1980–2012 (Figure 1). The data was first reconstructed using the Regularized Expectation Maximization (RegEM) algorithm described in Schneider [31] to estimate all missing data. It was then homogenized using the Quantile Matching Adjustments (QMadj). The resulting data was then gridded at a resolution of 0.5° × 0.5° using the Minimum Surface Curvature (MSC).

3. Methodology

Monthly and annual rainfall totals were used for the analysis of the monthly, annual and decadal rainfall variability. The data was first validated with the GMet gridded data and the data quality assessed using the Pearson Correlation coefficient, the Relative Mean Difference (RMD) and the Relative Root Mean Square Error (RRMSE) described in Amekudzi et al. [32] and Quansah et al. [33]. The trend in the rainfall time series was assessed using a linear regression analysis and Mann Kendal test used to detect significant trends. Yearly anomalies of the monthly rainfall are also calculated to eliminate seasonal variation influences in contrast with wavelet analysis. Wavelet analysis was then performed on the data to detect the rainfall frequencies in each zone.

3.1. The Wavelet Transform

In the wavelet transform, a time series is compared to a mother wavelet function ( ψ ( η ) ) and the variation of their amplitude with time is plotted to extract regions of strong concentration of power. The mother wavelet is a function that satisfies the admissibility condition. There are different types of mother wavelets: Paul, Gaussian and Morlet. However in this study, the Morlet wavelet is used because of its localization in time and frequency and has been widely used for most studies of climate data [34,35,36]. The Morlet wavelet is simply a convolution of a complex exponential wave and a Gaussian envelope:
ψ ( η ) = π 1 4 e i w 0 η e η 2 2
where ψ is the wave value of non-dimensional time η , w 0 is the non dimensional frequency of the mother wavelet (Figure 2).
First the wavenumber w 0 , which gives the number of oscillations (frequency) within the wavelet itself is chosen. A dilation parameter s and a translation parameter n are then introduced to vary the wavelet scale as well as slide in time respectively. The scaled wavelet therefore becomes:
ψ ( η ) ψ ( n n ) δ t s
The Wavelet Transform W n ( s ) is finally obtained by performing a convolution or an inner product of the above wavelet function with the original time series x n :
W n ( s ) = n = 0 N 1 x n ψ * ( n n ) δ t s
where δ t is the time interval between the time series and the (*) denotes a complex conjugate.
A new time series of the projection amplitude versus time is now constructed by sliding the wavelet along the time series. The wavelet scale is also varied to construct for each scale.
Finally, a two-dimensional image is constructed by plotting the wavelet amplitude and phase.

3.1.1. Choice of Scales

The next thing after choosing the wavelet function is to determine a set of scales s to be used in the wavelet transform. For an orthogonal wavelet, an arbitrary discrete set of scales are used. The scales are written as fractional powers of two:
s j = s 0 2 j δ j
j = 0 , 1 , 2 , . . . , J
where δ j is the spacing between successive scales. Therefore the smaller the value, the finer the resolution.
J = d j 1 log 2 N d t s 0
where s 0 is the basic wavelet scale which is chosen such that all the frequencies in our time series are adequately sampled. Therefore, the s 0 is chosen such that the approximate fourier period is 2 δ t . And J determines the largest scale. A very small value is chosen for δ j based on the width of the wavelet function. A δ j of 0.5 is the largest value required to provide adequate sampling in scale for the morlet wavelet.
In this study, the parameters of the wavelet scales for the monthly rainfall variability were set as follows: δ t = 1 month, s 0 = 2 months since s = 2 δ t , δ j = 0 . 25 in order to do 4 sub-octaves per octave. And j 1 = 7 / δ j in order to do 7 powers of 2 with δ j sub octaves each.

3.1.2. Cone of Influence

Errors occur at both the beginning and the end of the wavelet power spectrum whenever a finite length time series is used since the Fourier Transform assumes that the data is cyclic [37]. The time series is therefore padded with sufficient zeros before applying the wavelet transform in order to limit the edge effects and speed up the Fourier Transform. However, padding with zeros reduces the amplitudes near the edges as it approaches larger scales.
The Cone of influence is therefore the portion of the wavelet power spectrum where edge effects becomes relevant and this is identified in the cross hatched region in the wavelet spectrum. It indicates the e-folding time for the autocorrelation of wavelet power in scale. The e-folding time is chosen such that the wavelet power at the edge drops by a factor e 2 to ensure a negligible edge effect.

3.1.3. The Background Spectrum and Significant Levels

Most geophysical series is modeled as either red or white noise. Torrence and Compo [37] provided a formula for red noise on the distribution of fourier spectrum. This has since been the foundation of significance test in fourier analysis of climate signals [38].
The simple model is the univariate lag-1 autoregressive (Markov) process. The lag one measures the persistence of an anomaly from one unit of a time series (month or year) to the next. The true lag-1 is computed as follows:
α = α 1 + α 2 1 / 2 2
where α 1 and α 2 are the lag-1 and -2 autocorrelations respectively. Setting lag-2 to zero gives the model for white noise.
Now assuming a mean power spectrum, the null hypothesis for the wavelet power spectrum is defined as follows: if a time series is significantly above the mean power spectrum, then it is considered as a true feature at 95% confidence level.

3.1.4. Integration of Power and Averaging within a Scale

To provide a simple and robust way of describing the variability of the time series, the wavelet power is integrated with time to obtain the global wavelet power. And this is given as:
W ¯ 2 ( s ) = 1 N n = 0 N 1 | W n ( s ) | 2
The Global Wavelet Power provides a consistent and unbiased estimation of the true power spectrum of the time series. It is therefore very suitable for describing the variability of rainfall in non-stationary hyetographs.
The fluctuations in wavelet power over the range of scales where the significant frequencies are detected is then examined using the Scale Average Wavelet Power. This is the average wavelet power spectrum from scales s 1 to s 2 as shown:
W ¯ n 2 = δ j δ t C δ j = j 1 j 2 | W n ( s j ) | 2 s j
In the present study, the scale averaged wavelet power is used to present the fluctuations in power over the most significant frequency band that is obtained from the Global wavelet power spectrum.

4. Results and Discussion

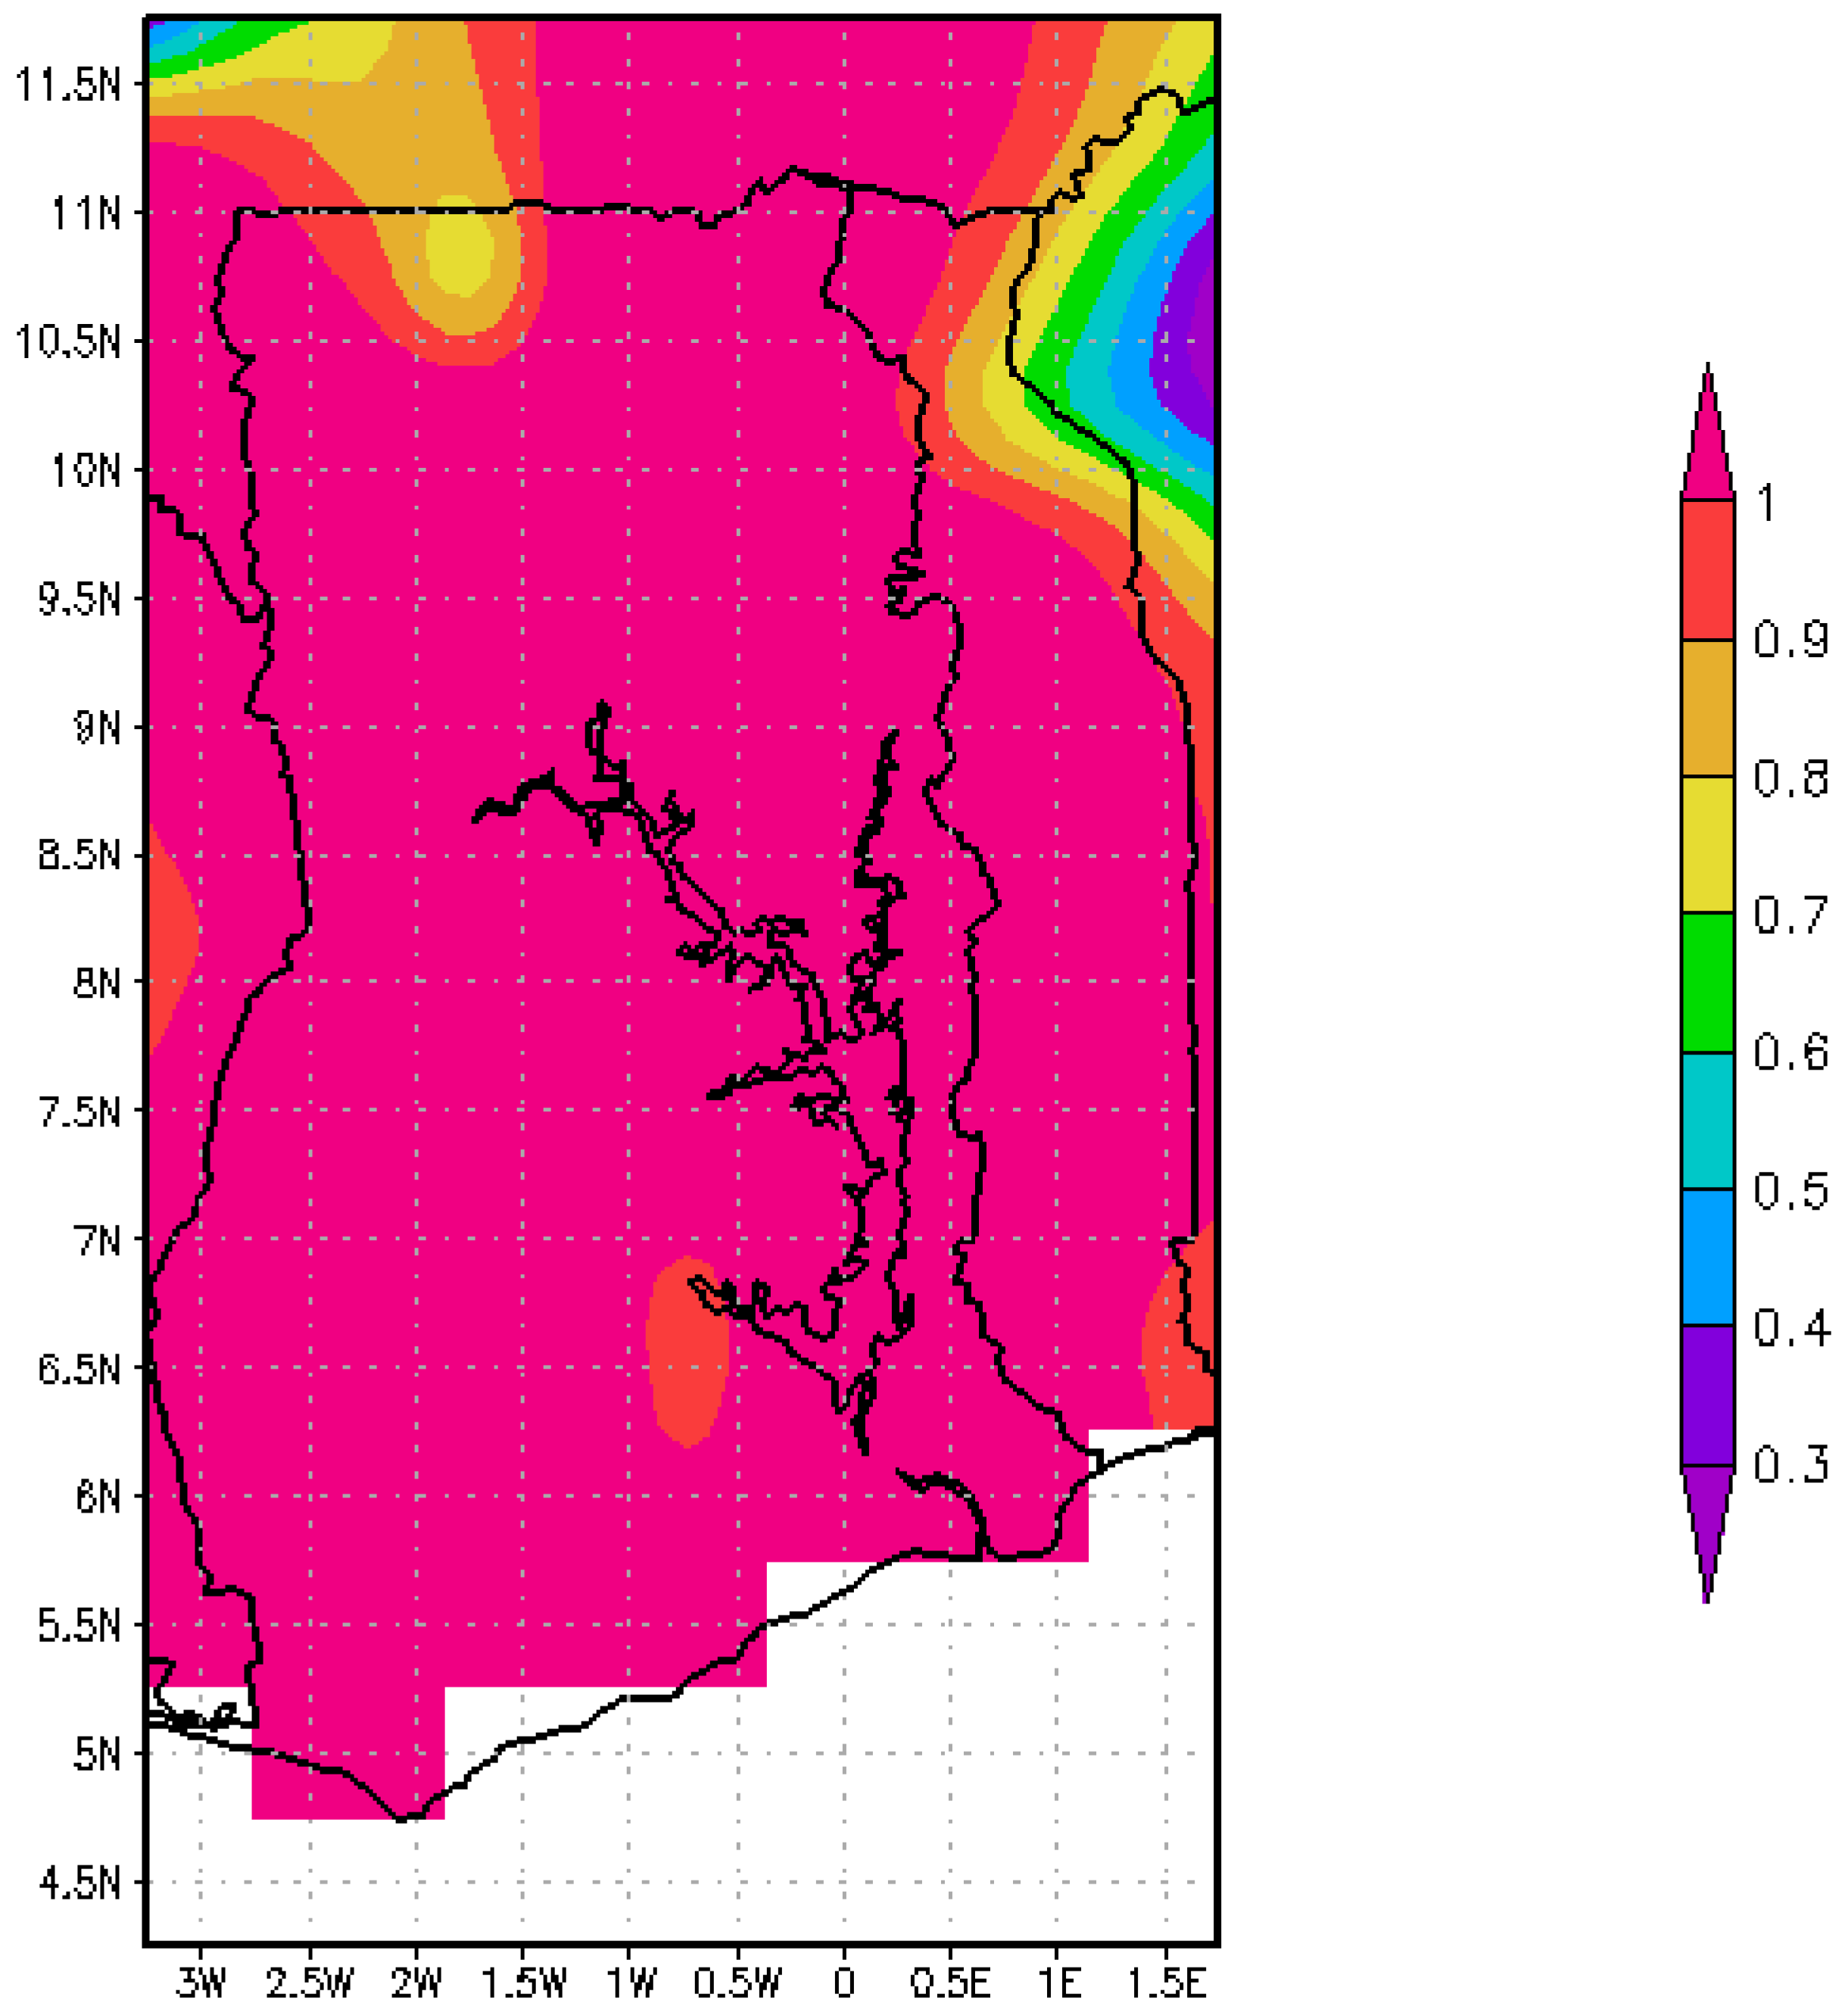
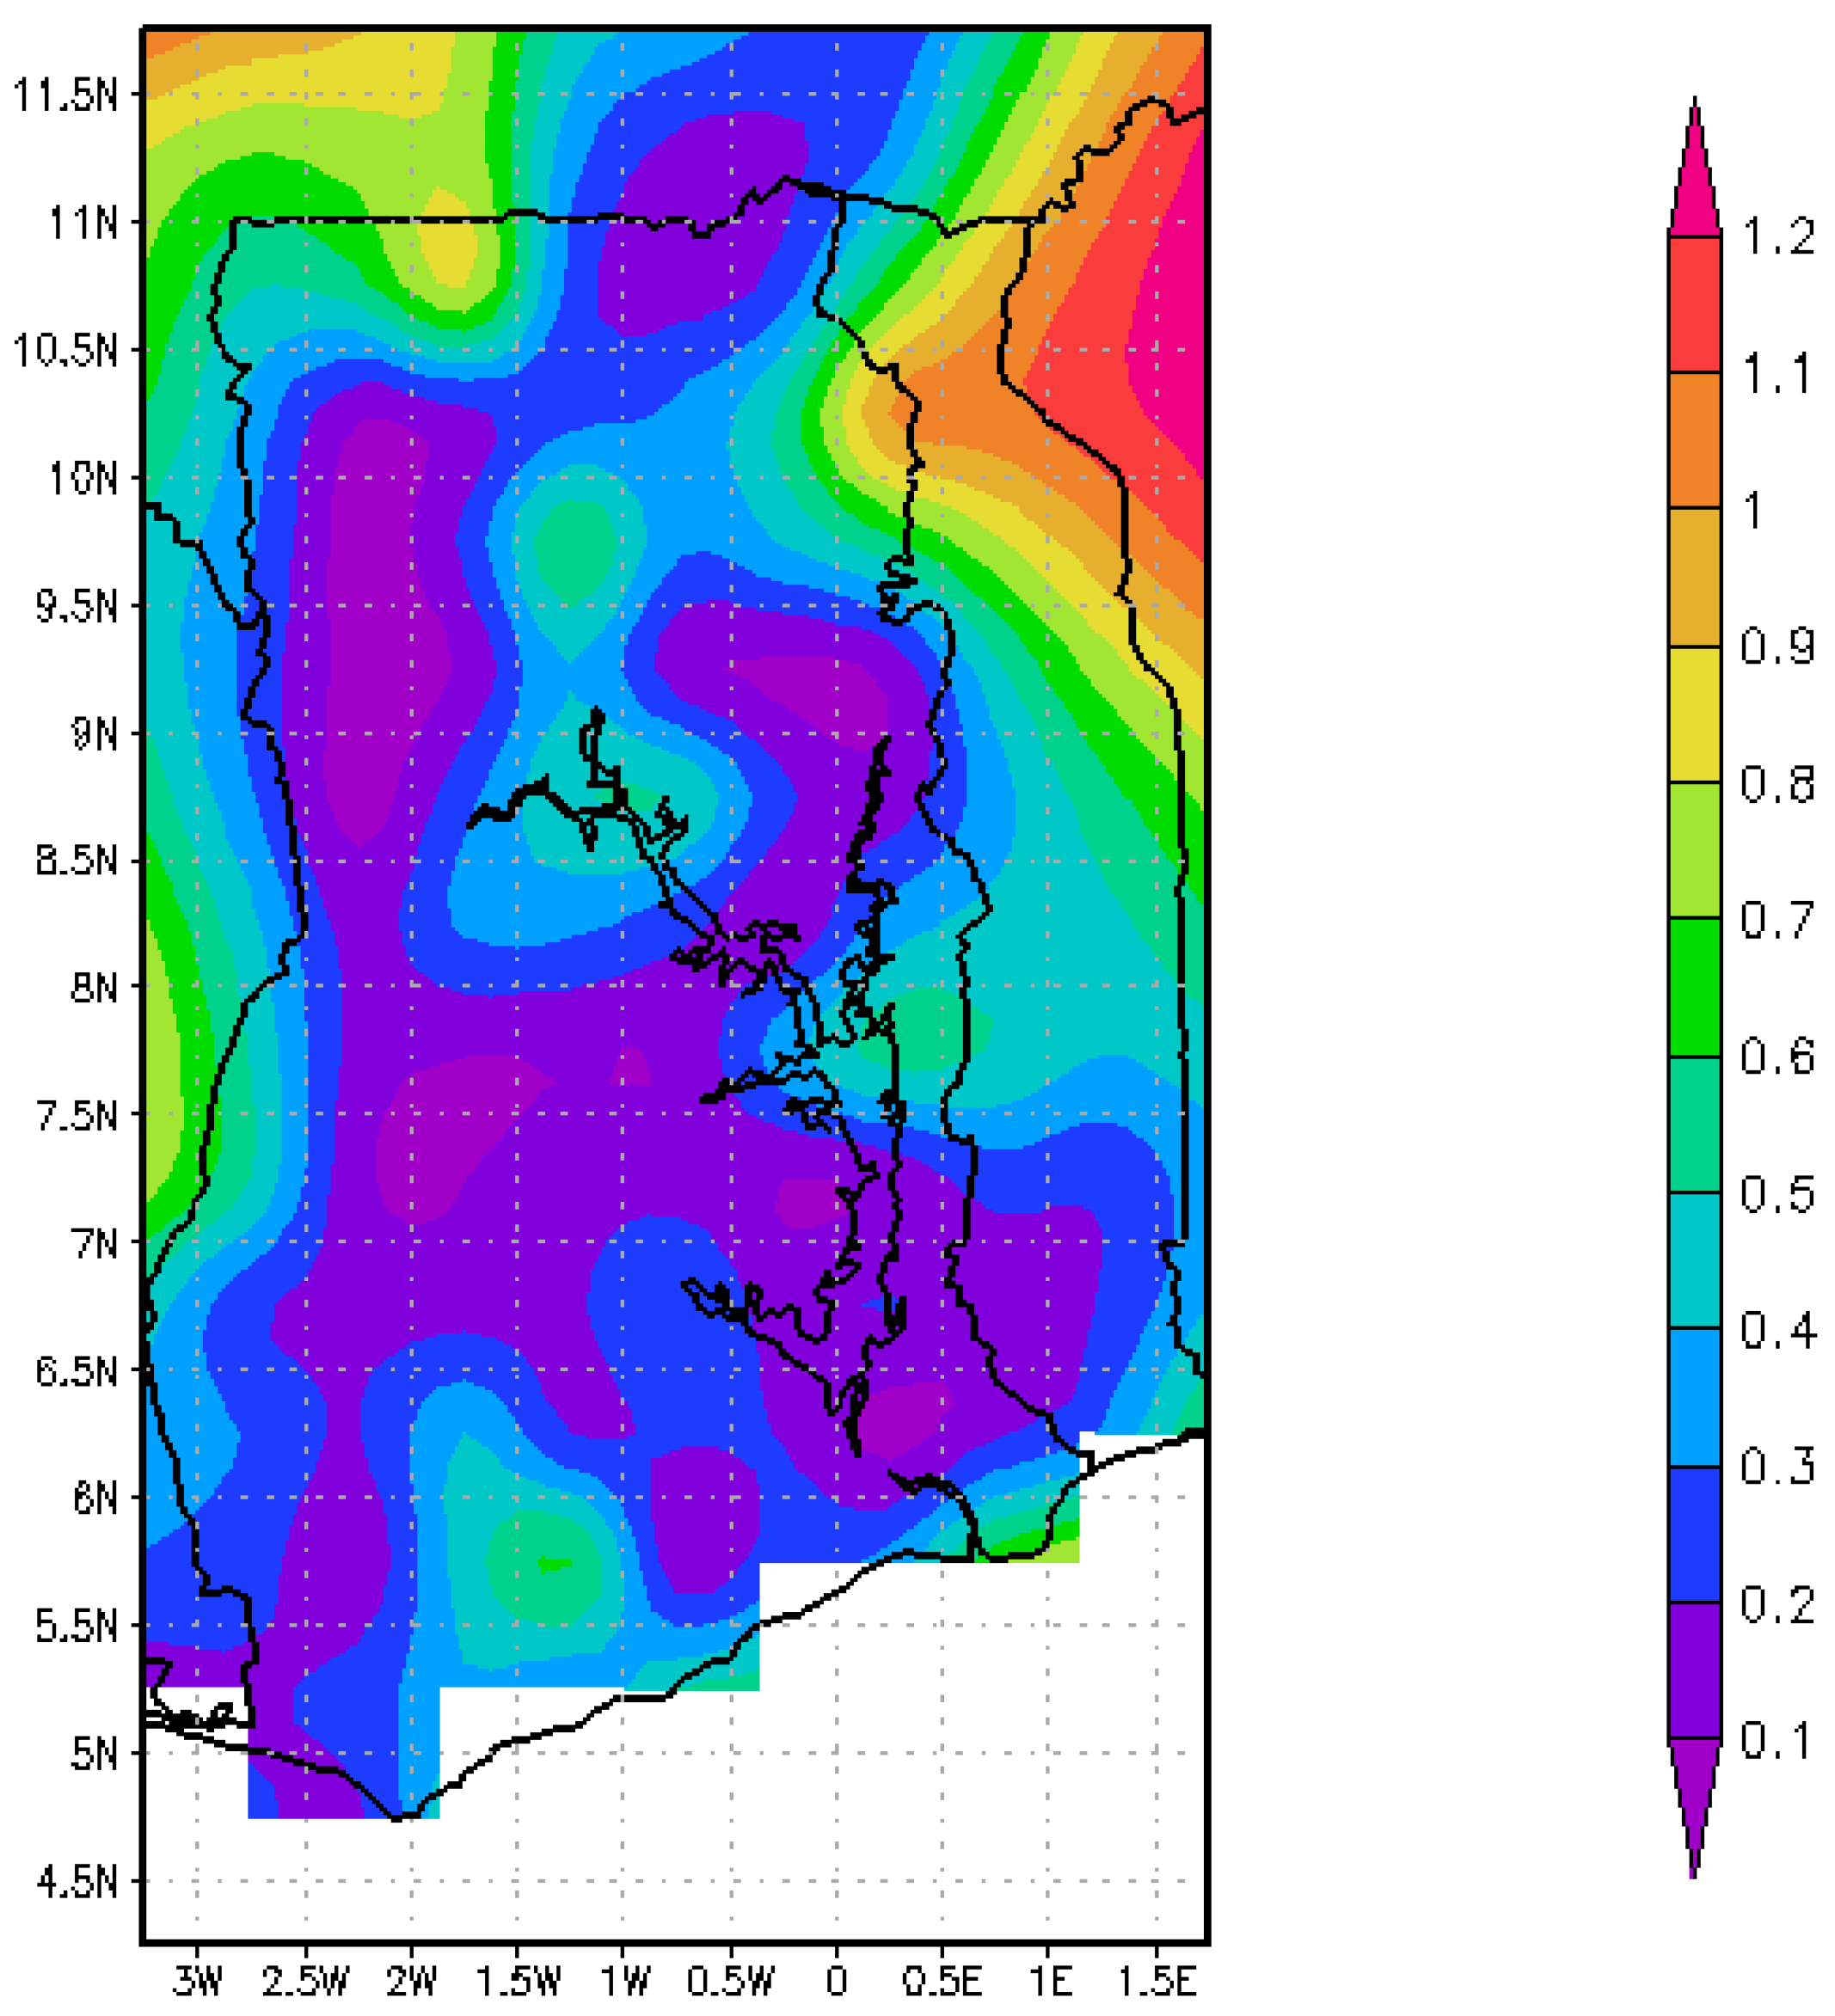
4.1. Validation of GPCC Data with GMet Gridded Data

The GPCC data was first compared with GMet gridded data for the period 1980–2010. It has been established that, gauge data gives a better representation of the rainfall over the region than satellite-gauge merge products, satellite derived data and reanalysis products [14]. GMet provides quite a good amount of gauge data over the country. The data however does not cover time scales longer enough for an decadal variability study as compared to GPCC data. In the study by Manzanas et al. [14], GPCC data was found among other guage based products to give the best correlation with GMet data. That validation was however performed using only fourteen gauges from meteorological stations in Ghana instead of a gridded data. With the current availability of GMet gridded data by Aryee [30] which was computed using 113 stations, it has become necessary to compare the two gridded datasets to ensure the reliability of the GPCC data. The comparison between GMet gridded data and GPCC data is presented and discussed.
From Figure 3a good temporal agreement is found between the GPCC and GMet gridded data for each grid with very few of the regions showing significant disparity. Apart from some regions along the Volta lake and some parts of the southern forest where GPCC underestimated GMet data, most of the regions had close rainfall values which fall between 80–120 mm. To confirm this agreement, the Pearson’s Correlation Coefficient (r), Relative Mean Difference (RMD) and the Relative Root Mean Squared Error (RRMSE) were computed.
The Pearson’s correlation coefficient was computed between the two datasets for each grid over the entire country in order to determine the strength of the association between them. A high correlation coefficient of 0.9 to 1 was obtained almost all over the country except for some small portion of the upper west region which gave correlation coefficients between 0.7–0.9 (Figure 4). This results indicate a good agreement in the temporal course of the precipitation with some some few limitations in the spatial distribution. To obtain the difference between the two datasets, the RMD is also computed.
Relative Mean Difference was also used to determine the magnitude of the variation between the GPCC data and the GMet gridded data. The results are shown in Figure 5. Low RMD values of 0.00–0.04 were recorded over Ghana except for very small portions of the north and the southwestern part of the country where values between 0.04–0.05 were recorded. This indicates a minimal variation between GPCC and GMet gridded data.
Finally, the RRMSE was computed to confirm the results of the Pearson Correlation and the RMD. The RRMSE is the Root Mean Squared Error (RMSE) normalized by the arithmetic mean of the data. The results indicate very low RRMSE values of <0.5 identified in most grids over the country confirming the good correlation between the GPCC data and the GMet gridded data (Figure 6).
The results of the Pearson Correlation, the RMD and the RRMSE indicate a good agreement between GPCC data and the GMet gridded data. The data is therefore reliable for use in climate variability studies over the country hence the choice of GPCC data for this studies. It is therefore recommended for long time scale (decadal) studies of rainfall variability over Ghana.

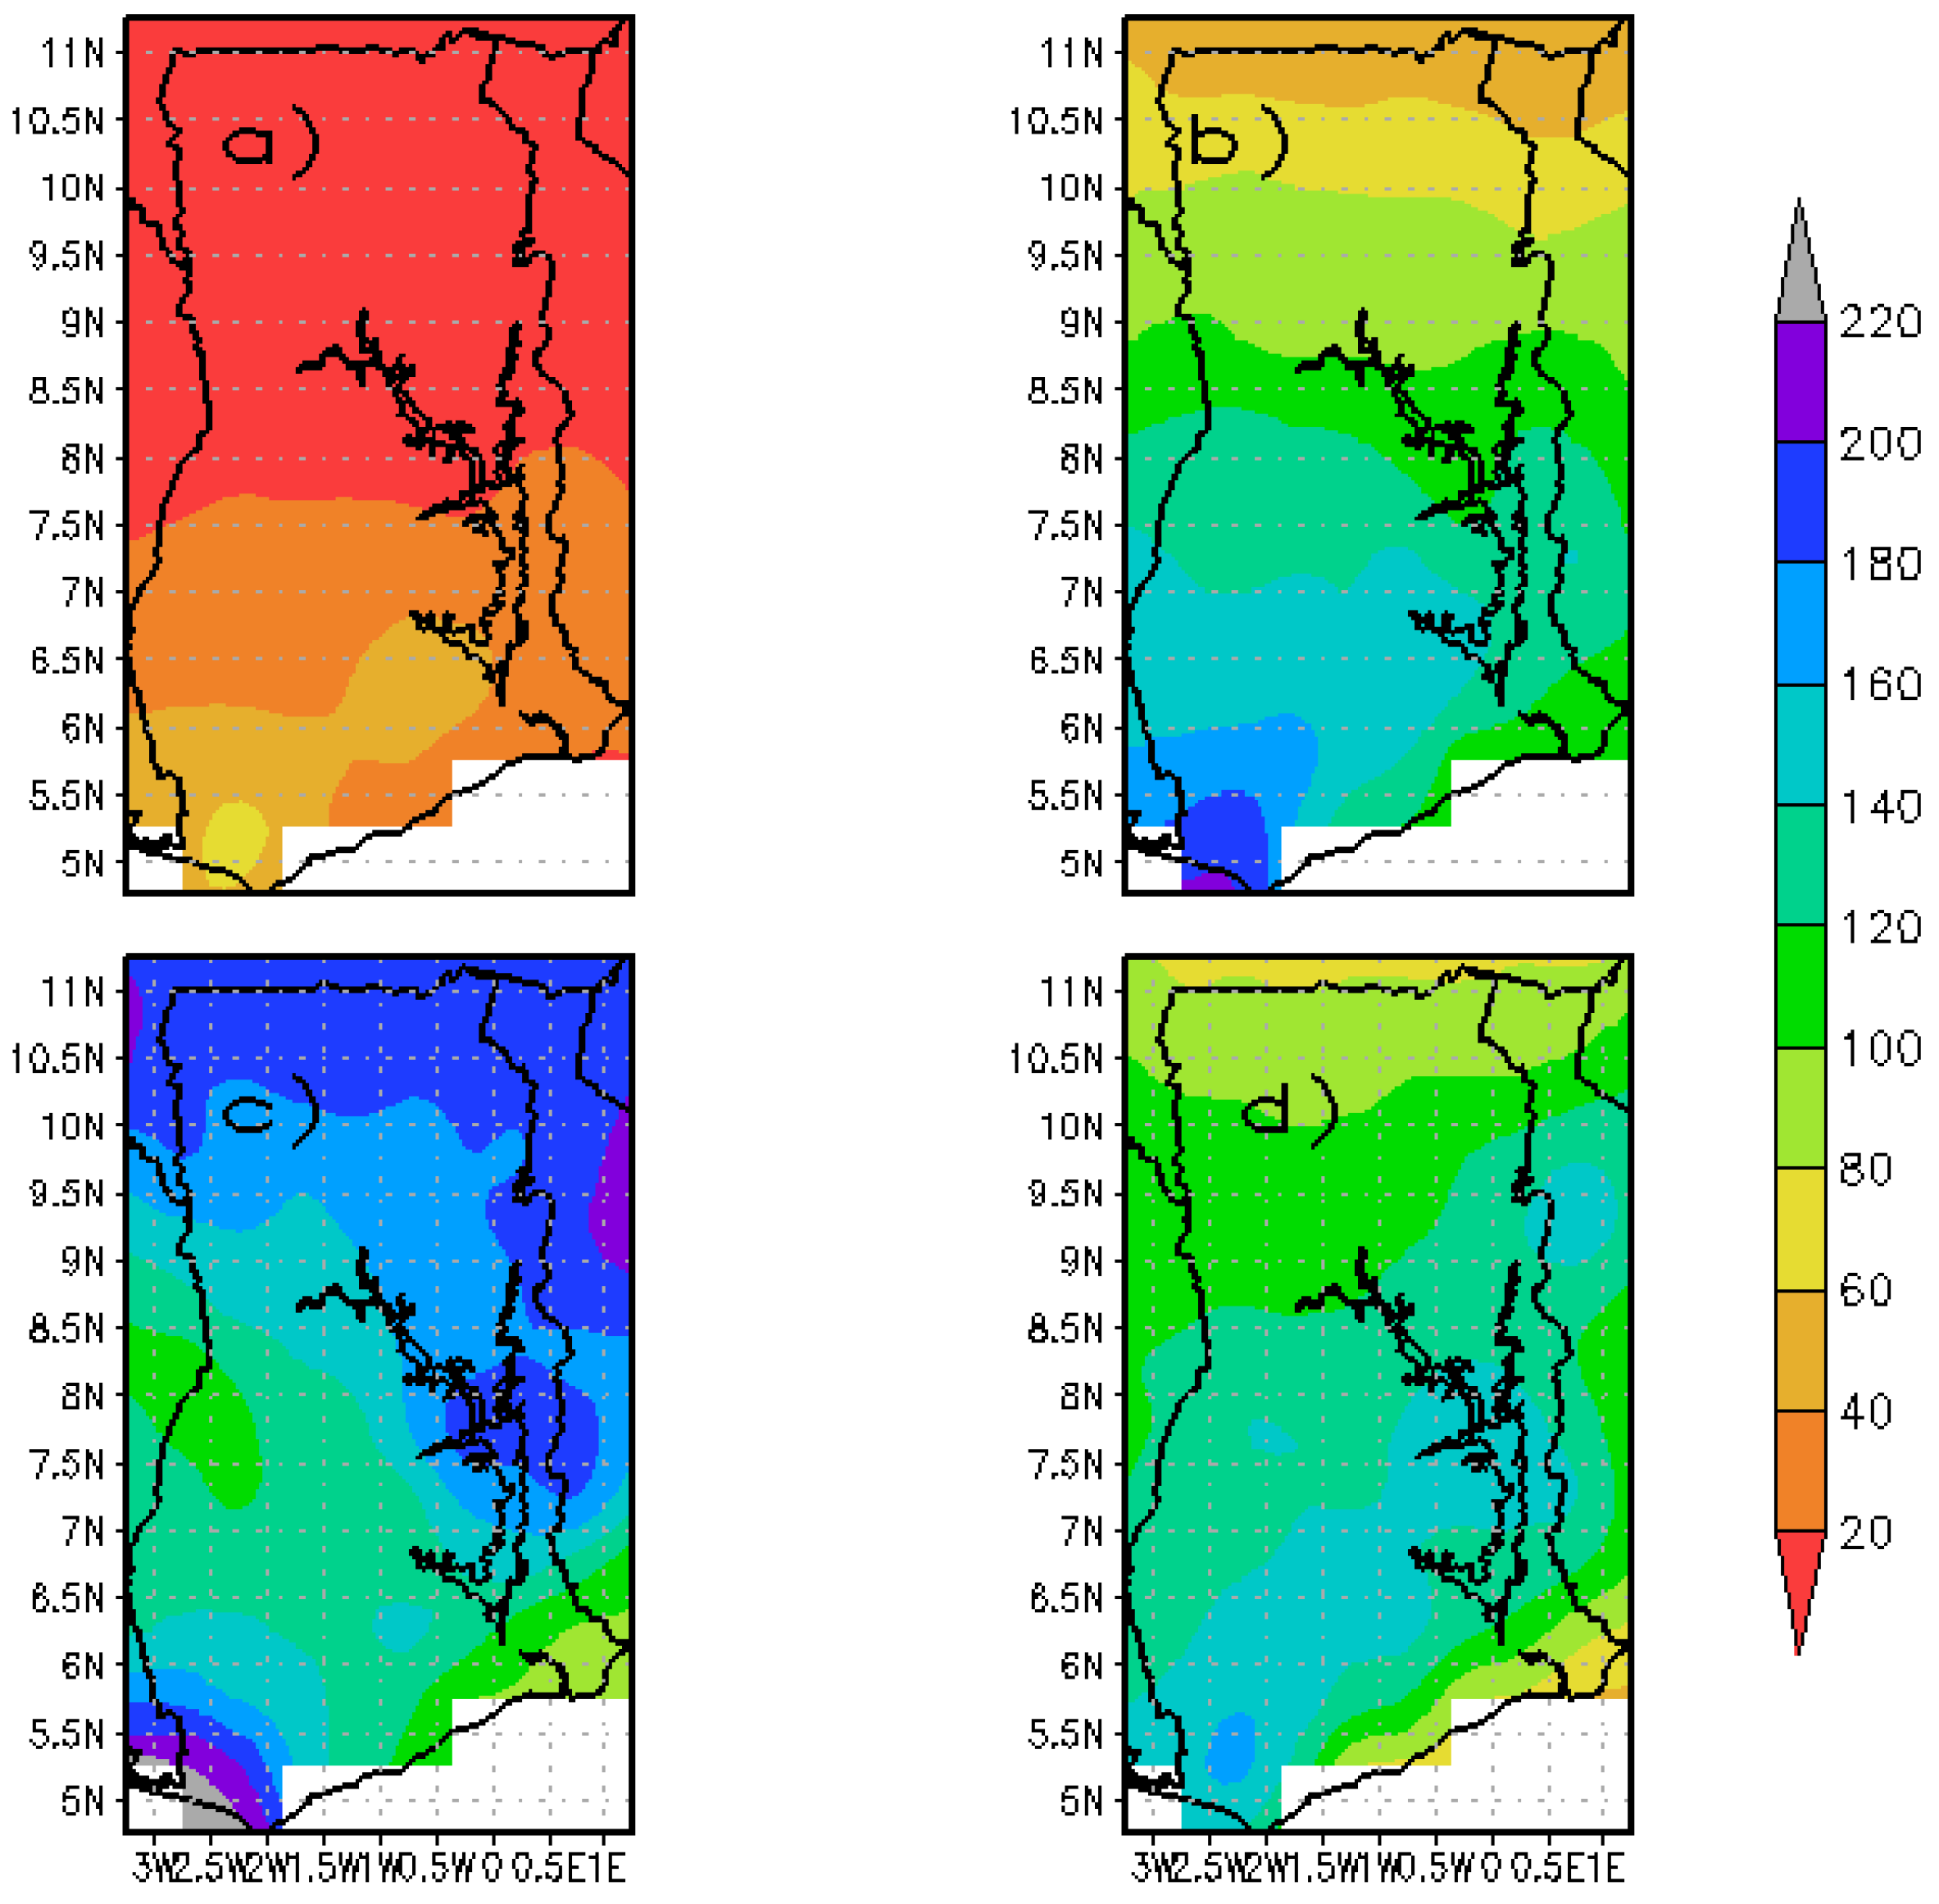
4.2. Mean Annual Rainfall Total over Ghana

The mean annual rainfall total over Ghana was computed using GPCC data. It can be observed that, high annual rainfall totals ranging from 900–1900 mm are recorded over the the entire nation (Figure 7). Very high annual rainfall totals between 1500–1900 mm are recorded at the south-western part of the country. Low values between 900–1200 mm are however recorded in the Savannah and the east coast of the country with lowest values of less than 900 mm found at the far east coast of the country. An interesting higher rainfall values between 1500 and 1600 mm is seen on the Volta basin (In red rectangle of Figure 7) indicating its significant influence on the local climate. Coincidentally, the highest mountain (Afadjato) is also located within this region.
The result indicate that, the mean annual rainfall totals in Ghana exhibit a strong spatial variability from the South to North. This interesting spatial variability is due to the South-North oscillation of the ITD. The predominant South-West Monsoon winds which advects moisture from the Gulf of Guinea during the rainy season explains the high rainfall values recorded annually at the south-western coast of the country [39,40,41]. The east coasts of the country has relatively lower rainfall amount due to local atmospheric circulation and the upwelling of cold winds [42].

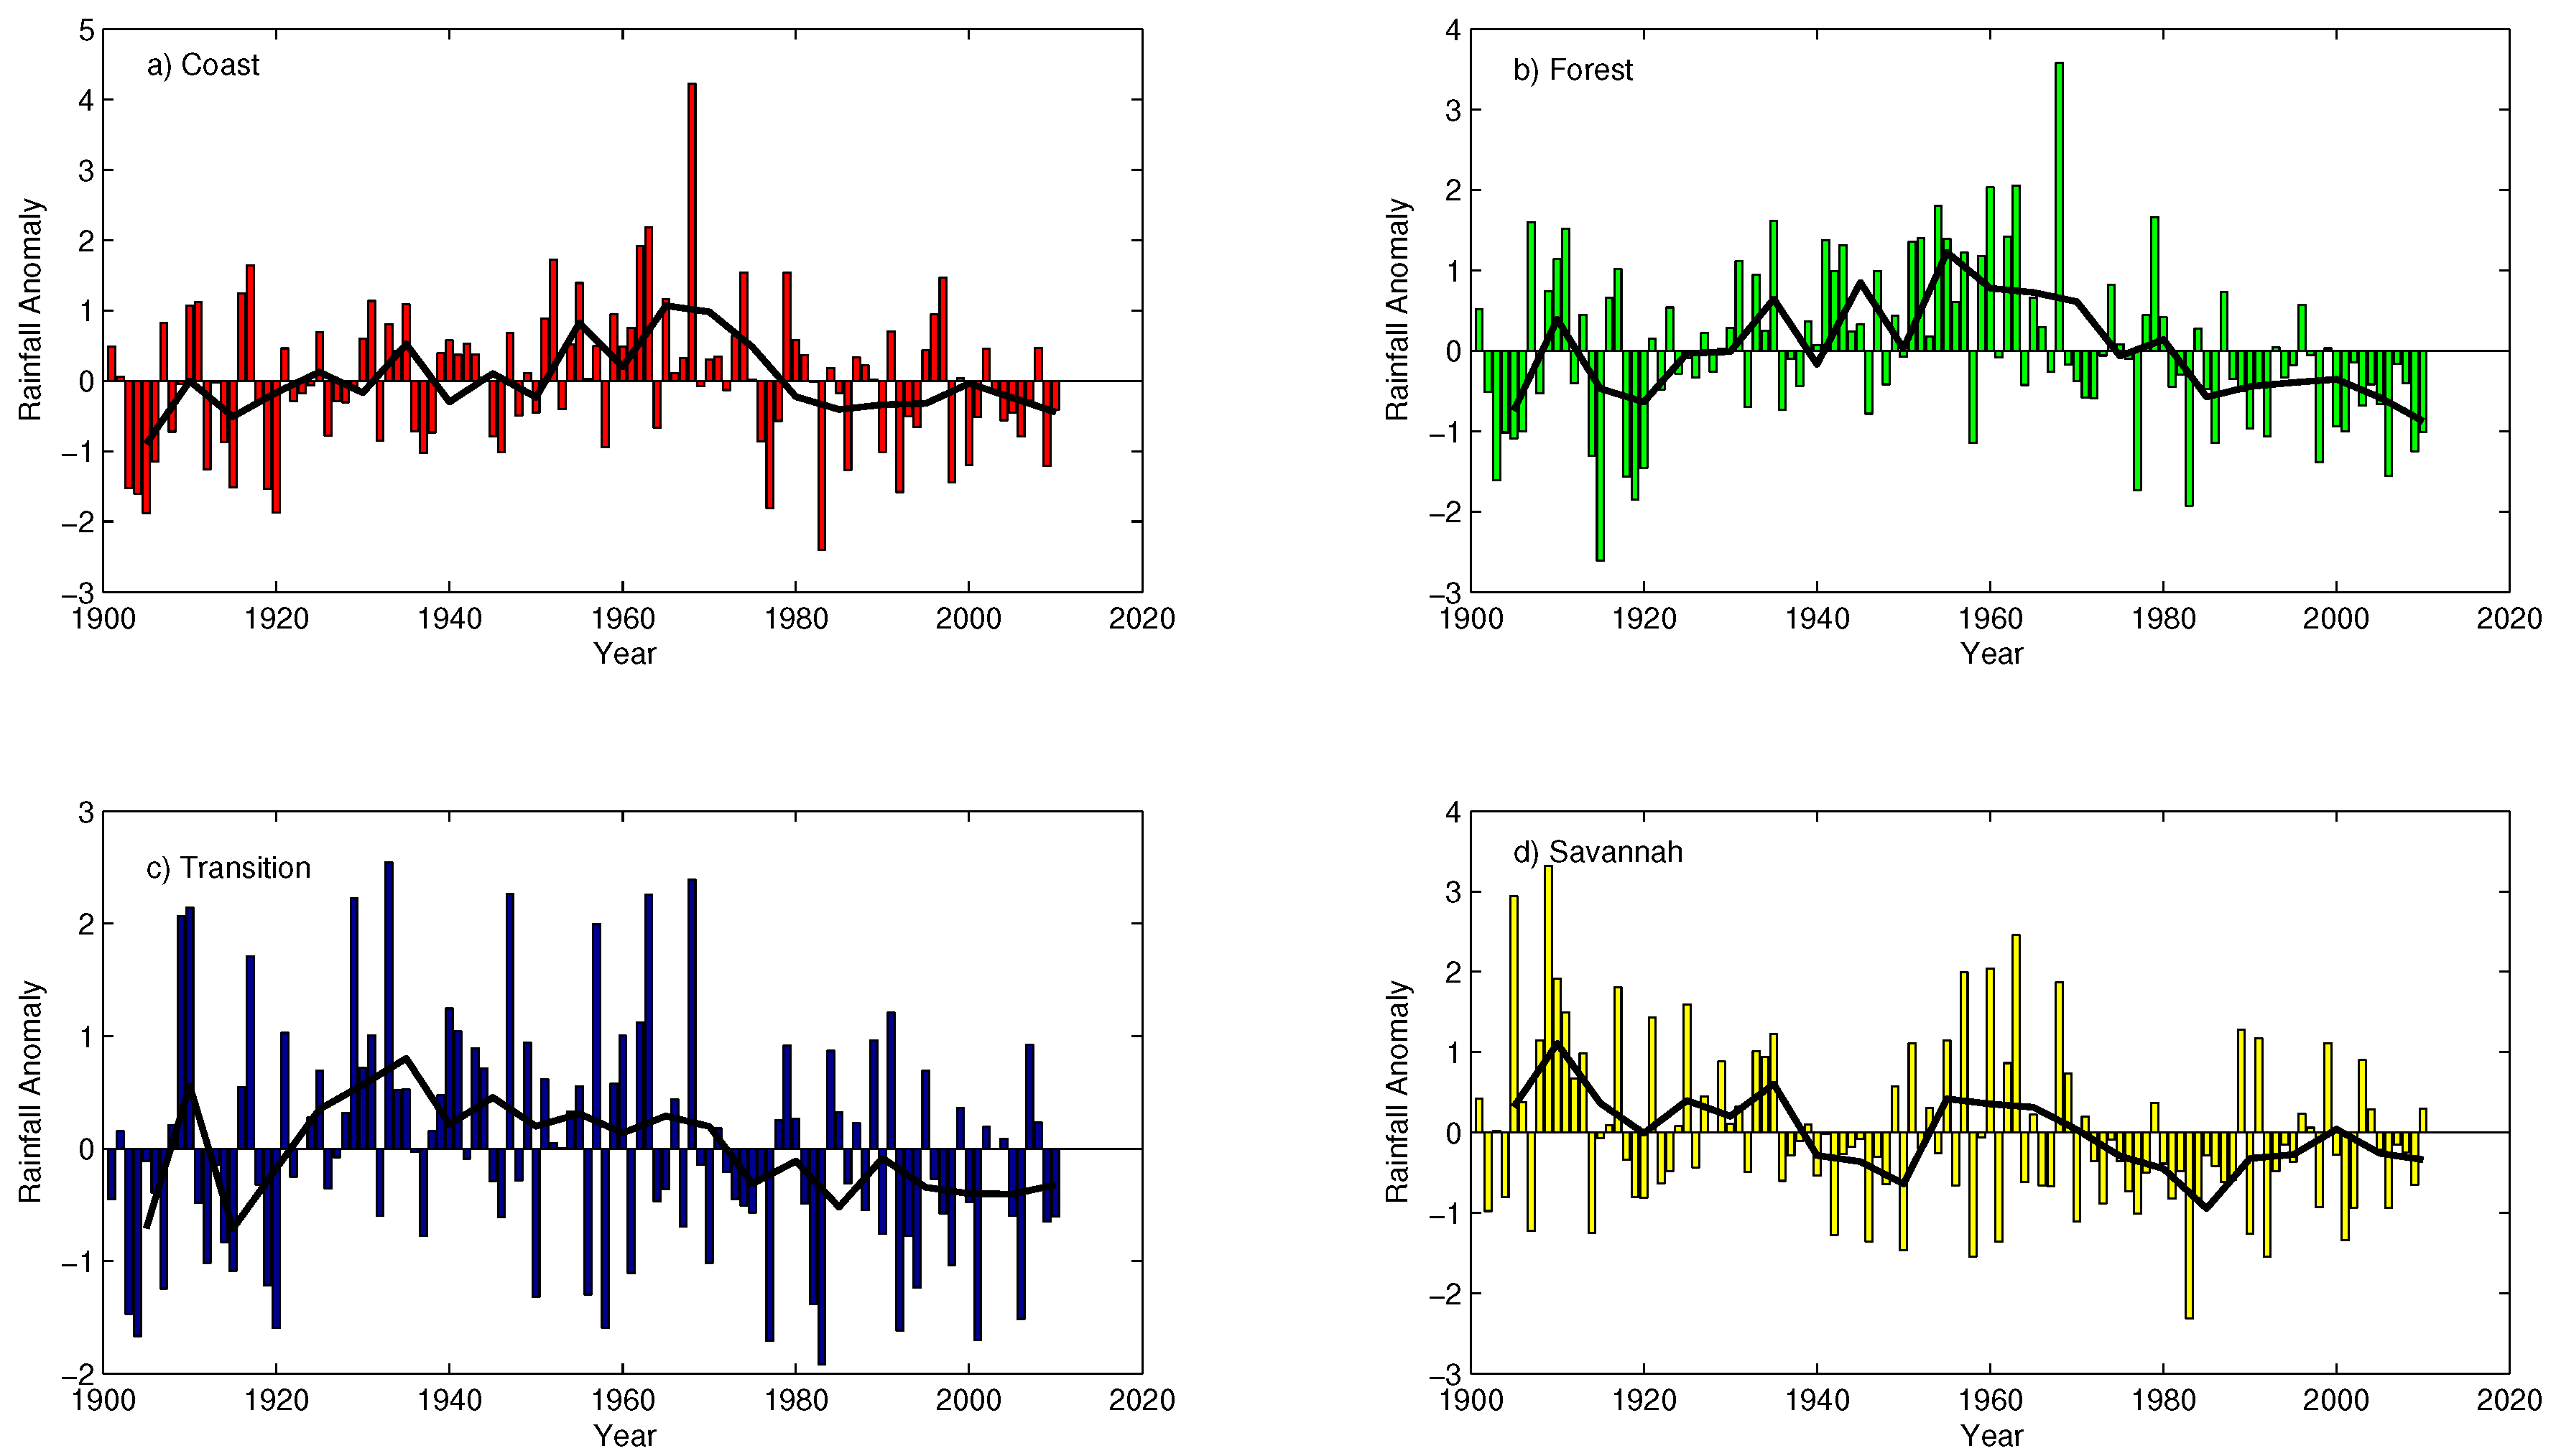
4.3. Annual Rainfall Variability over Ghana

The annual rainfall variability was investigated by using the standardized rainfall anomaly as described in Manzanas et al. [14] and Wilks [43] instead of the the actual rainfall amounts in order to understand the variability of the annual rainfall values of each zone about it’s own mean. Below normal rainfall was observed in almost all the the agro-ecological zones between 1901–1905, 1908–1920, and 1980–2010 while above normal rainfall was found between 1950–1980 in almost all the agro-ecological zones (Figure 8). To simplify the annual variation, a five year moving average was computed for all the agro-ecological zones.
From the 5 year moving averages, it can be seen in Figure 8 that below normal rainfall dominates the period 1901–1920 and 1980–2010 for all the agro-ecological zones except for the Savannah Zone where the period 1901–2010 is dominated by above normal rainfall values. On the other hand the period between 1920 and 1980 is dominated by above normal rainfall values for all the zones especially the Transition Zone. The Savannah Zone however shows inconsistent above normal rainfall values for this period with below normal rains being recorded between 1940–1970.
The effects of the ENSO on the region as indicated by Adiku et al. [9] and Sultan et al. [44] can also be seen in all the agro-ecological zones around 1972–1973, 1982–1983, 1997–1998 where very strong El Niño episodes were recorded [45]. The effects of the very strong La Niña episodes of 1973–1974, 1975–1976 and 1988–1989 is also seen mainly in the Coastal and Forest zones. Although the 1997–1998 El Niño was reported to be stronger than the 1982–1983 [45], the effect on the former was not as pronounced as the latter because of the strong La Niña that followed the former. According to [9] the impact of ENSO on the region is stronger at the Coastal zones but weakens as one moves inland due to the interference of other factors that influence the dynamics of the West African Monsoon. Over Ghana, the variability of the ENSO enhances the north easterlies and reduces the monsoon flow. The upper easterlies are also weakened leading to dry conditions close to the surface of the Inter-Tropical Discontinuity (ITD) during the major rainy season and the dry season. A study by Mawunya et al. [46] revealed that El Niño years are associated with late onsets while La Niña years are associated with early onsets. El Niño has therefore usually intensified the dry season resulting in severe droughts in most regions while La Niña has usually intensified the rainfall amounts [44,47].
The results of the annual variability and the 5 year moving average also indicates a recent decrease in annual rainfall amount as stated by Paeth and Hense [4], Owusu et al. [5] and Yorke and Omotosho [48]. The recent decrease in rainfall amount since the 70s might have been contributed by the very strong El Niño episodes mentioned above as well as the strong 1987–1988 and 2009–2010 El Niño [45]. This is however opposed to the rising trend reported by Manzanas et al. [14] when the National Centers for Environmental Prediction (NCEP v1) data was used.

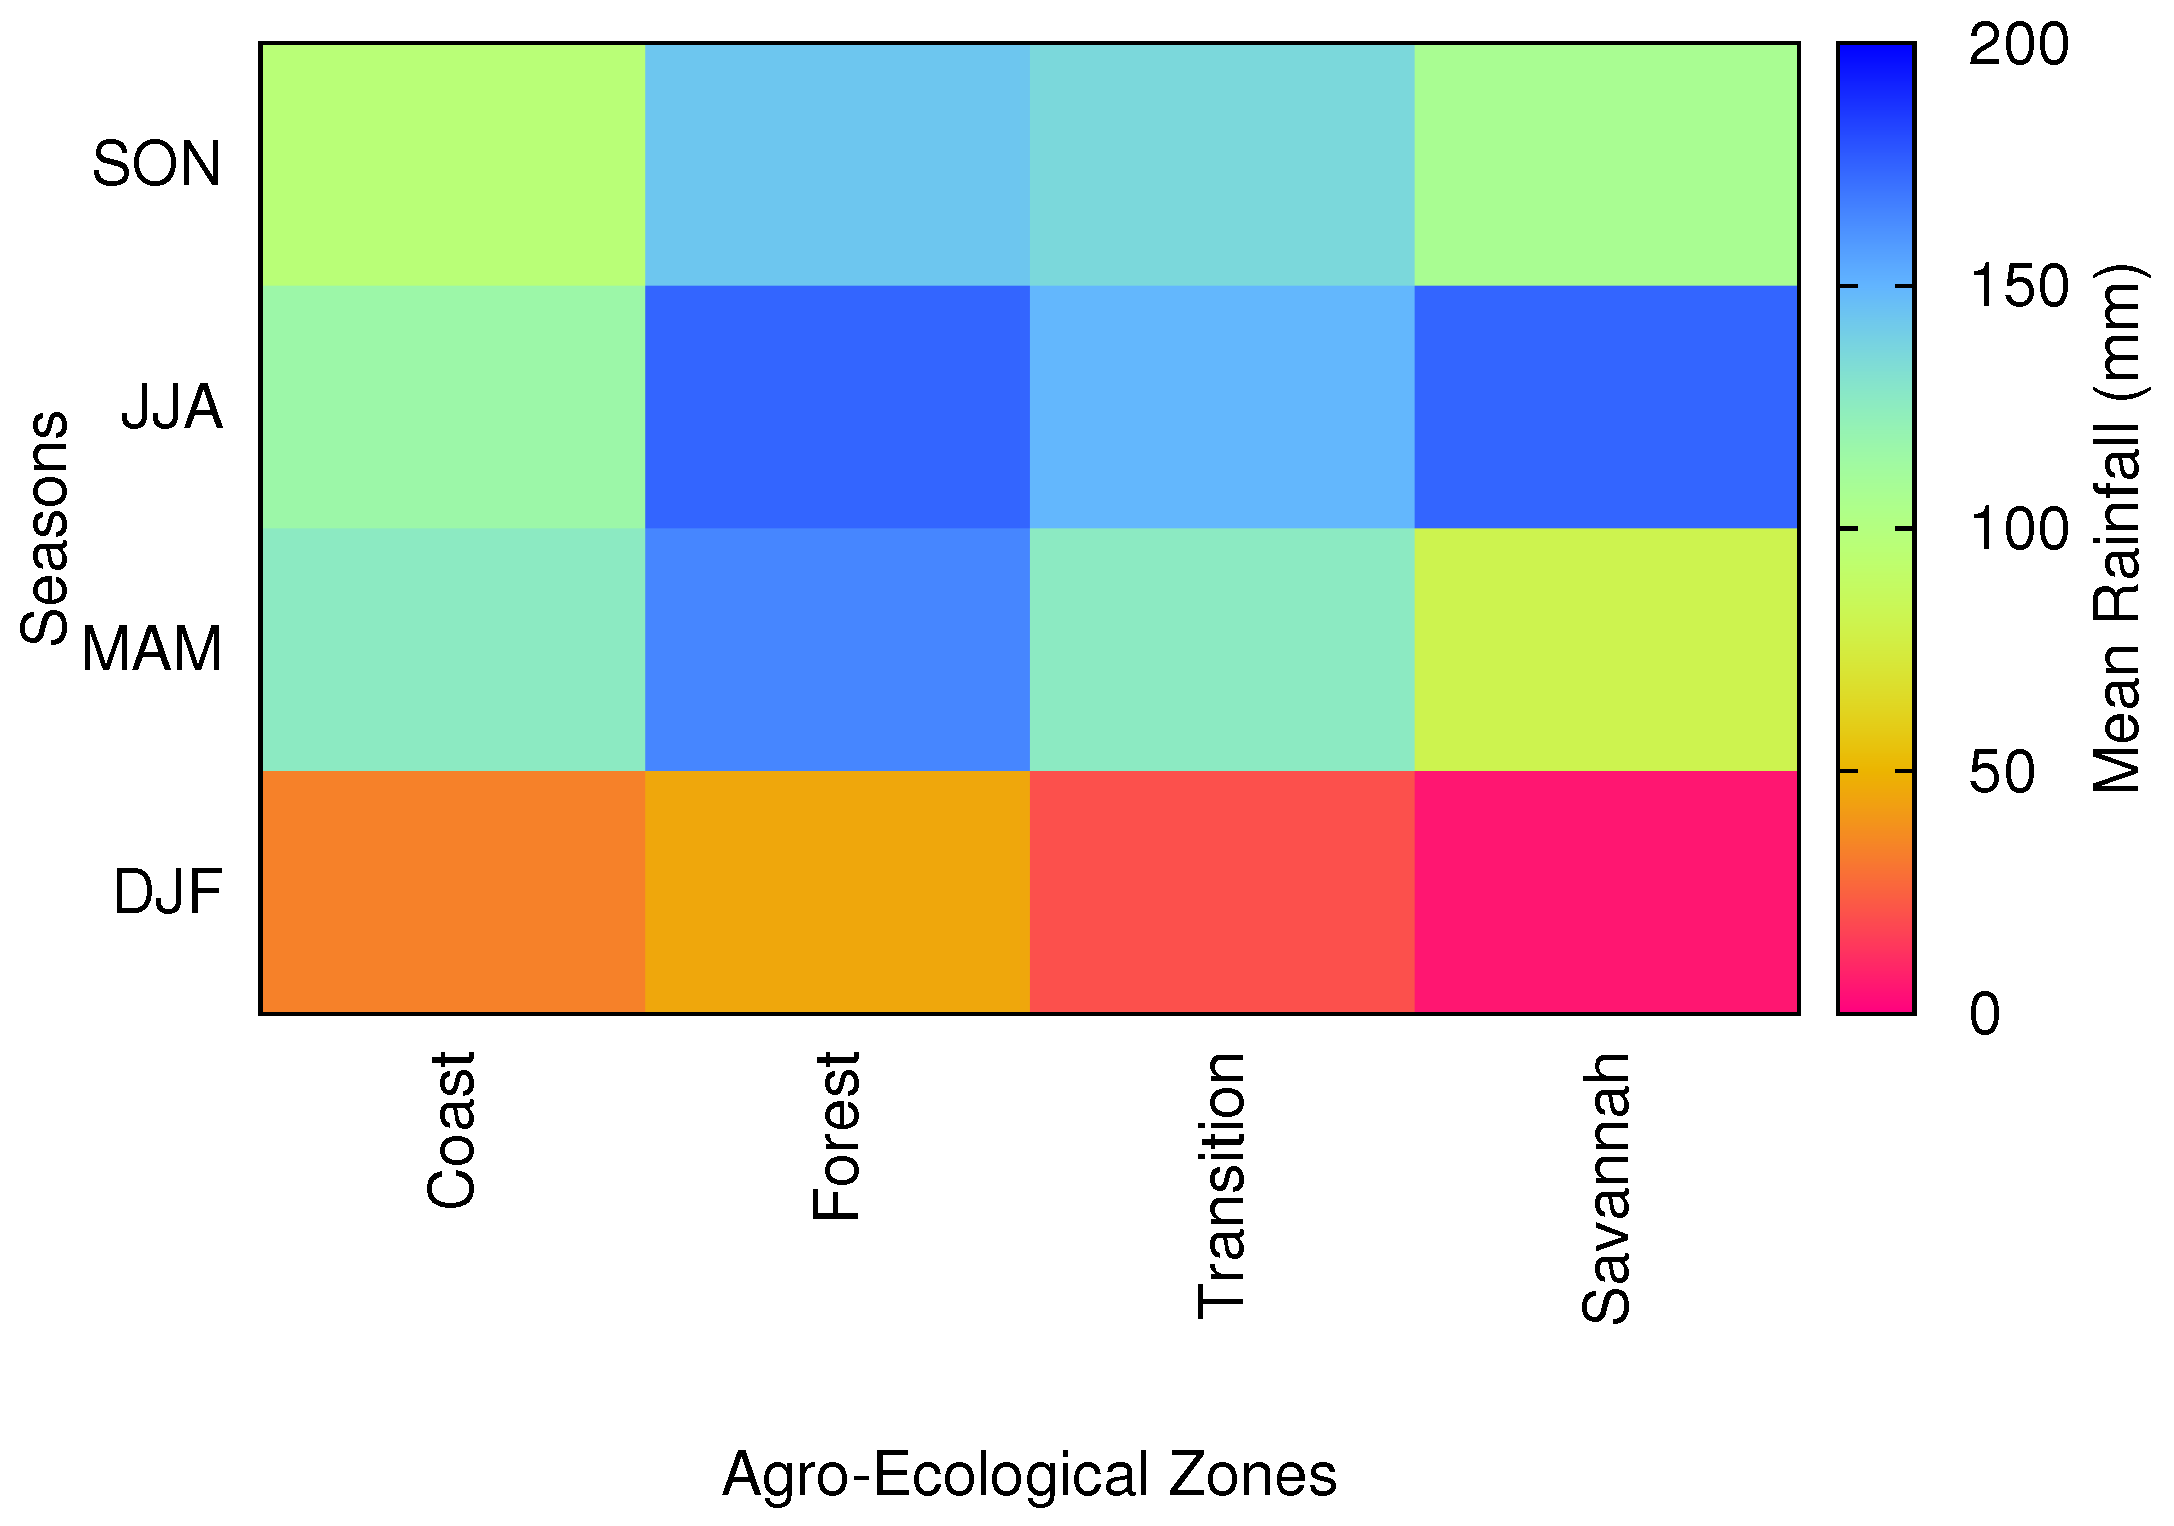
4.4. Seasonal Rainfall Variability over Ghana

The seasonal mean rainfall over Ghana was determined and the results are shown in Figure 9.
The December–January–February (DJF) season happens to be the season with the lowest rainfall amount nationwide. The maximum amount of rainfall expected within this period is about 90 mm located at the southwestern part of the country (Figure 9a). The remaining parts of the south have rainfall values ranging from 20–80 mm. The Savannah Zone and the upper parts of the Transition Zones, however, record the lowest rainfall amount of <20 mm during this season. During this season, the Azores high pressure system located at about 30° N of the Atlantic intensifies while the the St Helena (25° S South Atlantic) relaxes. This results in the dry North-East trade winds dominating over the entire country hence pushing the ITD southwards beyond the country. The whole country therefore experiences the dry and hazy conditions known as Harmattan during this period [8,49,50].
The March–April–May (MAM) season happens to be the rainfall onset period for most parts of the country. Rainfall values begin to increase from about 60 mm in the north to as high as 200 mm in the south, especially towards the southwestern part of the country. This is shown in Figure 9b) and can also be found in [30,51].
During this period, the Azores high pressure system begins to weaken as the St Helena high pressure system starts intensifying. The south-west monsoon winds begins to prevail over the North-East Trade winds. As a result, the ITD rises from its southern position and starts its migration towards the north. It begins to carry with it moisture which dominates the southern part of the country [8,52,53].
The June–July–August season happens to be the wettest season all over the nation. Very high rainfall amounts that ranges from about 90 to over 220 mm are recorded all over the nation. The west coast continues to be the wettest with rainfall amounts ranging from 160 to over 200 mm. The Savannah Zone interestingly records high values between 160 and 200 mm during this period. The effect of the Volta basin on the local climate is significantly seen around Kete Krachi (7.8°N and 0.02° W) in this period with rainfall values between 180–200 mm (Figure 9c) [30,51].
Around this period, the strength of the St. Helena High pressure system would have intensified [53]. Moisture laden South-West Monsoon winds dominates the country and hence pushing the ITD further north over the country. This results in a continuous and consistent rainfall experienced all over the country.
The September–October–November season is known as the minor rainy season for the southern part of Ghana. Rainfall amounts vary between 100 and 180 mm for the southern and the lower portions of the north. The upper parts of the north and the east coastal regions however experience a relatively lower rainfall between 40 and 100 mm (Figure 9d). During this season, the St. Helena High pressure system begins to weaken. The strength of the Monsoon winds therefore begins to weaken. The ITD begins to return and hence resulting in this minor rainy season [30,51].

4.5. Summary of Seasonal Variation

The summary of the seasonal variation in rainfall is presented in Figure 10. The Coastal Zone records lowest mean rainfall values for all the seasons with the highest of about 117 mm recorded in MAM. The Forest Zone on the other hand records very high rainfall values for all the seasons with the highest of about 174 mm recorded in JJA followed by about 165 mm in MAM. The Transition Zone however records almost similar rainfall values (varying between 120 and 150 mm) for all the seasons except for DJF where a lower mean value of about 21 mm is recorded. The Savannah Zone records the lowest mean rainfall amount of about 6 mm in the DJF season. High mean rainfall amount of about 174 mm is however recorded in this zone during the JJA season which is interestingly the same amount recorded in the Forest Zone. However, the former has most of its rains from July and August while the latter has most of its rain contributed by the month of June. This shows the potential for extreme rainfall events in this Zone during the JJA season.

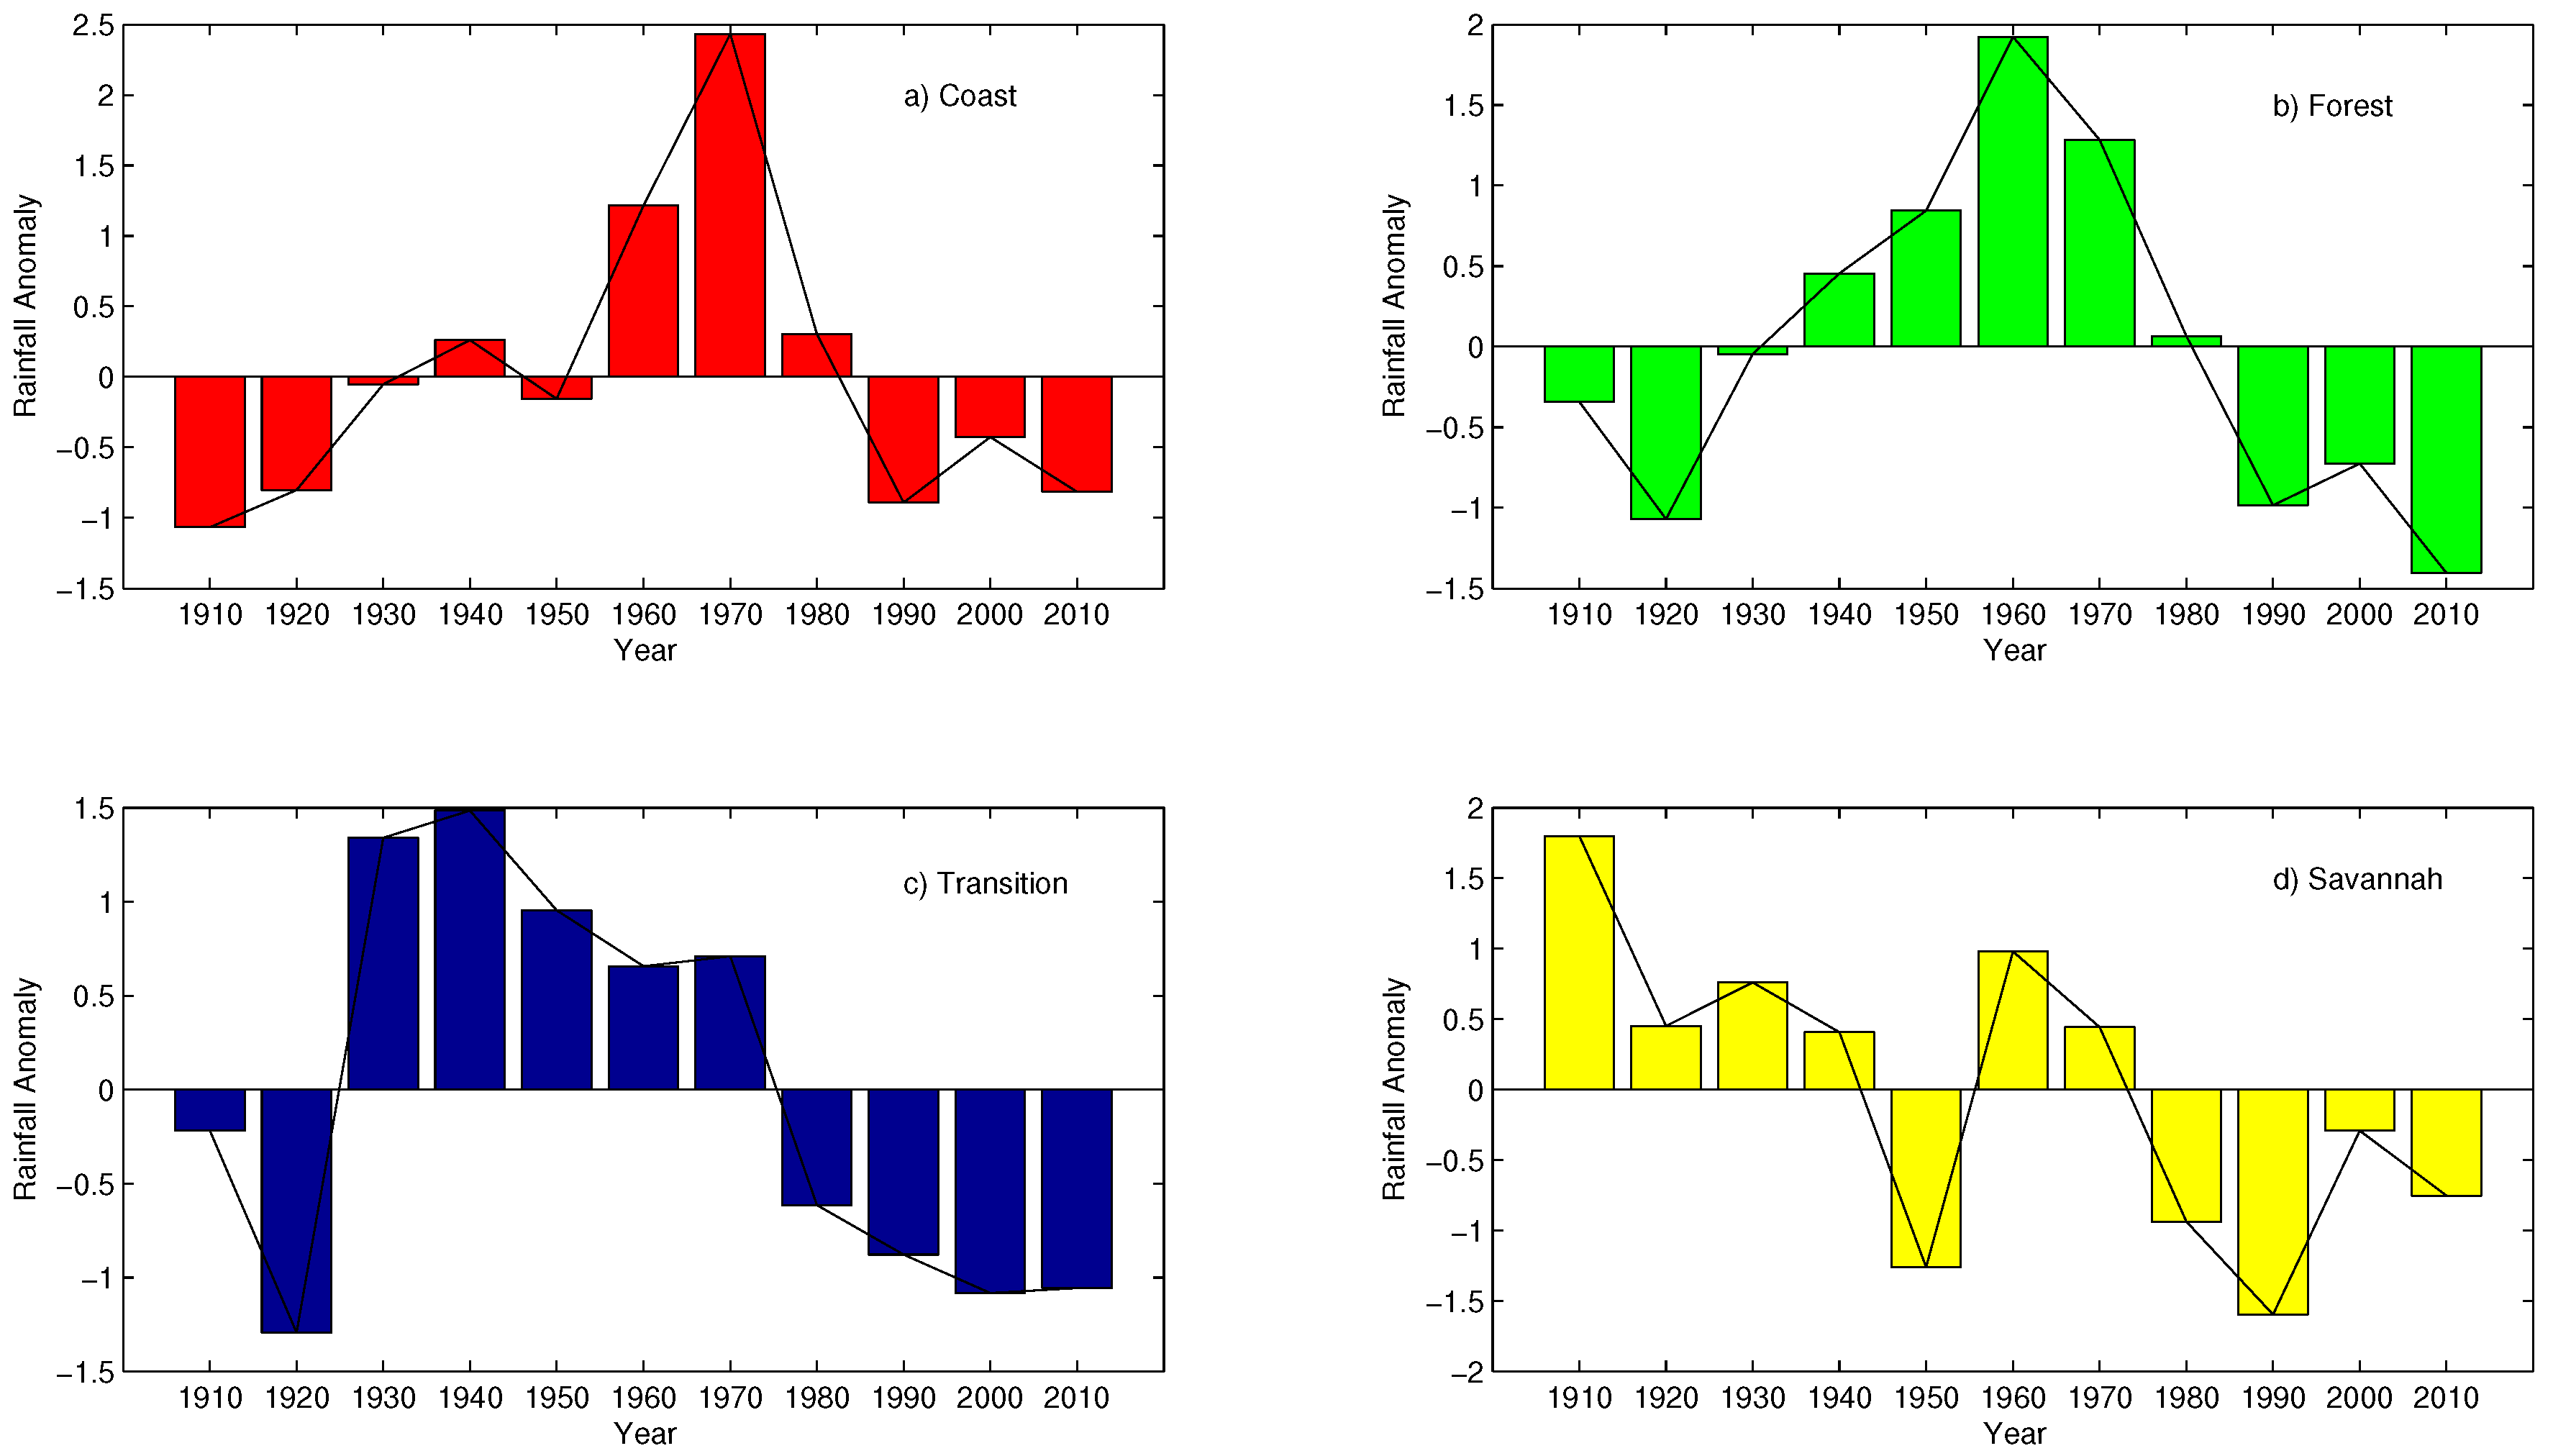
4.6. Decadal Variability of Rainfall over Ghana

The decadal variability was also studied using the standardized anomaly instead of the actual rainfall amounts for the same reason as mentioned in Section 4.3.
The results indicate below normal rainfall amounts observed between the 1901–1920 and 1980–2010 periods for all the agro-ecological zones except for the Savannah which shows above normal rainfall values within the 1901–1940 period (Figure 11). Likewise, above normal rainfall values are recorded between 1930–1980 for all the agro-ecological zones. The Savannah Zone however shows a break at around 1950 where a significant lower than normal rainfall value is recorded.
The dry period recorded between 1910 and 1930, the wet period between 1940 and 1980 and the dry period recorded in recent years indicates a strong annual, seasonal and -decadal variability exhibited in the region [54,55,56,57,58]. These variabilities have been found to be as a result of global climate teleconections such as ENSO and NAO and regional climate systems such as the ITD, the monsoon winds, Sea Surface Temperature (SST) anomalies, sub-tropical high pressure systems, the African Easterly Jet (AEJ) and the Tropical Easterly Jet (TEJ) [59,60,61,62].
Therefore by using a data of a time scale longer than most earlier studies in the region, the results of the present study indicates that the decreasing trend observed in recent years [4,5,48] which has usually been attributed to anthropogenic factors such as increase in industrialization [63,64] might have a contribution from a natural climate variability and not solely due to anthropogenic factors.

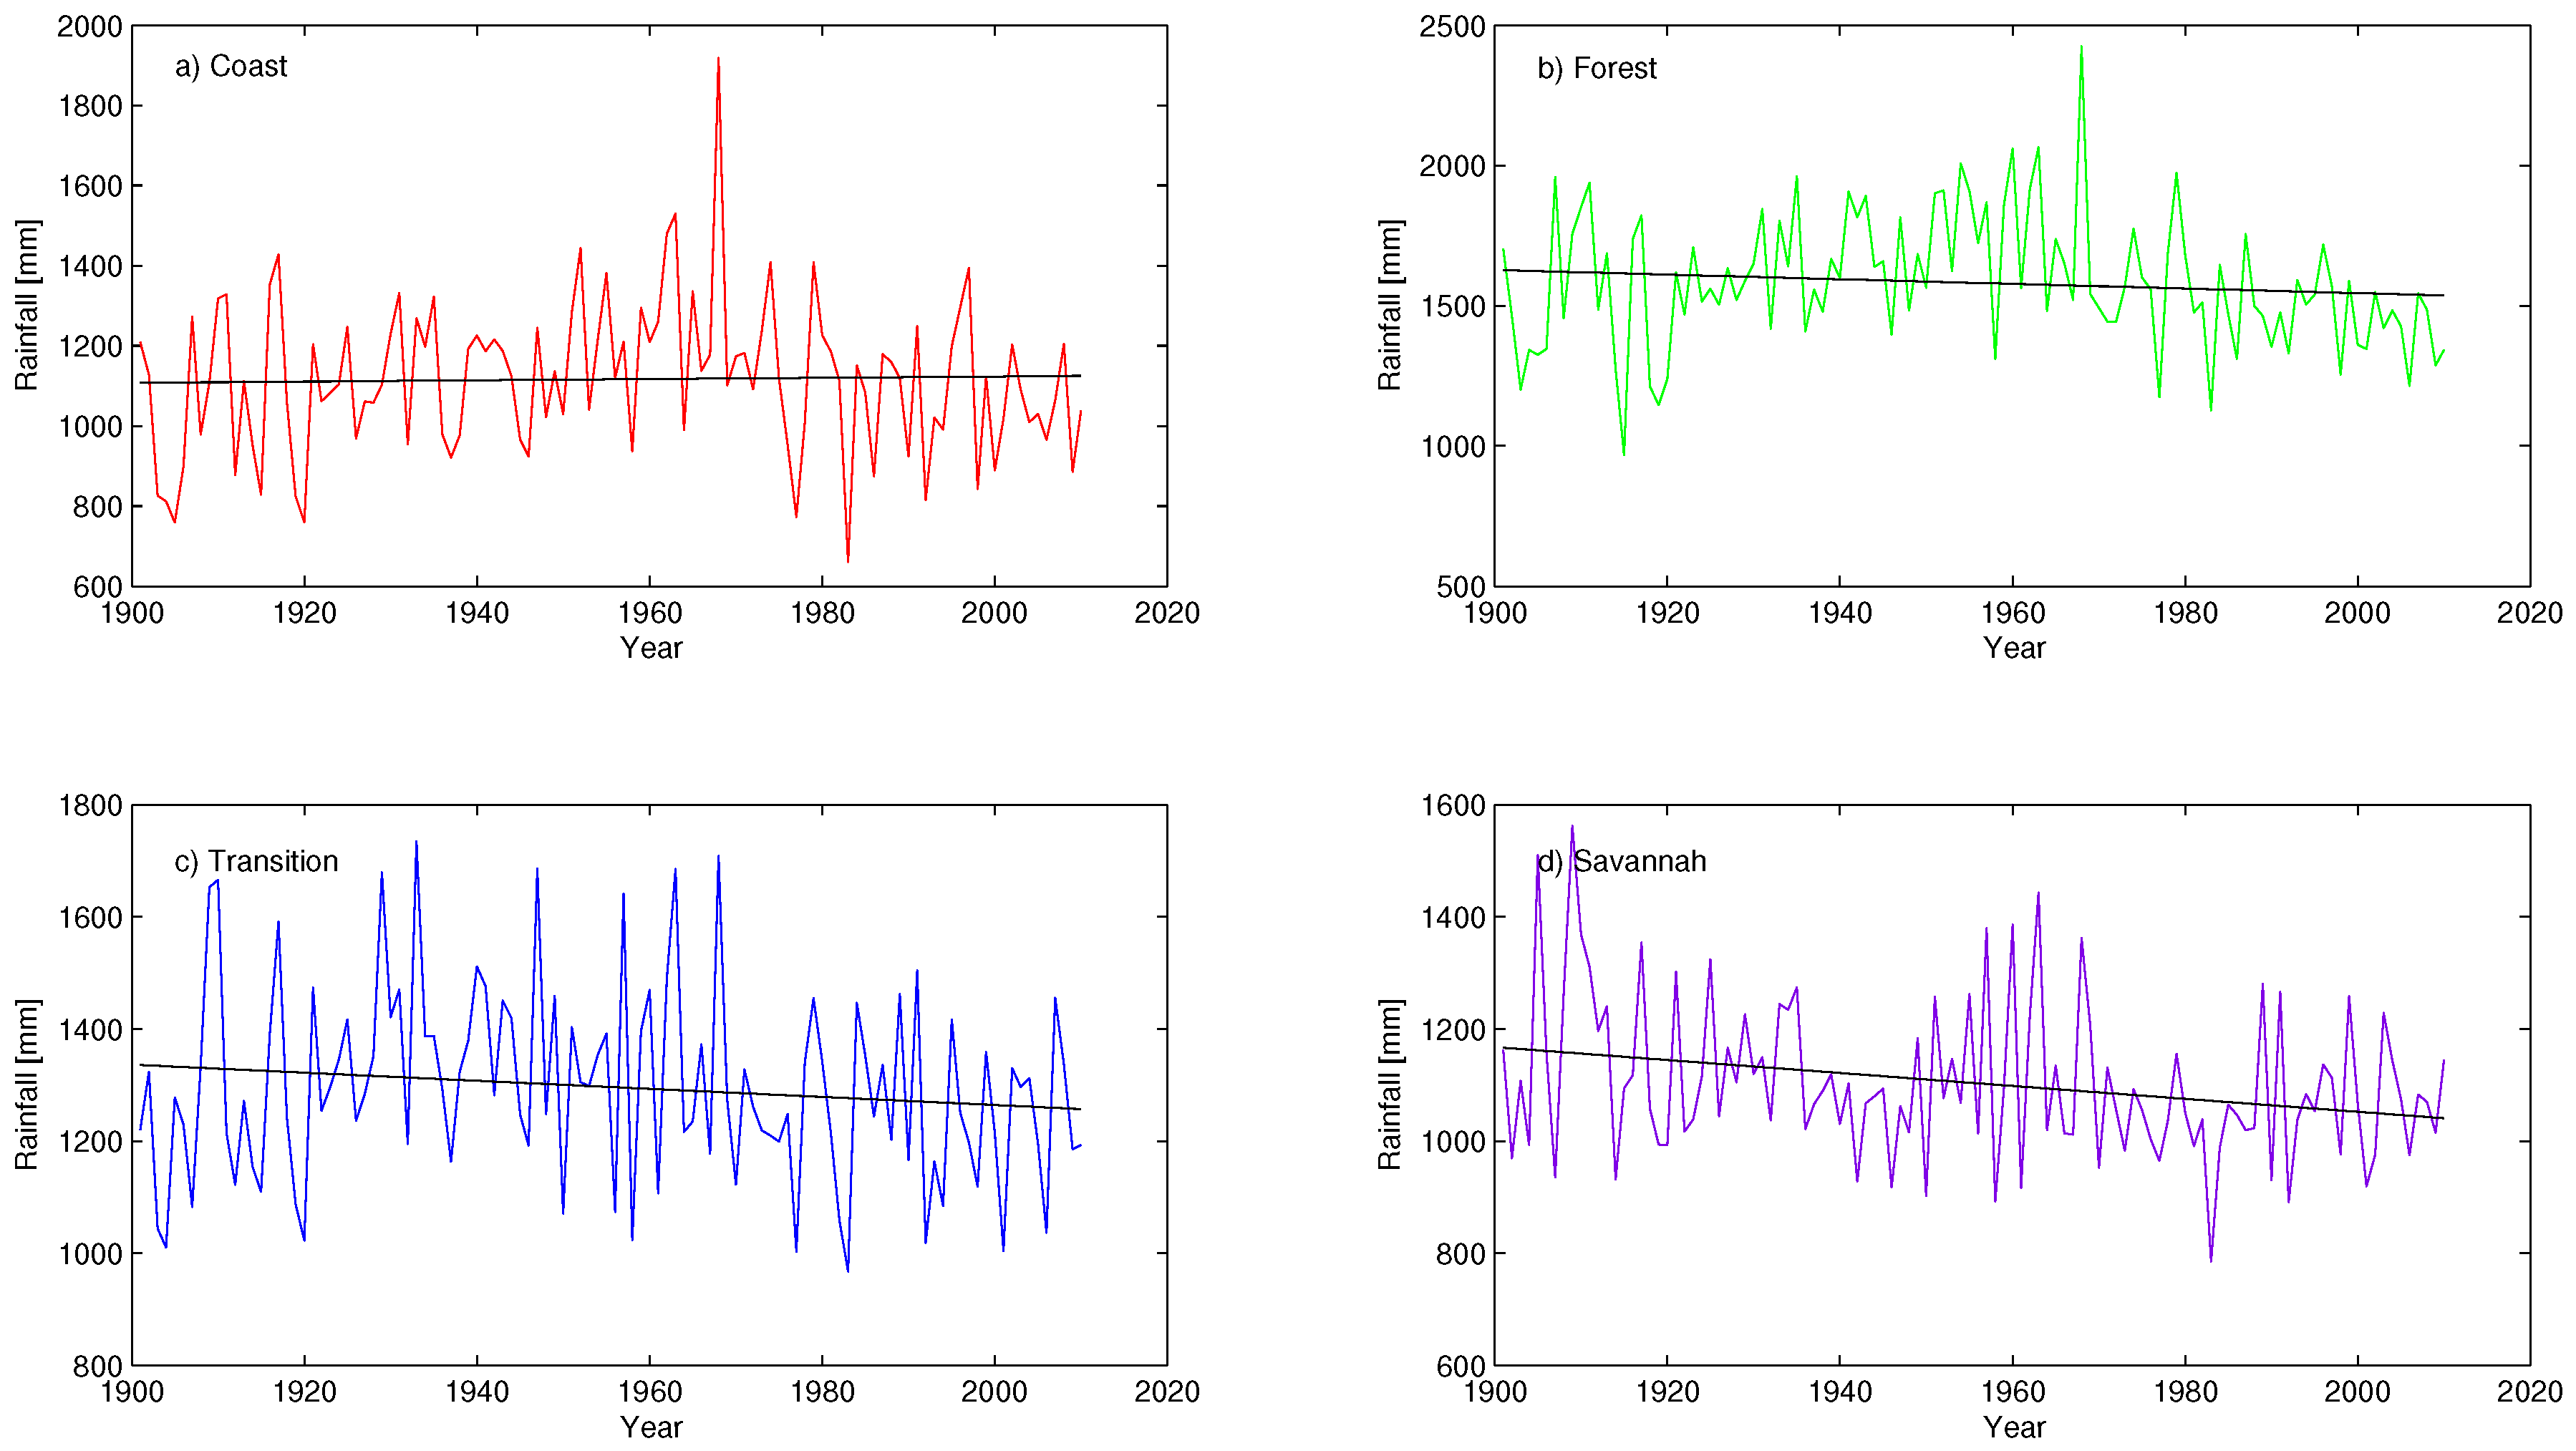
4.7. Annual Trend Analysis

In general, a decreasing trend is observed in Figure 12 for the annual rainfall over all the agro-ecological zones except for the Coastal Zone where a slight rise in trend of 0.1600 mm per year is seen. The rainfall in the Forest, Transition and Savannah changes at rates of −0.8300, −0.7200, −1.1500 mm per year respectively. However it is only the trends in the Savannah and the Forest Zones that were significant at the 0.01 and 0.10 significance levels respectively using the Mann Kendall Trend test. These decreasing trends might have been caused by a natural variability as observed in Section 4.6 and anthropogenic factors such as deforestation and urbanization which have resulted in Urban Heat Islands (UHI) and hence increasing the warming in the region [65]. The decreasing trends may pose a serious threat to agricultural production and food security.

4.8. Seasonal Trend Analysis

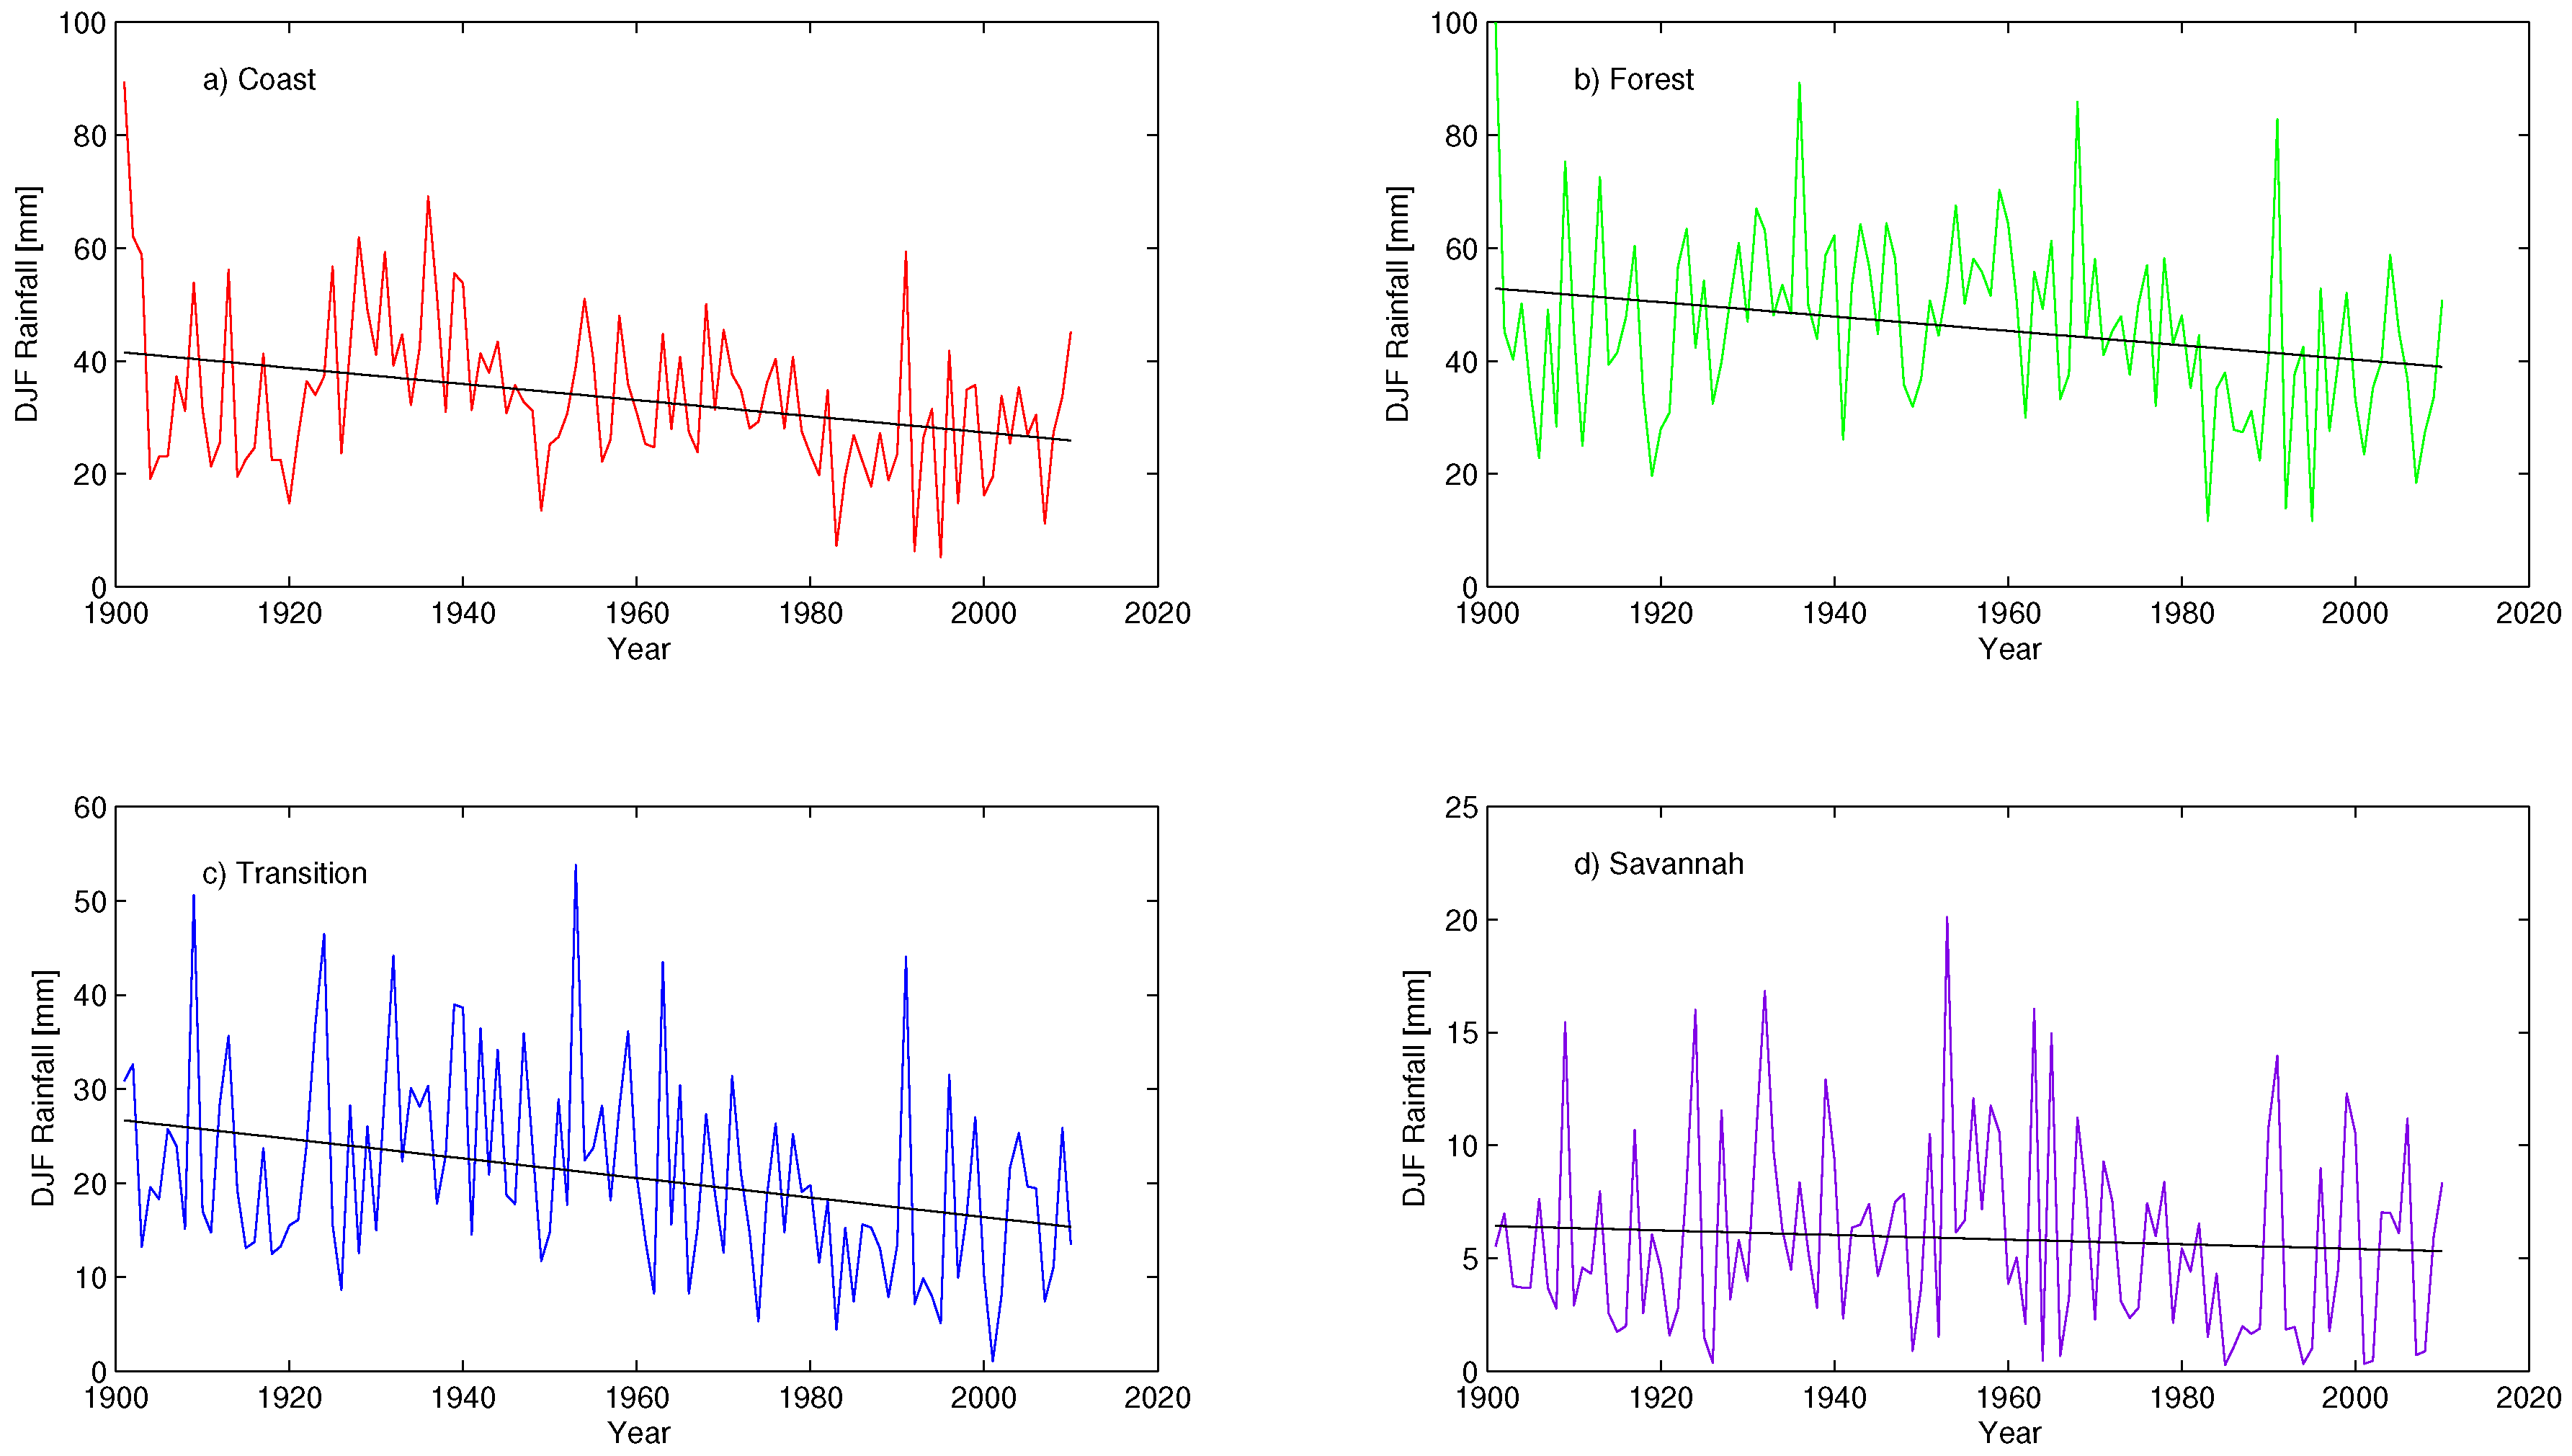
4.8.1. Trend Analysis for the DJF Season

From Figure 13a decreasing trend is observed over all the agro-ecological zones for the DJF season. The trend is more pronounced in the Coastal (−0.1429 mm per year), Forest (−0.1273 mm per year), and Transition Zones (−0.1040 mm per year) than in the Savannah Zone (−0.0102 mm per year). All the trends were shown to be significant in this season at 0.01 significance level using the Mann Kendall Trend Test except for the Savannah Zone which shows no significant trends at the 0.10, 0.05 and 0.01 significance levels. These findings are consistent with the observed trends from Manzanas et al. [14].
The amount of rainfall that is recorded during the DJF season is significantly decreasing in almost all the agro-ecological zones. Although no significant decreasing trend is seen in the Savannah Zone during this season, the mean rainfall amount recorded in the zone is very small (<7 mm). This result indicates an intensification of the Harmattan season. This might have been caused by global teleconections such as the ENSO and NAO as well as local factors such as land degradation and bush burning by farmers since most land preparation is done during this period [51].

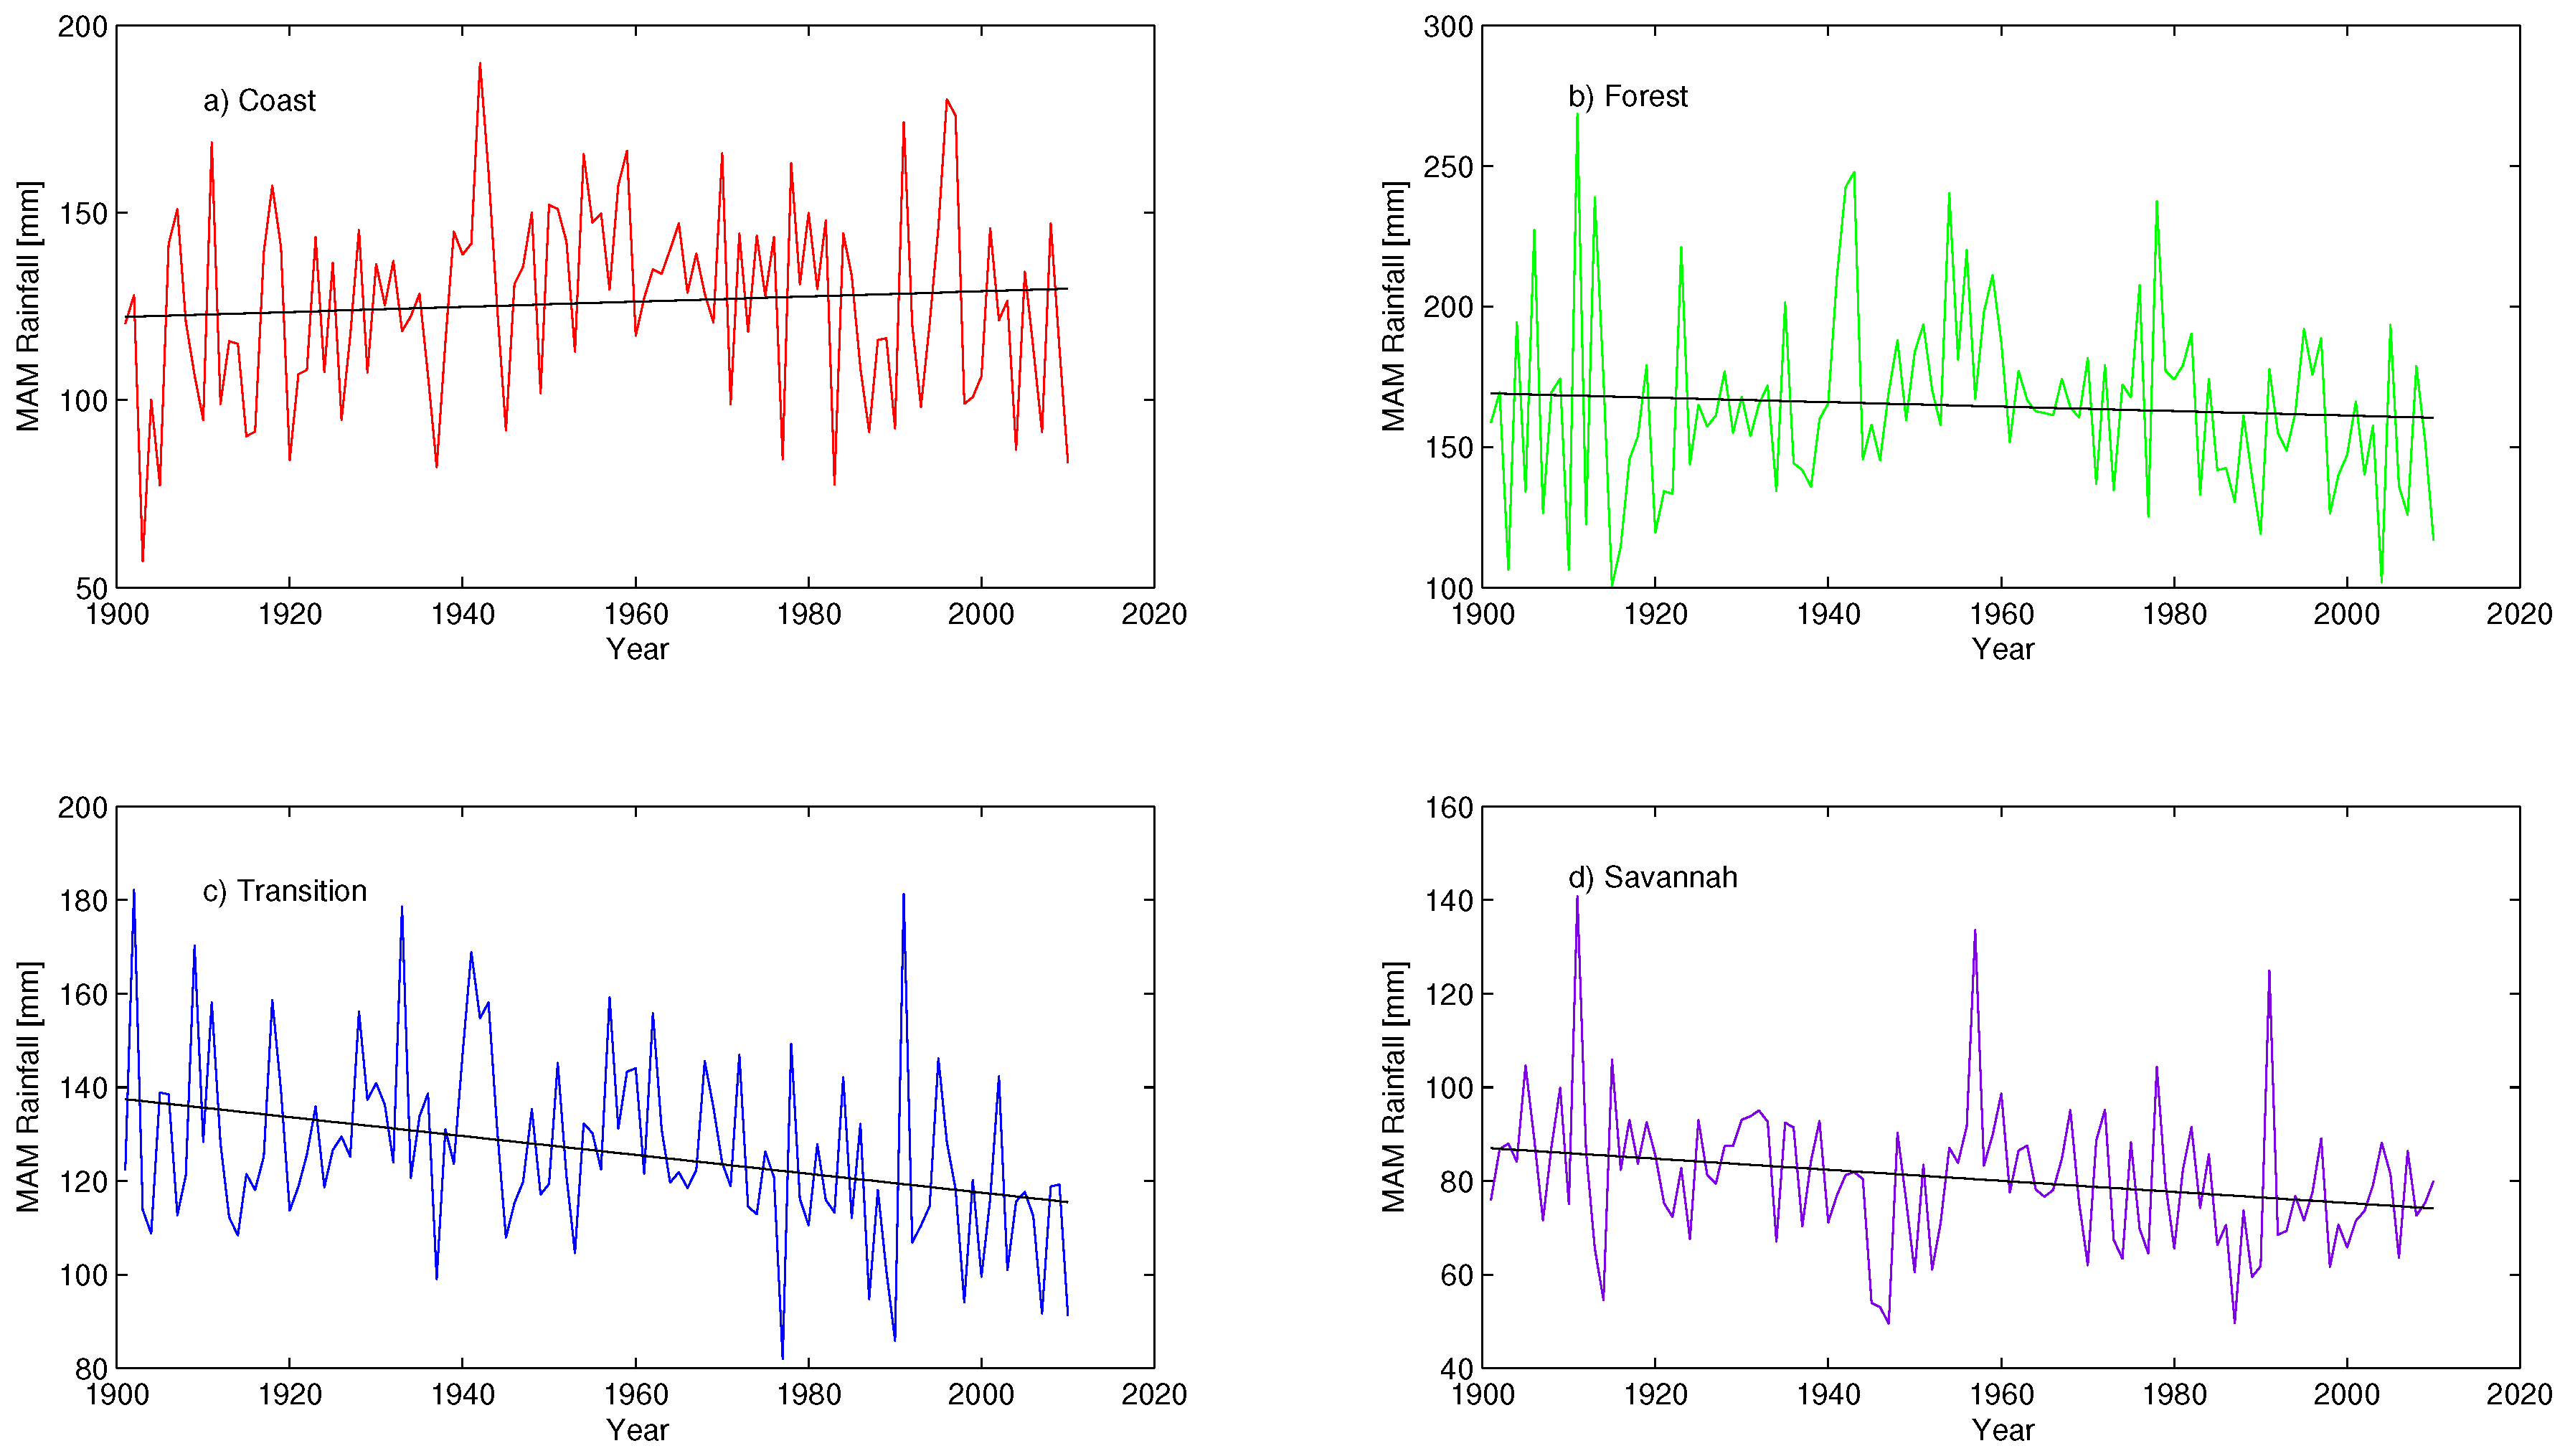
4.8.2. Trend Analysis for the MAM Season

From Figure 14, the decreasing trend observed in the DJF season continues to persist for the Transition (−0.2016 mm per year), Savannah (−0.1181 mm per year) and Forest Zones (−0.0793 mm per year) for the MAM season but however weaker in the latter. The Coastal Zone interestingly shows a slight increasing tread of 0.0692 mm per year in this season. Only the trends in the Transition and Savannah Zones were indicated as significant at the 0.01 significance level.

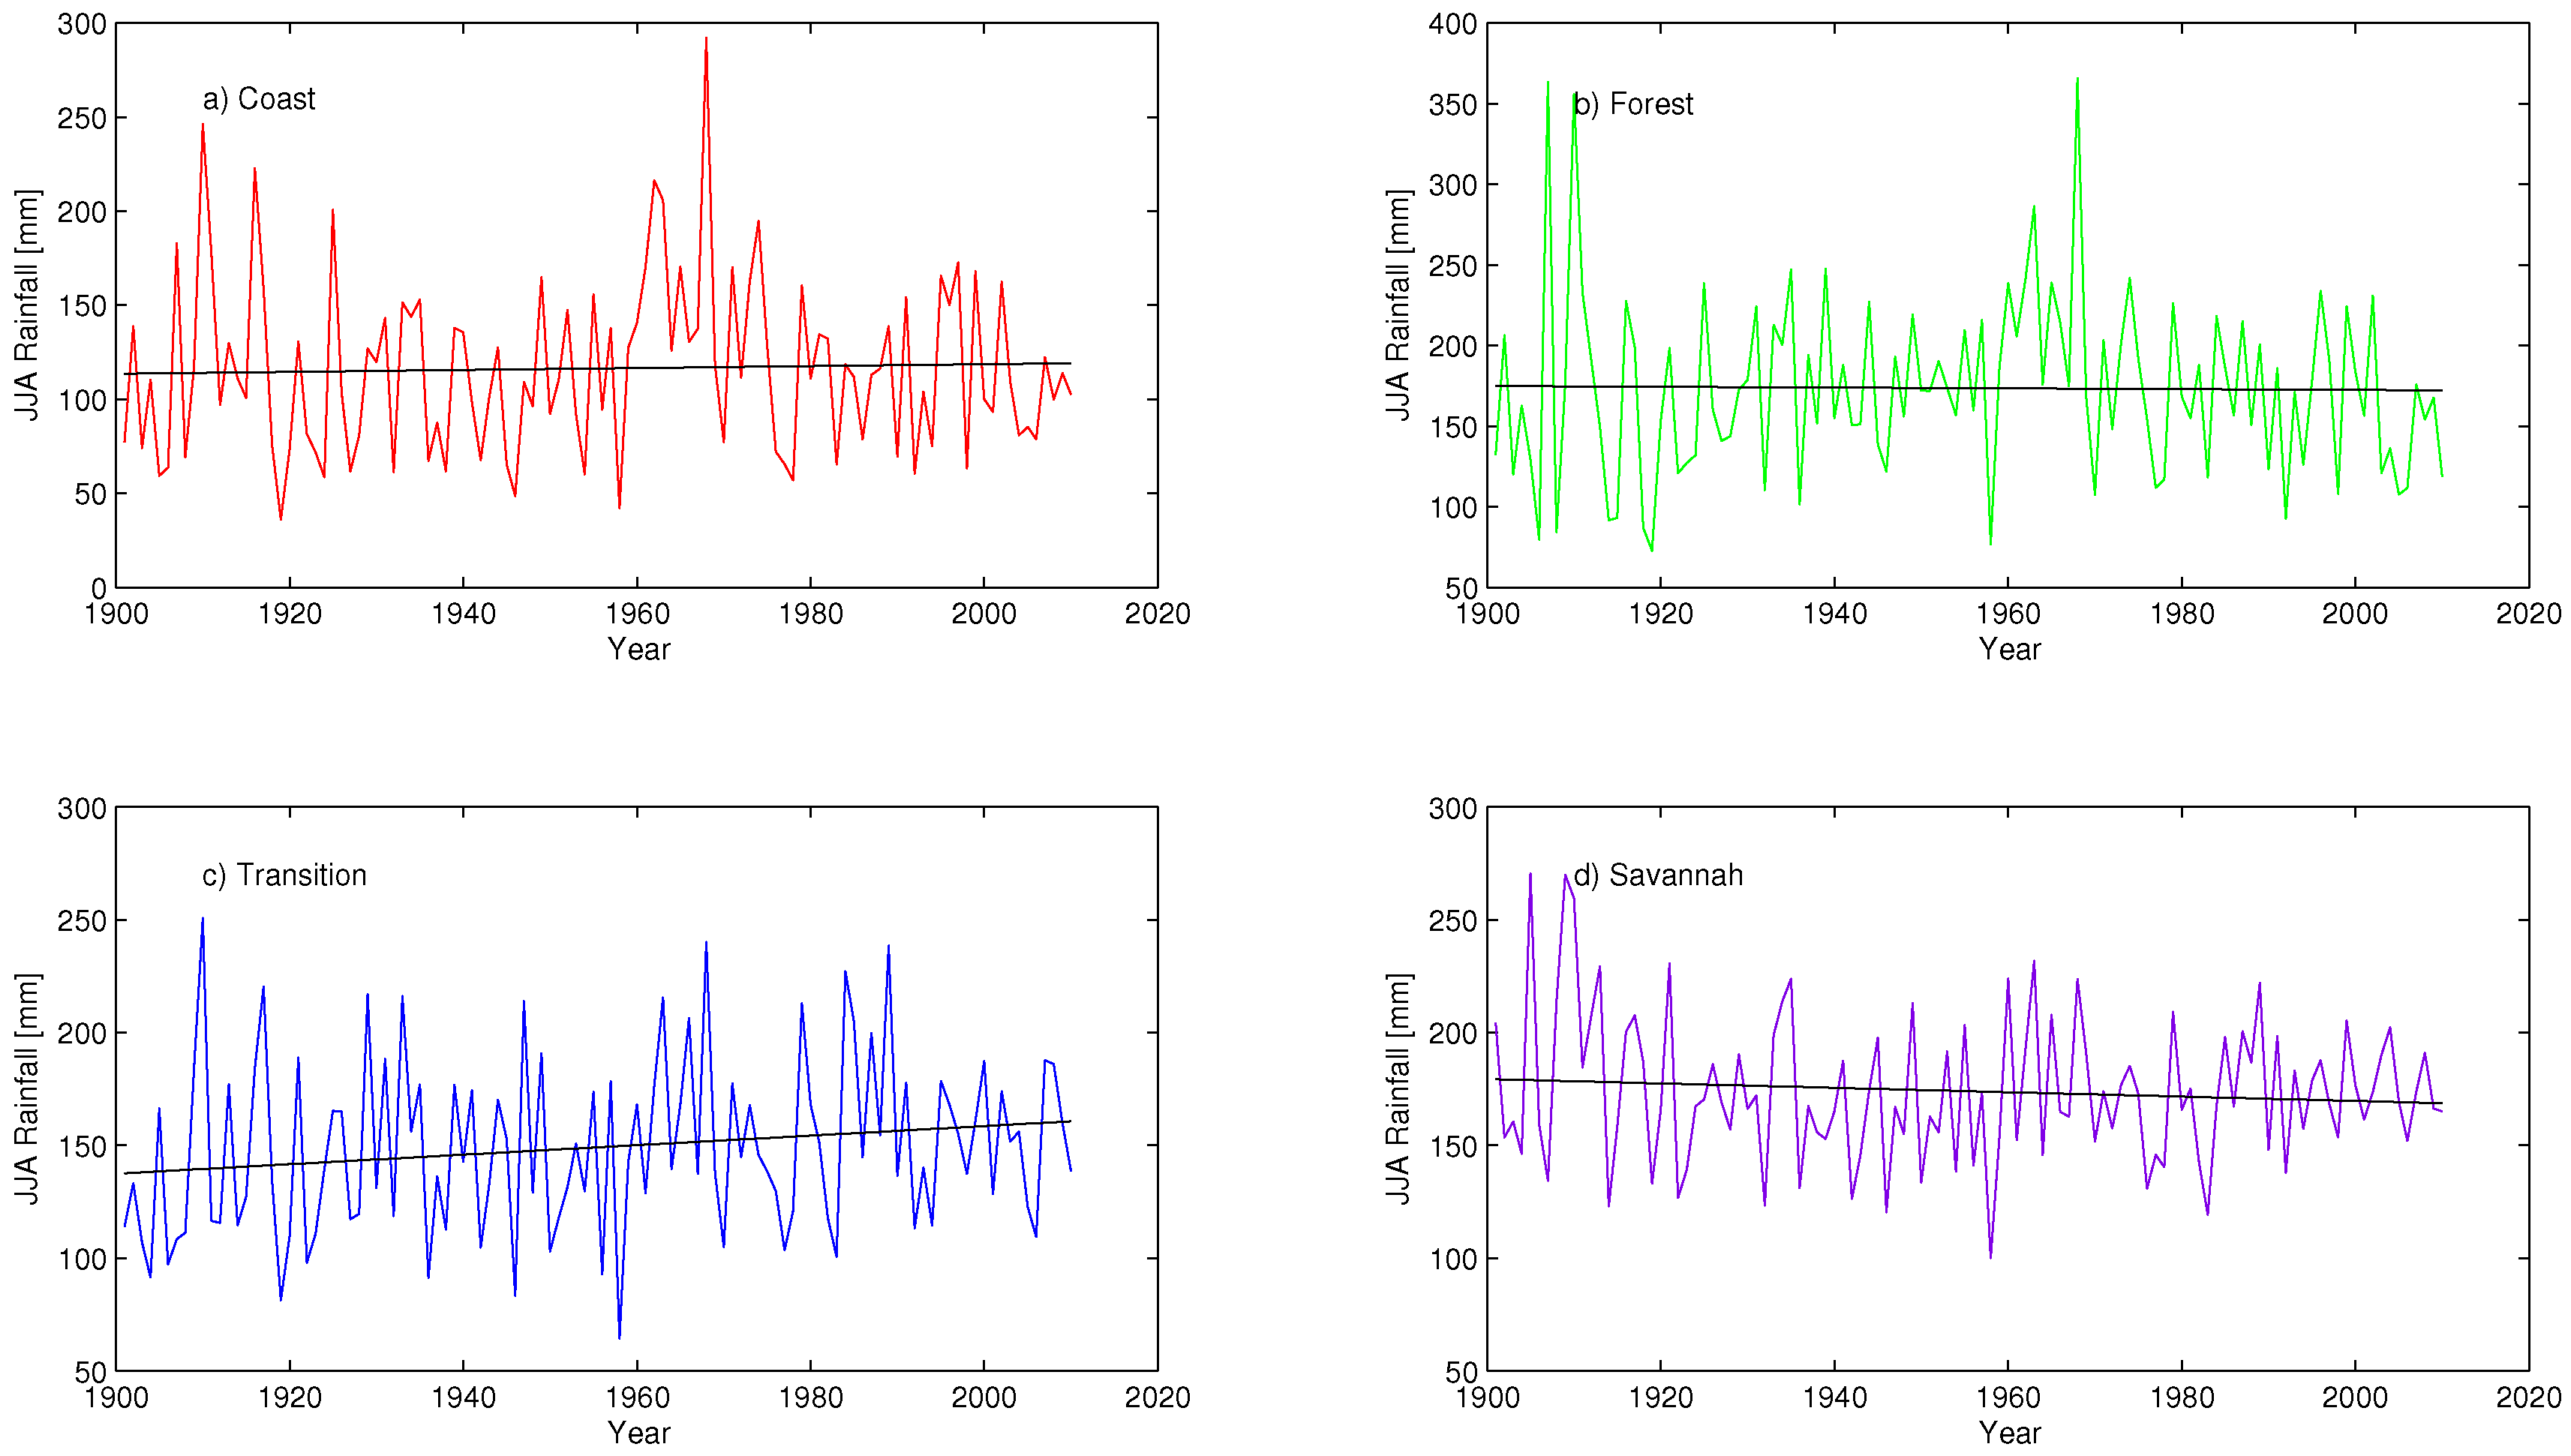
4.8.3. Trend Analysis for the JJA Season

The JJA season shows interesting trends for different agro-ecological zones (Figure 15). The trend rises in the Transition Zone (0.2112 mm per year) but almost stays constant in the Coast (0.0510 mm per year), Forest (−0.0242 mm per year) and Savannah Zones. There is however a slight decreasing trend (−0.0972 mm per year) in the latter. Only the trend in the Transition Zone was indicated as significant at the 0.05 significance level. This was however not significant at the 0.01 significance level.

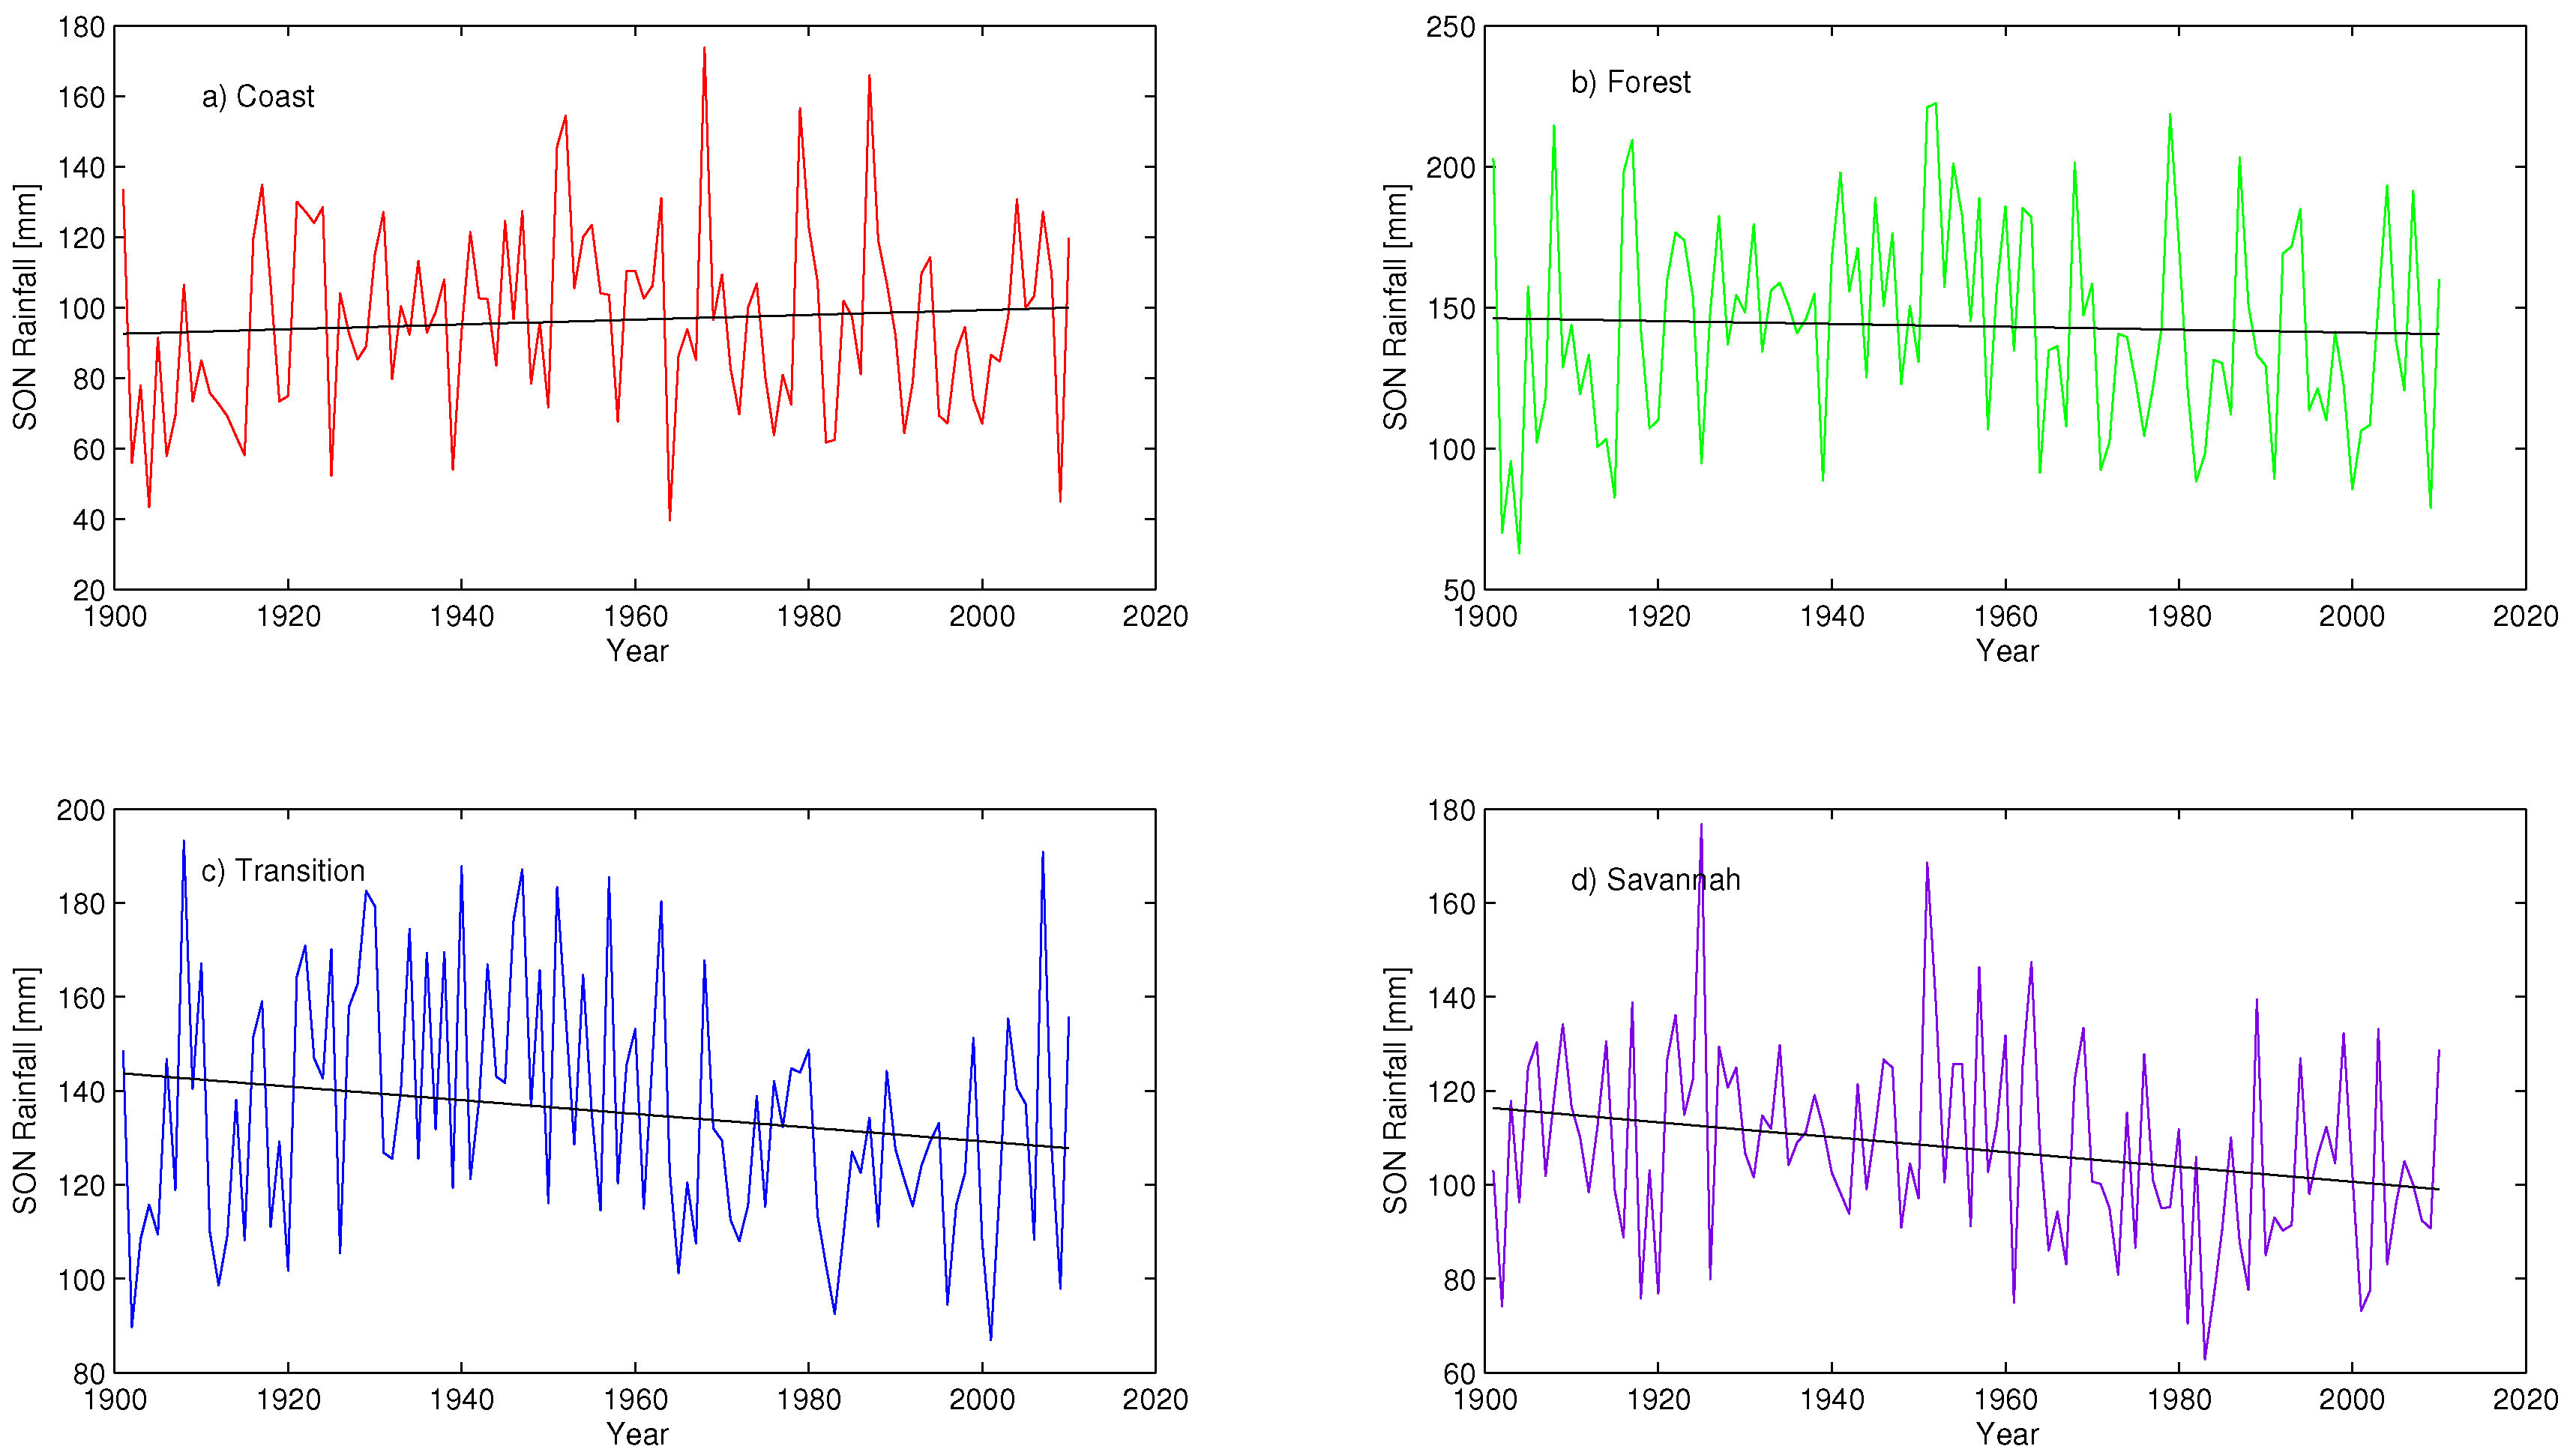
4.8.4. Trend Analysis for the SON Season

The SON season however displays varying trends for the various agro-ecological zones (Figure 16). There was a decreasing trend in the Transition (−0.1460 mm per year) and Savannah (−0.1582 mm per year) Zones which were shown to be significant at the 0.05 significance level. However, only the trend in the Savannah Zone remained significant at the 0.01 significance level. A little rising trend at the Coast (0.0677 mm per year) and an almost stable trend at the Forest (−0.0512 mm per year) which were however insignificant at the 0.10 significance level.

4.8.5. Summary of Seasonal Trend Analysis

The summary of the seasonal trend analysis is presented in Table 1 where each entry represents the seasonal trend rate in mm per year of each agro-ecological zone.
Generally, there is a decreasing trend in almost all the agro-ecological zones except for the Coastal Zone which has dominant increasing trends. These increasing trends are however insignificant using the Mann Kendall Trend Test at the 0.01 and 0.05 significance levels. The Transition Zone interestingly shows significant decreasing trends in all the seasons except for JJA. The DJF season (also known as the Harmattan season) shows a significant decreasing trends at the 0.01 significance level for all but one of the agro-ecological zones indicating an intensification of the dry season (the Harmattan).
These results also confirm that the rainfall amount is significantly decreasing even in the Transition Zone which is the food hub of the country. The decreasing trends will have serious consequences on agricultural production and food security.

4.9. Wavelet Analysis of Rainfall over the Agro-Ecological Zones of Ghana

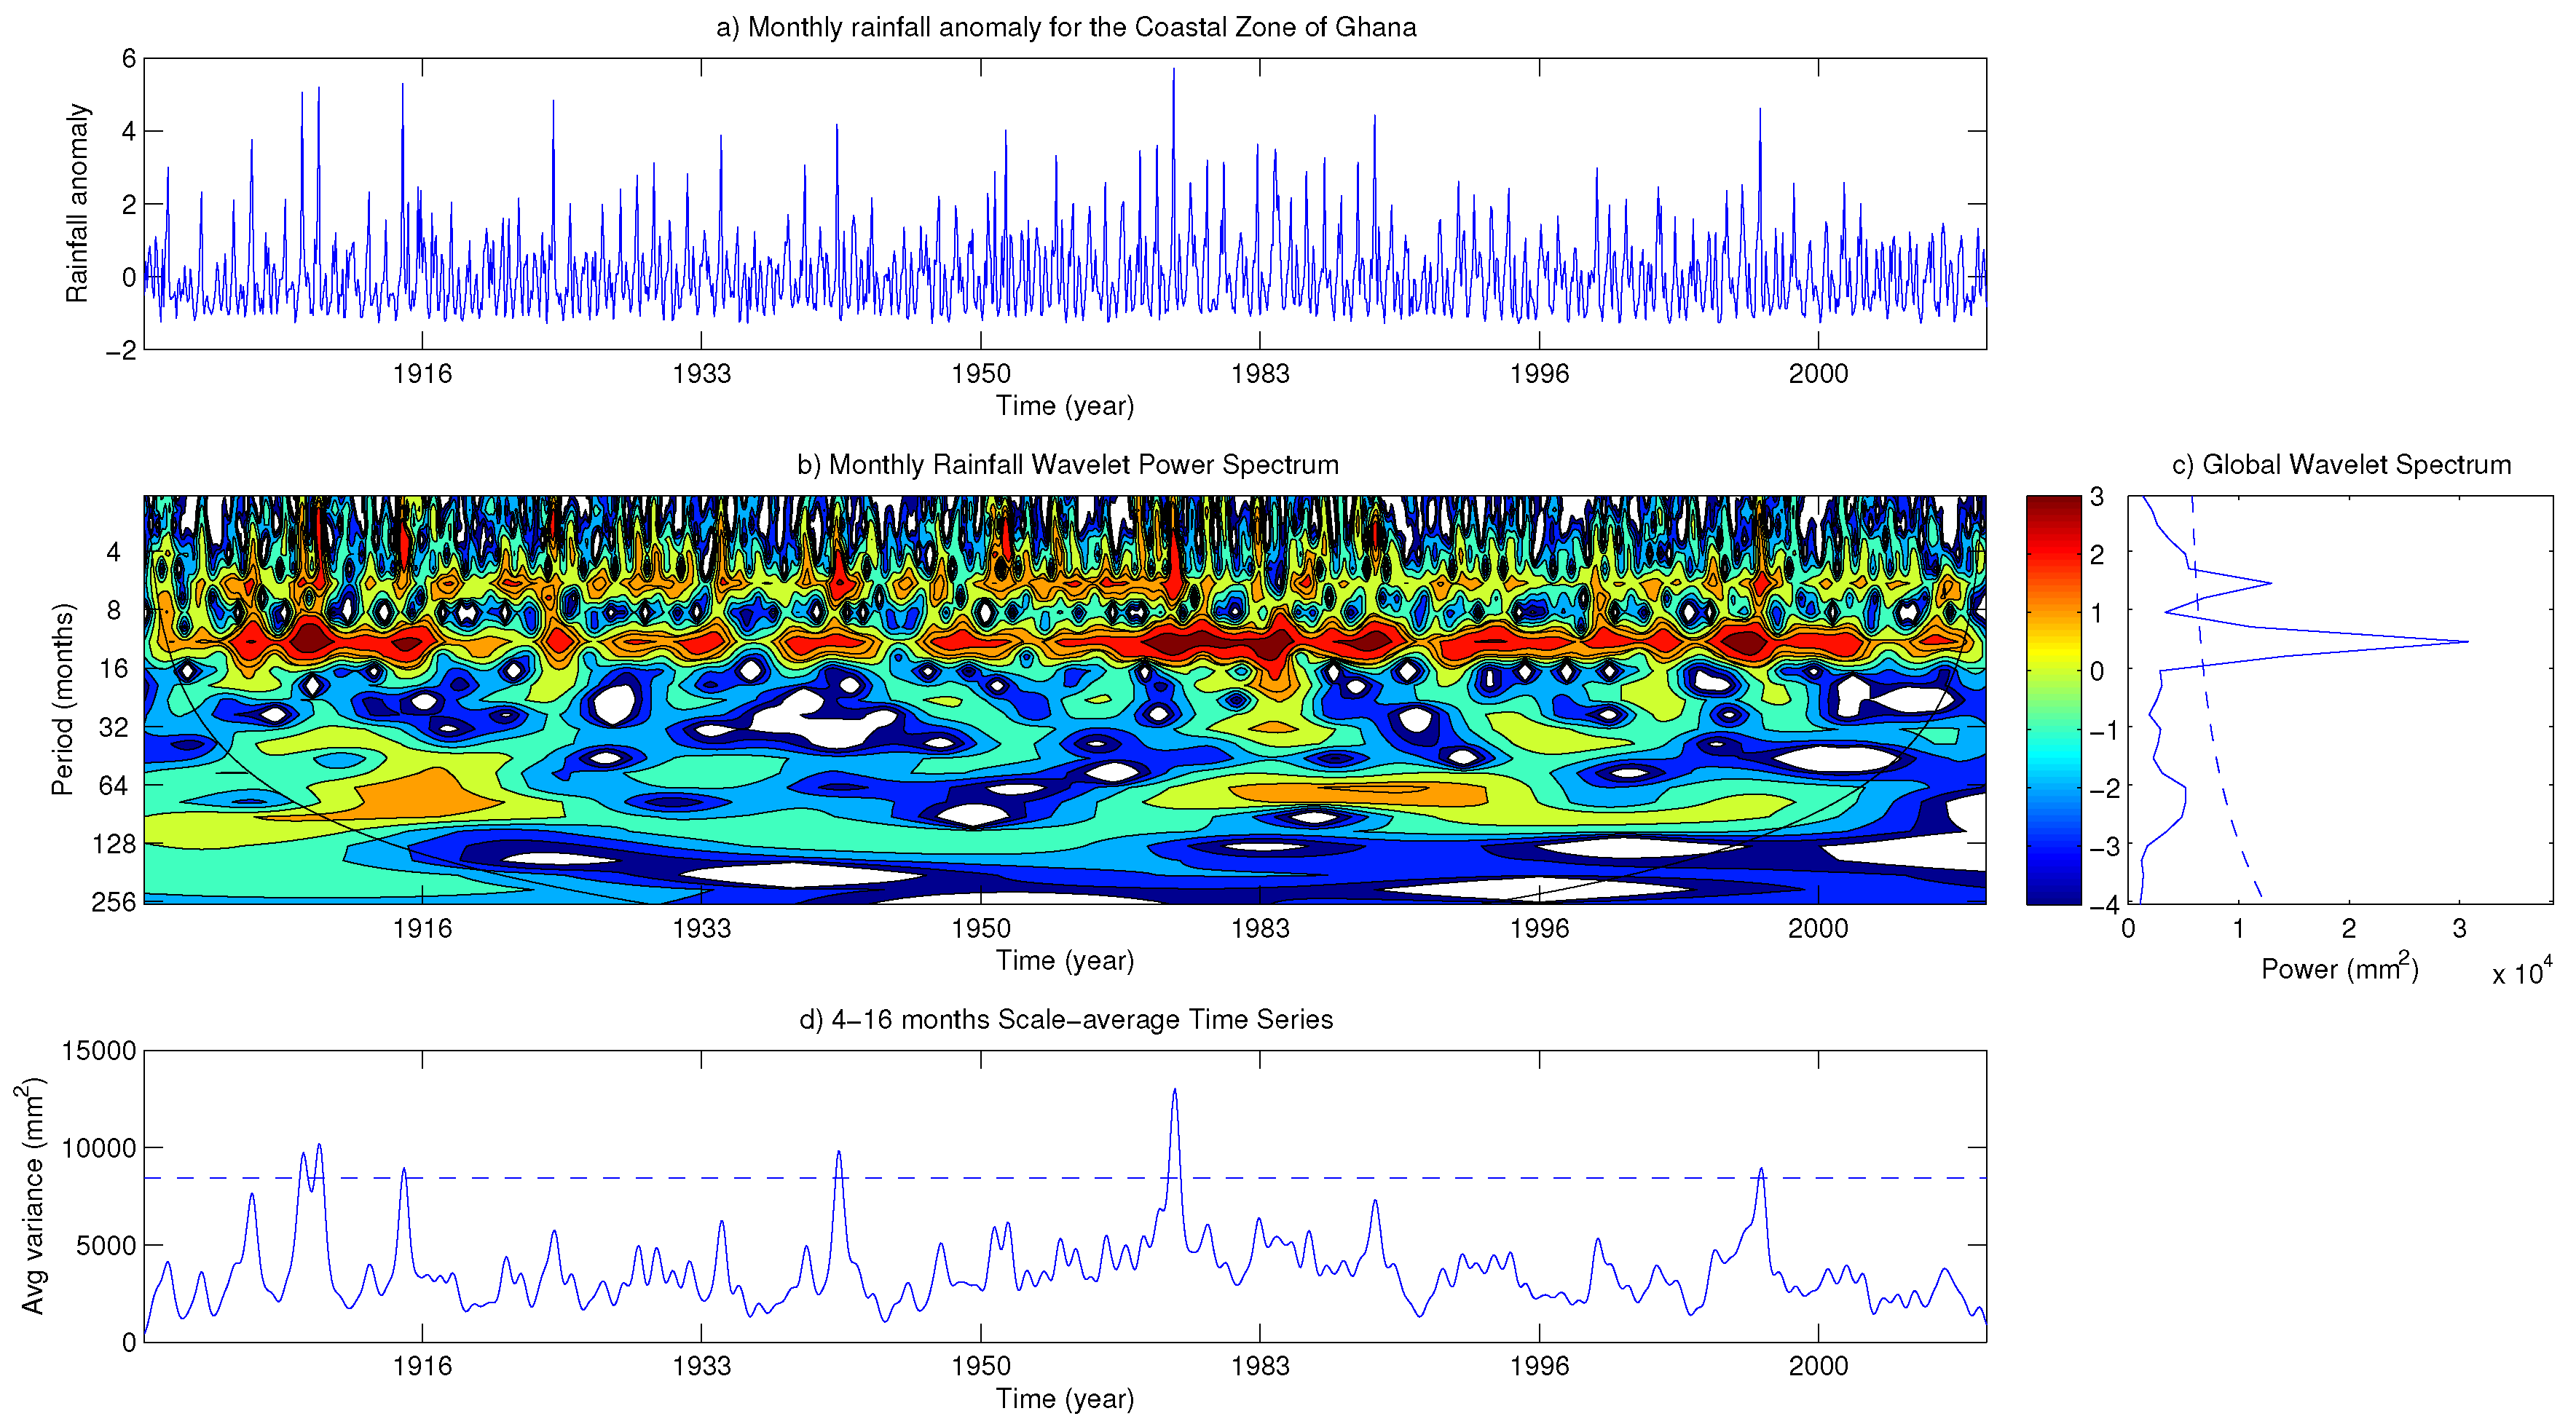
4.9.1. The Wavelet Analysis for Rainfall at the Coastal Zone of Ghana

The results of the wavelet analysis for the Coastal Zone of Ghana are presented in Figure 17. In Figure 17b wavelet power (actual oscillations of the individual wavelets at each scale and time) for the monthly rainfall anomaly at the Coastal Zone (Figure 17a) of Ghana is shown. There is a periodicity between the 4–8 month scale occurring specifically around the 6th month. Another periodicity (a more pronounced one) also occurred between the 8–16 month scale, specifically around the 12th month indicating a strong annual signal. This occurred around 1910, 1914, 1930, 1960–1969, 1970–1975, 1980, 1997–1998. These periods are also reported as wet years since it shows a substantial increase in wavelet power (also confirmed in Figure 17d). Dry years can also be identified in the periods before 1904, around 1908, 1916–1920, 1926–1928, 1936–1938, 1944–1945, 1953–1954, 1974–1976, 1992–1993, 2003–2005. No significant information was obtained for low frequency periods (32–256 months scale).
The global wavelet power spectrum Figure 17c shows the integration of the wavelet power with time. This shows two significant peaks above the 95% confidence level between the 4–8 and the 8–16 month scale assuming a white noise background spectrum. The global wavelet spectrum is therefore a simple and robust way to summarize the variability of a time series in a region.
Figure 17d shows the average variance of all scales between the 4–16 months band giving the average year variance with time. Wetter than normal periods can clearly be seen in the years 1908, 1915, 1940, 1962 and 1997.

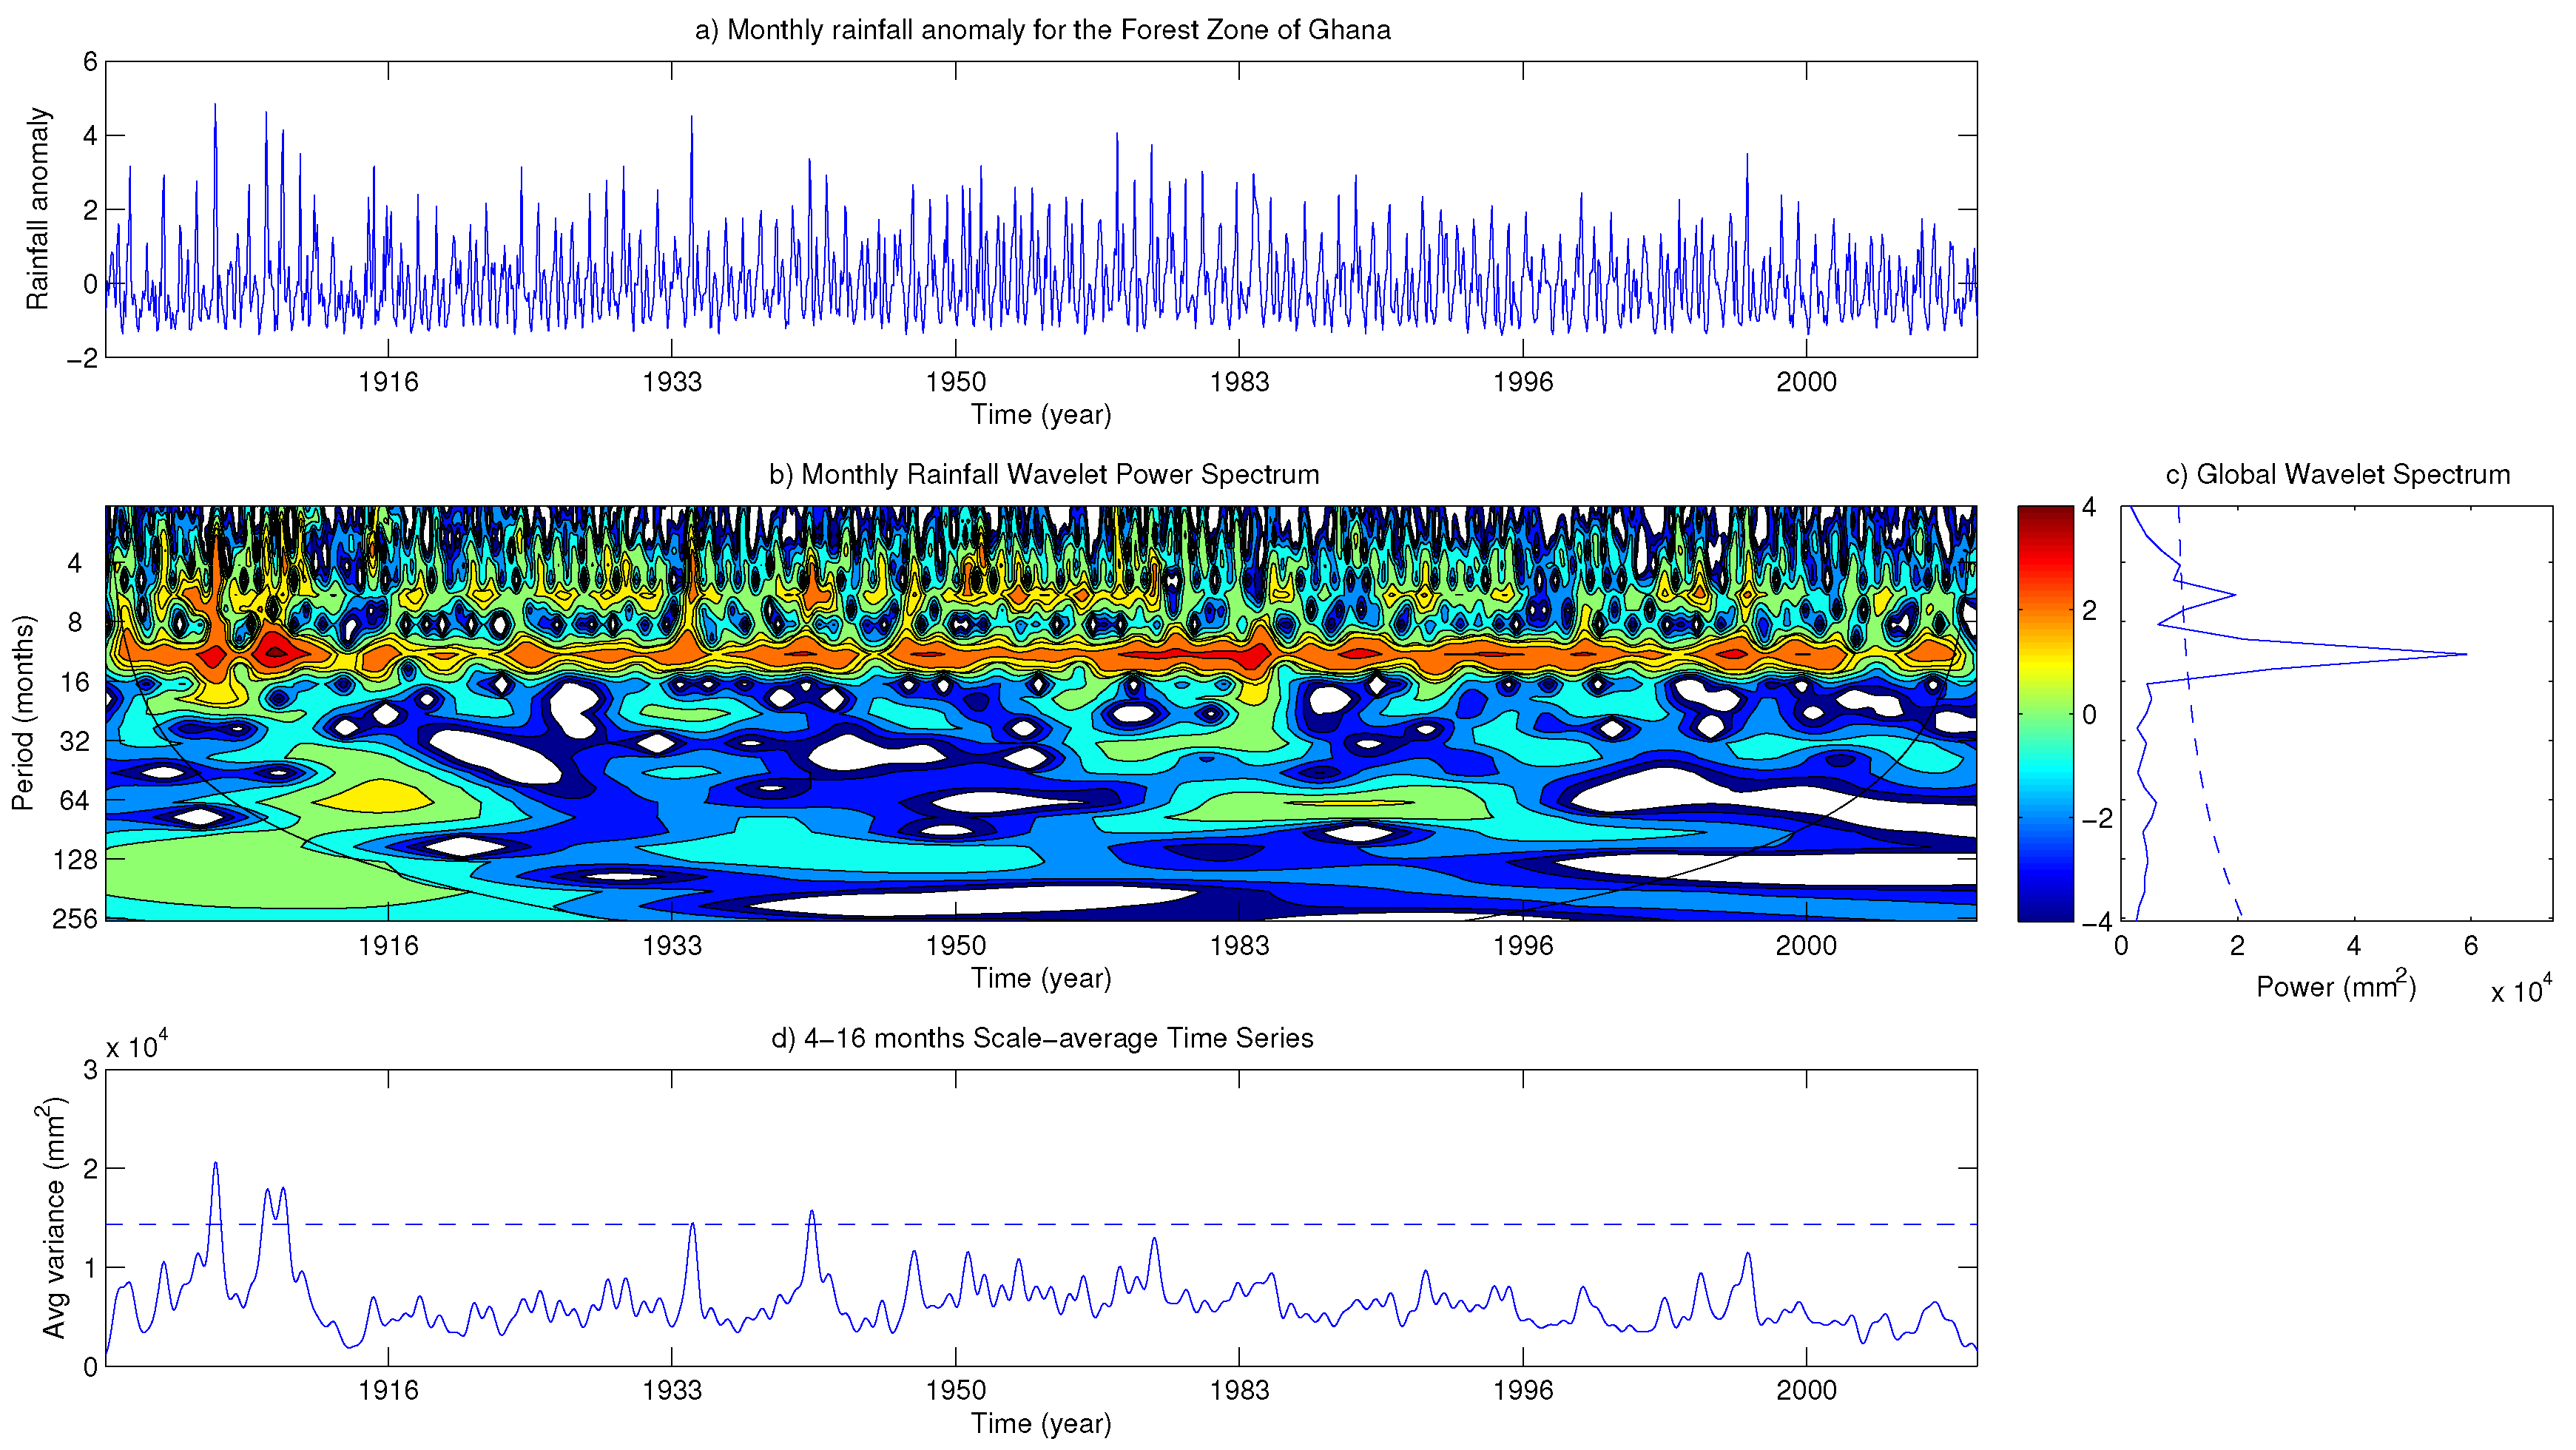
4.9.2. The Wavelet Analysis for Rainfall at the Forest Zone of Ghana

The results of the wavelet analysis for the Forest Zone of Ghana is presented in Figure 18. In Figure 18b wavelet power (actual oscillations of the individual wavelets at each scale and time) for the monthly rainfall anomaly at the Forest Zone (Figure 18a) of Ghana is shown. Similar to the Coastal Zone, there is a periodicity between the 4–8 month scale occurring specifically around the 6th month in some years throughout the time series. It is however less pronounced. A more pronounced periodicity occurs between the 8–16 month scale, just around the 12th month also indicating a strong annual signal. These periodicities can be seen around 1906, 1908–1910, 1940, 1963–1966, 1972–1974, 1980, 1993 and 2000. These periods are also reported as wet years since it shows a substantial increase in wavelet power (also confirmed in Figure 18d). Dry years can also be identified around 1912, 1916–1920, 1926, 1934, 1942–1945, 1968, 1994–1995, 2003–2005. No significant information was obtained for low frequency periods (32–256 months scale).
The global wavelet power spectrum Figure 18c shows the integration of the wavelet power with time. This also shows two significant peaks above the 95% confidence level between the 4–8 and the 8–16 month scale assuming a white noise background spectrum.
Figure 18d shows the average variance of all scales between the 4–16 months band giving the average year variance with time. Wetter than normal periods can clearly be seen in the years 1906, 1910–1912, 1934–1935, 1941–1942.

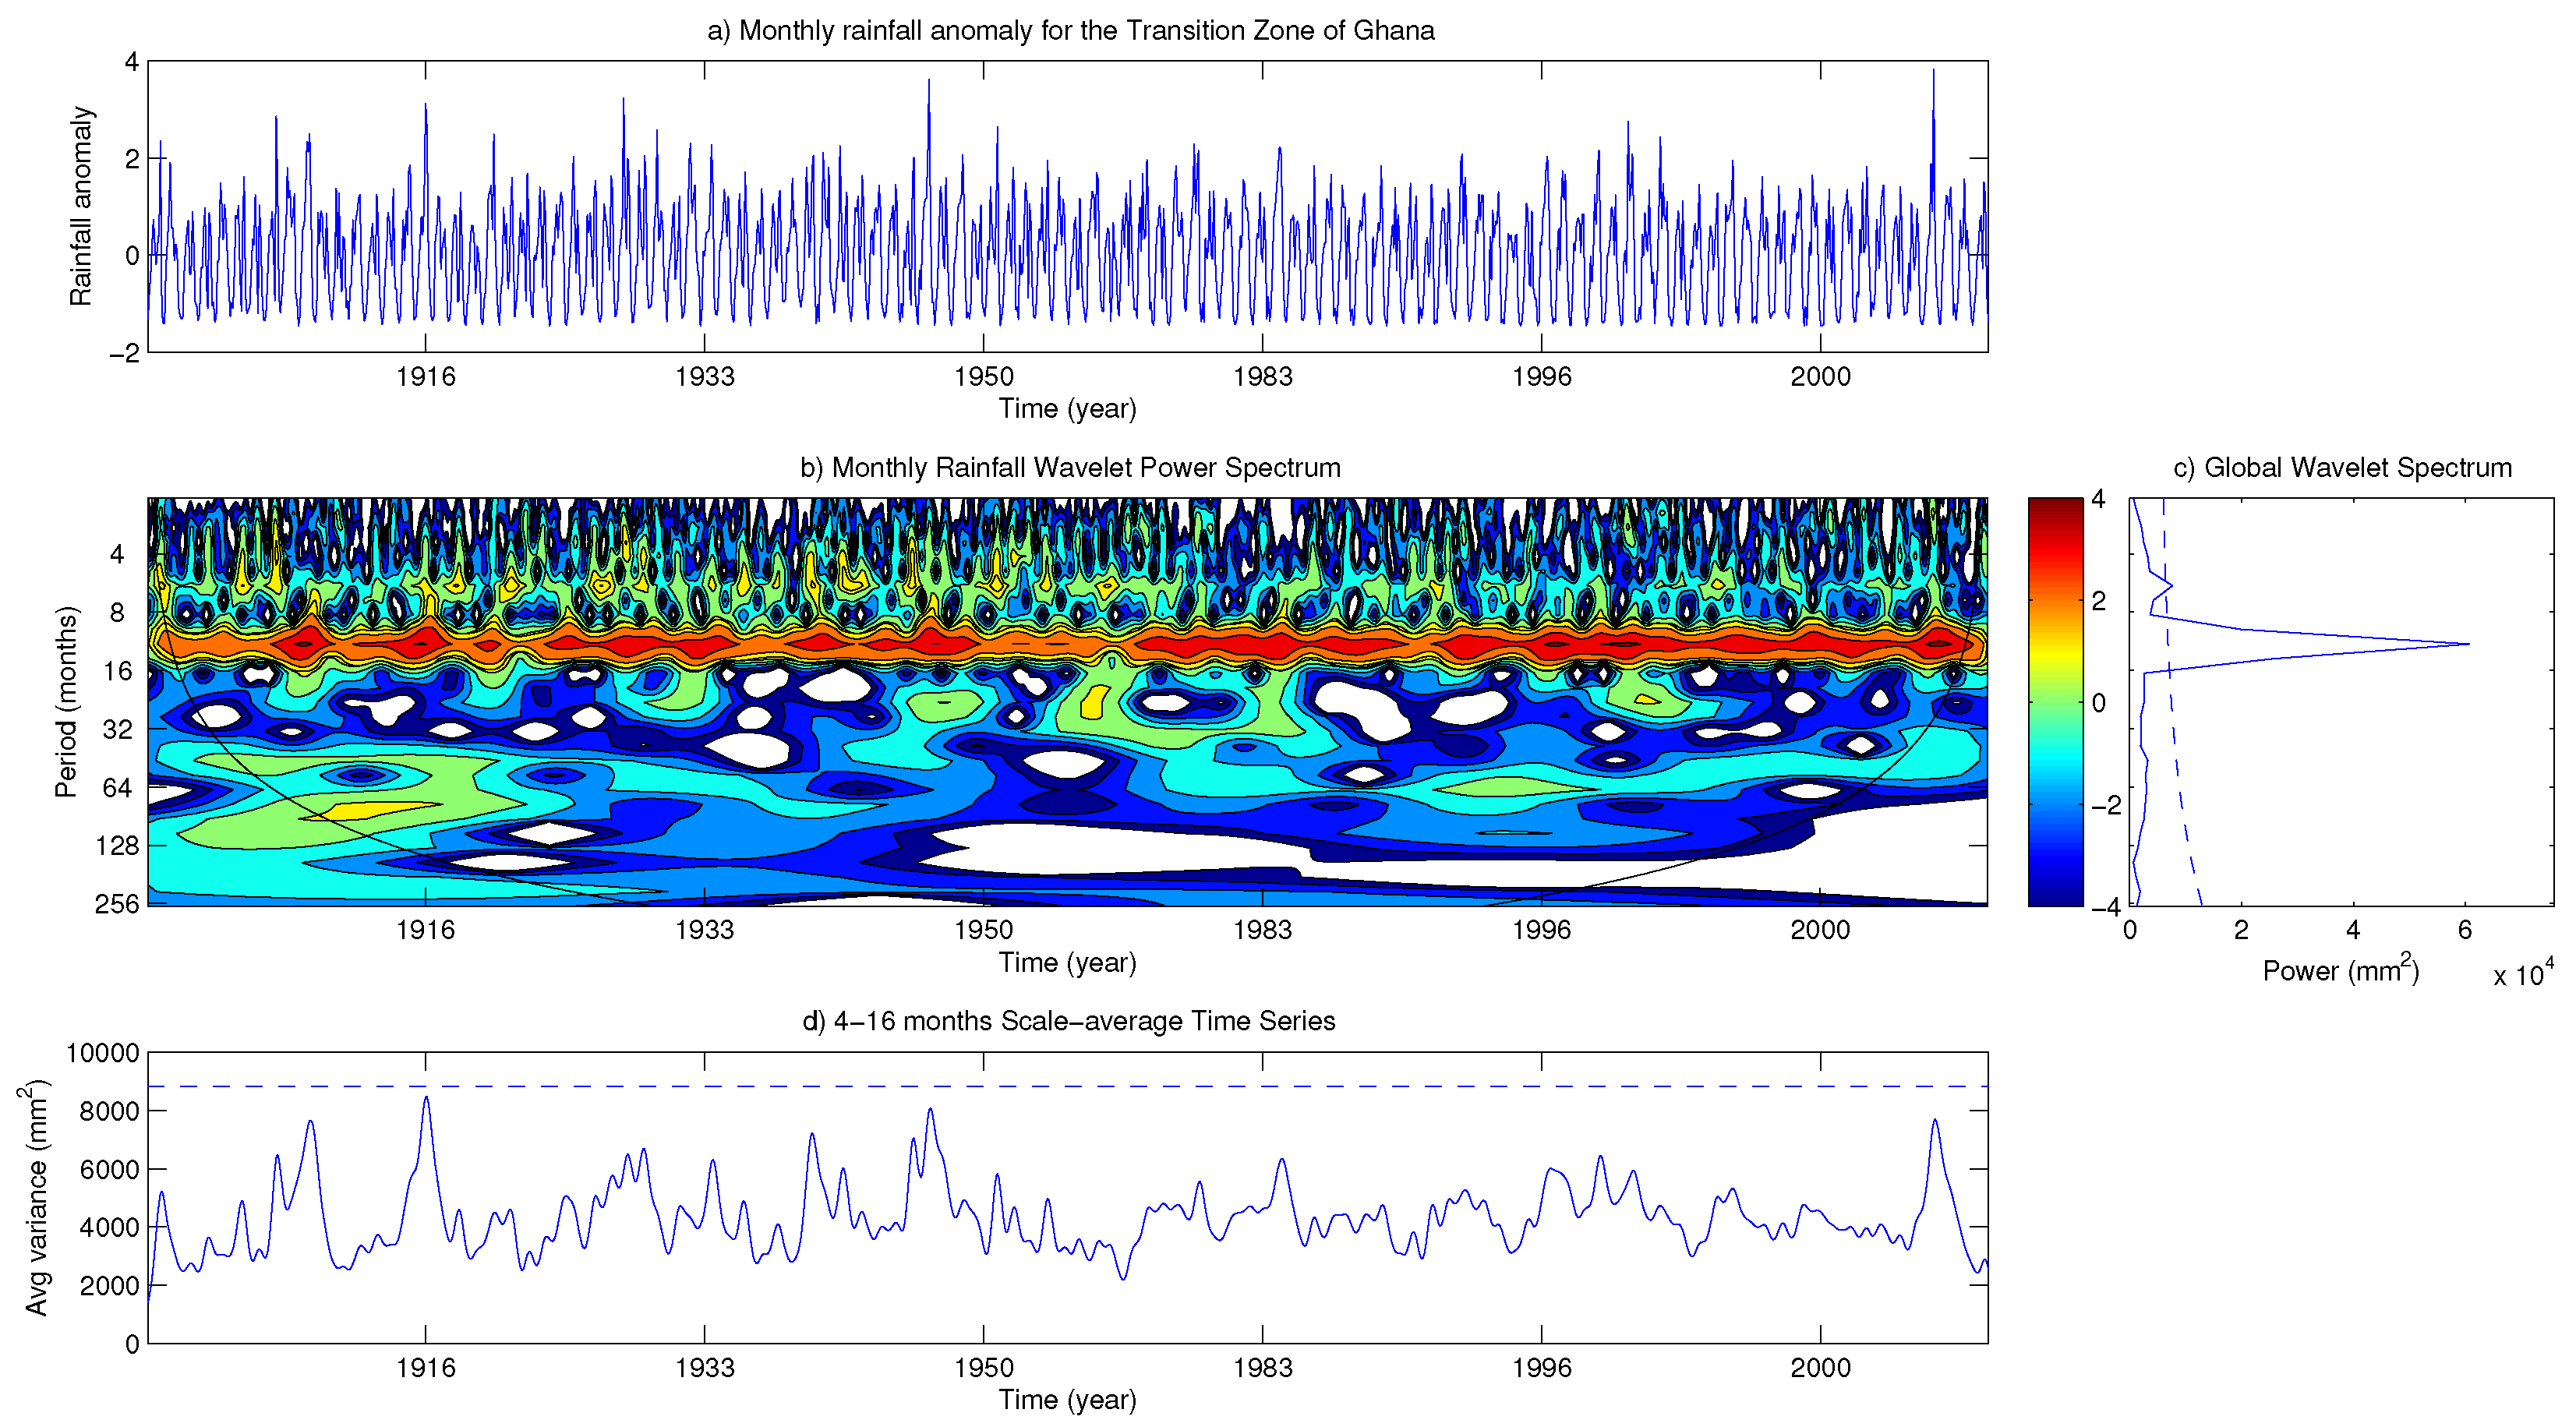
4.9.3. The Wavelet Analysis for Rainfall at the Transition Zone of Ghana

The result of the wavelet analysis for the Transition Zone of Ghana is presented in Figure 19. In Figure 19b wavelet power for the monthly rainfall anomaly at the Transition Zone (Figure 19a) of Ghana is shown. Unlike the Coastal and the Forest Zones, a very weak periodicity occurs at the 4–8 months scale occurring at some few years in the time series. The main periodicity for this zone is the annual frequency, occurring between the 8–16 month scale. These strong periodicities (wet years) appears to be more consistent within this annual scale and can be seen around 1907–1910, 1912–1917, 1920, 1922–1933, 1938–1950, 1958–1973, 1975–2009. Very few dry years are seen in this zone occurring around 1902 and 1956. No significant information was obtained for low frequency periods (32–256 months scale).
The global wavelet power spectrum Figure 19c shows the integration of the wavelet power with time. Two significant peaks are seen above the 95% confidence level between the 4–8 and the 8–16 month scale assuming a white noise background spectrum. However as can be confirmed from the the Wavelet power spectrum, the periodicity between the 4–8 months scale just touches the significant line.
Figure 19d shows the average variance of all scales between the 4–16 months band giving the average year variance with time. The scale-average wavelet time series for the Transition Zone shows no wetter than normal year at the 95% confidence level except for 1916 which indicates an almost significant wet year.

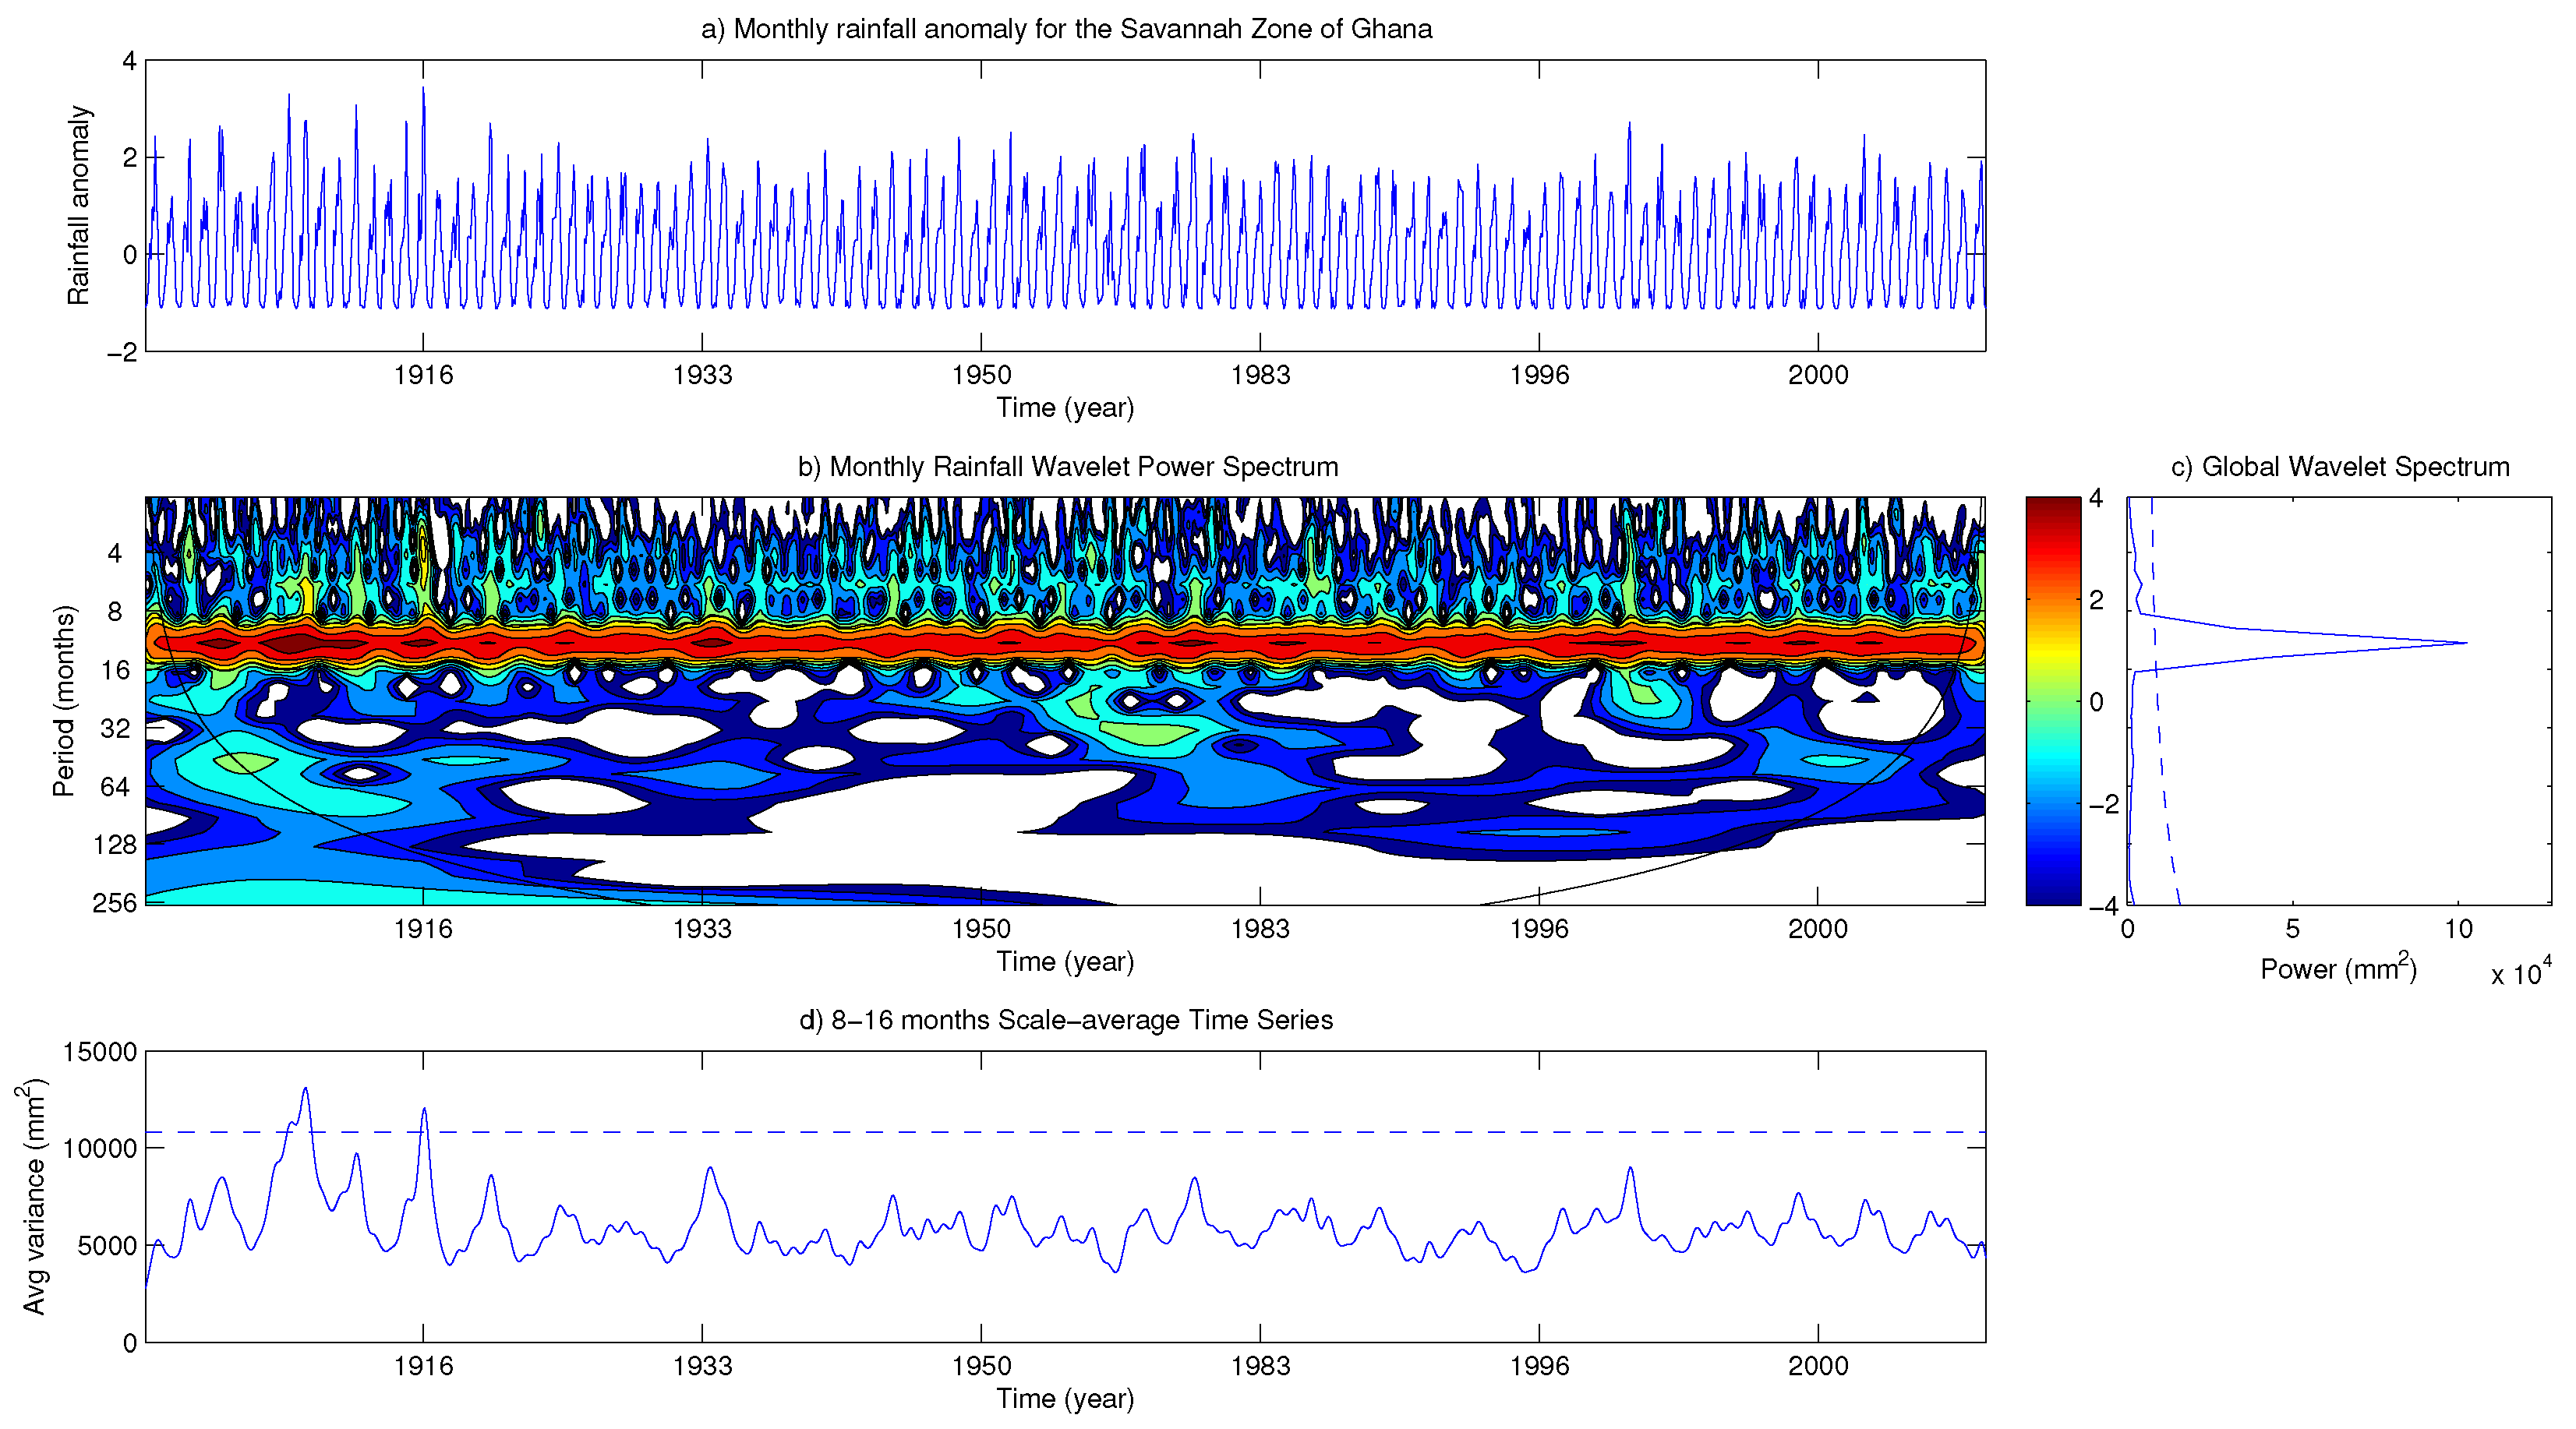
4.9.4. The Wavelet Analysis for Rainfall at the Savannah Zone of Ghana

The result of the wavelet analysis for the Savannah Zone of Ghana is presented in Figure 20. In Figure 20b wavelet power for the monthly rainfall anomaly at the Savannah Zone (Figure 20a) of Ghana is shown. A very strong annual signal is seen between the 8–16 month band. This occurs consistently throughout the entire time series with periods of very wet years occurring around 1904–1905, 1907–1910, 1916, 1933, 1960, 1984–1986. No dry periods are identified within the Savannah Zone. Like all the previous agro-ecological zones no significant information was obtained for low frequency periods (32–256 months scale).
The global wavelet power spectrum Figure 20c shows the integration of the wavelet power with time. Unlike the other agro-ecological zones, only one main significant peak is identified in this zone above the 95% confidence level assuming a white noise background spectrum. And it occurs around the 8–16 month band. Indicating that the variability of rainfall frequency at the Savannah Zone is mainly on the annual scale.
Figure 20d shows the average variance of all scales between the 4–16 months band giving the average year variance with time. Wetter than normal periods identified at the 95% confidence level can clearly be seen at 1908–1909 and 1916.

4.9.5. Summary of the Results of the Wavelet Analysis

Rainfall variability over the all agro-ecological zones of Ghana indicates a strong annual (periodicity of 12 months) signal. However in the Coastal and Forest Zones, this strong annual frequency is accompanied by a 4–8 months signal. This can be supported by the bimodal nature of the rainfall pattern in these zones as mentioned by Amekudzi et al. [8], Nicholson and Grist [24], Aryee [30], Mensah [51] as well as the results of the analysis of the seasonal variability in Figure 10. These show that, rainfall frequencies recorded around MAM will be followed by another one within 4–8 months (SON).
The annual rainfall frequency identified in all the agro-ecological zones is almost constant throughout the entire time period for the Savannah Zone, followed by the Transition Zone. The Forest and Coastal Zones however show distinct wet and dry periods within the time series especially the Coastal Zone.
A continuous wet period is seen throughout the entire time series for the Savannah Zone within the annual scale with virtually no dry period, this is followed by the Transition Zone. The Forest and Coastal Zones however show significant dry periods within the annual scale with the Forest Zone showing more consistent dry periods. It should however be noted that, the dry periods in each zone as identified in the wavelet plots are relative and corresponds to rainfall values less than the mean values of 93.0167, 131.8282, 108.0629 and 92.0133 mm for Coastal, Forest, Transition and Savannah Zones respectively.

5. Conclusions

The annual, seasonal and decadal rainfall variability over Ghana has been studied and their periodicities analysed using wavelet analysis. A rainfall time series from 1901-2010 from GPCC has been used in this analysis.
A good agreement has been found between GMet gridded data and GPCC data with Pearson correlation coefficients of 0.9–1, very low RMD values of 0.00–0.04, and low RRMSE values of <0.5 obtained in most grids over the country. GPCC data was found to be reliable for a longer time scale (decadal) studies of rainfall variability over West Africa.
It was also observed that, high cumulative rainfall amounts ranging from 900 to 1900 mm are recorded over the entire nation per year with very high rainfall amounts between 1500 to 1900 mm recorded at the south-western part of the country and low rainfall amounts (900–1200 mm) recorded in the Savannah Zone and east coast of the country.
In general a decreasing trend was observed for the annual rainfall over all the agro-ecological zones except for the Coastal Zone where a slight increasing trend of 0.1600 mm per year was seen. This decreasing trends will have serious consequences on agricultural production and food security. The results of the seasonal trend analysis also reveals a significant decreasing trend at 99% confidence level in all the agro-ecological zones except for the Savannah Zone during the DJF season indicating an intensification of the Harmattan. The Coastal Zone records lowest mean rainfall values for all the seasons with the highest of about 150 mm recorded in MAM. The Forest Zone on the other hand records very high rainfall values for all the seasons with the highest of about 200 mm recorded in JJA followed by about 170 mm in MAM. The Transition Zone however records almost similar rainfall values (varying between 120 and 170 mm) for all the seasons except for DJF where a lower mean rainfall value of about 50 mm is recorded. The Savannah Zone records the lowest mean rainfall amount of about 6 mm in the DJF season whiles its highest rainfall amount of 173.99 mm is recorded in the JJA season. This value is interestingly slightly higher than that recorded in the Forest (173.52 mm) during this same season. However, the former has most of its rains from July and August while the latter has most of its rain contributed by the month of June.
On the decadal time scale, below normal rainfall values are observed between the 1901–1920 and 1980–2010 periods for all the agro-ecological zones except for the Savannah which shows above normal rainfall values within the 1901–1940 period. Likewise, above normal rainfall values is recorded between 1930–1980 for all the agro-ecological zones. These variabilities have confirmed the effects of strong El Niño and La Niña episodes on the region. Moreover, by using a longer time scale the study proposes that, the decreasing trend observed in recent years is not solely due to antropogenic factors but have a strong contribution from a natural climate variability.
The wavelet analysis has also revealed a strong annual periodicity over all the agro-ecological zones except for the Coastal and Forest Zones where the annual periodicity is accompanied by a 4–8 months signal. The results of both the 5 year moving average and the decadal anomaly indicates that rainfall amount is significantly decreasing even in the Transition Zone which is the food hub of the country. This will have negative consequences on agricultural practice, water resource management and food security.

Acknowledgments

The authors wish to acknowledge Christopher Torrence, Exelis Visual Information Solutions, National Center for Atmospheric Research, University of Colorado Boulder, Celso A. G. Santos, Universidade Federal da Paraiba, PB—Brazil as well as Nana Ama Browne Klutse, Remote Sensing, GIS and Climate Center, Ghana Space Science and Technology Institute, Accra, Ghana for their contributions and ultimately making the Wavelet Analysis software available for the study.

Author Contributions

The research was carried out by Michael Baidu under the direct supervision of Leonard K. Amekudzi with Thompson Annor as a second supervisor. Jeffery Aryee gridded the GMet station data and made it available for the validation.

Conflicts of Interest

The authors declare no conflict of interest.

References

  1. Oduro-Afriyie, K.; Adukpo, D. Spectral characteristics of the annual mean rainfall series in Ghana. West Afr. J. Appl. Ecol. 2006, 9, 15–18. [Google Scholar] [CrossRef]
  2. CIA. CIA World Factbook; Technical Report, Tech. Rep. Retrieved 2012-05-27; Central Intelligence Agency: Fairfax, VA, USA, 2011.
  3. McSweeney, C.; Lizcano, G.; New, M.; Lu, X. The UNDP Climate Change Country Profiles: Improving the accessibility of observed and projected climate information for studies of climate change in developing countries. Bull. Am. Meteorol. Soc. 2010, 91, 157–166. [Google Scholar] [CrossRef]
  4. Paeth, H.; Hense, A. SST versus climate change signals in West African rainfall: 20th-century variations and future projections. Clim. Chang. 2004, 65, 179–208. [Google Scholar] [CrossRef]
  5. Owusu, K.; Waylen, P.; Qiu, Y. Changing rainfall inputs in the Volta basin: Implications for water sharing in Ghana. GeoJournal 2008, 71, 201–210. [Google Scholar] [CrossRef]
  6. Neilsen, D.; Smith, C.; Koch, W.; Frank, G.; Hall, J.; Parchomchuk, P. Impact of Climate Change on Irrigated Agriculture in the Okanagan Valley, British Columbia; Final Report, Climate Change Action Fund Project A087; Natural Resources Canada: Ottawa, ON, Canada, 2001; p. 29. [Google Scholar]
  7. Pachauri, R.K.; Allen, M.R.; Barros, V.R.; Broome, J.; Cramer, W.; Christ, R.; Church, J.A.; Clarke, L.; Dahe, Q.; Dasgupta, P.; et al. Climate Change 2014: Synthesis Report. Contribution of Working Groups I, II and III to the Fifth assessment report of the Intergovernmental Panel on Climate Change; IPCC: Lodon, UK, 2014. [Google Scholar]
  8. Amekudzi, L.K.; Yamba, E.I.; Preko, K.; Asare, E.O.; Aryee, J.; Baidu, M.; Codjoe, S.N. Variabilities in rainfall onset, cessation and length of rainy season for the various Agro-Ecological Zones of Ghana. Climate 2015, 3, 416–434. [Google Scholar] [CrossRef]
  9. Adiku, S.; Mawunya, F.; Jones, J.; Yangyouru, M. Can ENSO help in agricultural decision-making in Ghana? In Climate Prediction and Agriculture; Springer: Berlin/Heidelberg, Germany, 2007; pp. 205–212. [Google Scholar]
  10. Yengoh, G.T.; Armah, F.A.; Onumah, E.E.; Odoi, J.O. Trends in agriculturally-relevant rainfall characteristics for small-scale agriculture in Northern Ghana. J. Agric. Sci. 2010, 2, 3. [Google Scholar] [CrossRef]
  11. Yamba Ilimoan, E. Investigation of Seasonal and Annual Variability in Rainfall Pattern over the Transition and Northern Savanna Belts of Ghana. Ph.D. Thesis, Kwame Nkrumah University of Science and Technology, Kumasi, Ghana, July 2010. [Google Scholar]
  12. Owusu, K.; Waylen, P.R. The changing rainy season climatology of mid-Ghana. Theor. Appl. Climatol. 2013, 112, 419–430. [Google Scholar] [CrossRef]
  13. Friesen, J.; Stomph, T.; de Ridder, N.; Steenhuis, T.; van de Giesen, N.; Reudenbach, C.; Bendix, J.; Winiger, M.; Berger, T.; Park, S.; et al. Spatio-temporal patterns of rainfall in Northern Ghana. Earth 2002, 27, 8. [Google Scholar]
  14. Manzanas, R.; Amekudzi, L.; Preko, K.; Herrera, S.; Gutiérrez, J.M. Precipitation variability and trends in Ghana: An intercomparison of observational and reanalysis products. Clim. Chang. 2014, 124, 805–819. [Google Scholar] [CrossRef]
  15. Lacombe, G.; McCartney, M.; Forkuor, G. Drying climate in Ghana over the period 1960–2005: Evidence from the resampling-based Mann-Kendall test at local and regional levels. Hydrol. Sci. J. 2012, 57, 1594–1609. [Google Scholar] [CrossRef]
  16. Owusu, K.; Klutse, N.A.B. Simulation of the Rainfall Regime over Ghana from CORDEX. Int. J. Geosci. 2013. [Google Scholar] [CrossRef]
  17. Norzaida, A.; Zalina, M.D.; Fadhilah, Y. Application of Fourier series in managing the seasonality of convection and monsoon rainfall. Hydrol. Sci. J. 2015, 61, 1967–1980. [Google Scholar]
  18. Feng, X.; Porporato, A.; Rodriguez-Iturbe, I. Changes in rainfall seasonality in the tropics. Nat. Clim. Chang. 2013, 3, 811–815. [Google Scholar] [CrossRef]
  19. Fenta, A.A. Assessing Diurnal Variability of Rainfall: A Remote Sensing Based Approach; International Institute for Geo-Information Science and Earth Observation/Integrated Watershed Modelling and Management-Surface: Enschede, The Netherlands, 2010. [Google Scholar]
  20. Wong, C.; Venneker, R.; Uhlenbrook, S.; Jamil, A.; Zhou, Y. Variability of rainfall in Peninsular Malaysia. Hydrol. Earth Syst. Sci. Discuss. 2009, 6, 5471–5503. [Google Scholar] [CrossRef]
  21. Huang, N.E.; Shen, Z.; Long, S.R.; Wu, M.C.; Shih, H.H.; Zheng, Q.; Yen, N.C.; Tung, C.C.; Liu, H.H. The empirical mode decomposition and the Hilbert Spectrum for nonlinear and non-stationary time series analysis. In Proceedings of the Royal Society of London A: Mathematical, Physical and Engineering Sciences; The Royal Society: Lodon, UK, 1998. [Google Scholar]
  22. Sylla, M.; Giorgi, F.; Ruti, P.; Calmanti, S.; Dell’Aquila, A. The impact of deep convection on the West African summer monsoon climate: A regional climate model sensitivity study. Q. J. R. Meteorol. Soc. 2011, 137, 1417–1430. [Google Scholar] [CrossRef]
  23. Mounier, F.; Janicot, S.; Kiladis, G.N. The West African monsoon dynamics. Part III: The quasi-biweekly zonal dipole. J. Clim. 2008, 21, 1911–1928. [Google Scholar] [CrossRef]
  24. Nicholson, S.E.; Grist, J. A conceptual model for understanding rainfall variability in the West African Sahel on interannual and interdecadal timescales. Int. J. Climatol. 2001, 21, 1733–1757. [Google Scholar] [CrossRef]
  25. Wallace, J.M.; Hobbs, P.V. Atmospheric Science: An Introductory Survey; Academic Press: Cambridge, MA, USA, 2006. [Google Scholar]
  26. Salby, M.L. Fundamentals of Atmospheric Physics; Academic Press: Cambridge, MA, USA, 1996. [Google Scholar]
  27. Nkrumah, F.; Klutse, N.A.B.; Adukpo, D.C.; Owusu, K.; Quagraine, K.A.; Owusu, A.; Gutowski, W., Jr. Rainfall Variability over Ghana: Model versus Rain Gauge Observation. Int. J. Geosci. 2014, 5, 673. [Google Scholar] [CrossRef]
  28. Houze, R.A. Orographic effects on precipitating clouds. Rev. Geophys. 2012, 50, RG1001. [Google Scholar] [CrossRef]
  29. Hall, N.M.; Peyrillé, P. Dynamics of the West African Monsoon; EDP Sciences: Paris, France, 2006. [Google Scholar]
  30. Aryee, J. Development of High Spatial Resolution Rainfall Climatology for Ghana. Ph.D. Thesis, Kwame Nkrumah University of Science and Technology, Kumasi, Ghana, 2015. [Google Scholar]
  31. Schneider, T. Analysis of incomplete climate data: Estimation of mean values and covariance matrices and imputation of missing values. J. Clim. 2001, 14, 853–871. [Google Scholar] [CrossRef]
  32. Amekudzi, L.; Bracher, A.; Bramstedt, K.; Rozanov, A.; Bovensmann, H.; Burrows, J. Towards validation of SCIAMACHY lunar occultation NO2 vertical profiles. Adv. Space Res. 2008, 41, 1921–1932. [Google Scholar] [CrossRef]
  33. Quansah, E.; Amekudzi, L.K.; Preko, K.; Aryee, J.; Boakye, O.R.; Boli, D.; Salifu, M.R. Empirical models for estimating global solar radiation over the Ashanti Region of Ghana. J. Sol. Energy 2014, 2014. [Google Scholar] [CrossRef]
  34. Grinsted, A.; Moore, J.C.; Jevrejeva, S. Application of the cross wavelet transform and wavelet coherence to geophysical time series. Nonlinear Process. Geophys. 2004, 11, 561–566. [Google Scholar] [CrossRef]
  35. Santos, C.A.; Galvão, C.D.O.; Suzuki, K.; Trigo, R.M. Matsuyama city rainfall data analysis using wavelet transform. Annu. J. Hydraul. Eng. JSCE 2001, 45, 211–216. [Google Scholar] [CrossRef]
  36. Mwale, D.; Yew Gan, T.; Shen, S.S. A new analysis of variability and predictability of seasonal rainfall of central southern Africa for 1950–94. Int. J. Climatol. 2004, 24, 1509–1530. [Google Scholar] [CrossRef]
  37. Torrence, C.; Compo, G.P. A practical guide to wavelet analysis. Bull. Am. Meteorol. Soc. 1998, 79, 61–78. [Google Scholar] [CrossRef]
  38. Zhang, Z.; Moore, J. New significance test methods for Fourier analysis of geophysical time series. Nonlinear Process. Geophys. 2011, 18, 643–652. [Google Scholar] [CrossRef]
  39. Logah, F.; Obuobie, E.; Ofori, D.; Kankam-Yeboah, K. Analysis of rainfall variability in Ghana. Int. J. Latest Res. Eng. Comput. 2013, 1, 1–8. [Google Scholar]
  40. Sultan, B.; Janicot, S. The West African monsoon dynamics. Part II: The “preonset” and “onset” of the summer monsoon. J. Clim. 2003, 16, 3407–3427. [Google Scholar] [CrossRef]
  41. Anang, J. My Second Book of Maps: An Atlas of Ghana and the Rest of Africa; Macmillan Cop.: London, UK, 1977. [Google Scholar]
  42. Acheampong, P.K. Rainfall anomaly along the coast of Ghana. Its nature and causes. Geogr. Ann. Ser. A Phys. Geogr. 1982, 64, 199–211. [Google Scholar] [CrossRef]
  43. Wilks, D. Empirical distributions and exploratory data analysis. Stat. Methods Atmos. Sci. 1995, 59, 21–63. [Google Scholar]
  44. Sultan, B.; Janicot, S. Abrupt shift of the ITCZ over West Africa and intra-seasonal variability. Geophys. Res. Lett. 2000, 27, 3353–3356. [Google Scholar] [CrossRef]
  45. Lee, T.; McPhaden, M.J. Increasing intensity of El Niño in the central-equatorial Pacific. Geophys. Res. Lett. 2010, 37. [Google Scholar] [CrossRef]
  46. Mawunya, F.; Adiku, S.; Laryea, K.; Yangyuoru, M.; Atika, E. Characterisation of seasonal rainfall for cropping schedules. West Afr. J. Appl. Ecol. 2011, 19, 108–118. [Google Scholar]
  47. Adiku, S.; Stone, R. Using the Southern Oscillation Index for improving rainfall prediction and agricultural water management in Ghana. Agric. Water Manag. 1995, 29, 85–100. [Google Scholar] [CrossRef]
  48. Yorke, C.; Omotosho, J. Rainfall variability in Ghana during 1961–2005. J. Ghana Sci. Assoc. 2010, 12. [Google Scholar] [CrossRef]
  49. Walker, H. The Monsoon in West Africa; Ghana Meteorological Department: Accra, Ghana, 1958.
  50. Prospero, J.M.; Carlson, T.N. Saharan air outbreaks over the tropical North Atlantic. In Weather and Weather Maps; Springer: Basel, Switzerland, 1981; pp. 677–691. [Google Scholar]
  51. Mensah, C. Investigation of the Onset, Cessation and Length of the Rainy Season over Ghana. Ph.D. Thesis, Kwame Nkrumah University of Science and Technology, Kumasi, Ghana, 2015. [Google Scholar]
  52. Lamb, P.J. Large-scale Tropical Atlantic surface circulation patterns associated with Subsaharan weather anomalies. Tellus 1978, 30, 240–251. [Google Scholar] [CrossRef]
  53. Leroux, M. The Meteorology and Climate of Tropical Africa; Springer Science & Business Media: Berlin, Germany, 2001. [Google Scholar]
  54. Hulme, M. A 1951–80 global land precipitation climatology for the evaluation of general circulation models. Clim. Dyn. 1992, 7, 57–72. [Google Scholar] [CrossRef]
  55. Nicholson, S.E. An overview of African rainfall fluctuations of the last decade. J. Clim. 1993, 6, 1463–1466. [Google Scholar] [CrossRef]
  56. Nicholson, S.E. An analysis of the ENSO signal in the tropical Atlantic and western Indian Oceans. Int. J. Climatol. 1997, 17, 345–375. [Google Scholar] [CrossRef]
  57. Le Barbé, L.; Lebel, T.; Tapsoba, D. Rainfall variability in West Africa during the years 1950–90. J. Clim. 2002, 15, 187–202. [Google Scholar] [CrossRef]
  58. Jalloh, A.; Sarr, B.; Kuiseu, J.; Roy-Macauley, H.; Sereme, P. Review of Climate in West and Central Africa to Inform Farming Systems Research and Development in the Sub-Humid and Semi-Arid Agroecologies of the Region; Conseil Ouest et Centre Africain pour la Recherche et le Development Agricoles/West and Central African Council for Agricultural Research and Development (CORAF/WECARD), CORAF/WECARD: Dakar, Senegal, 2011.
  59. Rowell, D.P. The impact of Mediterranean SSTs on the Sahelian rainfall season. J. Clim. 2003, 16, 849–862. [Google Scholar] [CrossRef]
  60. Vizy, E.K.; Cook, K.H. Mechanisms by which Gulf of Guinea and eastern North Atlantic sea surface temperature anomalies can influence African rainfall. J. Clim. 2001, 14, 795–821. [Google Scholar] [CrossRef]
  61. Lamb, P.J.; Peppler, R.A. Further case studies of tropical Atlantic surface atmospheric and oceanic patterns associated with sub-Saharan drought. J. Clim. 1992, 5, 476–488. [Google Scholar] [CrossRef]
  62. Folland, C.; Palmer, T.; Parker, D. Sahel rainfall and worldwide sea temperatures, 1901–85. Nature 1986, 320, 602–607. [Google Scholar] [CrossRef]
  63. Odjugo, P.A.a.O. Quantifying the cost of climate change impact in Nigeria: Emphasis on wind and rainstorms. J. Hum. Ecol. 2009, 28, 93–101. [Google Scholar]
  64. Opoku-Ankomah, Y.; Amisigo, B. Rainfall and runoff variability in the Southwestern River system of Ghana. In Proceedings of the Variabilité Des Ressources en Eau en Afrique Au XXème Siècle, Abidjan, Nigeria, 16–19 November 1998; pp. 307–314. [Google Scholar]
  65. Allen, J.C.; Barnes, D.F. The causes of deforestation in developing countries. Ann. Assoc. Am. Geogr. 1985, 75, 163–184. [Google Scholar] [CrossRef]
Figure 1. The map showing location of Ghana, its ecological zones, and the GMet rainfall measurement locations across the country.
Climate 05 00030 g001
Figure 2. The Morlet wavelet function.
Climate 05 00030 g002
Figure 3. Comparison of GPCC and GMet data from 1980-2010. In (a), the Multi-year mean of monthly rainfall totals (mm) over Ghana from GPCC data; (b) shows the Multi-year mean of monthly rainfall totals (mm) over Ghana from GMet data.
Climate 05 00030 g003
Figure 4. Pearson’s correlation coefficient (r) between GPCC and GMet data from 1980–2010.
Climate 05 00030 g004
Figure 5. Relative Mean Difference between GPCC and GMet data from 1980–2010.
Climate 05 00030 g005
Figure 6. Relative Root Mean Squared Error between GPCC and GMet data from 1980–2010.
Climate 05 00030 g006
Figure 7. Mean annual total rainfall (mm) over Ghana for the period 1901–2010. Location of the Volta basin indicated by the red rectangle.
Climate 05 00030 g007
Figure 8. (ad) Annual rainfall anomaly (bar) with a five year moving average (line) for the agro-ecological zones of Ghana from 1901–2010.
Climate 05 00030 g008
Figure 9. Seasonal mean rainfall (mm) over Ghana for (a) DJF; (b) MAM; (c) JJA; (d) SON during the 1901–2010 period.
Climate 05 00030 g009
Figure 10. Seasonal mean rainfall amounts over the agro-ecological zones of Ghana.
Climate 05 00030 g010
Figure 11. (ad) Decadal anomaly of rainfall over the agro-ecological zones of Ghana.
Climate 05 00030 g011
Figure 12. (ad) Long-term course of annual rainfall over the agro-ecological zones of Ghana.
Climate 05 00030 g012
Figure 13. (ad) Long-term course of seasonal rainfall over the agro-ecological zones of Ghana for DJF.
Climate 05 00030 g013
Figure 14. (ad) Long-term course of seasonal rainfall over the agro-ecological zones of Ghana for MAM.
Climate 05 00030 g014
Figure 15. (ad) Long-term course of seasonal rainfall overthe agro-ecological zones of Ghana for JJA.
Climate 05 00030 g015
Figure 16. (ad) Long-term course of seasonal rainfall over the agro-ecological zones of Ghana for SON.
Climate 05 00030 g016
Figure 17. (a) Monthly Rainfall Anomaly in the Coastal Zone for the 1901–2010 period. (b) Wavelet Power Spectrum for the Coastal Zone. Cross-hatched region is the cone of influence; (c) The global wavelet power spectrum. The dashed line is the 5% significance level for the global wavelet spectrum; and (d) Scale-average wavelet power over the 4-16 months band. The dashed line is the 95% confidence.
Climate 05 00030 g017
Figure 18. (a) Monthly Rainfall Anomaly in the Forest Zone for the 1901–2010 period. (b) Wavelet Power Spectrum for the Forest Zone. Cross-hatched region is the cone of influence. (c) The global wavelet power spectrum. The dashed line is the 5% significance level for the global wavelet spectrum; and (d) Scale-average wavelet power over the 4–16 months band. The dashed line is the 95% confidence.
Climate 05 00030 g018
Figure 19. (a) Monthly Rainfall Anomaly in the Transition Zone for the 1901–2010 period. (b) Wavelet Power Spectrum for the Transition Zone. Cross-hatched region is the cone of influence; (c) The global wavelet power spectrum. The dashed line is the 5% significance level for the global wavelet spectrum; and (d) Scale-average wavelet power over the 4–16 months band. The dashed line is the 95% confidence.
Climate 05 00030 g019
Figure 20. (a) Monthly Rainfall Anomaly in the Savannah Zone for the 1901–2010 period. (b) Wavelet Power Spectrum for the Savannah Zone. Cross-hatched region is the cone of influence. (c) The global wavelet power spectrum. The dashed line is the 5% significance level for the global wavelet spectrum; and (d) Scale-average wavelet power over the 8-16 months band. The dashed line is the 95% confidence.
Climate 05 00030 g020
Table 1. Seasonal rainfall trend rate in the four agro-ecological zones (** and * indicates significant trends at 0.01 and 0.05 significance levels respectively).
Season Rainfall Trend Rate(mm per Year)
CoastForestTransitionSavannah
DJF−0.1429 **−0.1273 **−0.1040 **−0.0102
MAM0.0692−0.0793−0.2016 **−0.1181 **
JJA0.0510−0.02420.2112 *−0.0972
SON0.0677−0.0512−0.1460 *−0.1582 **

