Field Measurements and Satellite Remote Sensing of Daily Soil Surface Temperature Variations in the Lower Colorado Desert of California


1
NASA Ames Research Center, Moffett Field, CA 94035, USA
2
Thomas Jefferson High School, Federal Way, Auburn, WA 98001, USA
*
Author to whom correspondence should be addressed.
Climate 2018, 6(4), 94; https://doi.org/10.3390/cli6040094
Submission received: 28 September 2018
/
Revised: 20 November 2018
/
Accepted: 24 November 2018
/
Published: 30 November 2018
Abstract
:The purpose of this study was to better understand the relationships between diurnal variations of air temperature measured hourly at the soil surface, compared with the thermal infra-red (TIR) emission properties of soil surfaces located in the Lower Colorado Desert of California, eastern Riverside County. Fifty air temperature loggers were deployed in January of 2017 on wooden stakes that were driven into the sandy or rocky desert soils at both Ford Dry Lake and the southern McCoy Mountains wash. The land surface temperature (LST) derived from Landsat satellite images was compared to measured air temperatures at 1 m and at the soil surface on 14 separate dates, until mid-September, 2017. Results showed that it is feasible to derive estimated temperatures at the soil surface from hourly air temperatures, recorded at 1 m above the surface (ambient). The study further correlated Landsat LST closely with site measurements of air and surface temperatures in these solar energy development zones of southern California, allowing inter-conversion with ground-based measurements for use in ecosystem change and animal population biology studies.
1. Introduction
Diurnal and seasonal variations in land surface temperature can influence numerous ecological and biogeochemical processes in desert landscapes, including wildlife population dynamics, plant germination, microbial activity, evapotranspiration, and trace gas emissions [1]. The effect of extreme hourly temperature variations on desert ecosystems range from limited photosynthesis rates and evapotranspiration fluxes, to altered microbial symbiotic relationships through nitrogen fixing bacteria in root nodules [2].
It is well documented that surface soil temperatures are a function of downwelling electromagnetic radiation and of the albedo (reflectivity) of a soil surface [3]. When energy from the sun encounters any matter, whether it is the atmosphere or the ground surface, it will go through the processes of transmission, reflection, and absorption. Reflected solar irradiance is mostly due to differing albedo levels across the Earth’s surface—from highly reflective ice and clouds, to non-reflective oceans and dark rocks. Slope, vegetative cover, water content, bulk density, and a host of other factors affect how much heat the soil absorbs or re-emits [4].
Variations in temperature at the soil surface have been shown to influence the survival and distribution of several noteworthy animal species in the deserts of southern California. Most, if not all, desert animals change their behavior based on outside temperatures. In summer, temperatures on Mojave Desert valley floors can exceed 50 °C [5], hotter than is generally tolerated by many animals. Consequently, desert animals are commonly more active at dawn and dusk, may operate entirely nocturnally, and take shelter in burrows or other cooler areas during the heat of the day [6].
Temperature regulation is important for desert tortoises (Gopherus agassizii), a federally protected species native to the Southwest United States. Tortoises have been noted to survive temperatures below freezing and above 40 °C, however, most activity occurs between 26.1 °C to 33.9 °C [7]. Temperature also affects incubation time, sex differentiation, and survival in desert tortoises [8], with higher temperatures indicating higher survival and shorter incubation periods, and sex differentiation occurring somewhere between 31 °C–32 °C. It has been shown that more frequent and prolonged droughts due to climate change can further decrease the habitable areas for tortoises, and some populations are already showing signs of density decreases due to climate change [9].
Fringe-toed lizards are also influenced strongly by air temperature. The optimal body temperature for these reptiles is around 37 °C, and most lizards will seek out burrows or other shelter when temperatures exceed 48.9 °C [6]. As climate change and human interactions further affect and reduce these animals’ habitats, identifying time periods and specific locations of potentially lethal temperatures for desert animals can be key to protecting these species.
In general, it would be advantageous for resource managers to be able to accurately infer variations of temperatures at the soil surface from hourly air temperatures recorded at 1–2 m above the surface (ambient), since such ambient air temperatures are measured commonly at weather station locations, and have been maintained over relatively long periods of time [5]. Although there have been numerous models developed to predict temperature at a few centimeters depth into the soil profile from ambient air temperatures [10,11,12,13,14,15,16], air temperatures at the soil surface and in the habitat zone within which desert animals must survive or traverse have not be measured frequently in combination with ambient air temperatures across the desert landscape.
Moreover, it would be valuable to develop correlations between the measured temperatures at the soil surface (or at weather stations) to satellite remote sensing, which can provide surface emission temperatures in otherwise inaccessible remote locations. Areas that have few (or no) weather stations can often be difficult to monitor. Satellites offer an affordable method to monitor regular temperature fluctuations across regions, at the relatively high spatial resolution of 100 m. Nonetheless, it is not well documented where and when the land surface temperature (LST) derived from a satellite image diverges from measured surface or ambient air temperatures.
Previous research by Li et al. [17] showed a correlation between air temperature and LST from the Advanced Very High Resolution Radiometer (AVHRR) instrument on the National Oceanic and Atmospheric Administration (NOAA) polar-orbiting satellites, with correlation coefficient (R2) values of 0.54, 0.42, and 0.62 over three years. Despite large differences in air temperature and LST values, it was shown that a linear model can be developed to enhance accuracy. Kawashima et al. [18] found strong correlations, with R2 values from 0.75 to 0.85 between air temperatures measured by the Automated Meteorological Data Acquisition System (AMeDAS) and LST measured by the Landsat Thematic Mapper on winter nights in Japan. Xiong and Chen [19], however, found no statistically significant correlations between surface air temperature from weather stations and Landsat TIR (thermal infra-red) bands in the fall and spring in China.
The objective of this study was to quantify the relationship between air temperatures measured at the soil surface, ambient air temperatures measured at 1 m height, and Landsat surface temperature measurements over the same area and period of time in the Lower Colorado Desert of eastern Riverside County, California. We report on new regression results and their levels of certainty to scale from satellite images, down to the typical size of a field plot for animal and plant research for surface temperature monitoring on hourly-to-daily time intervals.
2. Study Area
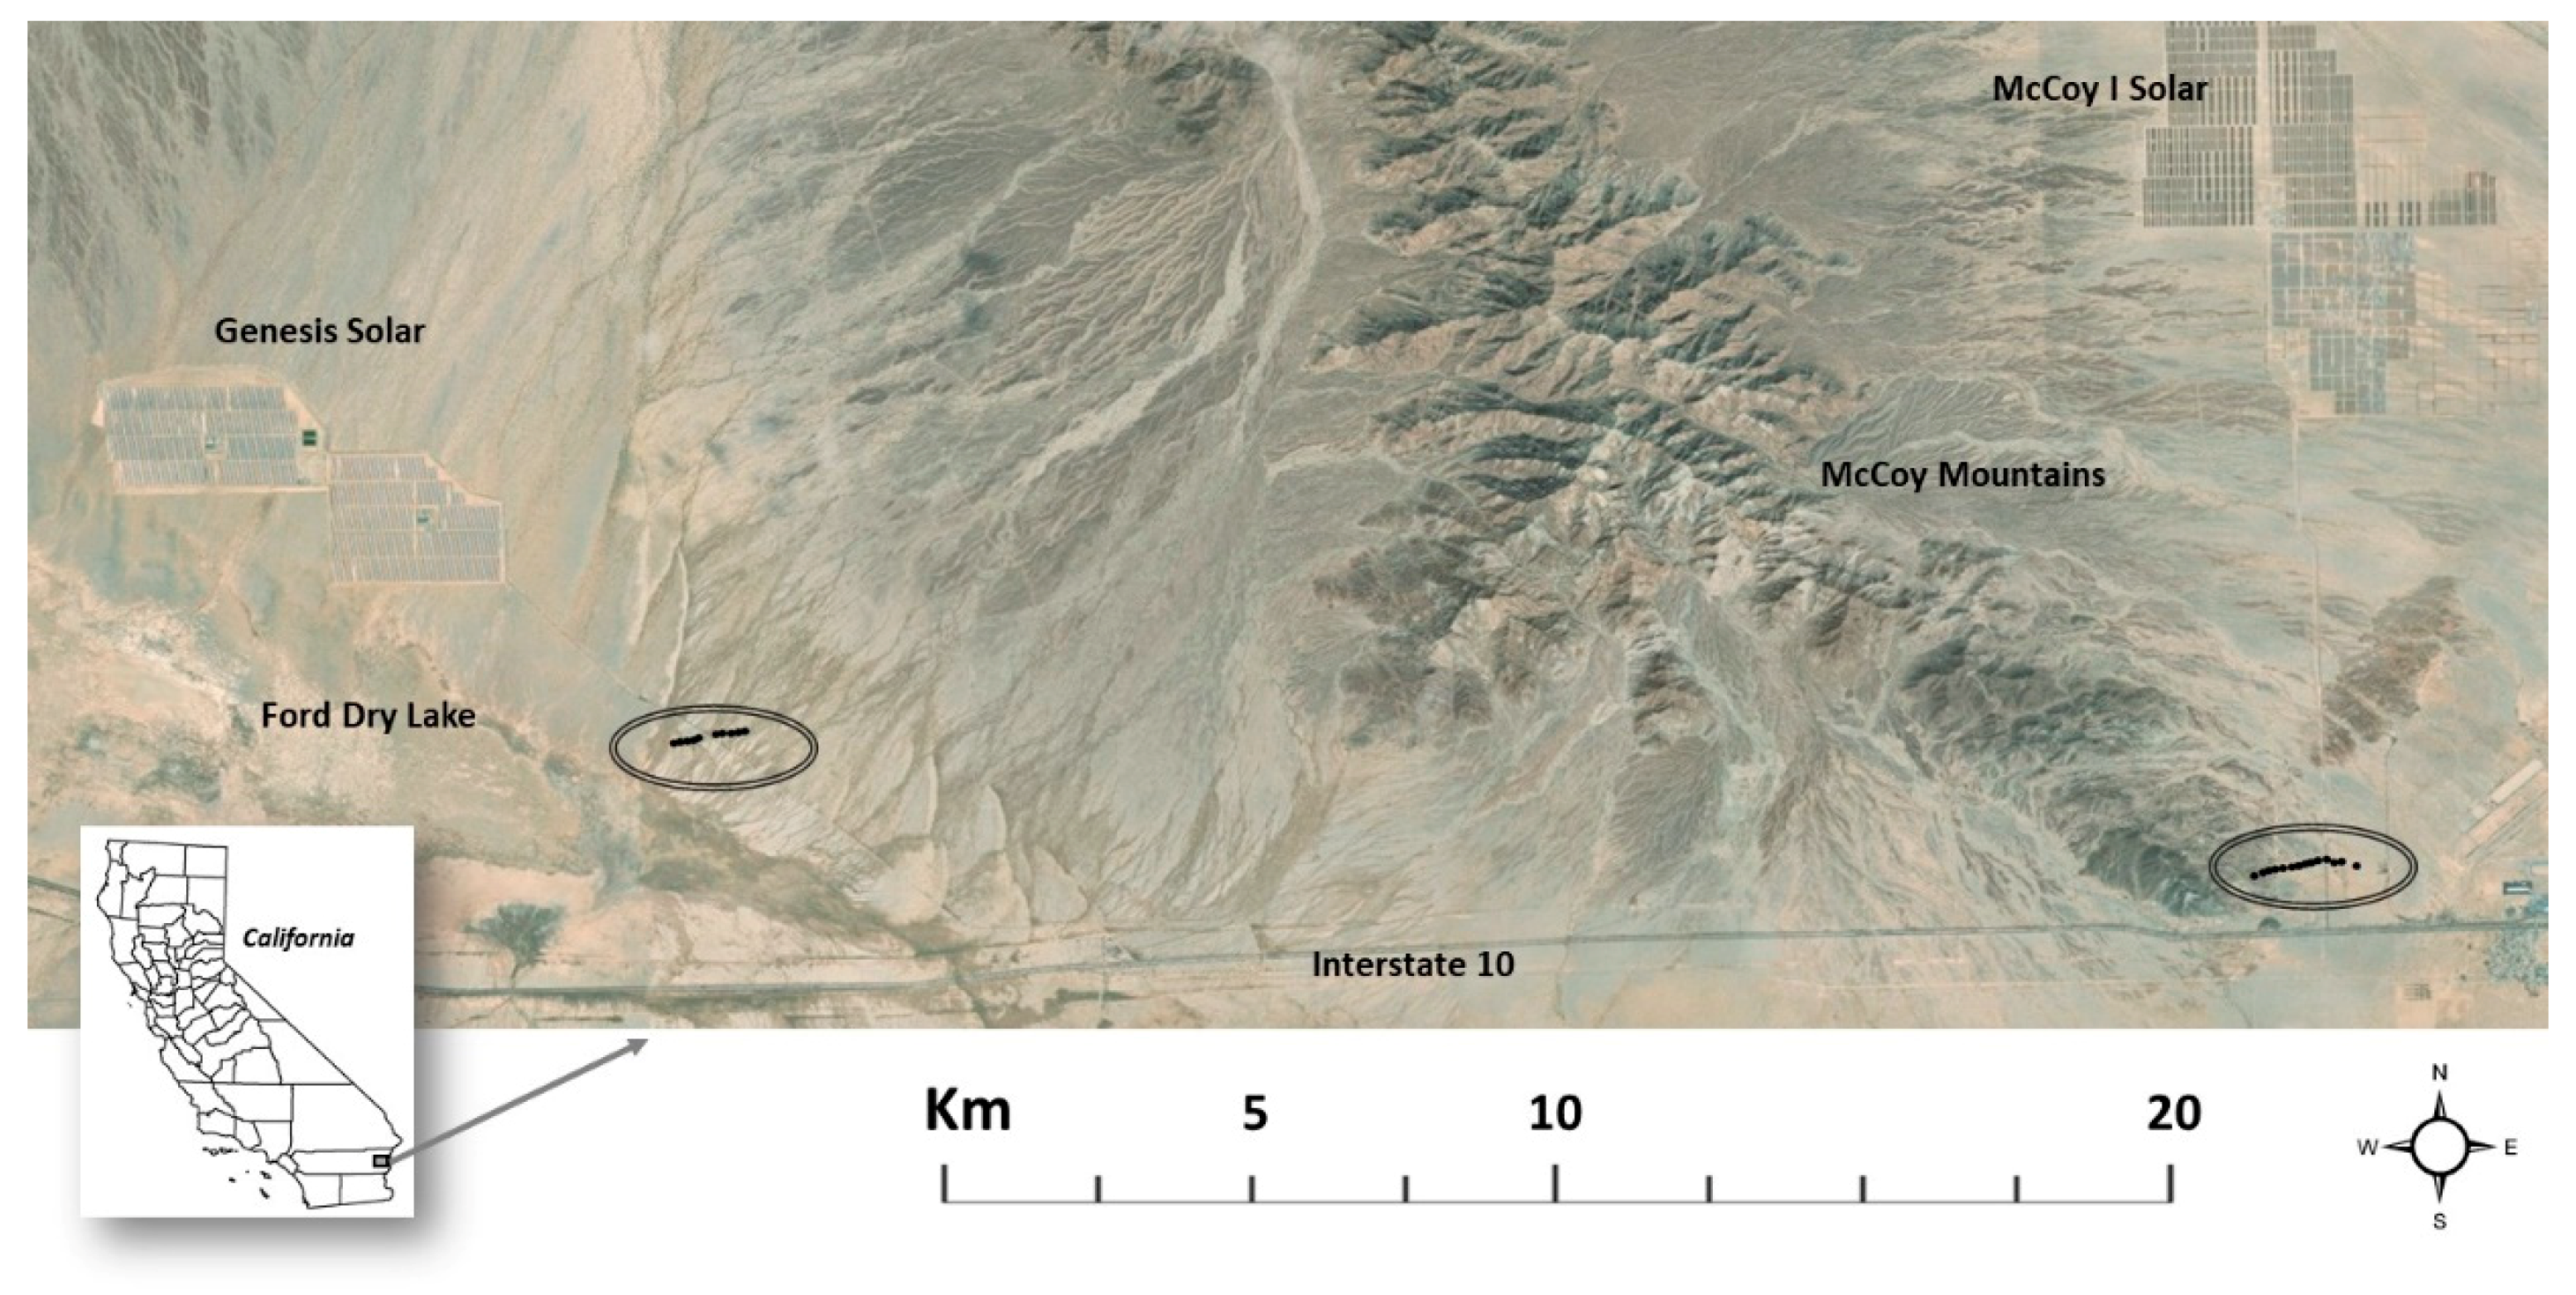
Field measurements of the air and soil surface temperatures for this study were carried out in eastern Riverside County in the Lower Colorado Desert of California (Figure 1). This area is bounded on the west by the Laguna, Santa Rosa, and San Jacinto mountain ranges; on the east by the California-Arizona state line; on the north by the gradual transition to the Mojave Desert; and on the south by the California–Mexico border [20]. Low annual rainfall (50–300 mm) and high temperatures (exceeding 45 °C in the summer) make this area one of the most arid in North America.
Ford Dry Lake is the lowest point in Chuckwalla Valley of Riverside County, at 110 m above sea level. A Soil Climate Analysis Network (SCAN) weather station operated by the U. S. Department of Agriculture is located at Ford Dry Lake (33°39′ N, 115°6′ W) and was used to provide a climatology record for the study area (data available at www.wcc.nrcs.usda.gov/scan/). The southern McCoy Mountains are located 5–10 km to the east of Ford Dry Lake.
Two relatively new solar energy production facilities have been built in both Ford Dry Lake and in the southern McCoy Mountains washes. The Genesis Solar Energy Project completed in 2014 near Ford Dry Lake consists of two independent solar electric generating facilities with nominal net electrical outputs of 125 megawatts (MW) each. Electrical power is produced using steam turbine generators fed from solar trough generators. The McCoy I Solar Energy Project is a 750 MW flat-panel photovoltaic facility, completed in 2016 in the southern McCoy Mountain washes (locations of both facilities are shown in Figure 1).
The study sites were in the American Semi-Desert and Desert Provence Ecoregion, Sonoran Desert Subsection [21,22]. This part of the Sonoran Desert, in the Lower Colorado River Basin, hosts many species of plants and animals. The main perennial vegetation community is creosote bush (Larrea divaricata) and white bursage (Ambrosia dermosa) [20], although ironwood (Olneya tesota), palo verde (Cercidium floridum), and ocotillo (Fouquieria splendens) are also found in the area.
Predators such as mountain lions (Felis concolor) and coyotes (Canis latrans) feed on desert bighorn sheep (Ovis canadensis), black-tailed jackrabbits (Lepus californicus), and round-tailed ground squirrels (Spermophilus tereticaudus). California leaf-nosed bats (Macrotus californicus) and ring-tailed cat (Bassasiscus astutus) also survive in the harsh environment. The Sonoran Desert is known for its great diversity of bird species, a few of which range into the Lower Colorado area: phainopepla (Phainopepla nitens), Costa’s hummingbird (Calypte costae), and roadrunner (Geococcyx californianus). Many species of reptiles can be found, most notably the desert tortoise (Gopherus agassizii) and chuckwalla lizard (Sauromalus ater) [23].
3. Materials and Methods
3.1. Field Measurements of Air Temperature
A total of 50 HOBO Pendant air temperature loggers were deployed in January of 2017, and attached to wooden stakes that were driven into the sandy or rocky desert soils at both Ford Dry Lake and the southern McCoy Mountains washes. Each wooden stake was spaced along a predominantly east–west transect, 100 m apart from the previous stake location (Figure 1). Two HOBO sensors were attached to each stake by plastic zip ties, one at 1 m height and the other resting directly on the soil substrate surface. The 1.0 m measurement height was used to approximate an average weather sampling height with free air circulation around the sensor, a height which can vary widely from weather station network to network. The sensors were not shielded from incoming solar radiation, so as to expose the temperature readings to the effects of direct sunlight and to mimic extreme surface heating conditions.
The locations of stakes ranged in elevation from 110 to 140 m above sea level. The western group of measurement locations were placed in sandy soils typical of the location of the Genesis solar facility, and the eastern group of measurement locations were placed in more rocky soils typical of the McCoy I solar facility landforms. Transect locations were selected to be as close as possible to these two new solar energy facilities, given site security and access restrictions, and the sensor stake locations were separated by 100 m, so as to eliminate overlapping the matching Landsat LST pixels for all of the sensor locations.
The HOBO Pendant Temperature 8K Data Loggers were rated to measure temperatures from −20 °C to 70 °C (−4 °F to 158 °F). The reported accuracy is ±0.53 °C, over the range of 0 °C to 50 °C (±0.95 °F from 32 °F to 122 °F). The resolution of the sensors is 0.14 °C at 25 °C (0.25 °F at 77 °F), with drift being less than 0.1 °C/year (0.2 °F/year). All temperature loggers were collected from the field site one year later (January, 2018) for data download and analysis.
3.2. Landsat Thermal Infra-Red Imaging
The thermal infrared sensor (TIRS) is an instrument on the Landsat 8 satellite that collects images within the thermal range (10–12.5 µm). Landsat 8 image data are retrieved every 16 days, with each scene being 170 km north–south by 183 km east–west. The TIRS has a pixel size of 100 m that was re-gridded to 30 m to match Landsat multispectral bands. Data were gathered from the Landsat-8 TIRS sensor for fourteen different fly-over dates in 2017, all at approximately 10:16 AM United States Standard Time (Table 1).
Prior to user download, calibration coefficients were applied to Landsat digital numbers to derive the top of the atmosphere (TOA) reflectance components [24], using the per-pixel solar angles derived from Band 4 (closest to center of focal plane). The brightness temperature (BT) was derived from TOA radiance and two thermal constants (as described online at landsat.usgs.gov/using-usgs-landsat-8-product). The BT of any 100 m resolution Landsat pixel (without further atmospheric correction) can be considered an approximation of kinetic LST in degrees Kelvin [25].
3.3. Statistical Analysis
We compared the hourly temperature (both Tsurface and Tair) readings from the HOBO Pendants, using the simple mean hourly difference (MD). We reported the daily standard deviation (SD) of the MDs, and conducted linear least-squares regression correlation across the entire time series for the derivation of conversion factors between Tsurface and Tair hourly measurement values.
4. Results
4.1. Climatology
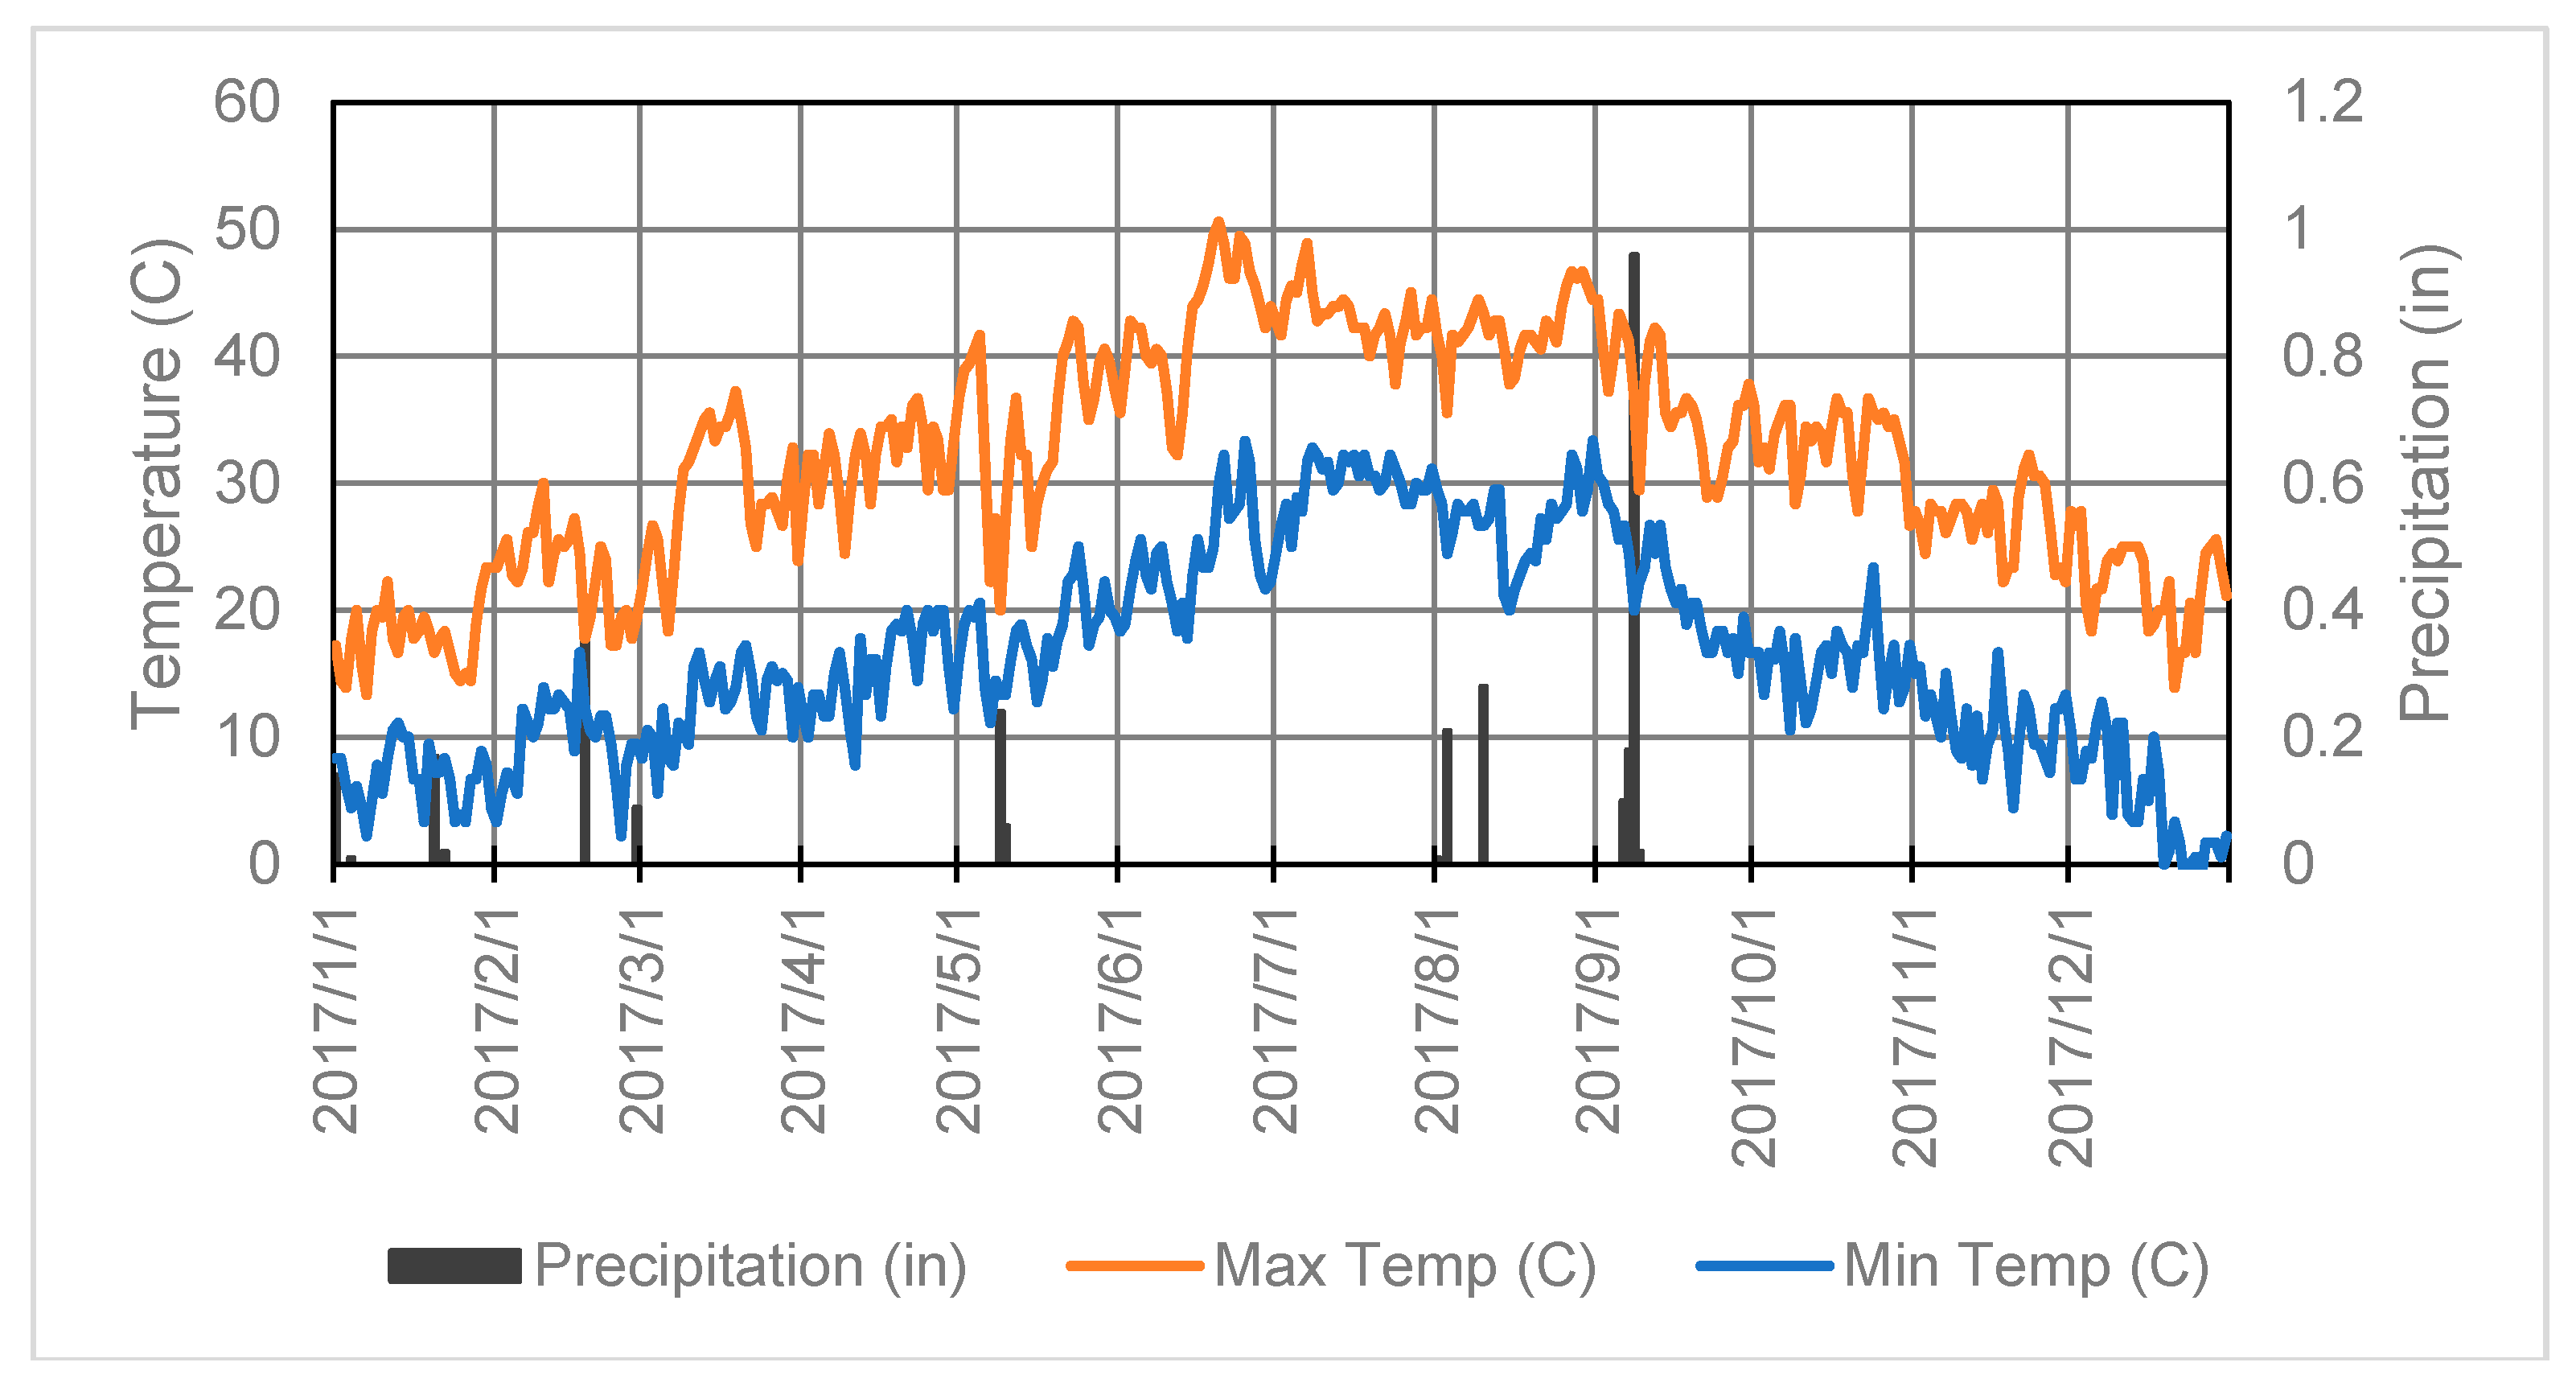
At the Ford Dry Lake Soil Climate Analysis Network (SCAN) station, the diurnal temperature ranges (DTR) varied significantly over the year of 2017, with winter generally having the lowest DTR and summer having the highest DTR (Figure 2). The annual average DTR was 15.6° C. The maximum was 25.5 °C on 8 October and the minimum was 5.6 °C on both 13 January and 18 February. The hottest day occurred on 20 June, with an ambient air temperature of 50.6 °C. The coldest daily minimum occurred on both 23 and 26 December, with an air temperature of −1.7 °C. During the 2017 measurement period, there were 15 days total in which the measurable precipitation was recorded at the station, ranging from 0.3 to 24 mm (0.9 inches). Of these, five events showed rainfall totals of 5 mm or greater: one in February, one in May, two in August, and one in September.
4.2. Surface Temperatures
4.2.1. Difference between Surface and Air Temperature
The hourly ground surface and the ambient 1 m air temperature at each site were found to be closely correlated across the measurement locations (Table 2). The linear regression coefficient of determination (R2) between the hourly Tsurface and Tair measurements varied from 0.86 to 0.99. Throughout the year, the hourly mean difference (MD) between the Tsurface and Tair was consistently greater than zero. The estimated conversion factor using the average hourly MD was determined to be +5.8 °C, meaning that to convert ambient air temperature to ground surface air temperature, one should add 5.8 °C to the air temperature measured at 1 m height.
During the summer months (June–September), we measured a larger disparity between the surface and air temperatures at each measurement location than during winter months (January–May). For instance, the average difference for June/July between Tsurface and Tair for all measurement locations was 7.5 °C, compared to an January/February average difference of 2.4 °C (as illustrated in Figure 3).
4.2.2. Comparisons between Tair and Landsat LST
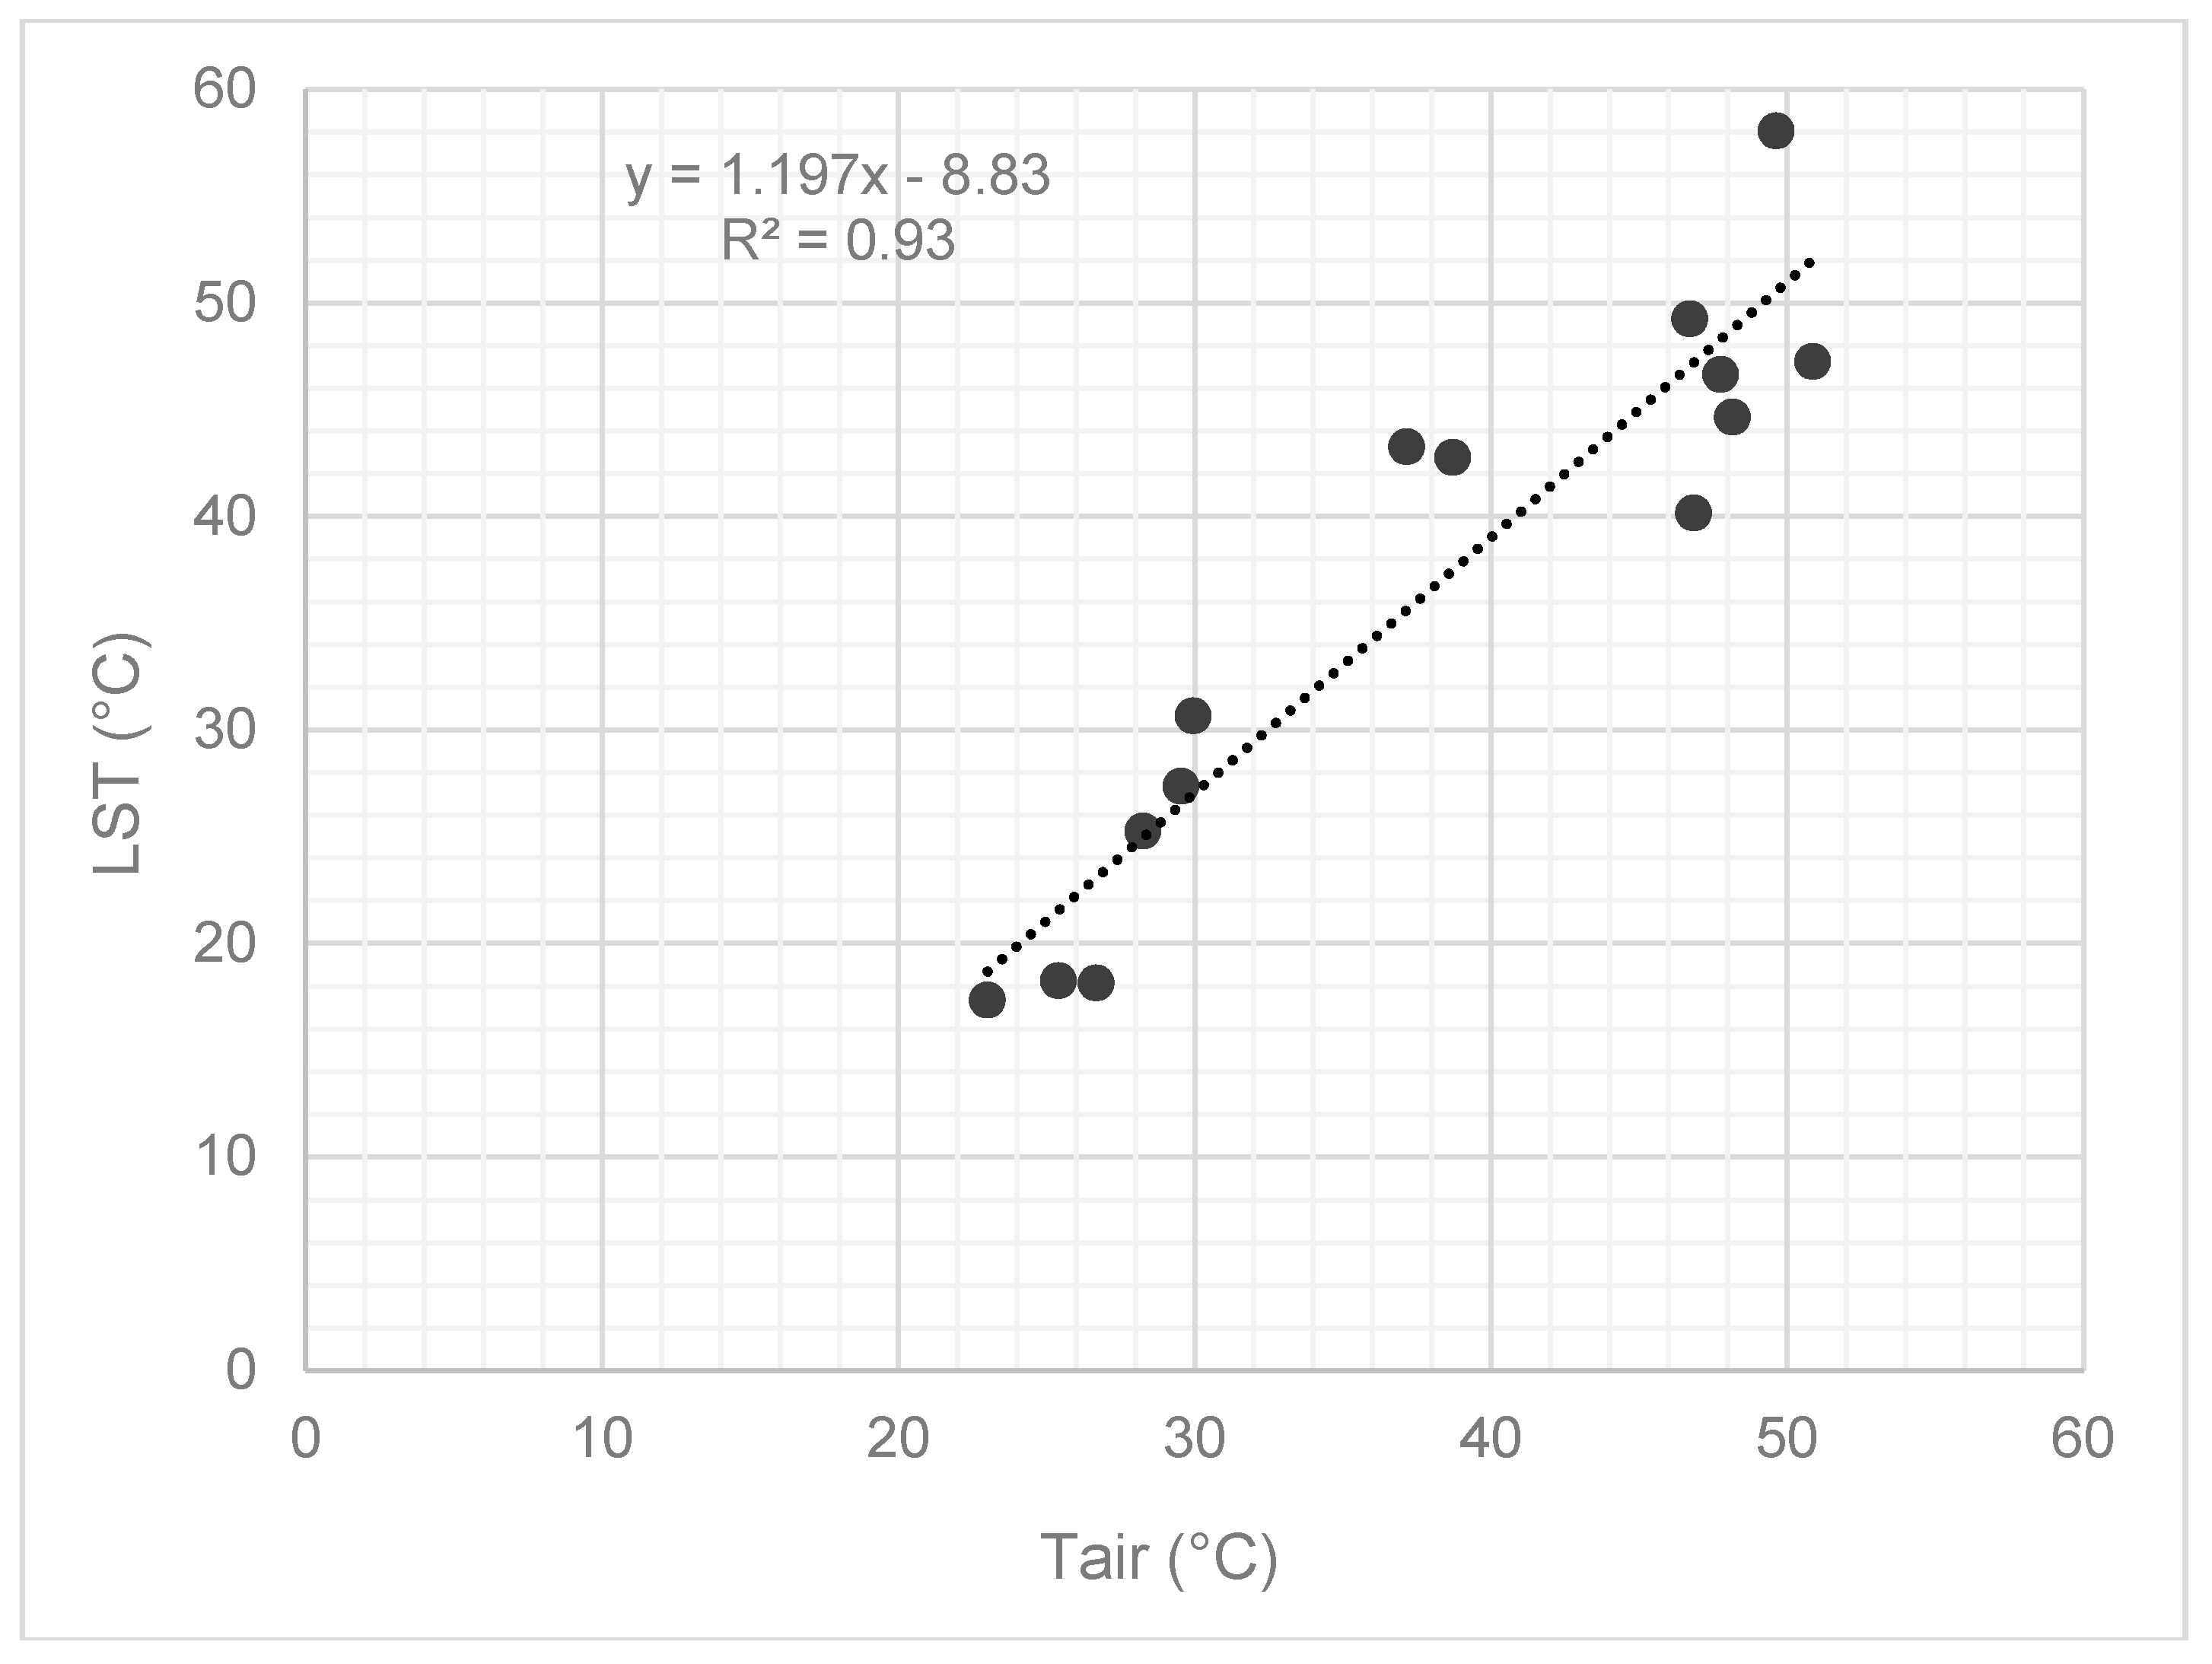
The hourly Tair and the corresponding LST from Landsat (at approximately 10:16 AM for the corresponding 30 m pixel for each measurement location point) for each measurement location were closely correlated over the course of 2017 (Table 3). The linear regression R2 values between the hourly LST and Tair measurements varied from 0.83 to 0.93. The mean difference (MD) between the Tair and LST was typically greater than zero, although the MDs for Tair and LST were smaller than the MDs measured between the Tsurface and Tair, comparing location-by-location from Table 2. The averaged conversion factor from the MDs for all measurement locations was −0.78°C, meaning that to convert Tair to Landsat LST, one should subtract 0.78 °C from a measured Tair value.
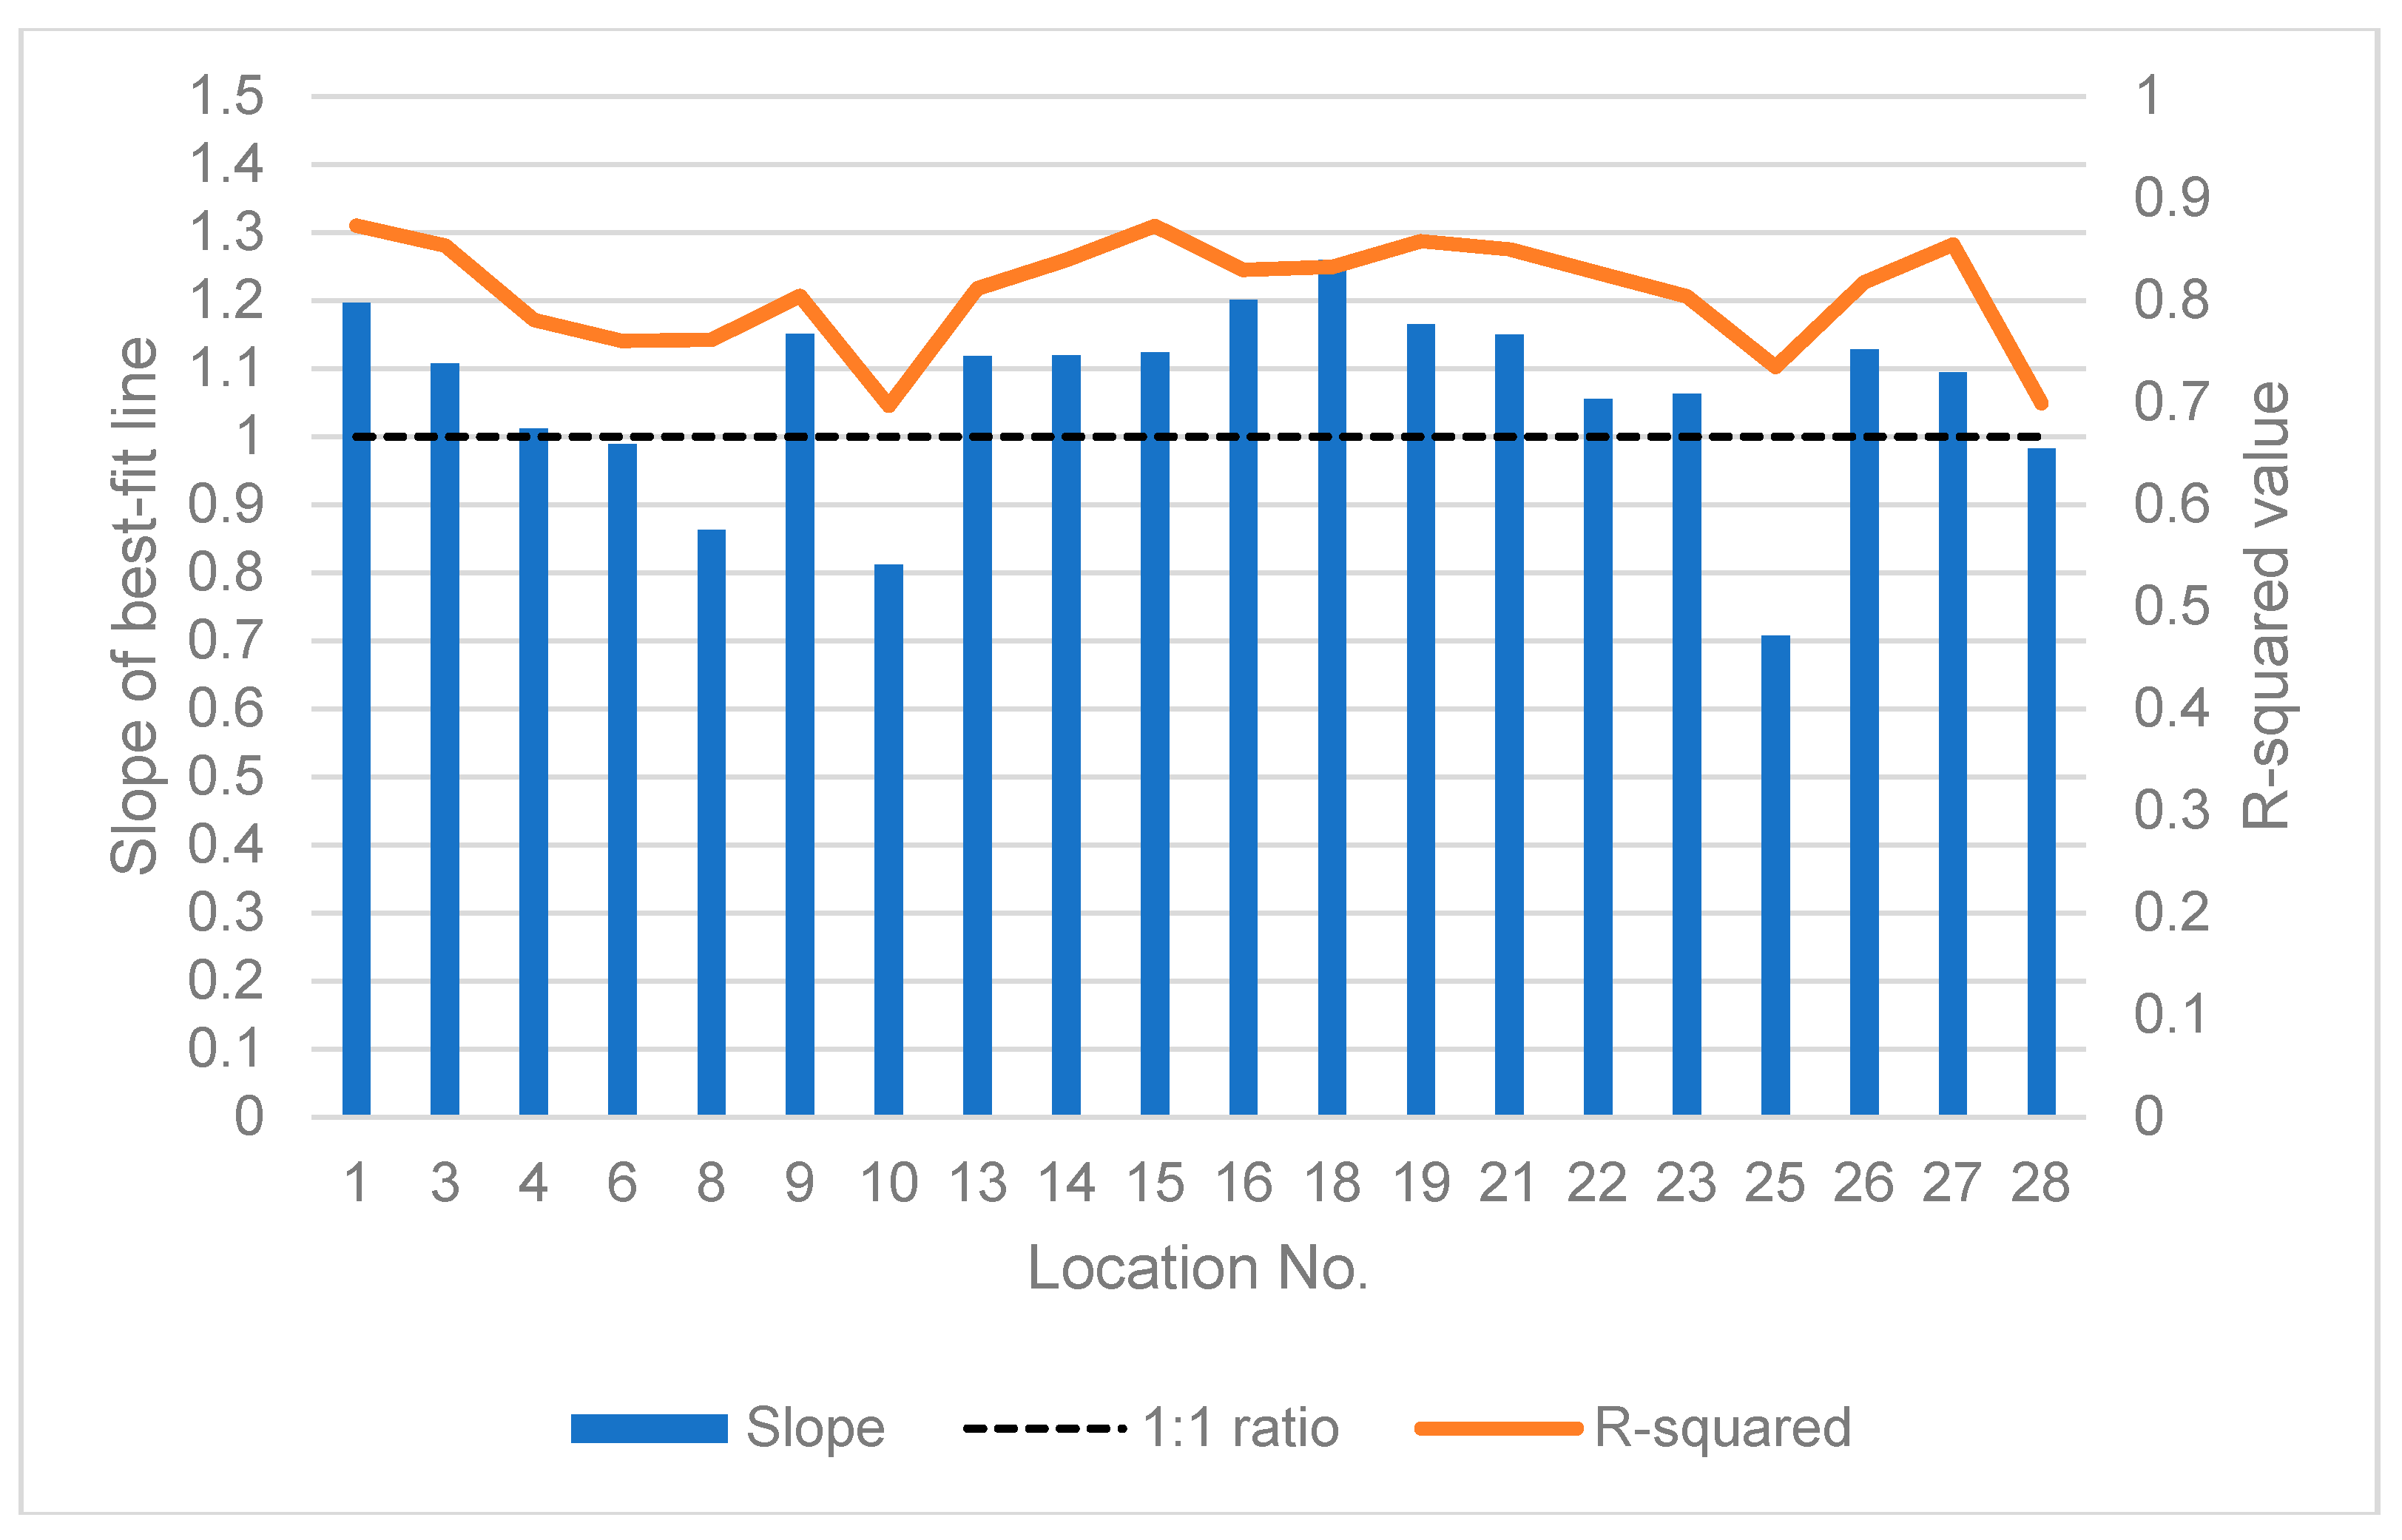
An example scatterplot of the Tair and LST values from 2017 Landsat imagery (shown in Figure 4) demonstrated the strong linear relationship that was maintained from the winter to summer months. A 1:1 ratio (equally measured Tair and LST; Figure 5) was most commonly observed during the months of March and July (Figure 4).
4.2.3. Comparisons between All Three Measurements
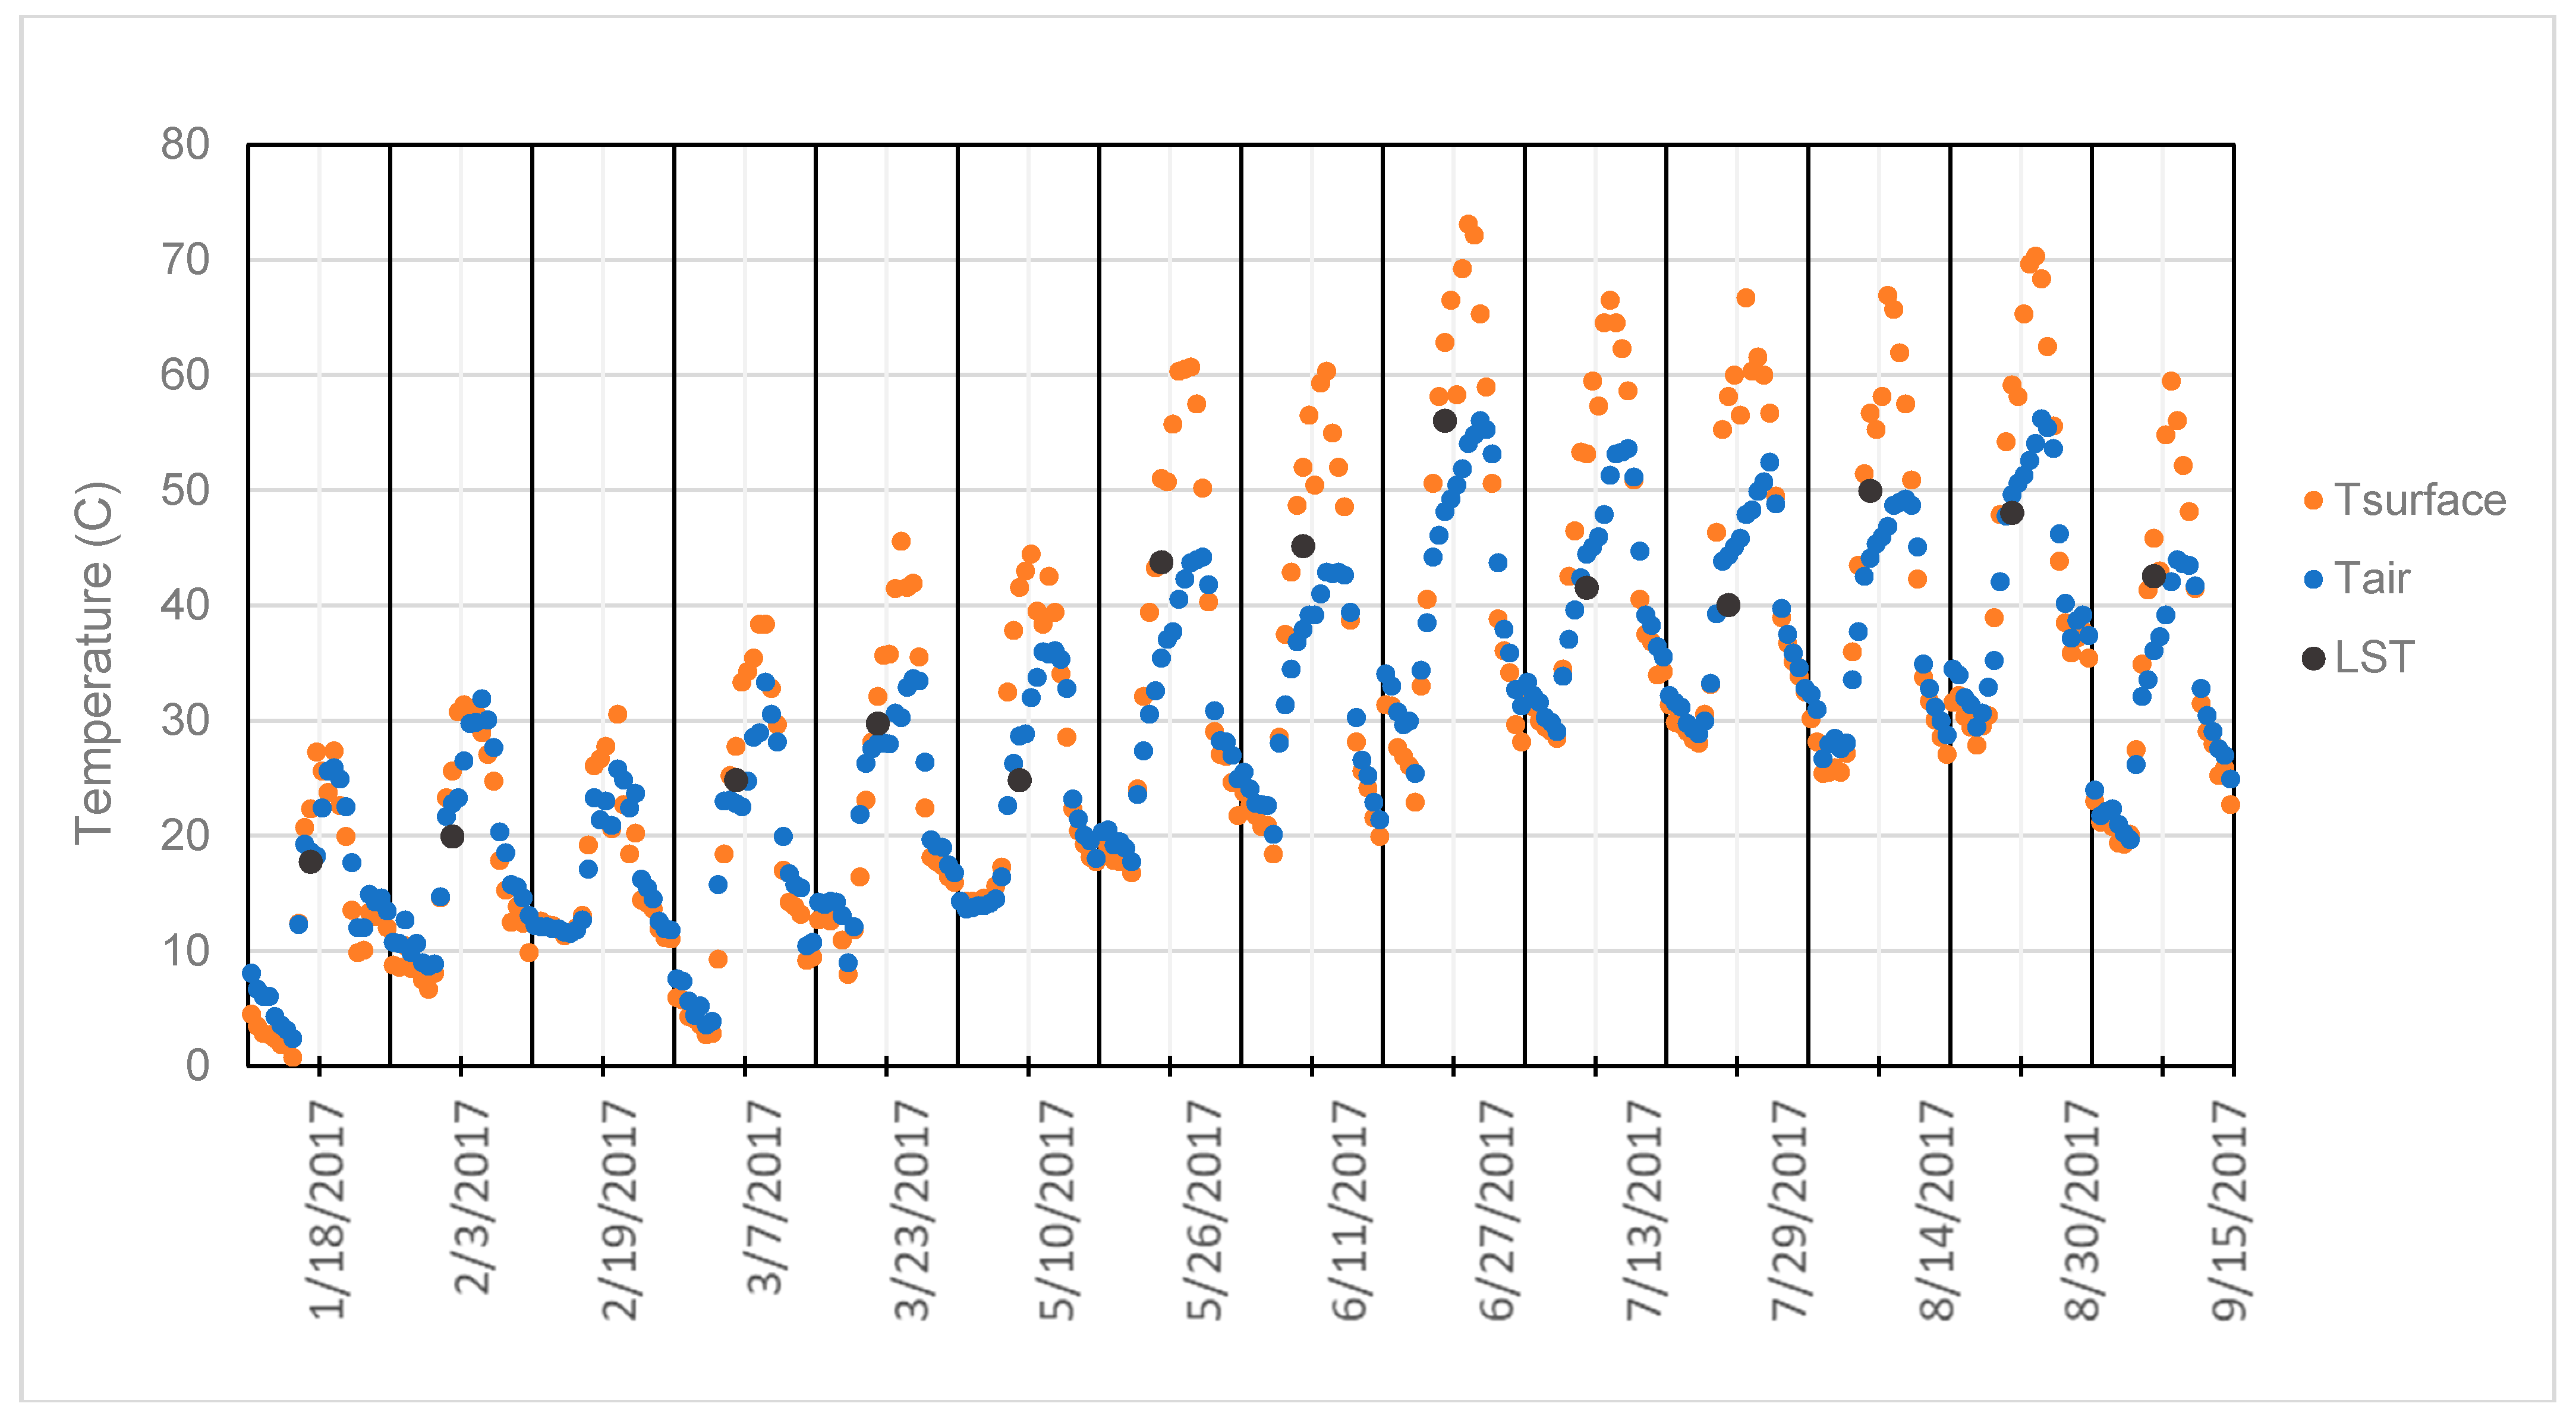
Across all measurement locations in the study area, the hourly and daily Tsurface was commonly higher than either maximum daily Tair or LST (Figure 3 and Figure 6), although there were a few exceptions to that pattern. Most notably, the Tsurface was lower than the Tair for 20% of the hourly observations collected in 2017, mainly during colder months (winter and autumn), and the Tsurface was lower than the LST for 12% of the hourly observations from summer and autumn Landsat fly-over dates.
5. Discussion
We observed a strong relationship between the Landsat LST and air temperatures in the Lower Colorado Desert, allowing for satellite-derived estimates of surface temperatures to be interpreted with high confidence in remote desert locations where it is not possible or feasible to maintain weather stations. With respect to the continuous hourly air temperature measurement results in 2017, the slightly better correlation of Tair than Tsurface with the LST may have been the result of the freer circulation of air at 1 m height than right at the ground surface, which would have explained the closer match of Tair with the 100 m resolution of the Landsat TIR emission of heat from the land surfaces.
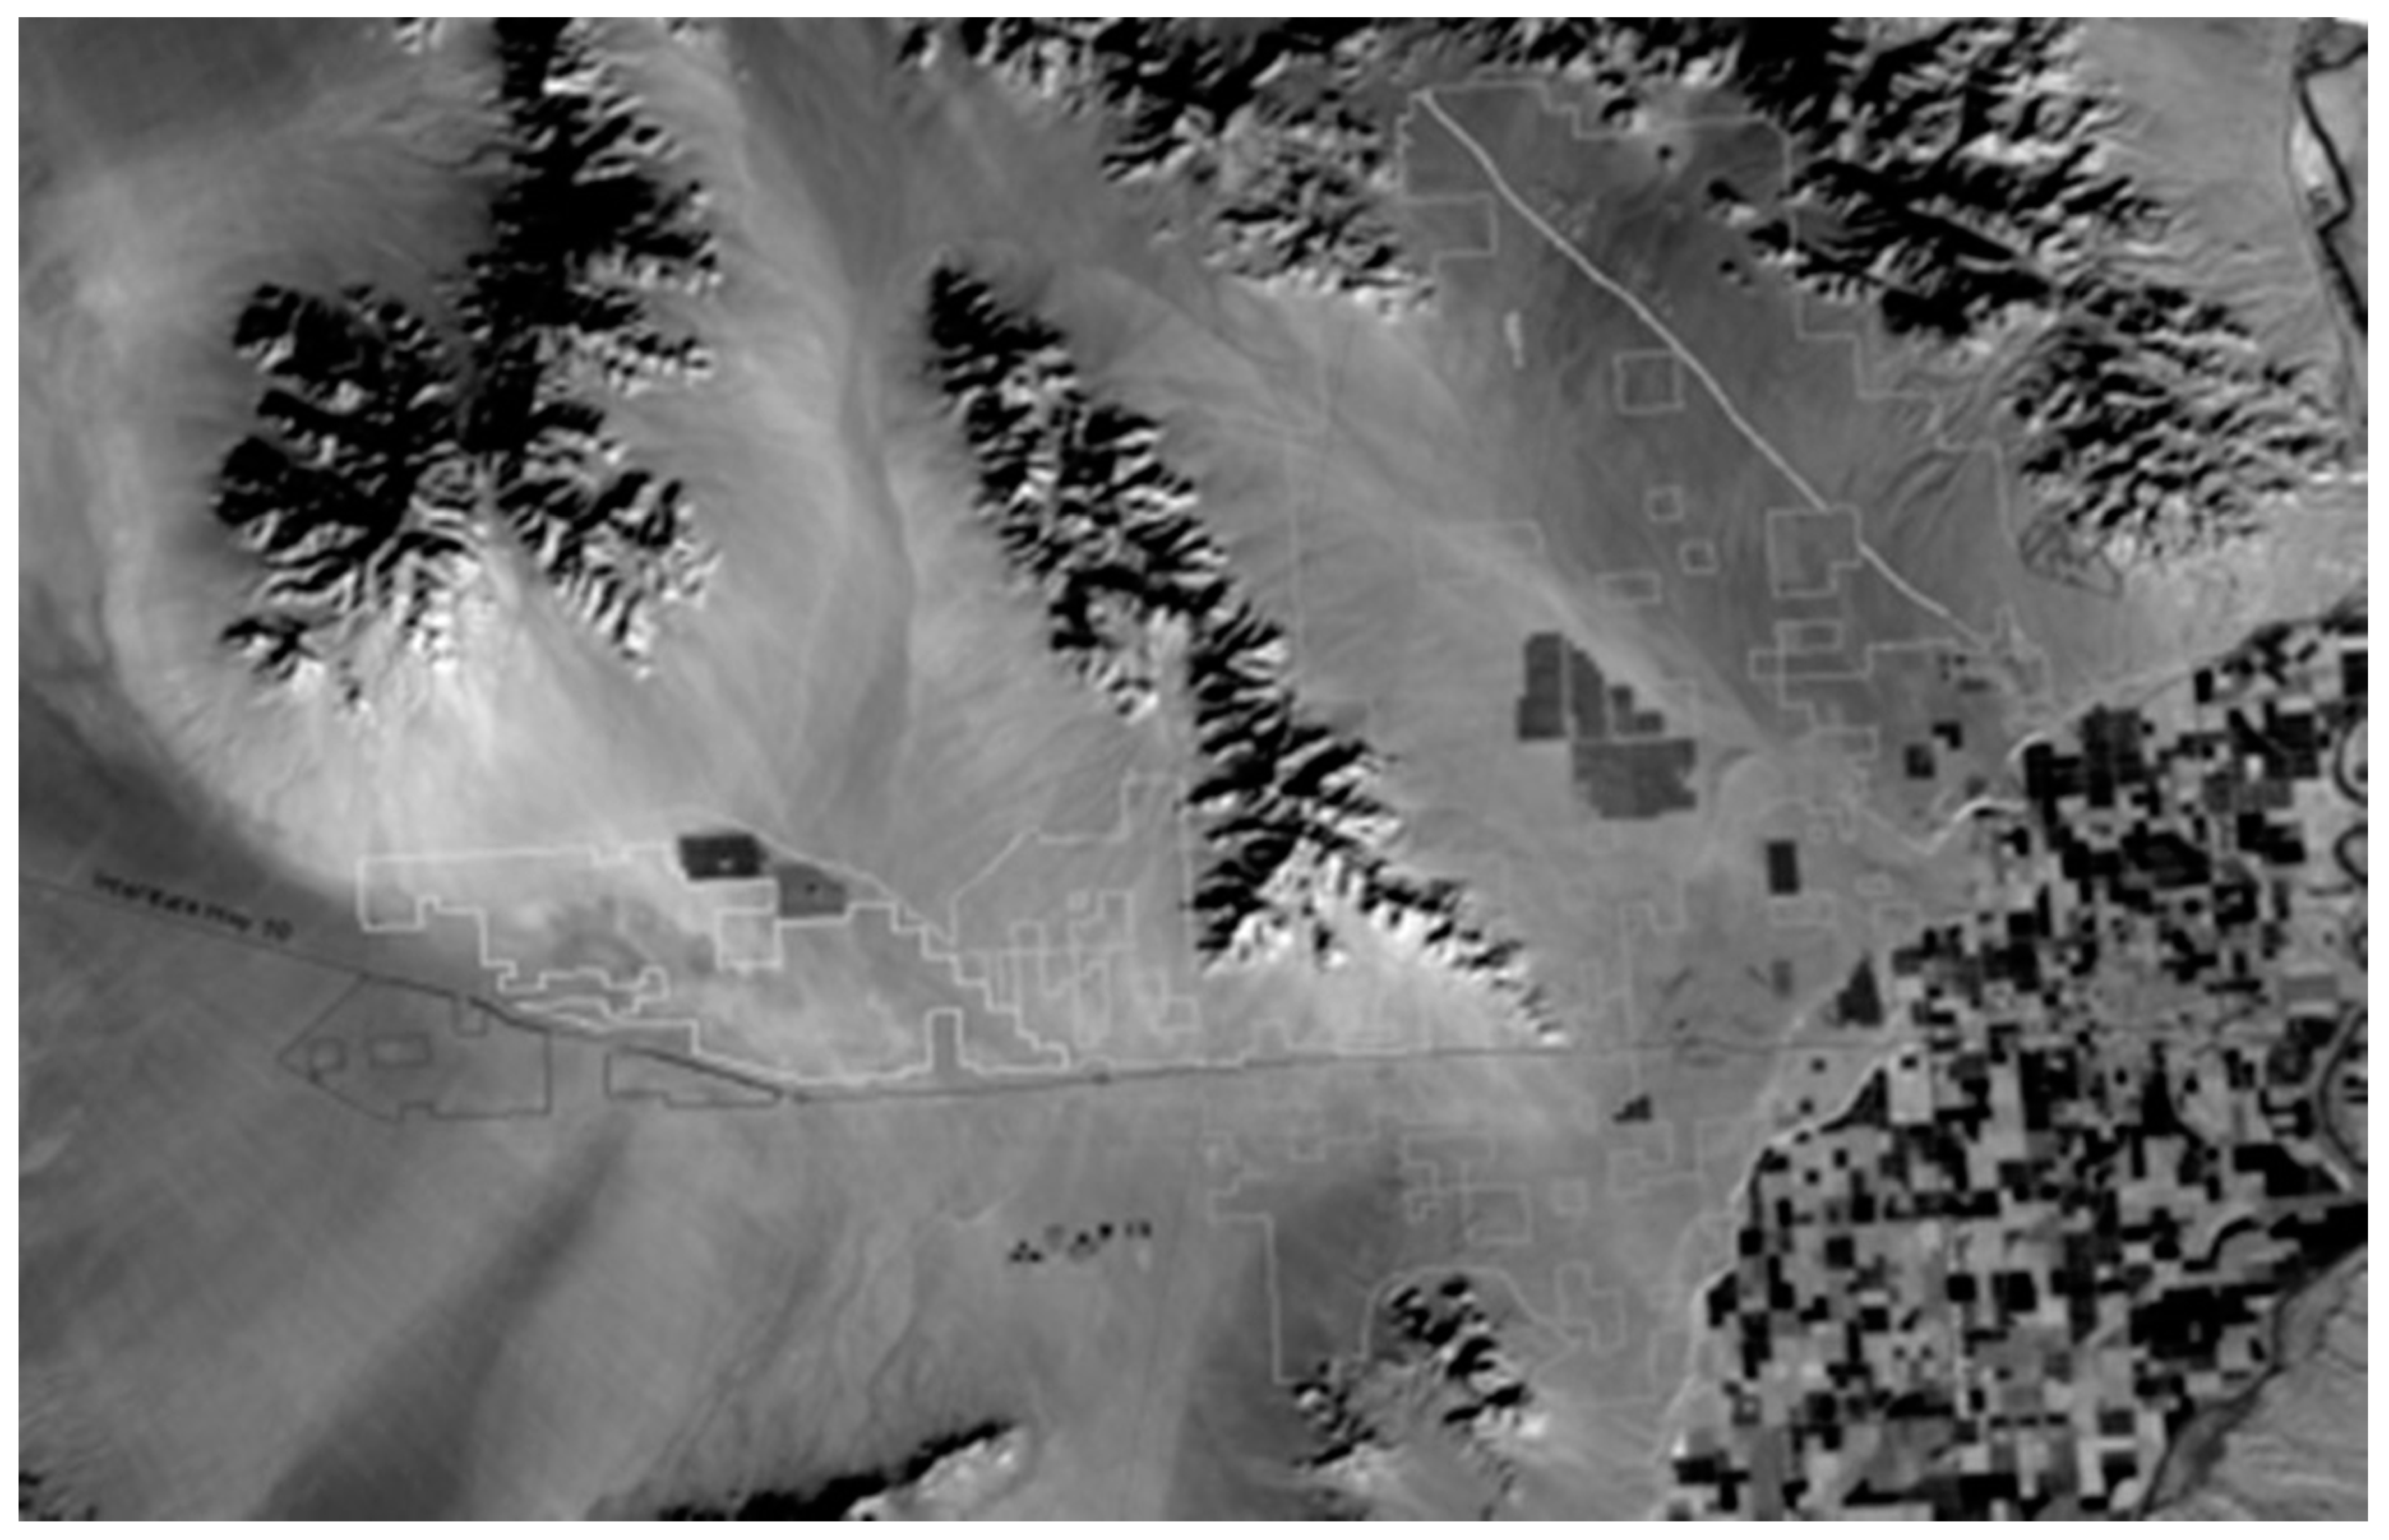
Desert animals survive and live in a variety of temperatures, but there are frequent instances of the LST exceeding 50 °C in Landsat image data (see example Figure 7), an extreme that would generally drive even the hardiest of animals underground or to shelter. There are several noteworthy features of the LST pattern in Figure 7. First, the highest summer surface temperatures appeared on the predominantly south-facing slopes at the rocky bases and lower washes of the Palen and McCoy Mountains, whereas the coolest summer surface temperatures appeared on the predominantly north-facing slopes at the highest elevations of these mountains. Second, the solar energy absorbing facilities at the Genesis and McCoy I sites remained several degrees Celsius cooler than the surrounding sandy washes of Ford Dry Lake and the southern McCoy Mountains.
Being able to interpret near real-time spatial LST data for the whole of the Mojave and Lower Colorado Desert region can allow researchers to pinpoint areas that have shown a higher frequency of these critical temperature limits than others. This information could help guide new field surveys and finetune existing conservation and habitat restoration plans. Desert tortoises and fringe-toed lizards are found throughout the Lower Colorado Desert, but specific habitat locations that can be favored by species (for example, alluvial washes or rocky hills), can be used to narrow down optimal monitoring locations for monitoring using LST images. Areas that have established populations of wildlife, like Joshua Tree National Park, are prime sites to monitor known breeding habitats and to better understand the stresses present for these animals in the ecosystem.
Potter [26] mapped the extensive coverage of well-developed desert rock pavements from Landsat imagery within solar energy development boundaries in eastern Riverside County, and specifically in the McCoy Mountain washes. Rock pavement surfaces display spectra that are strongly modified by the reflectance of surface varnish. Such varnishes decrease the surface reflectance and albedo, and result in a steep positive slope in between Landsat Bands 1 and 5, owing to a strong suppression of short wavelength radiance by the presence of oxidized metals (mainly Fe and Mg). In contrast, active washes that are more commonly dominated by sand (quartz and feldspar crystals) result in an increased reflectance (higher albedo) in all Landsat bands [27]. Despite these detectable differences in reflectance properties between sandy and rocky desert soils, the hourly temperature records we collected in 2017 across the varied geomorphic surfaces of the study area were not statistically significant between measurement locations at any given time of the year. It may be the case that the consistently high midday solar irradiance in the Lower Colorado Desert dominates over any and all differences in soil albedo in determining surface air temperatures and DTR on a year-round basis.
6. Conclusions
Our understanding of how climate change and human activity together affect the natural world is presently limited, in part by our ability to measure change at all necessary scales. Unlike physical monitoring stations, which are costly to install and maintain, satellite measurements of desert soils can be potentially acquired every week at a relatively low cost to provide critical habitat information on regional surface conditions. This study has provided strong evidence that Landsat LST correlates closely with on-site measurements of air and surface temperatures in the deserts of southern California, and can be inter-converted with those ground-based measurements for use in ecosystem change studies.
Author Contributions
All authors have contributed equally to the conceptualization, analysis, writing, and investigations.
Funding
This research was funded by the U. S. Department of the Interior Bureau of Land Management (BLM).
Acknowledgments
The authors wish to thank Mark Massar and James Weigand of the BLM Field Office (Palm Springs) for assistance in field sampling.
Conflicts of Interest
The authors declare no conflict of interest.
References
- Paul, E.A.; Clark, F.E. Soil Microbiology and Biochemistry; Academic Press: Cambridge, MA, USA, 1996; pp. 12–32. [Google Scholar]
- Sims, G.K.; Dunigan, E.P. Diurnal and seasonal variations in nitrogenase activity (C2H2 reduction) of rice roots. Soil Biol. Biochem. 1984, 16, 15–18. [Google Scholar] [CrossRef]
- Hillel, D. Environmental Soil Physics; Academic Press: Cambridge, MA, USA, 1998; p. 340. [Google Scholar]
- Lehnert, M. Factors affecting soil temperature as limits of spatial interpretation and simulation of soil temperature. Acta Univ. Palacki. Olomuc. Geogr. 2015, 45, 5–21. [Google Scholar]
- Bai, Y.; Scott, T.A.; Chen, W.; Minnich, R.A.; Chang, A.C. Long-term variation in soil temperature of the Mojave Desert, southwestern USA. Clim. Res. 2011, 46, 43–50. [Google Scholar] [CrossRef] [Green Version]
- Dudek ICF International. Mojave Fringe-Toed Lizard (Uma Scoparia). 2012. Available online: https://www.drecp.org/documents/docs/baseline_biology_report/10_Appendix_B_Species_Profiles/10a_Reptile_Amphibian/Mojave_Fringe-toed_Lizard.pdf (accessed on 30 June 2018).
- Meyer, R. Gopherus agassizii—USDA Forest Service. 2008. Available online: https://www.feis-crs.org/feis/ (accessed on 1 August 2018).
- Lewis-Winokur, V.; Winokur, R.M. Incubation temperature affects sexual differentiation, incubation time, and posthatching survival in desert tortoises (Gopherus agassizi). Can. J. Zool. 1995, 73, 2091–2097. [Google Scholar] [CrossRef]
- Lovich, J.E.; Yackulic, C.B.; Freilich, J.; Agha, M.; Austin, M.; Meyer, K.P.; Arundel, T.R.; Hansen, T.; Vamstad, M.S.; Root, S.A. Climatic variation and tortoise survival: Has a desert species met its match? Biol. Conserv. 2014, 169, 214–224. [Google Scholar] [CrossRef]
- Hasfurther, V.R.; Burman, R.D. Soil temperature modeling using air temperature as a driving mechanism. Trans. ASAE 1974, 16, 78–81. [Google Scholar] [CrossRef]
- Persaud, N.; Chang, A.C. Estimating soil temperature by linear filtering of measured air temperature. Soil Sci. Soc. Am. J. 1983, 47, 841–847. [Google Scholar] [CrossRef]
- Bocock, K.L.; Jeffers, J.N.R.; Lindley, D.K.; Adamson, J.K.; Gill, C.A. Estimating woodland soil temperatures from air temperature and other climatic variables. Agric. Meteorol. 1977, 18, 351–372. [Google Scholar] [CrossRef]
- Toy, T.J.; Kuhaida, A.J.; Munson, B.E. The prediction of mean monthly soil temperature from mean monthly air temperature. Soil Sci. 1978, 126, 181–189. [Google Scholar] [CrossRef]
- Mahrer, Y. A numerical model for calculating the soil temperature regime under transparent polyethylene mulches. Agric. Meteorol. 1908, 22, 227–234. [Google Scholar] [CrossRef]
- Zheng, D.; Hunt, E.R.; Running, S.W. A daily soil temperature model based on air temperature and precipitation for continental applications. Clim. Res. 1993, 2, 183–191. [Google Scholar] [CrossRef]
- Kang, S.; Kim, S.; Oh, S.; Lee, D. Predicting spatial and temporal patterns of soil temperature based on topography, surface cover and air temperature. For. Ecol. Manag. 2000, 136, 173–184. [Google Scholar] [CrossRef]
- Li, Z.; Guo, X.; Dixon, P.; He, Y. Applicability of Land Surface Temperature (LST) estimates from AVHRR satellite image composites in northern Canada. Prairie Perspect. 2008, 11, 119–130. [Google Scholar]
- Kawashima, S.; Ishida, T.; Minomura, M.; Miwa, T. Relations between Surface Temperature and Air Temperature on a Local Scale during Winter Nights. J. Appl. Meteorol. 2000, 39, 1570–1579. [Google Scholar] [CrossRef]
- Xiong, Y.; Chen, F. Relationship between temperatures from Landsat thermal infrared band retrievals and synchronous weather measurements. In Proceedings of the 2016 4th International Workshop on Earth Observation and Remote Sensing Applications (EORSA), Guangzhou, China, 4–6 July 2016; pp. 437–441. [Google Scholar]
- Marks, J.B. Vegetation and soil relations in the Lower Colorado Desert. Ecology 1950, 31, 176–193. [Google Scholar] [CrossRef]
- Bailey, R.G. Ecological Classification for the United States; USDA Forest Service: Washington, DC, USA, 1994.
- Cleland, D.T.; Freeouf, J.A.; Keys, J.E.; Nowacki, G.J.; Carpenter, C.A.; McNab, W.H. Ecological Subregions: Sections and Subsections for the Conterminous United States. 2007. Available online: https://www.fs.usda.gov/treesearch/pubs/48672 (accessed on 31 July 2018).
- Lovich, J.E.; Ennen, J.R. Wildlife conservation and solar energy development in the Desert Southwest, United States. Bioscience 2011, 61, 982–992. [Google Scholar] [CrossRef]
- Landsat 8 Surface Reflectance Code (LASRC) Product Guide; US Geological Survey (USGS): Reston, VA, USA, 2018.
- Barsi, J.A.; Schott, J.R.; Hook, S.J.; Raqueno, N.G.; Markham, B.L.; Radocinski, R.G. Landsat-8 Thermal Infrared Sensor (TIRS) Vicarious Radiometric Calibration. Remote Sens. 2014, 6, 11607–11626. [Google Scholar] [CrossRef] [Green Version]
- Potter, C. Mapping changes in desert pavement surfaces of the Lower Colorado Desert of southern California using Landsat time series analysis. Int. J. Adv. Remote Sens. GIS 2016, 5, 1747–1754. [Google Scholar] [CrossRef]
- Beratan, K.K.; Anderson, R. The use of Landsat Thematic Mapper data for mapping and correlation of Quaternary geomorphic surfaces in the Southern Whipple Mountains, California. Int. J. Remote Sens. 1998, 19, 2345–2359. [Google Scholar] [CrossRef]
Figure 1.
Transect locations of temperature measurement stakes (black dots within circles) in eastern Riverside County, California. The southern McCoy Mountains are to the right center on the true-color satellite image, while Ford Dry Lake is on the western-most section of the study area map.
Figure 1.
Transect locations of temperature measurement stakes (black dots within circles) in eastern Riverside County, California. The southern McCoy Mountains are to the right center on the true-color satellite image, while Ford Dry Lake is on the western-most section of the study area map.

Figure 2.
Climatology from the Ford Dry Lake SCAN station in 2017.

Figure 3.
Diurnal Tsurface and Tair for a selected measurement location (27) for all available dates of Landsat image acquisition.
Figure 3.
Diurnal Tsurface and Tair for a selected measurement location (27) for all available dates of Landsat image acquisition.

Figure 4.
Scatterplot of Tair and 2017 Landsat LST image data (for measurement location 1) in Ford Dry Lake.
Figure 4.
Scatterplot of Tair and 2017 Landsat LST image data (for measurement location 1) in Ford Dry Lake.

Figure 5.
Slope and R2 for the linear best-fit line between hourly Tair measurements and LST from the Landsat imagery. The “best-fit” 1:1 ratio level is show as a dashed horizonal line.
Figure 5.
Slope and R2 for the linear best-fit line between hourly Tair measurements and LST from the Landsat imagery. The “best-fit” 1:1 ratio level is show as a dashed horizonal line.

Figure 6.
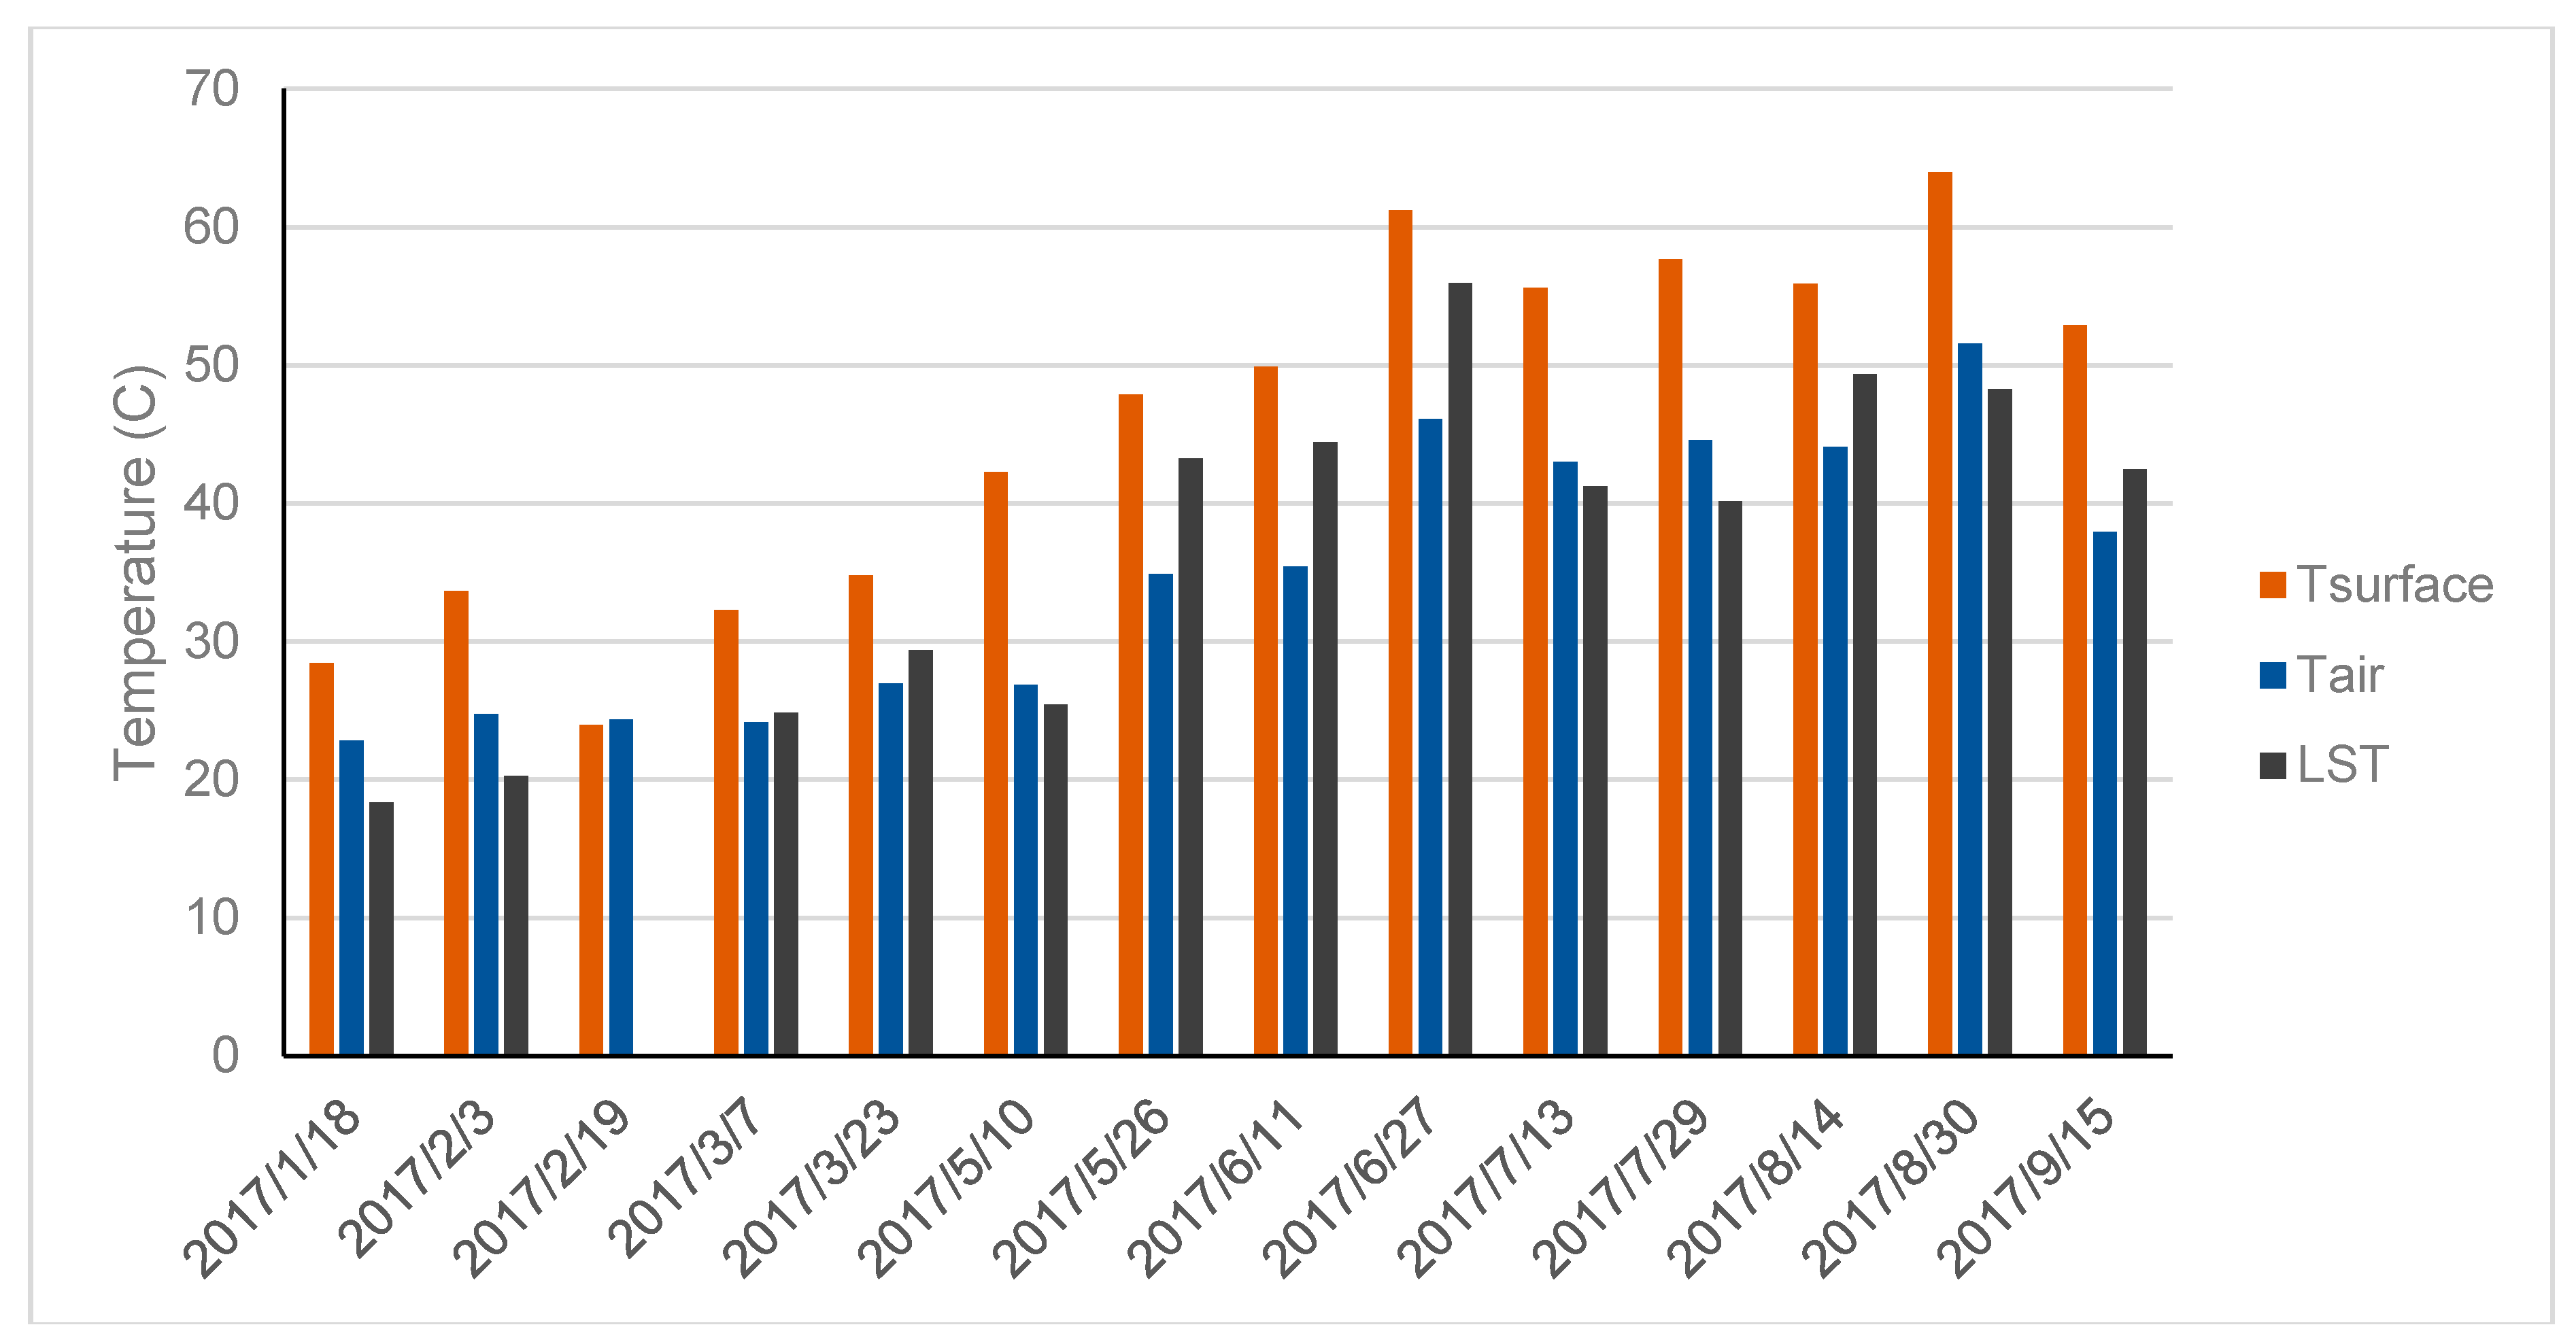
Comparison of the Tsurface, Tair, and LST at the hour of the Landsat fly-over for a selected measurement location (13).
Figure 6.
Comparison of the Tsurface, Tair, and LST at the hour of the Landsat fly-over for a selected measurement location (13).

Figure 7.
June 2016 Landsat LST gray-scale image, centered on the Palen and McCoy Wilderness Area in eastern Riverside County and the solar energy development zones (shown in white outlines). LST ranges from <40 °C in black shades to >50 °C in light gray shades.
Figure 7.
June 2016 Landsat LST gray-scale image, centered on the Palen and McCoy Wilderness Area in eastern Riverside County and the solar energy development zones (shown in white outlines). LST ranges from <40 °C in black shades to >50 °C in light gray shades.


Table 1.
Dates in 2017 for which Landsat scenes could be acquired. All days were verified to have minimal cloud cover over the ground temperature measurement locations.
Table 1.
Dates in 2017 for which Landsat scenes could be acquired. All days were verified to have minimal cloud cover over the ground temperature measurement locations.
| Date | Rainfall Events Recorded at Ford Dry Lake Soil Climate Analysis Network (SCAN) Site |
|---|---|
| 18 January 2017 | |
| 3 February 2017 | |
| 19 February 2017 | 18 February 2017 (1 day before) |
| 7 March 2017 | |
| 23 March 2017 | |
| 10 May 2017 | 9 May 2017 (1 day before) |
| 26 May 2017 | |
| 11 June 2017 | |
| 27 June 2017 | |
| 13 July 2017 | |
| 29 July 2017 | |
| 14 August 2017 | 10 August 2017 (4 days before) |
| 30 August 2017 | |
| 15 September 2017 | 8 September 2017 (7 days before) |
Table 2.
Mean difference (MD), standard deviation (SD), and linear regression correlation (R2) between hourly Tsurface and Tair at measurement locations over all days. Measurement locations 2, 5, 7, 11, 12, 17, 20, and 24 were unable to be used due to sensor malfunctions and missing data values.
Table 2.
Mean difference (MD), standard deviation (SD), and linear regression correlation (R2) between hourly Tsurface and Tair at measurement locations over all days. Measurement locations 2, 5, 7, 11, 12, 17, 20, and 24 were unable to be used due to sensor malfunctions and missing data values.
| Location No. | MD | SD | R2 |
|---|---|---|---|
| 1 | 7.5 | 5.9 | 0.95 |
| 3 | 4.8 | 4.8 | 0.95 |
| 4 | 6.3 | 3.9 | 0.94 |
| 6 | 3.4 | 5.4 | 0.91 |
| 8 | 1.3 | 6.9 | 0.88 |
| 9 | 0.1 | 7.3 | 0.86 |
| 10 | −1.2 | 1.9 | 0.99 |
| 13 | 10.9 | 4.5 | 0.96 |
| 14 | 5.4 | 2.5 | 0.97 |
| 15 | 12.0 | 5.2 | 0.96 |
| 16 | 8.4 | 5.6 | 0.97 |
| 18 | 1.6 | 2.5 | 0.96 |
| 19 | 2.3 | 1.9 | 0.99 |
| 21 | 7.4 | 3.1 | 0.99 |
| 22 | 2.4 | 2.2 | 0.98 |
| 23 | 10.9 | 3.6 | 0.95 |
| 25 | 3.2 | 7.2 | 0.89 |
| 26 | 10.3 | 3.5 | 0.97 |
| 27 | 9.3 | 4.8 | 0.97 |
| 28 | 9.0 | 4.5 | 0.91 |
Table 3.
Mean difference (MD), standard deviation (SD), and linear regression correlation (R2) between the measured Tair and LST using all dates of Landsat image acquisition.
Table 3.
Mean difference (MD), standard deviation (SD), and linear regression correlation (R2) between the measured Tair and LST using all dates of Landsat image acquisition.
| Location No. | MD | SD | R2 |
|---|---|---|---|
| 1 | 1.4 | 5.2 | 0.93 |
| 3 | 4.9 | 5.2 | 0.92 |
| 4 | 2.1 | 6.2 | 0.88 |
| 6 | 3.1 | 6.5 | 0.87 |
| 8 | 1.5 | 6.9 | 0.87 |
| 9 | 1.1 | 6.2 | 0.90 |
| 10 | 2.8 | 7.9 | 0.83 |
| 13 | −1.6 | 5.4 | 0.90 |
| 14 | −1.9 | 5.0 | 0.92 |
| 15 | −1.2 | 4.5 | 0.93 |
| 16 | 1.0 | 5.3 | 0.91 |
| 18 | 1.4 | 5.5 | 0.91 |
| 19 | −1.9 | 4.9 | 0.93 |
| 21 | 0.4 | 4.9 | 0.92 |
| 22 | −2.1 | 5.0 | 0.91 |
| 23 | −3.3 | 5.3 | 0.90 |
| 25 | 7.5 | 7.7 | 0.86 |
| 26 | 1.7 | 5.5 | 0.90 |
| 27 | −1.8 | 4.8 | 0.93 |
| 28 | 0.4 | 6.8 | 0.84 |
© 2018 by the authors. Licensee MDPI, Basel, Switzerland. This article is an open access article distributed under the terms and conditions of the Creative Commons Attribution (CC BY) license (http://creativecommons.org/licenses/by/4.0/).
Share and Cite
MDPI and ACS Style
Coppernoll-Houston, D.; Potter, C. Field Measurements and Satellite Remote Sensing of Daily Soil Surface Temperature Variations in the Lower Colorado Desert of California. Climate 2018, 6, 94. https://doi.org/10.3390/cli6040094
AMA Style
Coppernoll-Houston D, Potter C. Field Measurements and Satellite Remote Sensing of Daily Soil Surface Temperature Variations in the Lower Colorado Desert of California. Climate. 2018; 6(4):94. https://doi.org/10.3390/cli6040094
Chicago/Turabian StyleCoppernoll-Houston, Dana, and Christopher Potter. 2018. "Field Measurements and Satellite Remote Sensing of Daily Soil Surface Temperature Variations in the Lower Colorado Desert of California" Climate 6, no. 4: 94. https://doi.org/10.3390/cli6040094
Note that from the first issue of 2016, this journal uses article numbers instead of page numbers. See further details here.