
Non-Intersecting Diverging Runways Separation under Emergency Avoidance Situation


1
College of Civil Aviation, Nanjing University of Aeronautics and Astronautics, Nanjing 211106, China
2
National Key Laboratory of Air Traffic Control Flight Flow Management Technology, Nanjing 211106, China
3
The 28th Research Institute of China Electronics Technology Group Corporation, Nanjing 210007, China
4
National Key Laboratory of Air Traffic Management Technology, Nanjing 210007, China
*
Author to whom correspondence should be addressed.
Aerospace 2023, 10(2), 131; https://doi.org/10.3390/aerospace10020131
Submission received: 5 December 2022
/
Revised: 24 January 2023
/
Accepted: 25 January 2023
/
Published: 31 January 2023
(This article belongs to the Collection Air Transportation—Operations and Management)
Abstract
:Although runway separation, based on the probability of collision, has been studied for decades, the mathematical methods proposed by the majority of studies cannot handle complex situations, such as the operation of non-intersecting diverging runways at an airport with multiple runways. By applying a combination method of computer simulation and collision probability calculation, the arrival and departure window (ADW) separation for non-intersecting diverging runways of a multi-runway airport was studied under the emergency avoidance (EA) situation. Combining the example of runways 01L/19R and 11L of Beijing Daxing Airport, the ADW separation settings for the airport’s northward and southward operations were determined to meet the target level of safety. Moreover, the effects of range-type parameters on the ADW separation were quantified. When the EA maximum speed limit and EA minimum climb rate were 200 kt (102.9 m/s) and 10%, respectively, the results were such that no ADW separation was required for northward operation, and the ADW separation was from 3.2 km to 7.1 km for southward operation. Furthermore, the results showed that the proposed method could more accurately describe the nominal trajectories of aircraft and improve the precision of collision probability calculation. Meanwhile, the sensitivity analysis method for range-type parameters could help airports and air traffic control facilities to set reasonable constraints to improve theoretical runway capacity, while satisfying practical feasibility.
1. Introduction
In recent years, the Chinese civil aviation industry has developed rapidly. By the end of 2021, there were 248 commercial airports in China. Although the vast majority of airports have single-runway or parallel double-runway configurations, there are also several multi-runway airports, such as Beijing Capital International Airport, Beijing Daxing International Airport (PKX), Shanghai Pudong International Airport, Guangzhou Baiyun International Airport, etc. Regardless of whether airports are single-runway, parallel double-runway, or multi-runway, the setting of runway operation separation must determine the target level of safety [1] (TLS) first, and then calculate the collision probability (CP) between aircraft. Next, it is necessary to compare whether the CP meets the limit of TLS. Usually, the TLS value officially used by International Civil Aviation Organization (ICAO) is fatal accidents per flight hour [2].
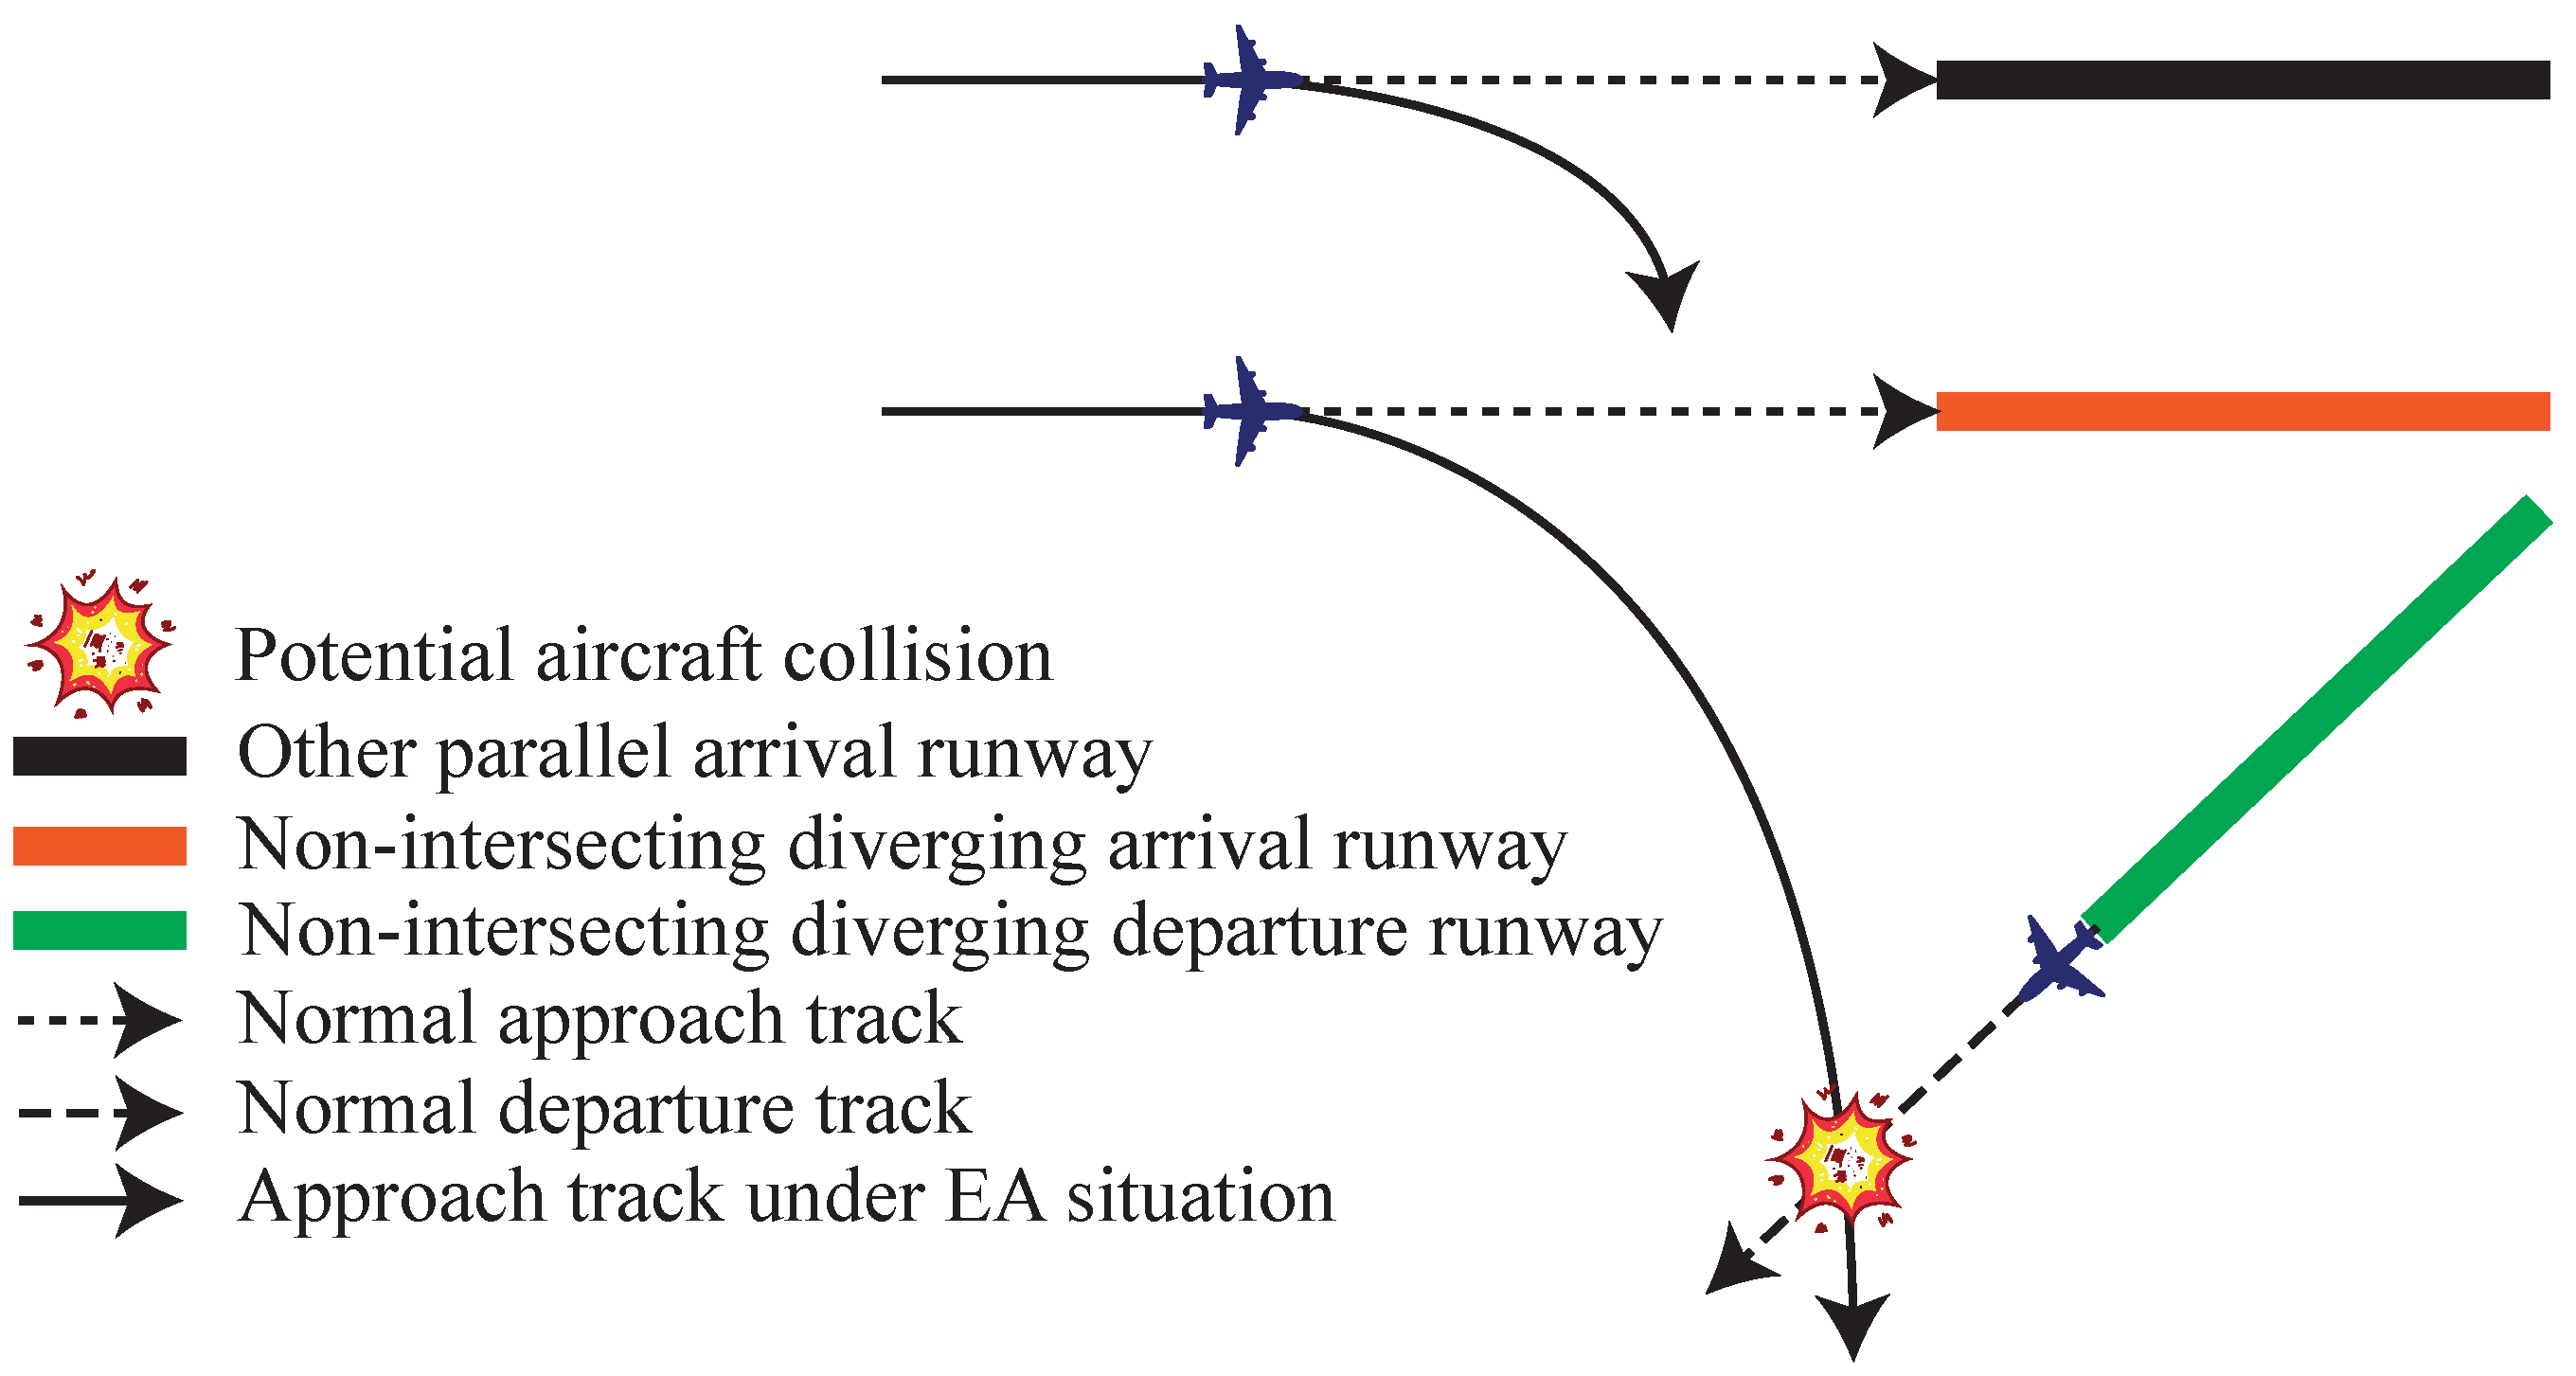
Suppose an airport has two or more parallel runways. A set of non-intersecting diverging (NID) runways is comprised of one parallel runway for arrival and one inclined runway for departure. Under the circumstances, an emergency avoidance (EA) situation on NID runways may increase the possibility of an aircraft collision. Figure 1 illustrates that when the arrival aircraft to one parallel arrival runway deflects in the direction of the other parallel arrival runway, the arrival aircraft to the other parallel arrival runway must also deflect in the same direction. However, it could potentially collide with departure aircraft from the NID runway. Figure 1 depicts an EA situation, which can be thought of as a special type of unstable approach [3,4] that occurs at airports with NID runways and multiple runways.
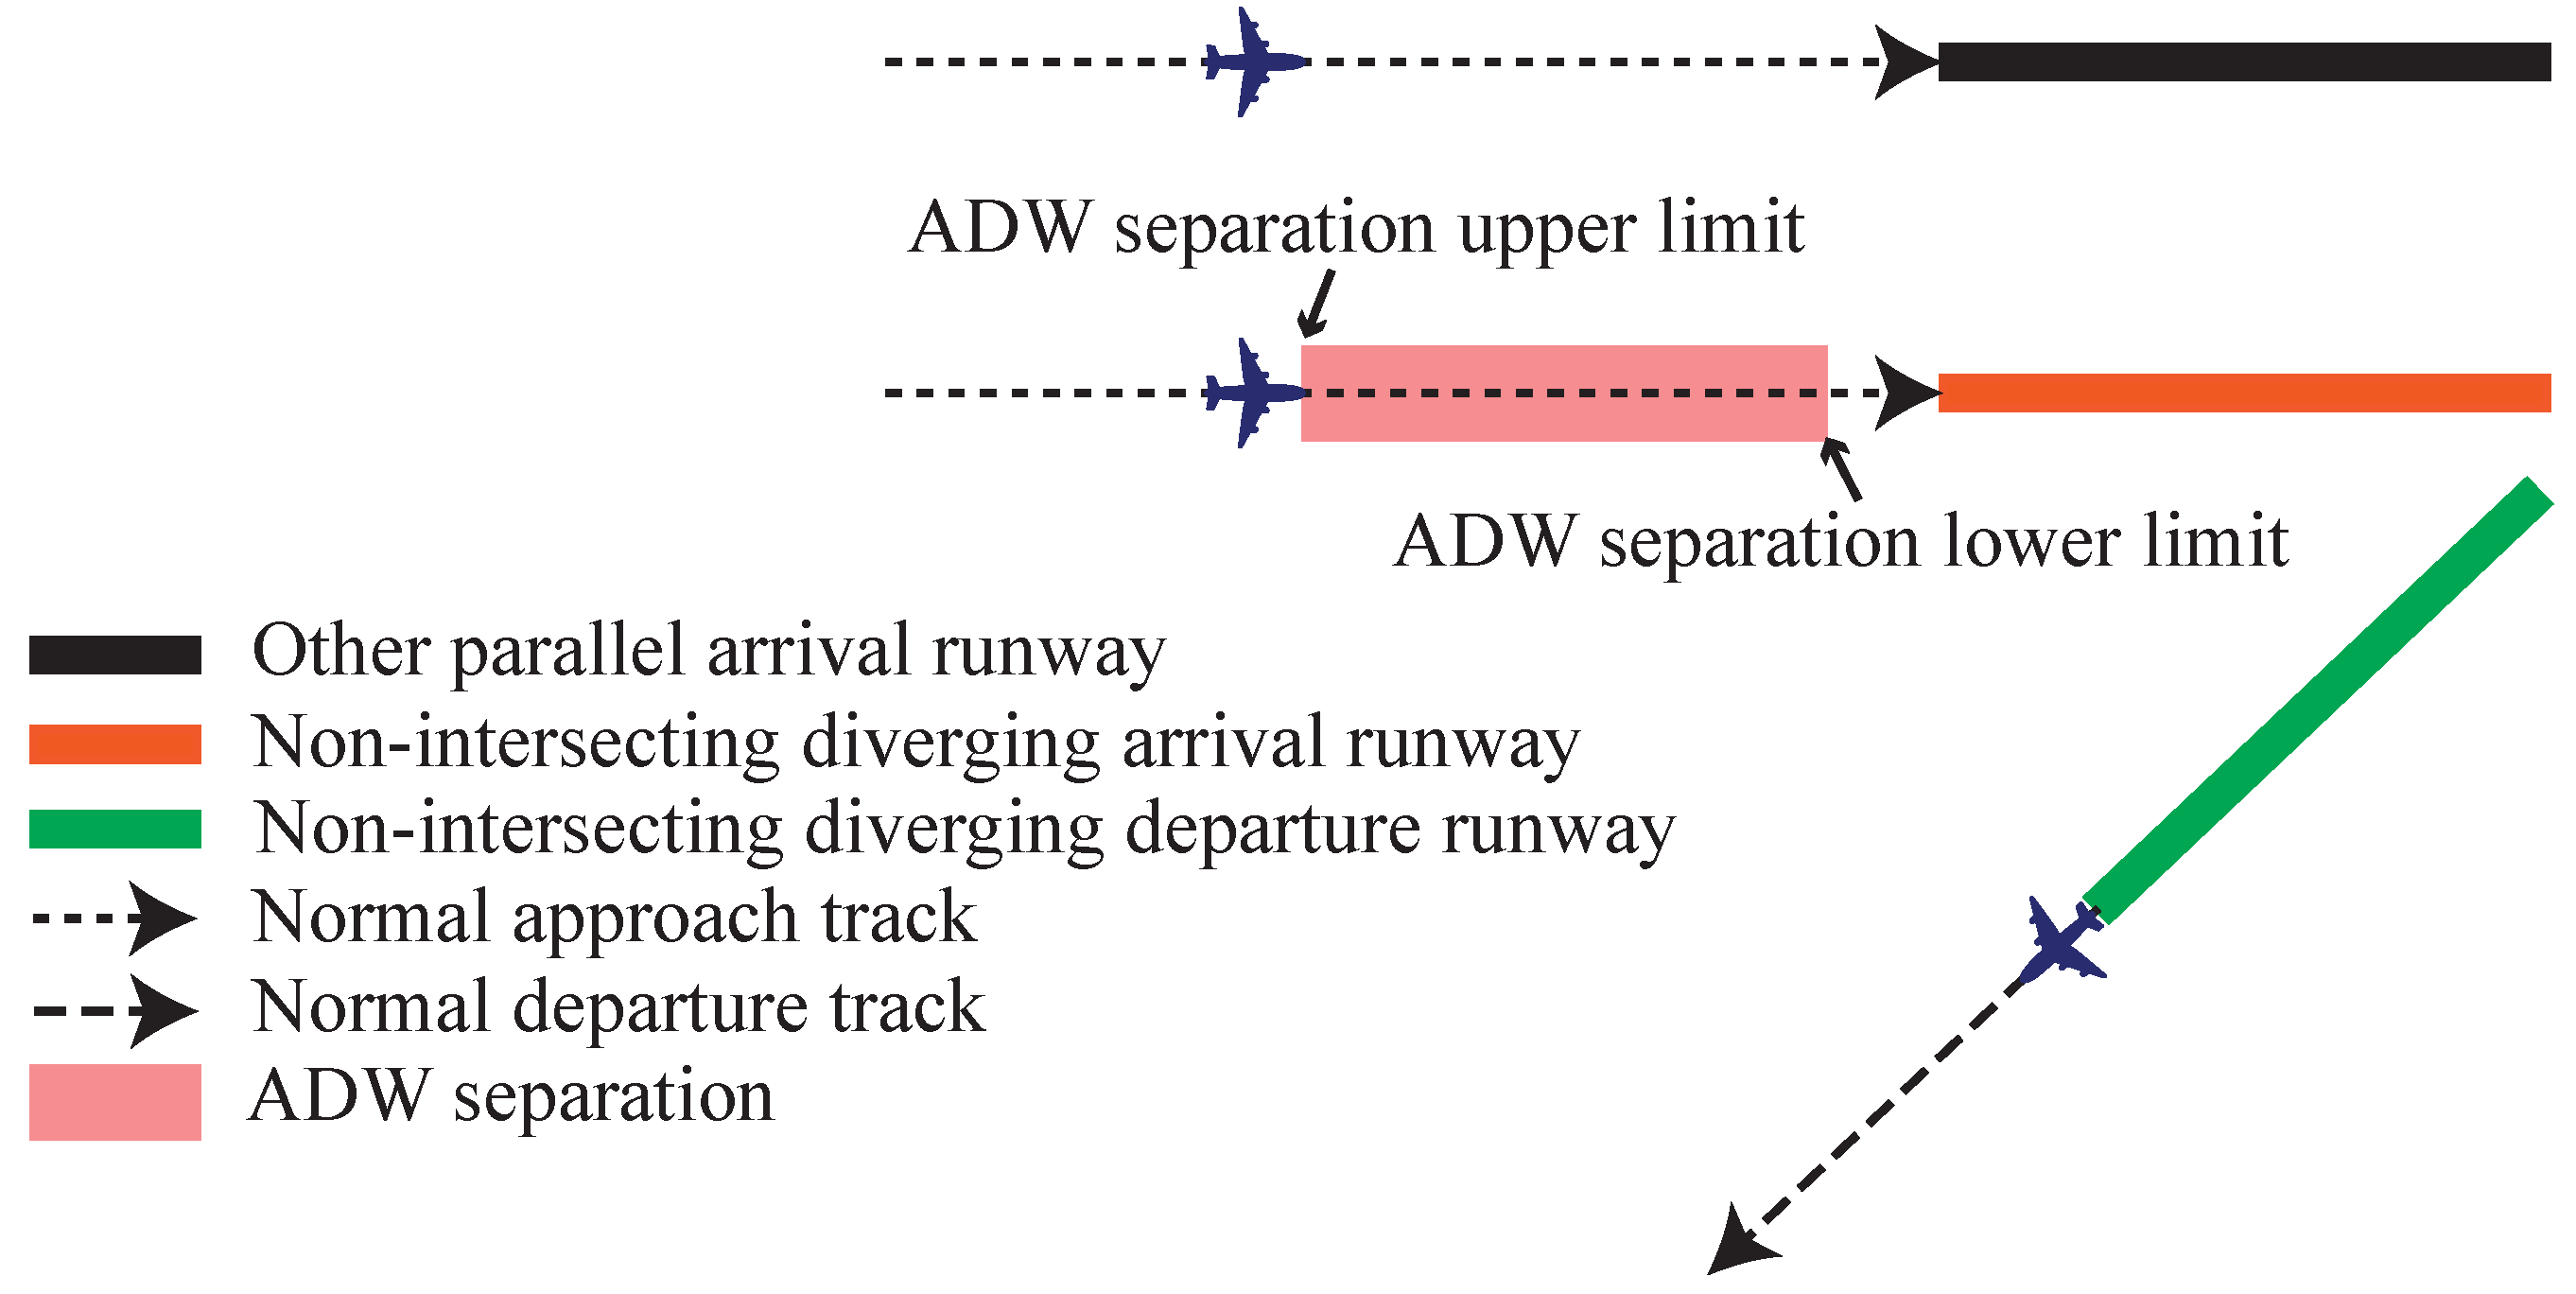
For such a group of NID arrival and departure runways, it is necessary to set the arrival and departure window [5] (ADW) separation so that the distance between the arrival aircraft and the departure aircraft of this group of runways satisfies the TLS. As shown in Figure 2, a separation is set between a set of NID arrival and departure runways, which is represented by the upper limit and the lower limit of the ADW separation, and the numerical expression is the length from the landing threshold of the runway. Departure aircraft are not allowed to start take-off rolls when the arrival aircraft is between the upper and lower limits of ADW separation. Departure aircraft are only allowed to start take-off rolls when no arrival aircraft are positioned between the range of ADW separation. Although the trajectories of the arrival and departure aircraft intersect, by setting the ADW separation, the arrival and departure aircraft are staggered in the time dimension to ensure that the CP meets the TLS limit.
For a long time, CP calculation under various application scenarios has been a hot spot in the research of aircraft safety operation, but there is no research on the application scenario of NID runways under the EA situation. In terms of application scenarios, these cover parallel runways [6], cross routes [7], opposite routes [8], air corridors [9], and so on. Model construction [10] includes the classic Reich model [11,12,13], extended Reich model [14], Gas Law model [15], Monte Carlo simulation model [8,16], and so on. The Reich model [11,12,13] has almost become the fundamental paradigm of subsequent CP research; the intersection of the circumscribed cuboids of the aircraft shapes is regarded as the basis for determining whether or not an aircraft will collide. In order to improve the calculation speed, this paper adopted and optimized this paradigm in CP calculation. The Gas Law model [15] treats aircraft as gas molecules moving randomly in airspace, but the accuracy of this model is difficult to guarantee. When the probability distributions of the original parameters are known and complete, the Monte Carlo simulation model [8,16] can, in principle, be applied to the CP calculation in any scenario, but the completeness of the data cannot be guaranteed when applied to engineering practice, especially EA, etc. At the same time, it is unrealistic to try to describe the overall path of the aircraft with pure mathematical equations [10]. In actual operation, the operation of aircraft is affected by the comprehensive influence of nonlinear and complex factors such as aircraft performance, controllers, pilots, and the surrounding environment, etc. The overall path cannot be perfectly expressed using mathematical equations. Therefore, in this paper, computer simulation and CP calculation were combined, which not only solved the comprehensive influence of complex nonlinear factors, but also considered the probability problem with performance and was used to study the CP problem between aircraft in the case of EA.
Given the above EA situation, this paper first established the EA incidence rate calculation method. It, then, proposed the calculation method of the required CP based on the incidence rate. Secondly, to solve the problem that pure mathematical equations cannot accurately express the trajectories of the aircraft, a computer simulation model was established to obtain the nominal trajectories of the simulated aircraft. Then, according to the aircraft’s nominal trajectories and the aircraft’s distribution uncertainties in the horizontal and vertical dimensions, a CP calculation method, based on the Reich model [11,12,13], was proposed. Finally, taking the NID runways of PKX as an example, the validity of the established models and methods were verified, and a sensitivity analysis was carried out according to the calculation results. The influence of critical parameters and the extended application significance are also discussed in detail.
2. Models and Methods
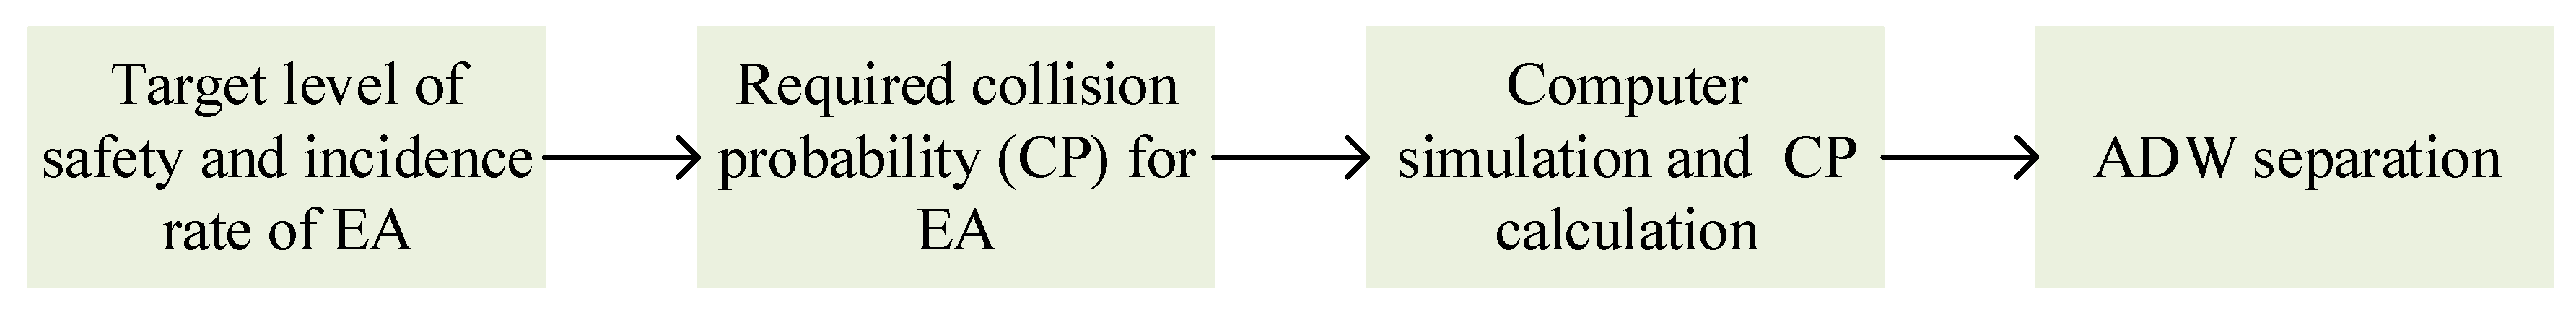
When carrying out the safety evaluation of aircraft operation separation, the collision probability between aircraft refers to the TLS specified by ICAO, which is less than, or equal to, fatal accidents per flight hour [2]. However, due to the extremely low incidence rate of EA, the CP cannot be directly calculated by ignoring the incidence rate of EA. Therefore, it is necessary to first calculate the required CP based on the incidence rate of EA, then use computer simulation to obtain the nominal trajectory of each aircraft, and then calculate the CP according to the distribution deviation of the aircraft in the horizontal and vertical dimensions. Finally, under different separation constraints, the computer simulation and CP calculation process are repeated until the CP obtained is less than, or equal to, the required CP in the case of EA. Figure 3 shows a schematic diagram of the above calculation logic.
2.1. EA Incidence Rate and Required CP
Since EA is an uncommon but essential situation, it is necessary to incorporate the incidence of EA into the probability calculation. The relationship between the incidence rate of EA, required CP, the incidence rate of non-EA, CP of non-EA, and the TLS is shown as:
where e is the incidence rate of EA, p is the required CP, is the incidence rate of non-EA, is the CP of non-EA, and is the TLS.
Typically, an airport does not experience an EA situation involving an arrival aircraft for several or even ten years. However, according to Murphy’s Law [17], the incidence rate of EA is still greater than 0. Suppose one or more EA situations occurred at an airport. In this case, the EA incidence rate could be calculated by dividing the number of EA incidents by the total number of aircraft that landed at the airport. However, if the EA situation never occurred at a particular airport, a reliability-based extrapolation of the EA incidence rate is necessary.
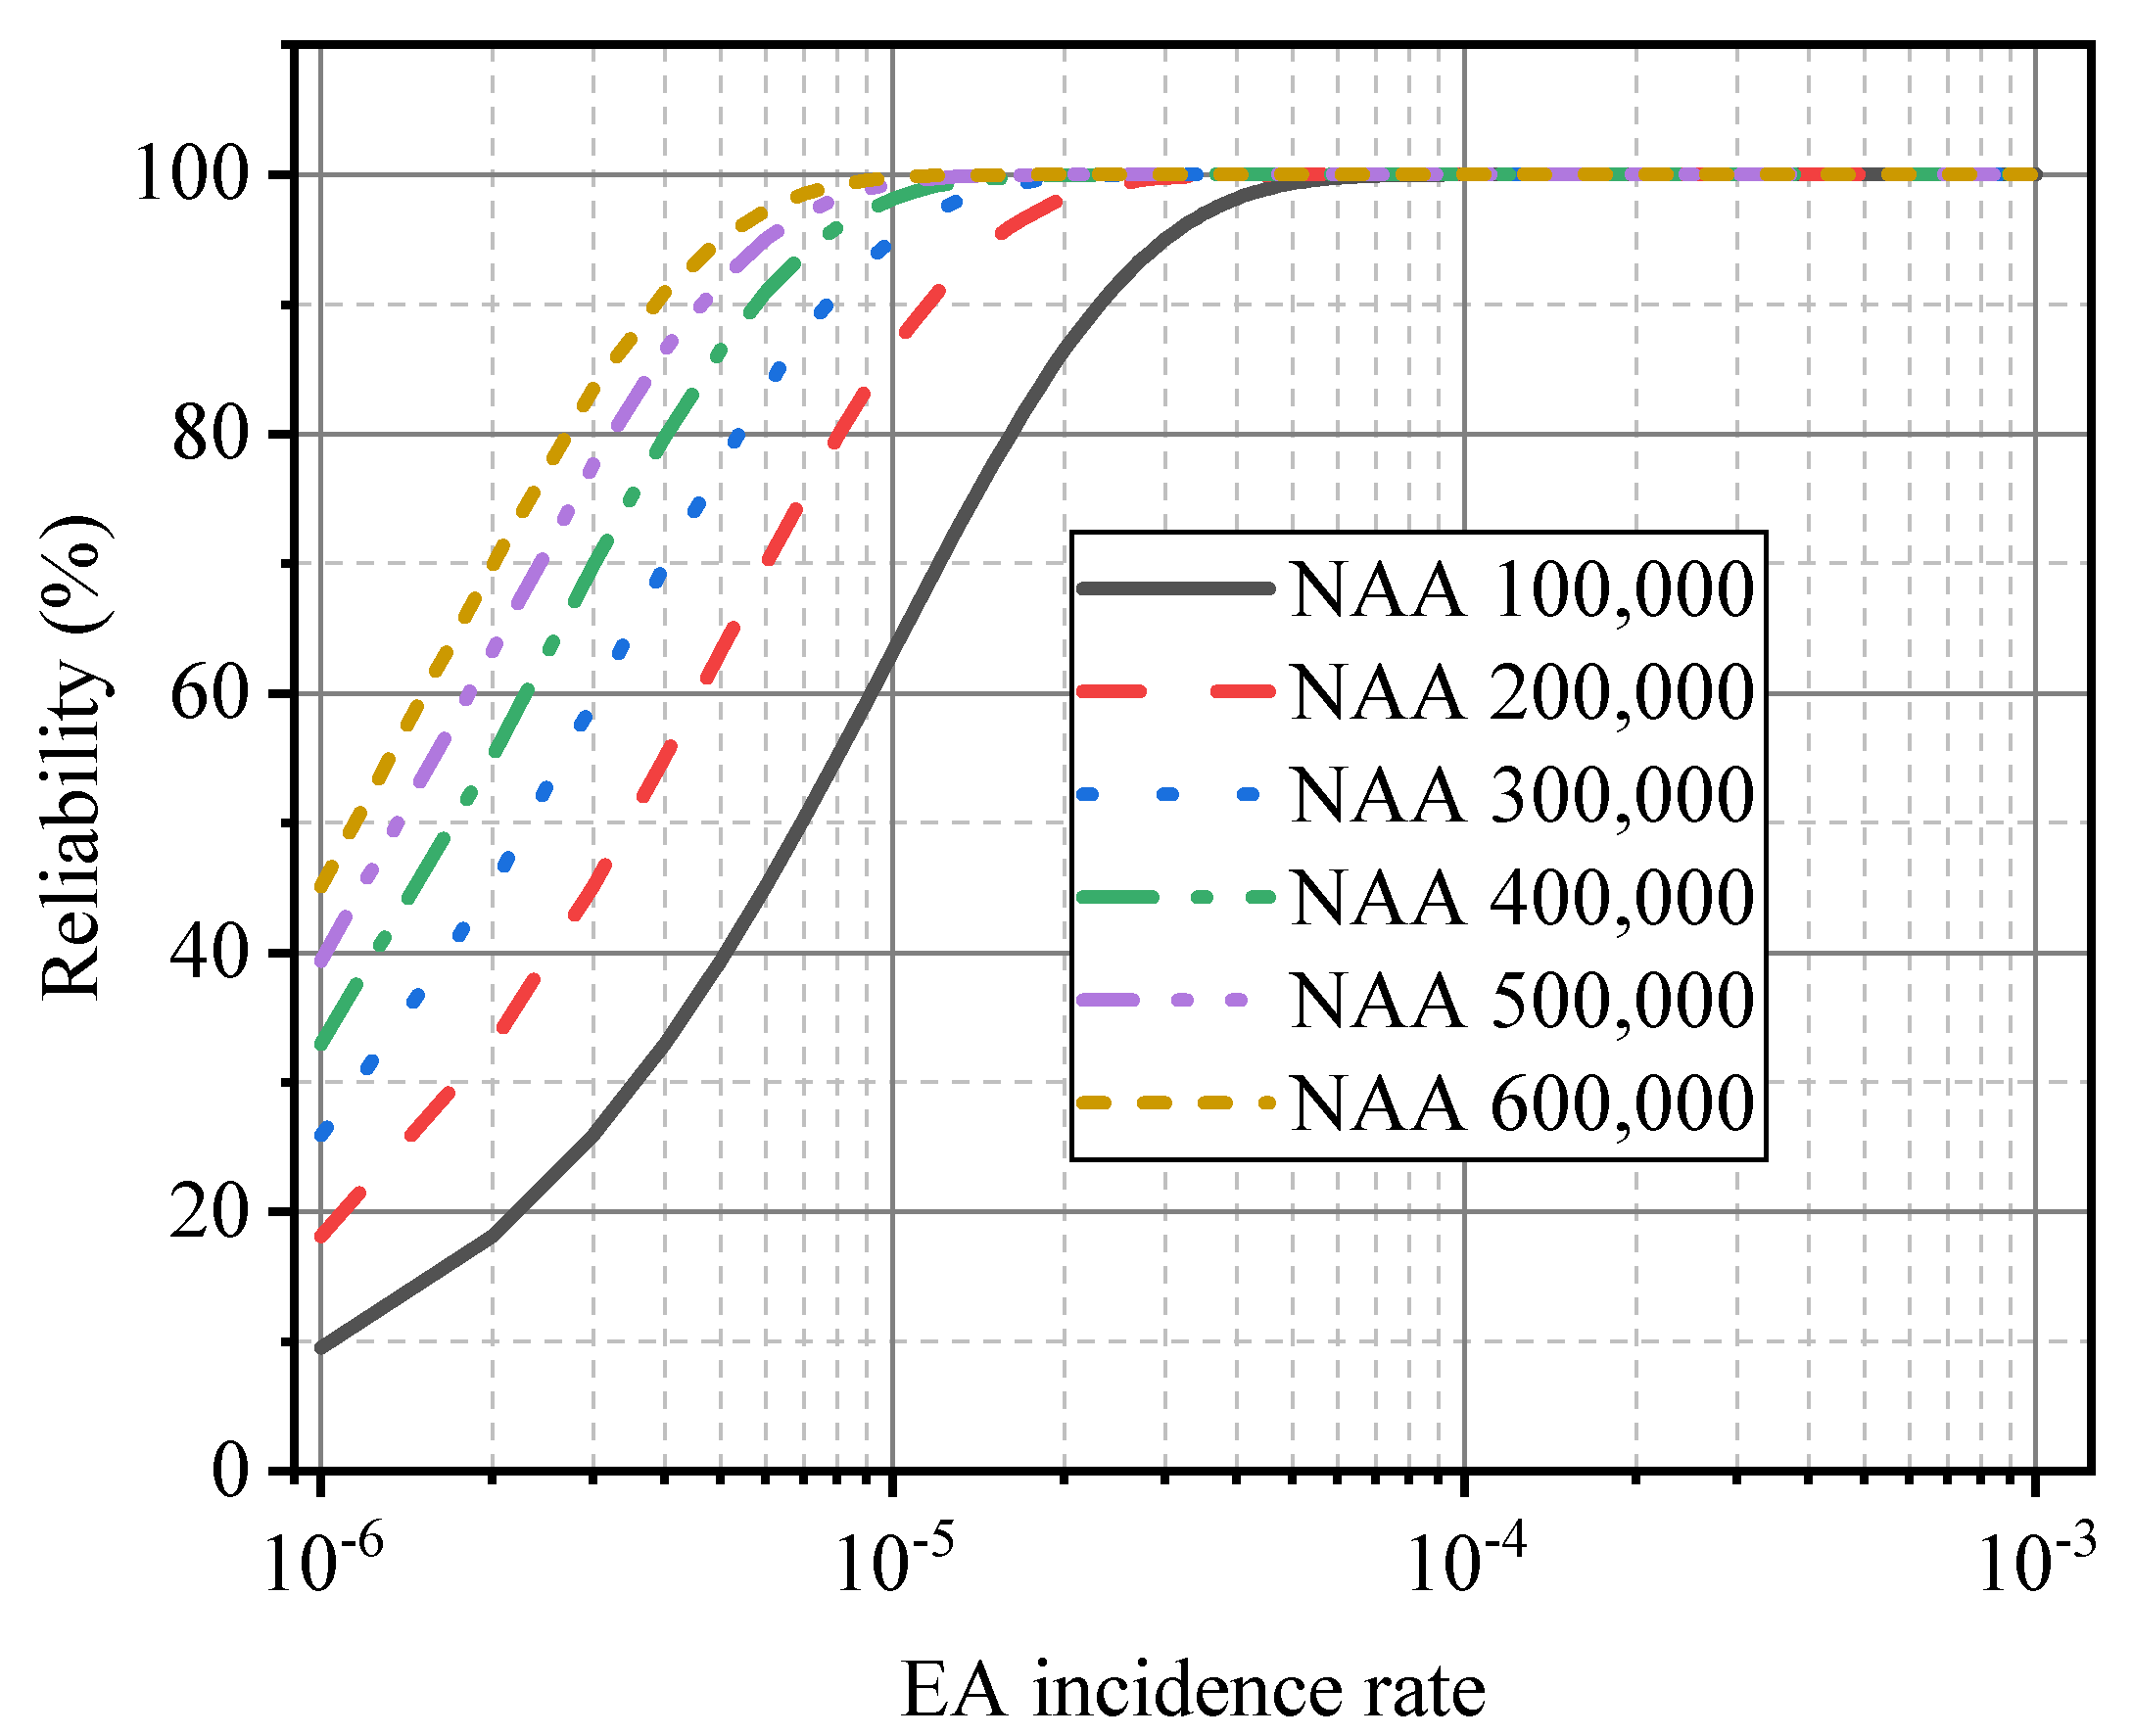
Assuming that a total number of k aircraft have landed at an airport, if the EA incidence rate is e, then there is a probability that at least one EA will occur with k aircraft. However, if the airport has never had an EA situation, then there is at least reliability that the actual EA rate at that airport is less than e. Figure 4 shows the relationship between the incidence rate of EA and reliability under different arrival aircraft volumes.
According to Figure 4, if the EA situation has never occurred at the airport, under the premise of the same reliability, with the increase in the number of arrival aircraft, the incidence rate of EA gradually decreases. However, the magnitude of the decrement gradually becomes smaller. Likewise, under the premise of the same incidence rate of EA, with an increase in the number of arrival aircraft, the reliability gradually increases, but the increase is gradually more minor.
2.2. Computer-Simulated Aircraft Nominal Trajectory
In the literature of previous researchers on the probability of aircraft collision, the entire aircraft trajectory is expressed as a collection of pure mathematical equations. However, this form is difficult to express when the aircraft’s trajectory is more complex. Moreover, this form cannot be guaranteed to be appropriate to the actual operation situation, so completeness and accuracy are difficult to ensure. For example, the horizontal position of the aircraft at the next moment is jointly determined by many complex factors, such as the horizontal position of the last moment, the airspeed vector, the turning slope and turning rate, the wind speed vector in three-dimensional (3D) space, the atmospheric pressure and temperature, etc. It is unrealistic to completely describe the aircraft’s trajectory by simply using piece-wise functions and other forms. Therefore, to improve the accuracy of the nominal trajectory of the aircraft, it is necessary to use the idea of recursion and iteration [18,19] to continuously update the specific state of the aircraft at the next moment. According to the numerous parameters of the last moment, the update process is continuously recurring until the termination condition of the iterative update is triggered. A practical idea to implement this recursive and iterative update is through computer simulation.
Parameters such as horizontal position scalar and altitude scalar, wind speed vector at the 3D position, horizontal airspeed vector, vertical climb rate scalar, and horizontal ground speed vector at each instant are crucial to the computer simulation calculation of aircraft trajectory. The calculation process of the aircraft’s state at the time is briefly described as follows:
where and are the horizontal position of the aircraft f at time ; is the altitude of the aircraft f at time ; and are the ground speed of the aircraft f at time t; is the vertical speed compared to ground of the aircraft f at time t.
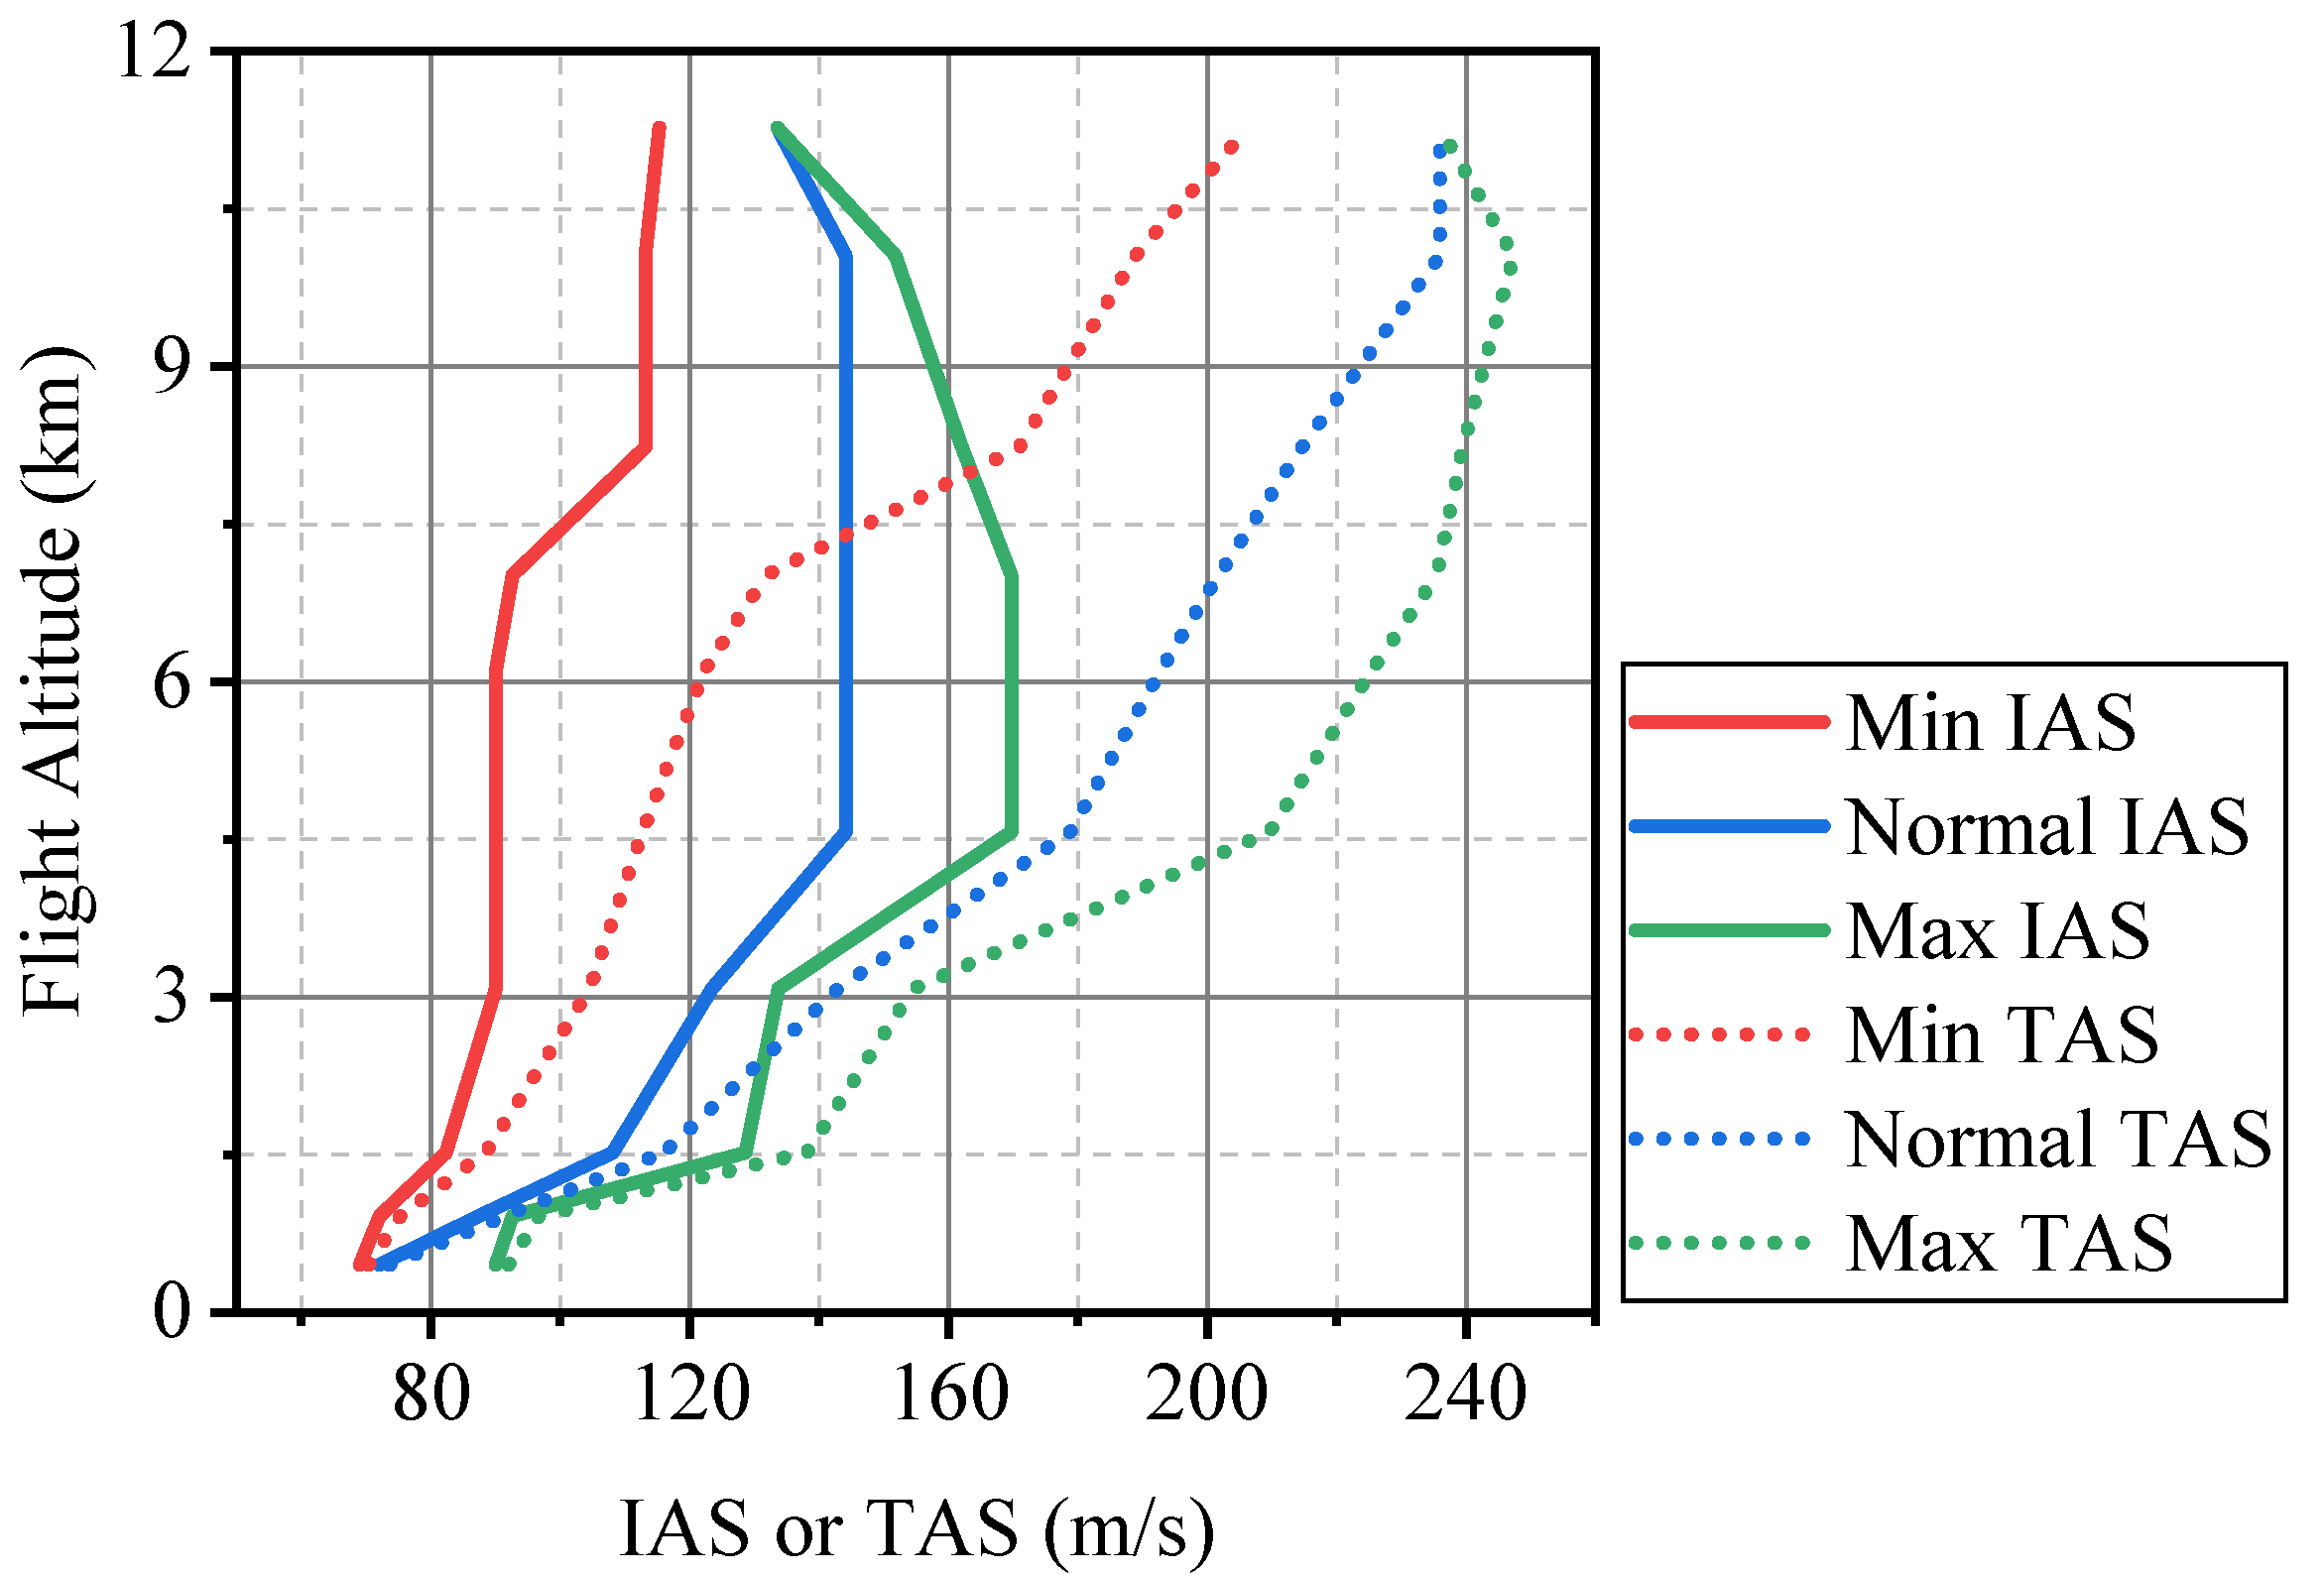
The step-by-step transitions of indicated airspeed (IAS), calibrated airspeed, equivalent airspeed, and true airspeed (TAS) are calculated according to the method of [20]. For instance, in the case of the international standard atmosphere (ISA) [21], when the aircraft A320 is in the descending attitude, the minimum, normal and maximum values of the IAS and TAS, corresponding to different flight levels, are shown in Figure 5. The aircraft A320 also has a corresponding form similar to Figure 5 in the level flight attitude and the climbing attitude.
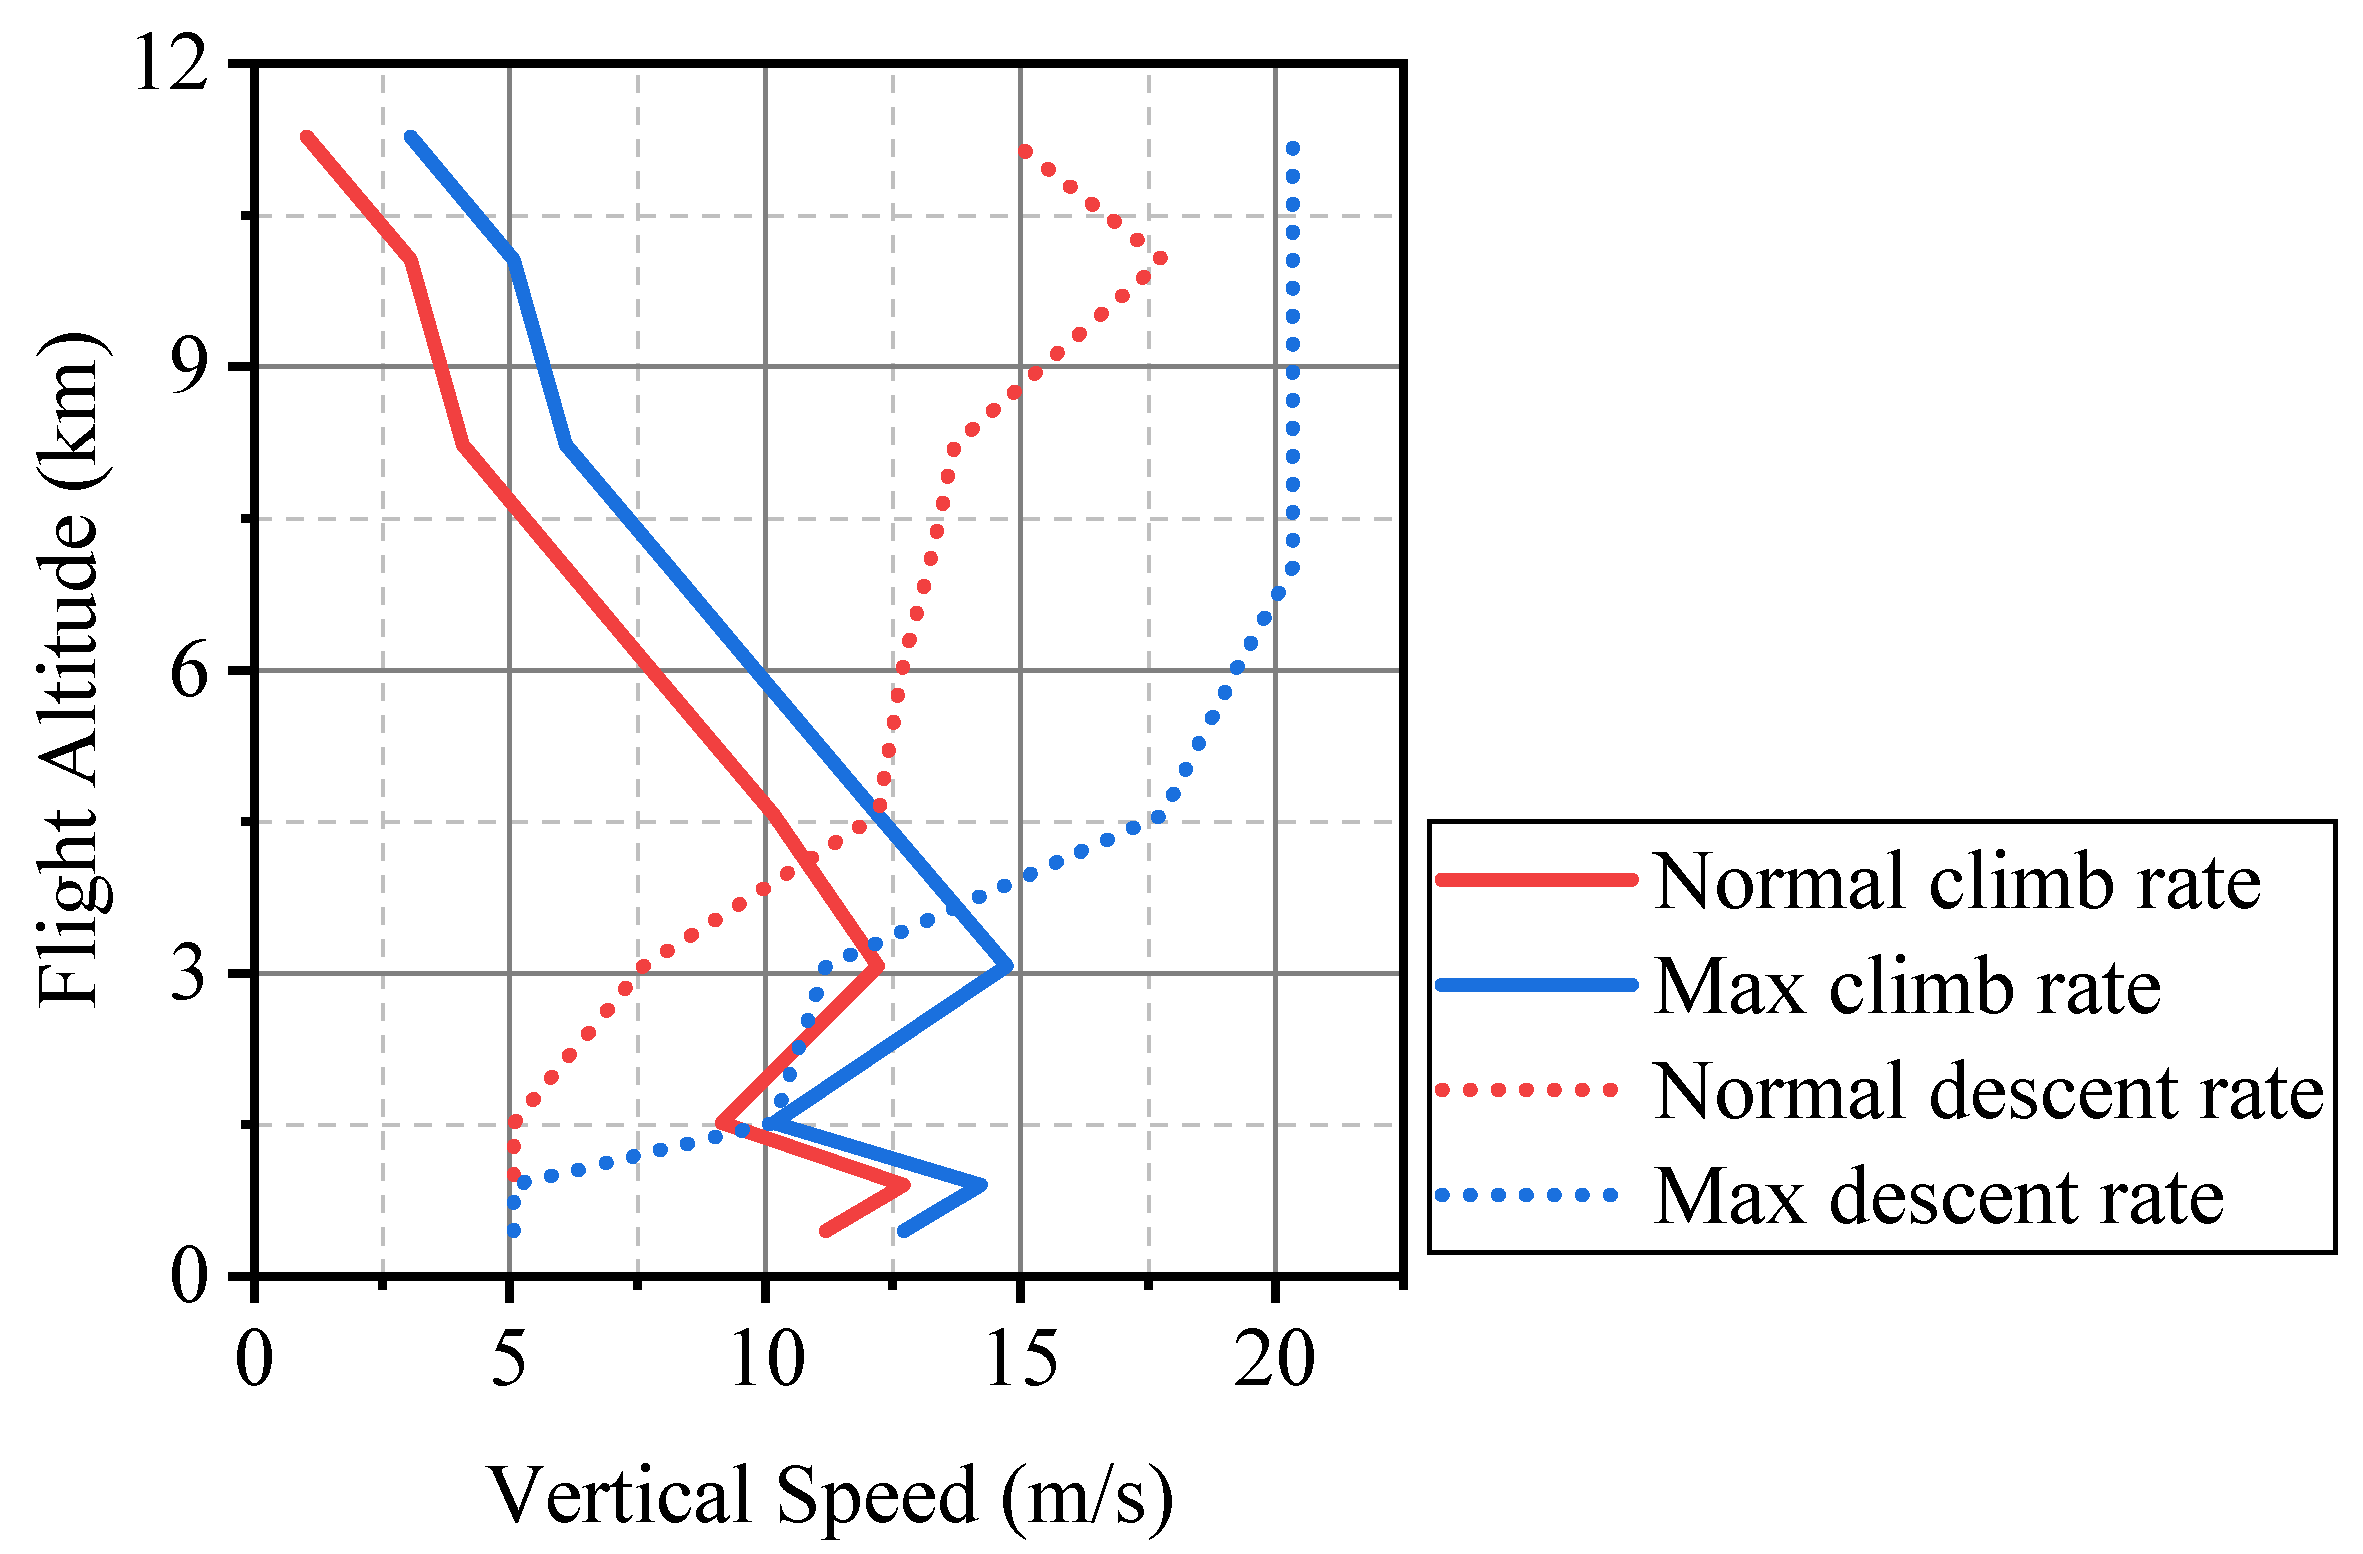
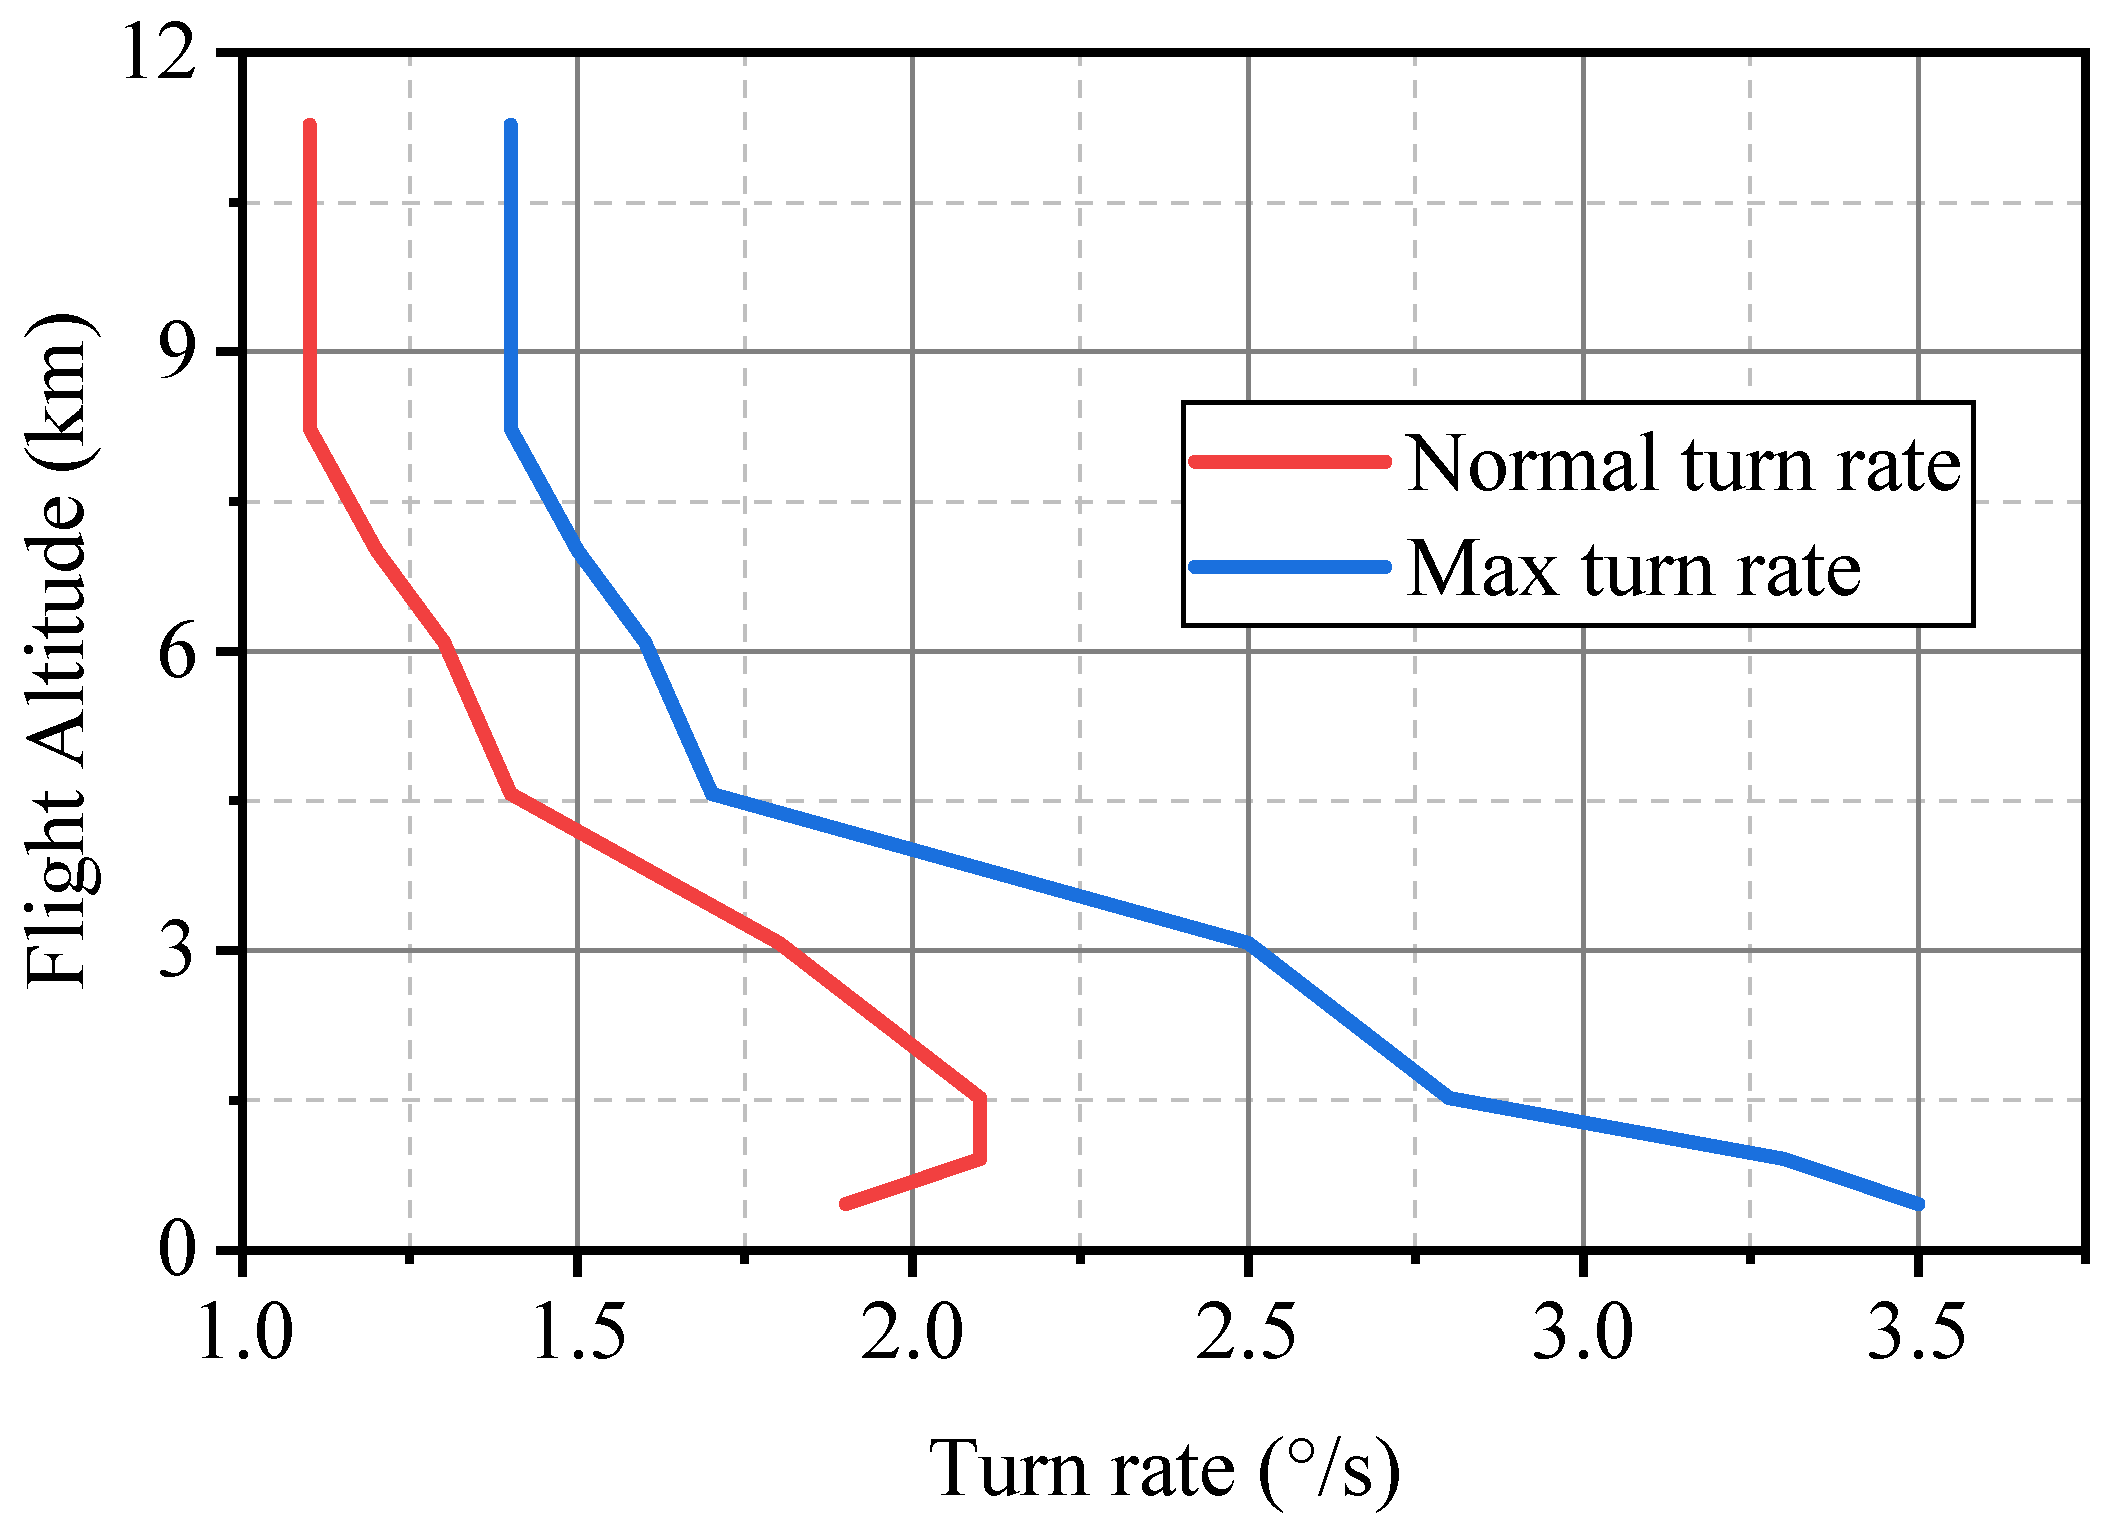
In the same way, taking the aircraft A320 as an example, the climb rate, descent rate, and turn rate under ISA are shown in Figure 6 and Figure 7.
The performance values of different aircraft types are used as the input basis for computer simulation. Normal performance values for IAS, TAS, climb rate, descent rate, and turn rate, according to different flight levels, are commonly preferred. In certain instances, however, parameters between the minimum and maximum performance values may also be used. For instance, once the approach procedure has been established, the aircraft descend using the specified descent rate based on the glide slope. Obviously, the rate of descent corresponding to the glide slope must fall within the maximum rate of descent. In another example, when an aircraft turns under an EA situation, it typically utilizes the maximum turn speed permitted by the aircraft type.
According to the aircraft’s horizontal position scalar, altitude scalar, nominal atmospheric pressure and air density at the 3D position, aircraft performance, aircraft climb/descent/turn intent at time , update the aircraft’s horizontal and vertical airspeed at time :
where is the horizontal ground speed vector of aircraft f at time ; is the horizontal TAS vector of aircraft f at time ; and are the wind speed vector at the 3D position of aircraft f at time ; and are the vertical speed compared to ground and vertical TAS of aircraft f at time . A positive value indicates a climb, and a negative value indicates a descent.
Furthermore, the pitch, yaw, and roll angles of the aircraft can also be calculated at each simulation time frame.
where , , and represent the pitch, yaw, and roll angles of aircraft f at time , respectively. represents the angle of attack of the aircraft f, which is related to the structure of the aircraft. Taking the still wind condition as an example, the pitch angle is the sum of the climb angle and the attack angle at time . The yaw angle is actually the orientation of the aircraft’s longitudinal axis under the plane projection at time . The roll angle is related to the turn rate of the aircraft f at time . is the turn rate in radian of the aircraft f at time , and g is the constant acceleration due to gravity.
Overall, the update sequence for various types of aircraft state parameters is a loop of “position type to speed type” until the iterative update’s termination condition is met. In the case of the EA studied in this paper, the termination condition was that the arrival aircraft completed its turn of EA and moved away from the departure aircraft gradually. The deduction process mentioned above involves multiple nonlinear parameters. When there are numerous simulation time frames, it is hard to use pure math formulae to describe the nominal trajectories of the simulated aircraft. However, the proposed simulation method in this paper could better solve this problem and accurately describe the trajectories.
2.3. CP Calculation
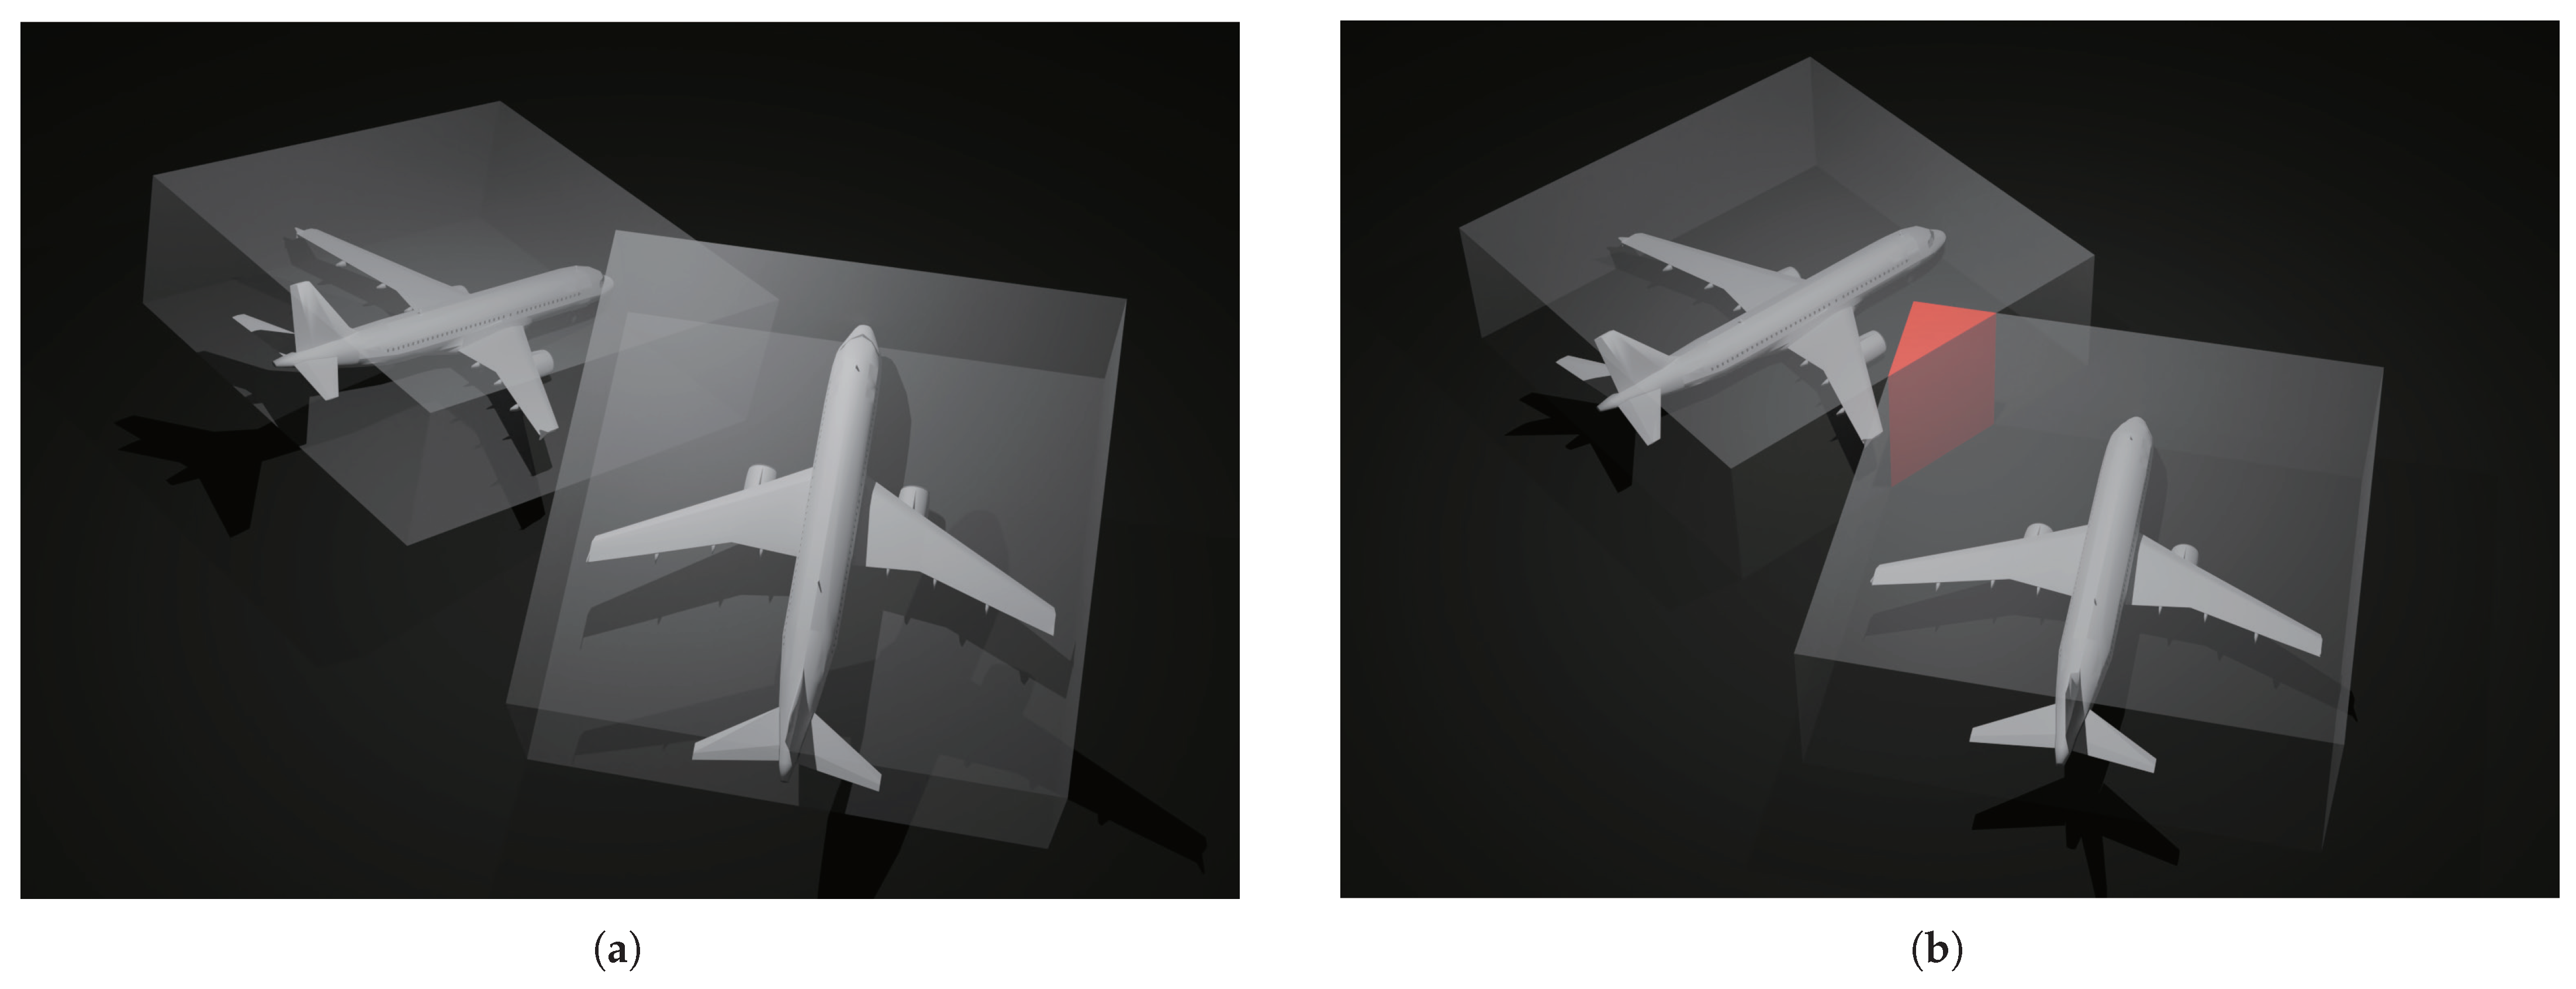
Most CP calculation methods, based on the Reich model [11,12,13], regard the circumscribed cuboid of the aircraft shape as the collision volume. This serves as the basis for judging whether there a collision between aircraft is likely. However, these methods cannot accurately determine whether an actual collision occurs. As shown in Figure 8a, considering the aircraft’s pitch angle, the circumscribed cuboids do not intersect when one aircraft descends and the other climbs. Nevertheless, the circumscribed cuboids intersect if not considering the aircraft’s pitch angle, as shown in Figure 8b. Moreover, if the situation of the two aircraft is similar to that in Figure 8b, although the circumscribed cuboids intersect, the aircraft do not really collide with each other. Therefore, this paper proposes a CP calculation method based on the actual aircraft shape, while properly considering the calculation speed and performance requirements.
According to the nominal trajectories of the aircraft obtained by computer simulation, combined with the probability distribution (usually normal distribution) of the aircraft in the horizontal and vertical ranges, the CP between the two aircraft is calculated.
The horizontal, vertical, and Euclidean distances of the centroids of two aircraft and at time t are shown as:
where , , and represent the horizontal, vertical, and Euclidean distances between the centroids of aircraft and at time t, respectively.
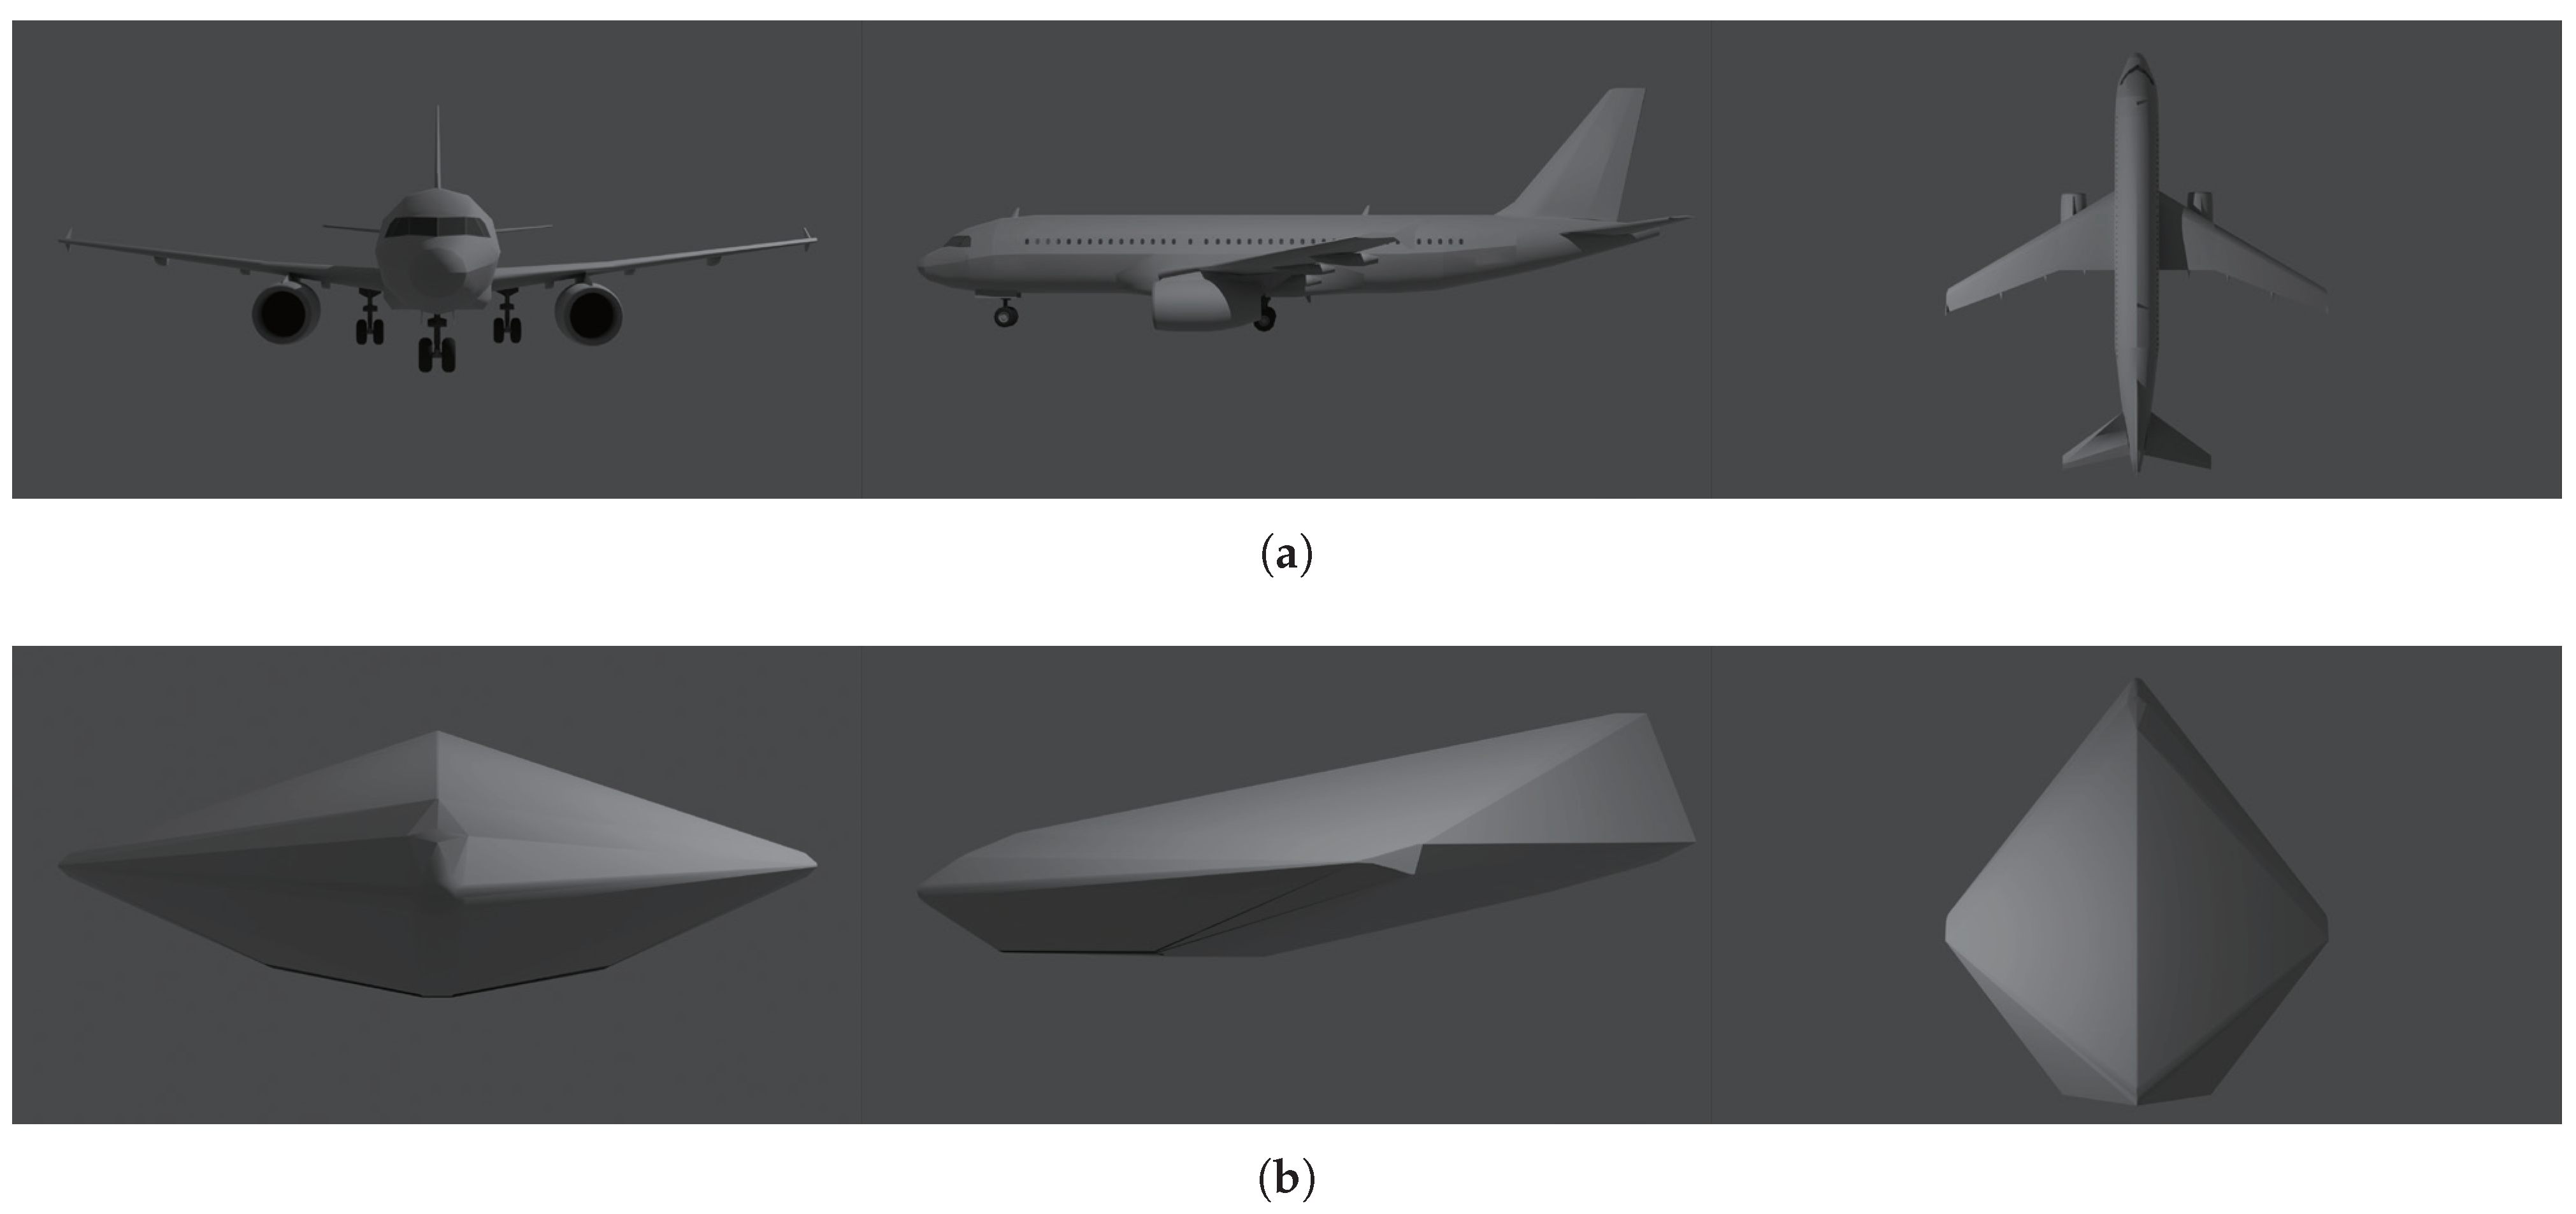
When the actual shapes of various aircraft models are combined with computer 3D design technology [22], as, for example, for aircraft A320, shown in Figure 9a, the exquisite 3D model is created. For aircraft , assuming that the set of all vertices of the 3D model is , the set of vertices farthest from the centroid of the aircraft among all vertices can be calculated (the number of the farthest vertices may be greater than 1):
where represents the set of vertices farthest from the centroid of aircraft; v is one of the vertices of the aircraft’s 3D model; , , and represent the the x-coordinate, y-coordinate, and z-coordinate of the world coordinate system of vertice v in the aircraft’s 3D model; , , and represent the the x-coordinate, y-coordinate, and z-coordinate of the world coordinate system of the centroid in the aircraft’s 3D model.
Correspondingly, the farthest distance between all vertices of the aircraft 3D model and the centroid is:
where is the farthest distance between all vertices of the aircraft’s 3D model and the centroid.
For different types of aircraft 3D models, different can be calculated. For example, when the studied aircraft are and , and can be calculated according to the Equations (7) and (8). Sum and :
where represents the maximum value for judging that aircraft and have the possibility of collision.
Taking the aircraft A320 as an example, the high-precision 3D model is shown in Figure 9a. Based on the 3D convex hull generation method [23], the convex hull of the aircraft A320 is shown in Figure 9b.
To sum up, in order to ensure the calculation accuracy of CP and adequately deal with the calculation speed, the algorithm for calculating the CP of two aircraft is shown in Algorithm 1. In order to improve the calculation speed, the critical steps of Algorithm 1 include the followings:
- For aircraft and , first calculate the Euclidean distance between the centroids of the two aircraft. If the distance is greater than, or equal to, , it is impossible for the two aircraft to collide anyway; otherwise, the next step of judgment is performed.
- According to the dynamic position and attitude of aircraft and , the established 3D convex hulls of the aircraft are updated. If the 3D convex hulls do not intersect, it is absolutely impossible for the two aircraft to collide; otherwise, proceed to the next step.
- Finally, compare whether the actual 3D models of aircraft and intersect to determine whether the two aircraft collide.
Calculating the Euclidean distance is significantly faster than calculating the intersection of 3D convex hulls. Moreover, since the number of polygons of 3D convex hull is markedly less than that of the high-precision 3D model of the aircraft, calculating the intersection of 3D convex hulls is considerably faster than calculating the intersection of the actual 3D models of the aircraft.
| Algorithm 1 Calculate CP of two aircraft. |
|
3. Case Study and Results
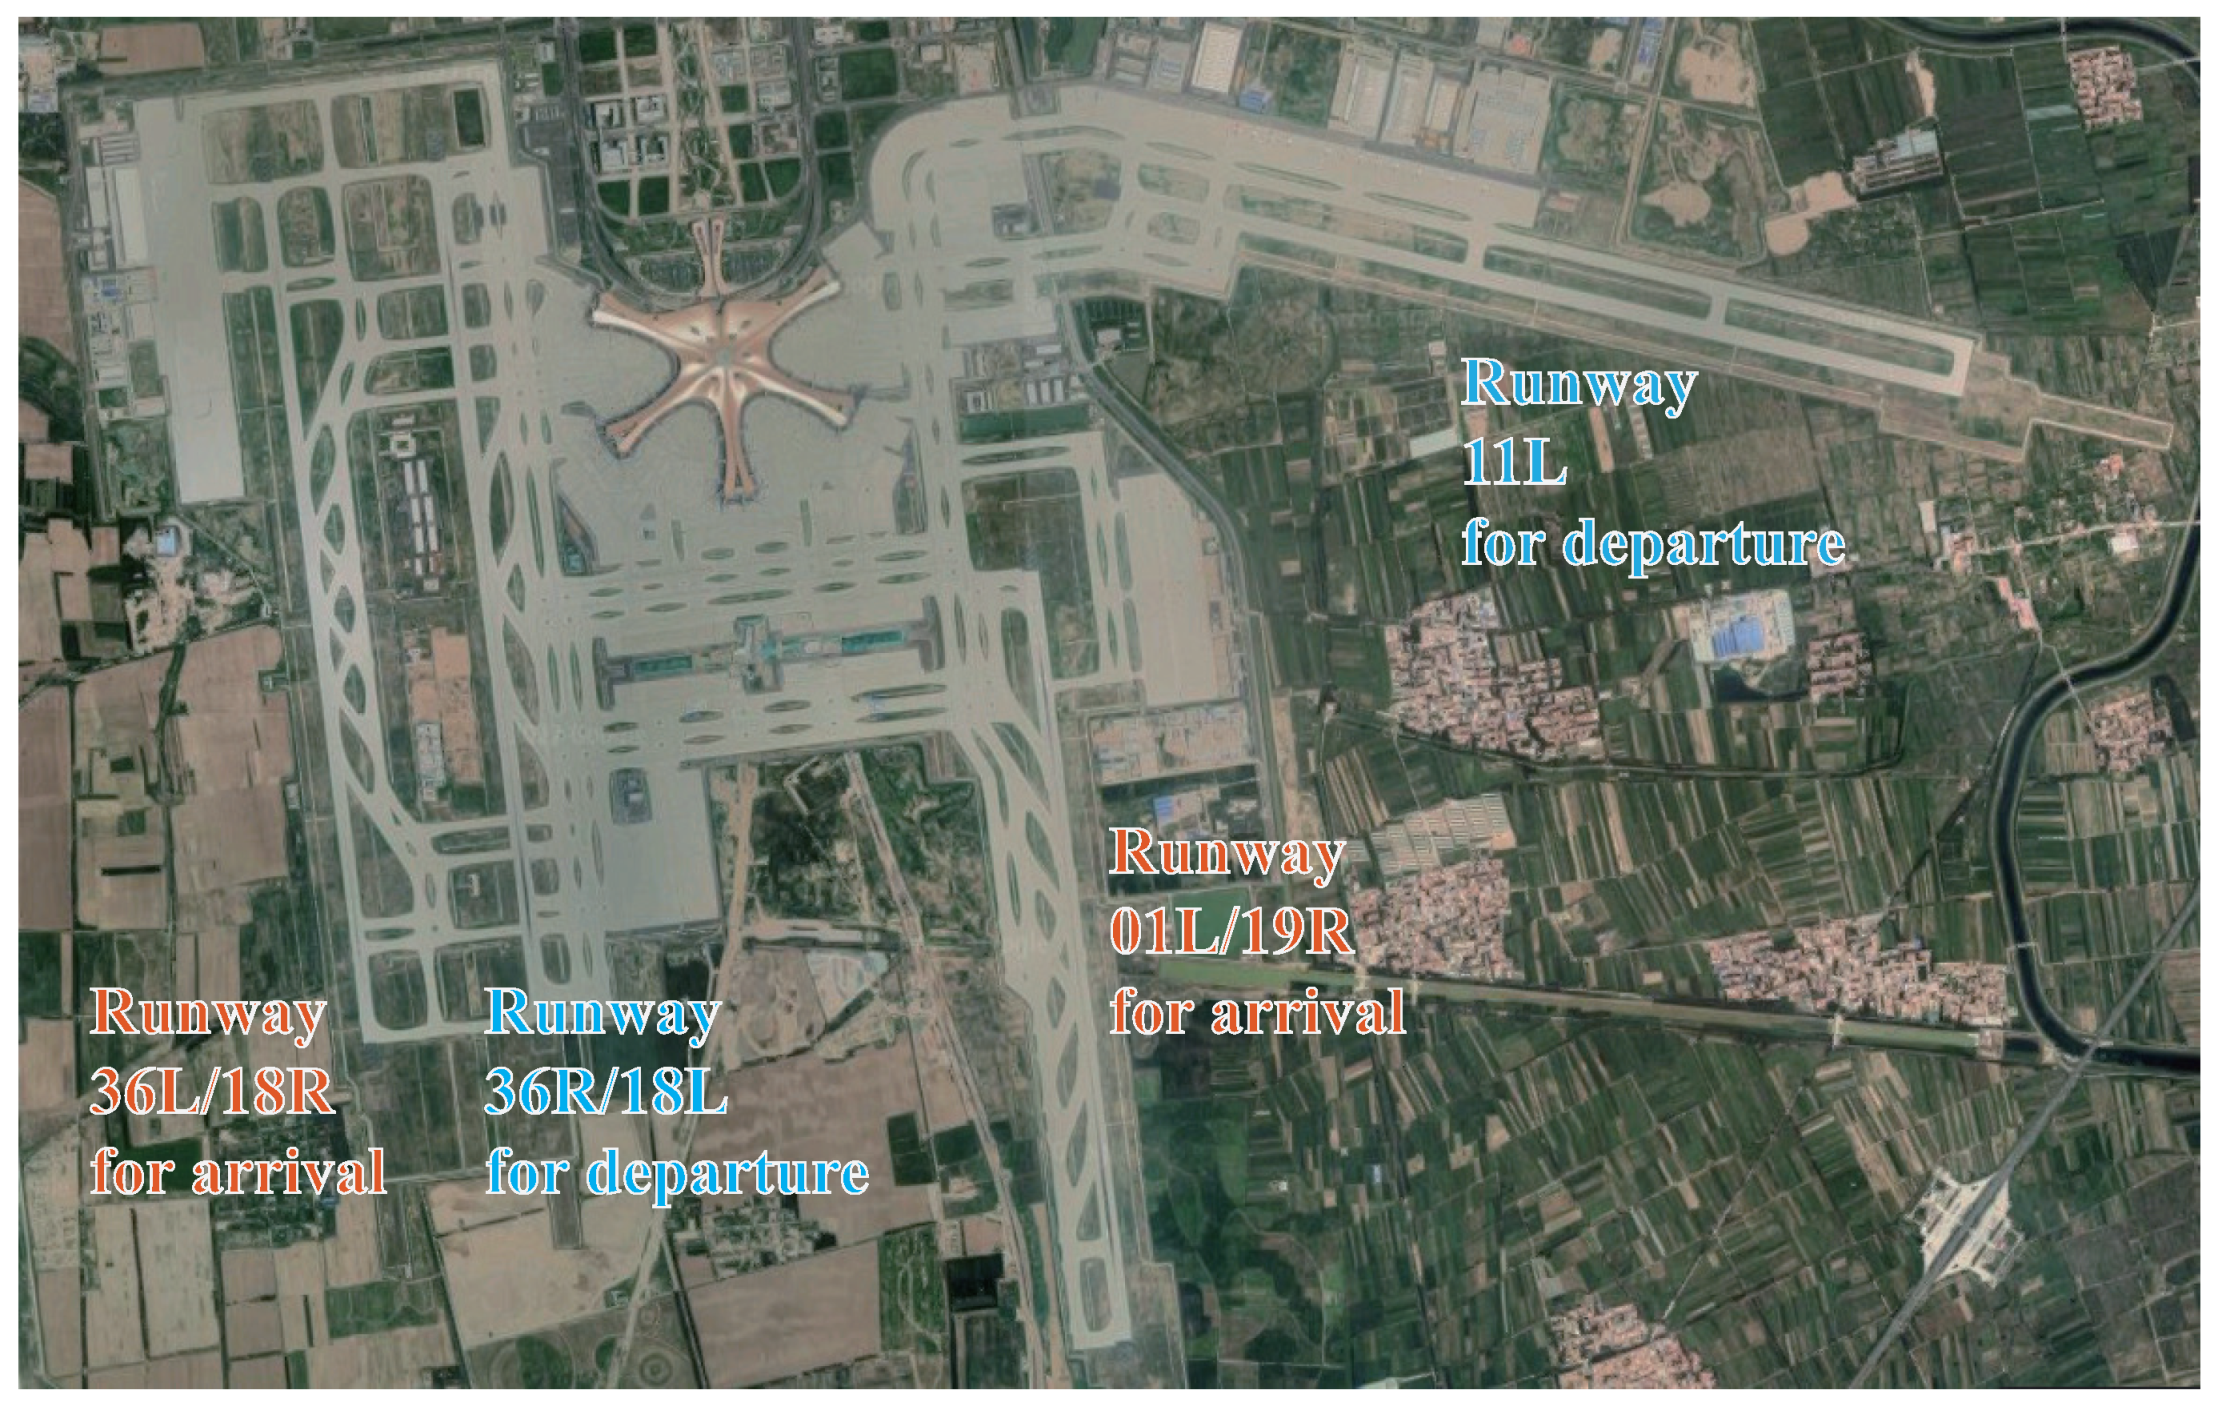
PKX is a large civil airport located between Daxing District, Beijing, China, and Guangyang District, Langfang City, Hebei Province. The flight area grade is 4F. It is the second international airport in Beijing, and the airport is known as “The New National Port.” The completion of PKX, in addition to replacing the first airport in Chinese history, Beijing Nanyuan Airport, also diverted passenger pressure from Beijing Capital International Airport, the largest and busiest civil airport in China. As depicted in Figure 10, since its opening on 25 September 2019, PKX’s runway configuration consists of three parallel runways and one inclined runway, making it the first airport in China with a NID runway configuration.
For regular operation and go-around operation, regardless of whether PKX is operating northward or southward, runways 01L/19R and 11L meet the relevant regulations of the Civil Aviation Administration of China. Precisely, it conforms to the relevant regulations on regular operation and go-around operation of NID runways in the “Guidance Material on Multi-Runway Convergence and Dispersion Operation Control of Civil Aviation Air Traffic Control System.” Therefore, it is not necessary to set the ADW separation under regular and go-around situations, and the runways 01L/19R and 11L can be operated in isolation. Under the EA situation, when the arrival aircraft to runway 36L/18R is heading east, the arrival aircraft to runway 01L/19R also fly east to avoid potential collision. Consequently, ADW separation is required to meet the TLS requirement.
First, the critical parameters of the computer simulation model under the EA situation were determined using historical data statistics and analysis methods combined with expert experience. Then, a complex and realistic computer simulation model of the arrival aircraft to runway 01L/19R and the departure aircraft from runway 11L was established. Finally, computer simulations under various critical parameters were repeatedly performed and the CP value calculated. The ADW separation setting that satisfied the corresponding safety level was obtained by comparing the CP value with fatal accidents per flight hour of TLS [2].
3.1. Parameter Settings
By referring to aeronautical information publication (AIP) data, aircraft characteristics from historical data, such as automatic dependent surveillance–broadcast (ADS–B), radar track data, etc., were extracted. After that, they were verified by front-line senior controllers and pilots to determine critical parameters of arrival or departure aircraft. Respectively, the critical parameters example of departure aircraft from runway 11L and arrival aircraft to 01L/19R runway are shown in Table 1 and Table 2.
3.2. Calculation Process
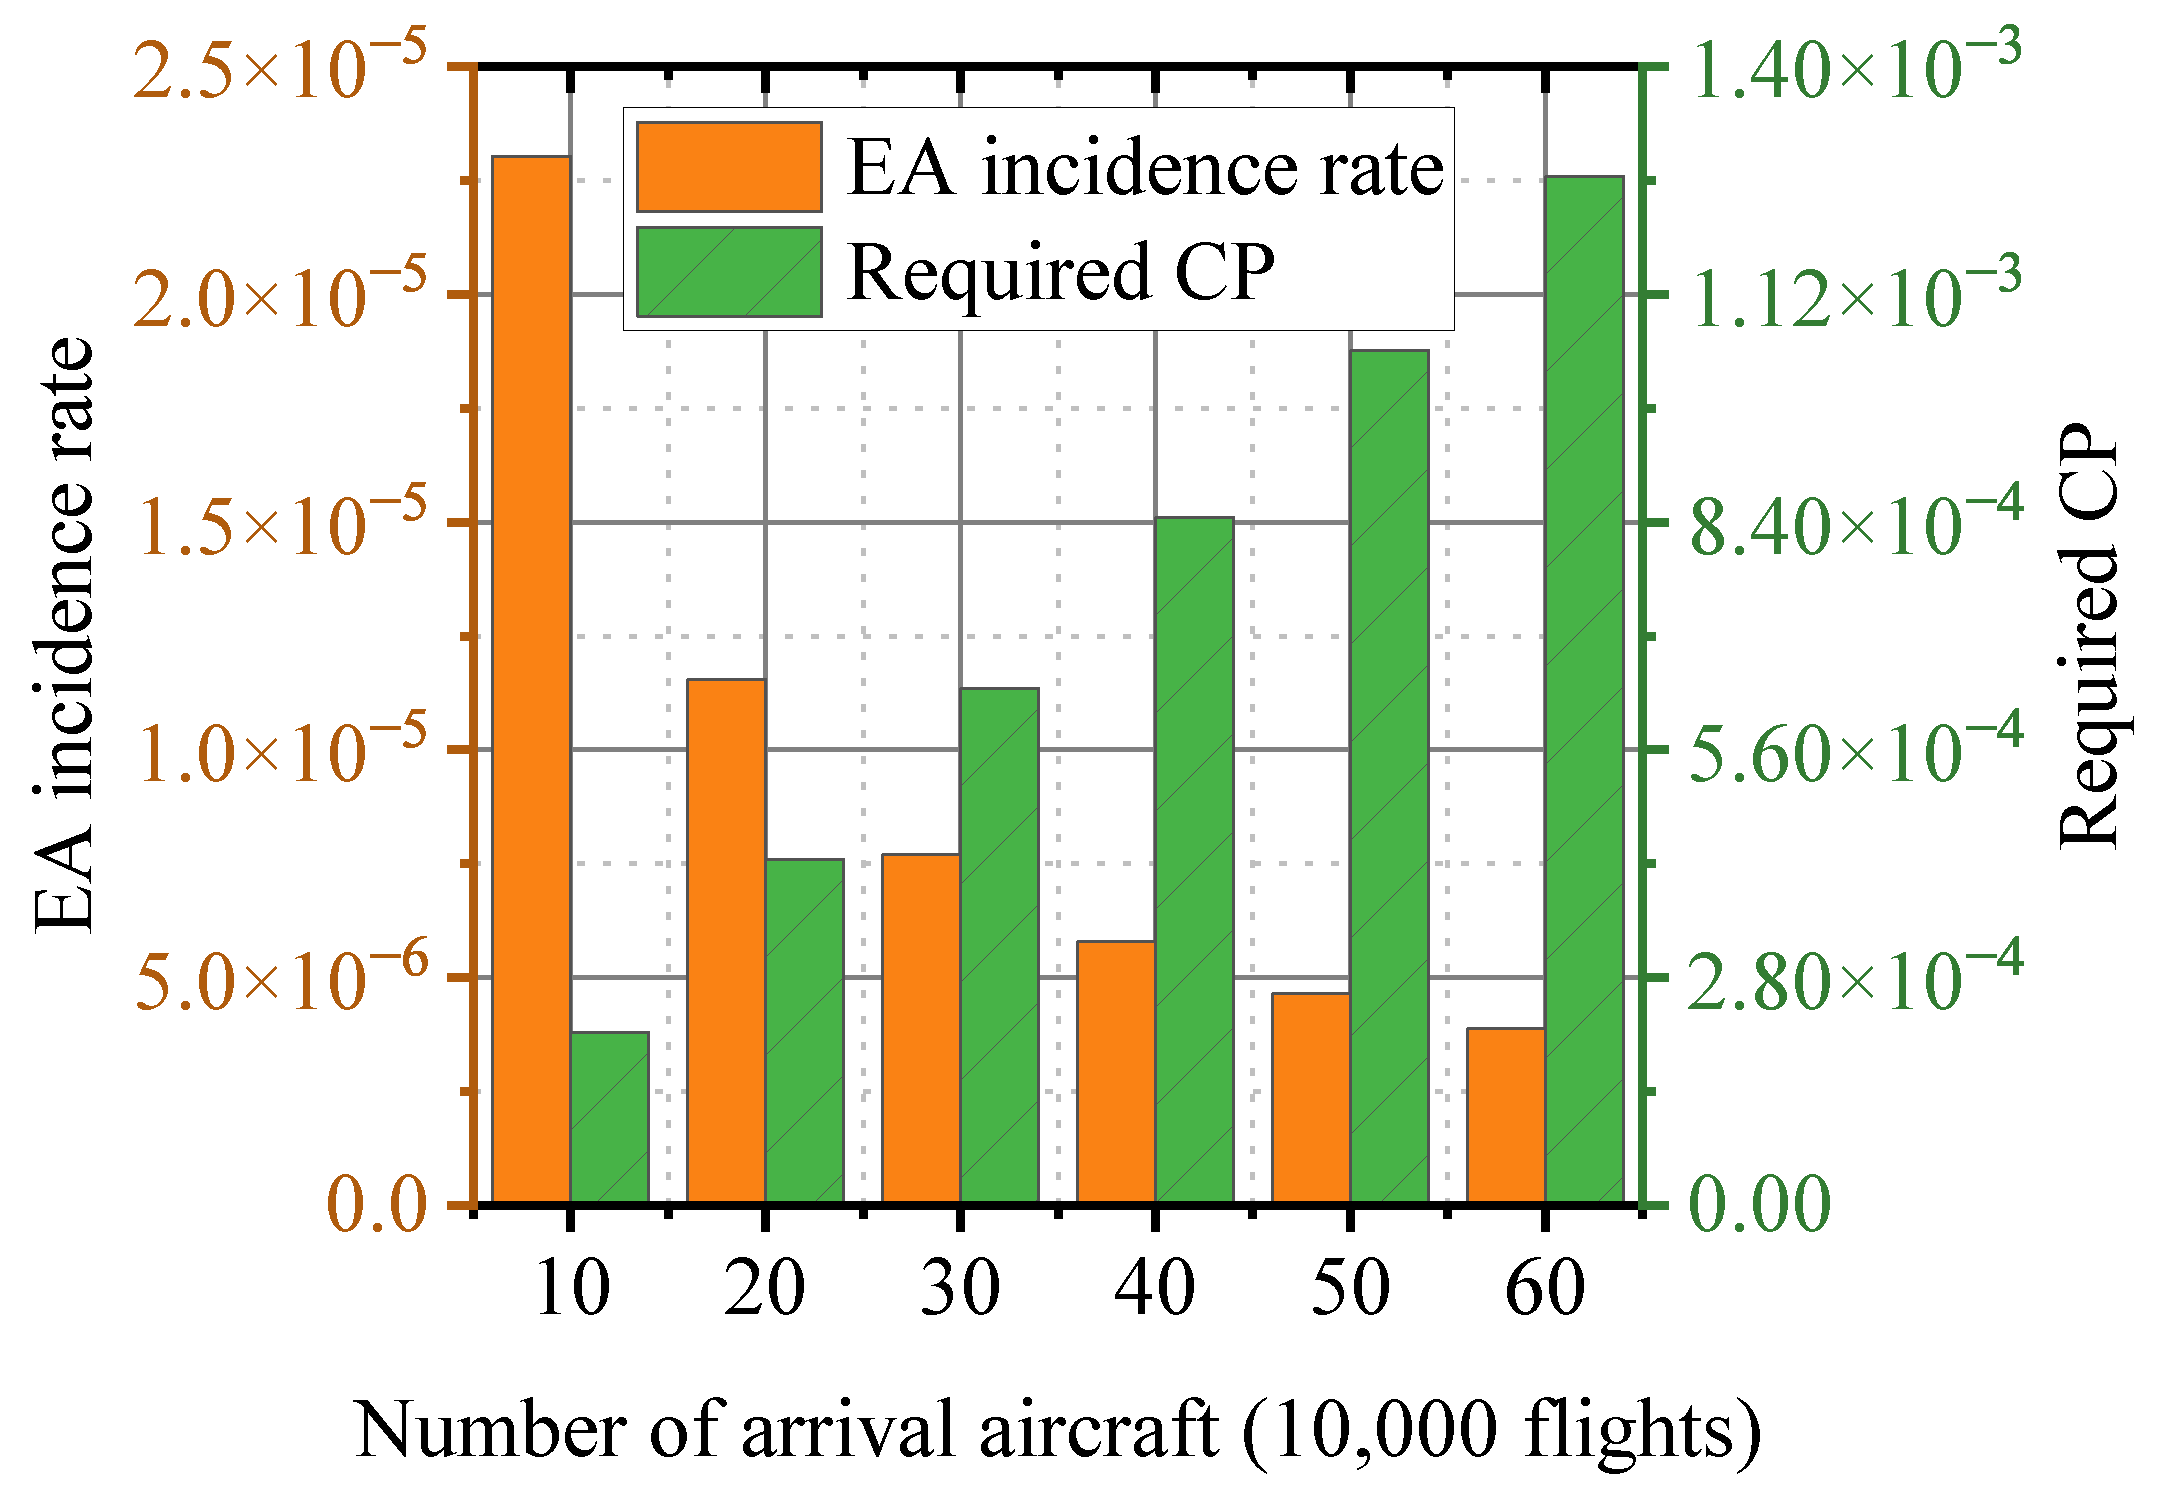
From the opening of PKX at the end of September 2019, to September 2022, the total number of takeoffs and landings was about 454,000 flights. The EA situation has never occurred since the opening of PKX. According to Section 2.1, the variation of EA incidence rate and required CP of 90% reliability are shown in Figure 11. When the incidence rate of EA decreased, the required CP increased; that is, a higher CP could be accepted under the EA situation with a lower incidence rate. For PKX, the EA incidence rate was at 227,000 arrival flights. Combined with Equation (1), the required CP was fatal accidents per flight hour.
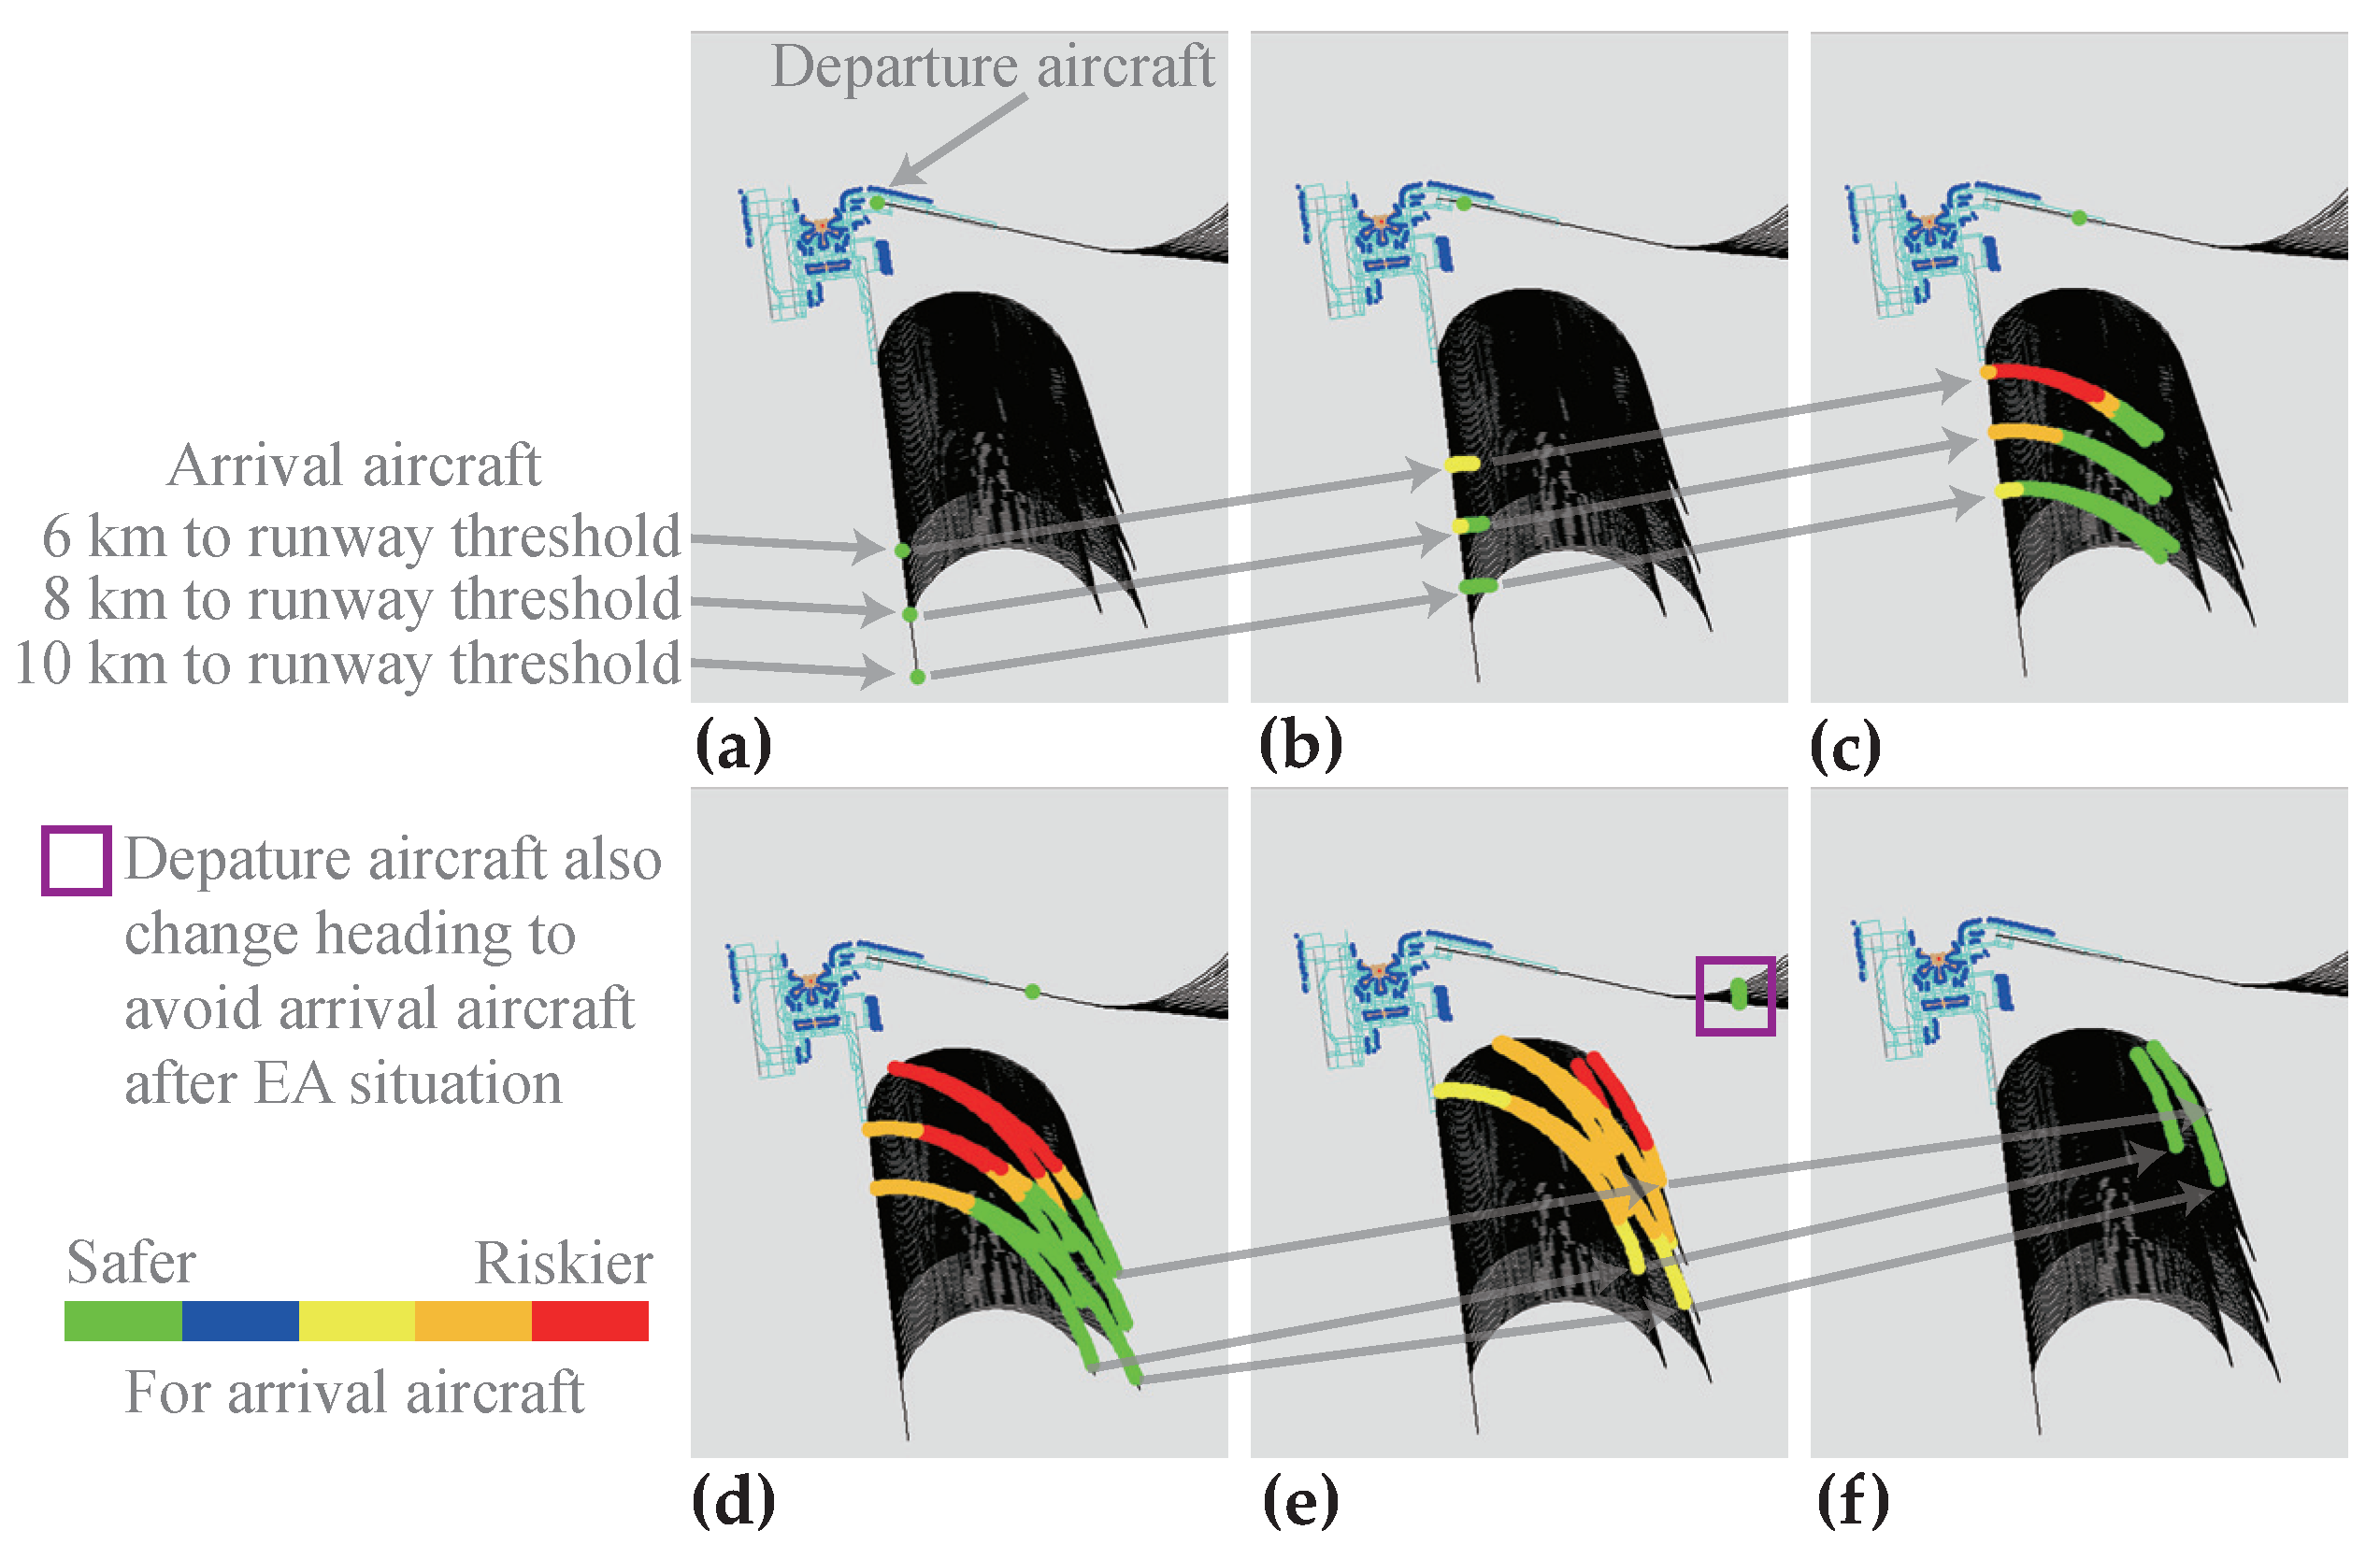
According to Section 2.2, a computer simulation model that conformed to this example was constructed.When the PKX were running northward or southward, in the case of EA, the simulated nominal trajectories of the aircraft (ADW separation was 0 km to 6/8/10 km, aircraft type was A320) are shown in Figure 12 and Figure 13, respectively. It can be seen that the nominal trajectories of arrival and departure aircraft did not intersect but were close to each other when PKX was running northward. On the other hand, the trajectories intersected when PKX was running southward. So, both specific values of ADW separation of northward and southward needed to be further analyzed in conjunction with the CP calculation.
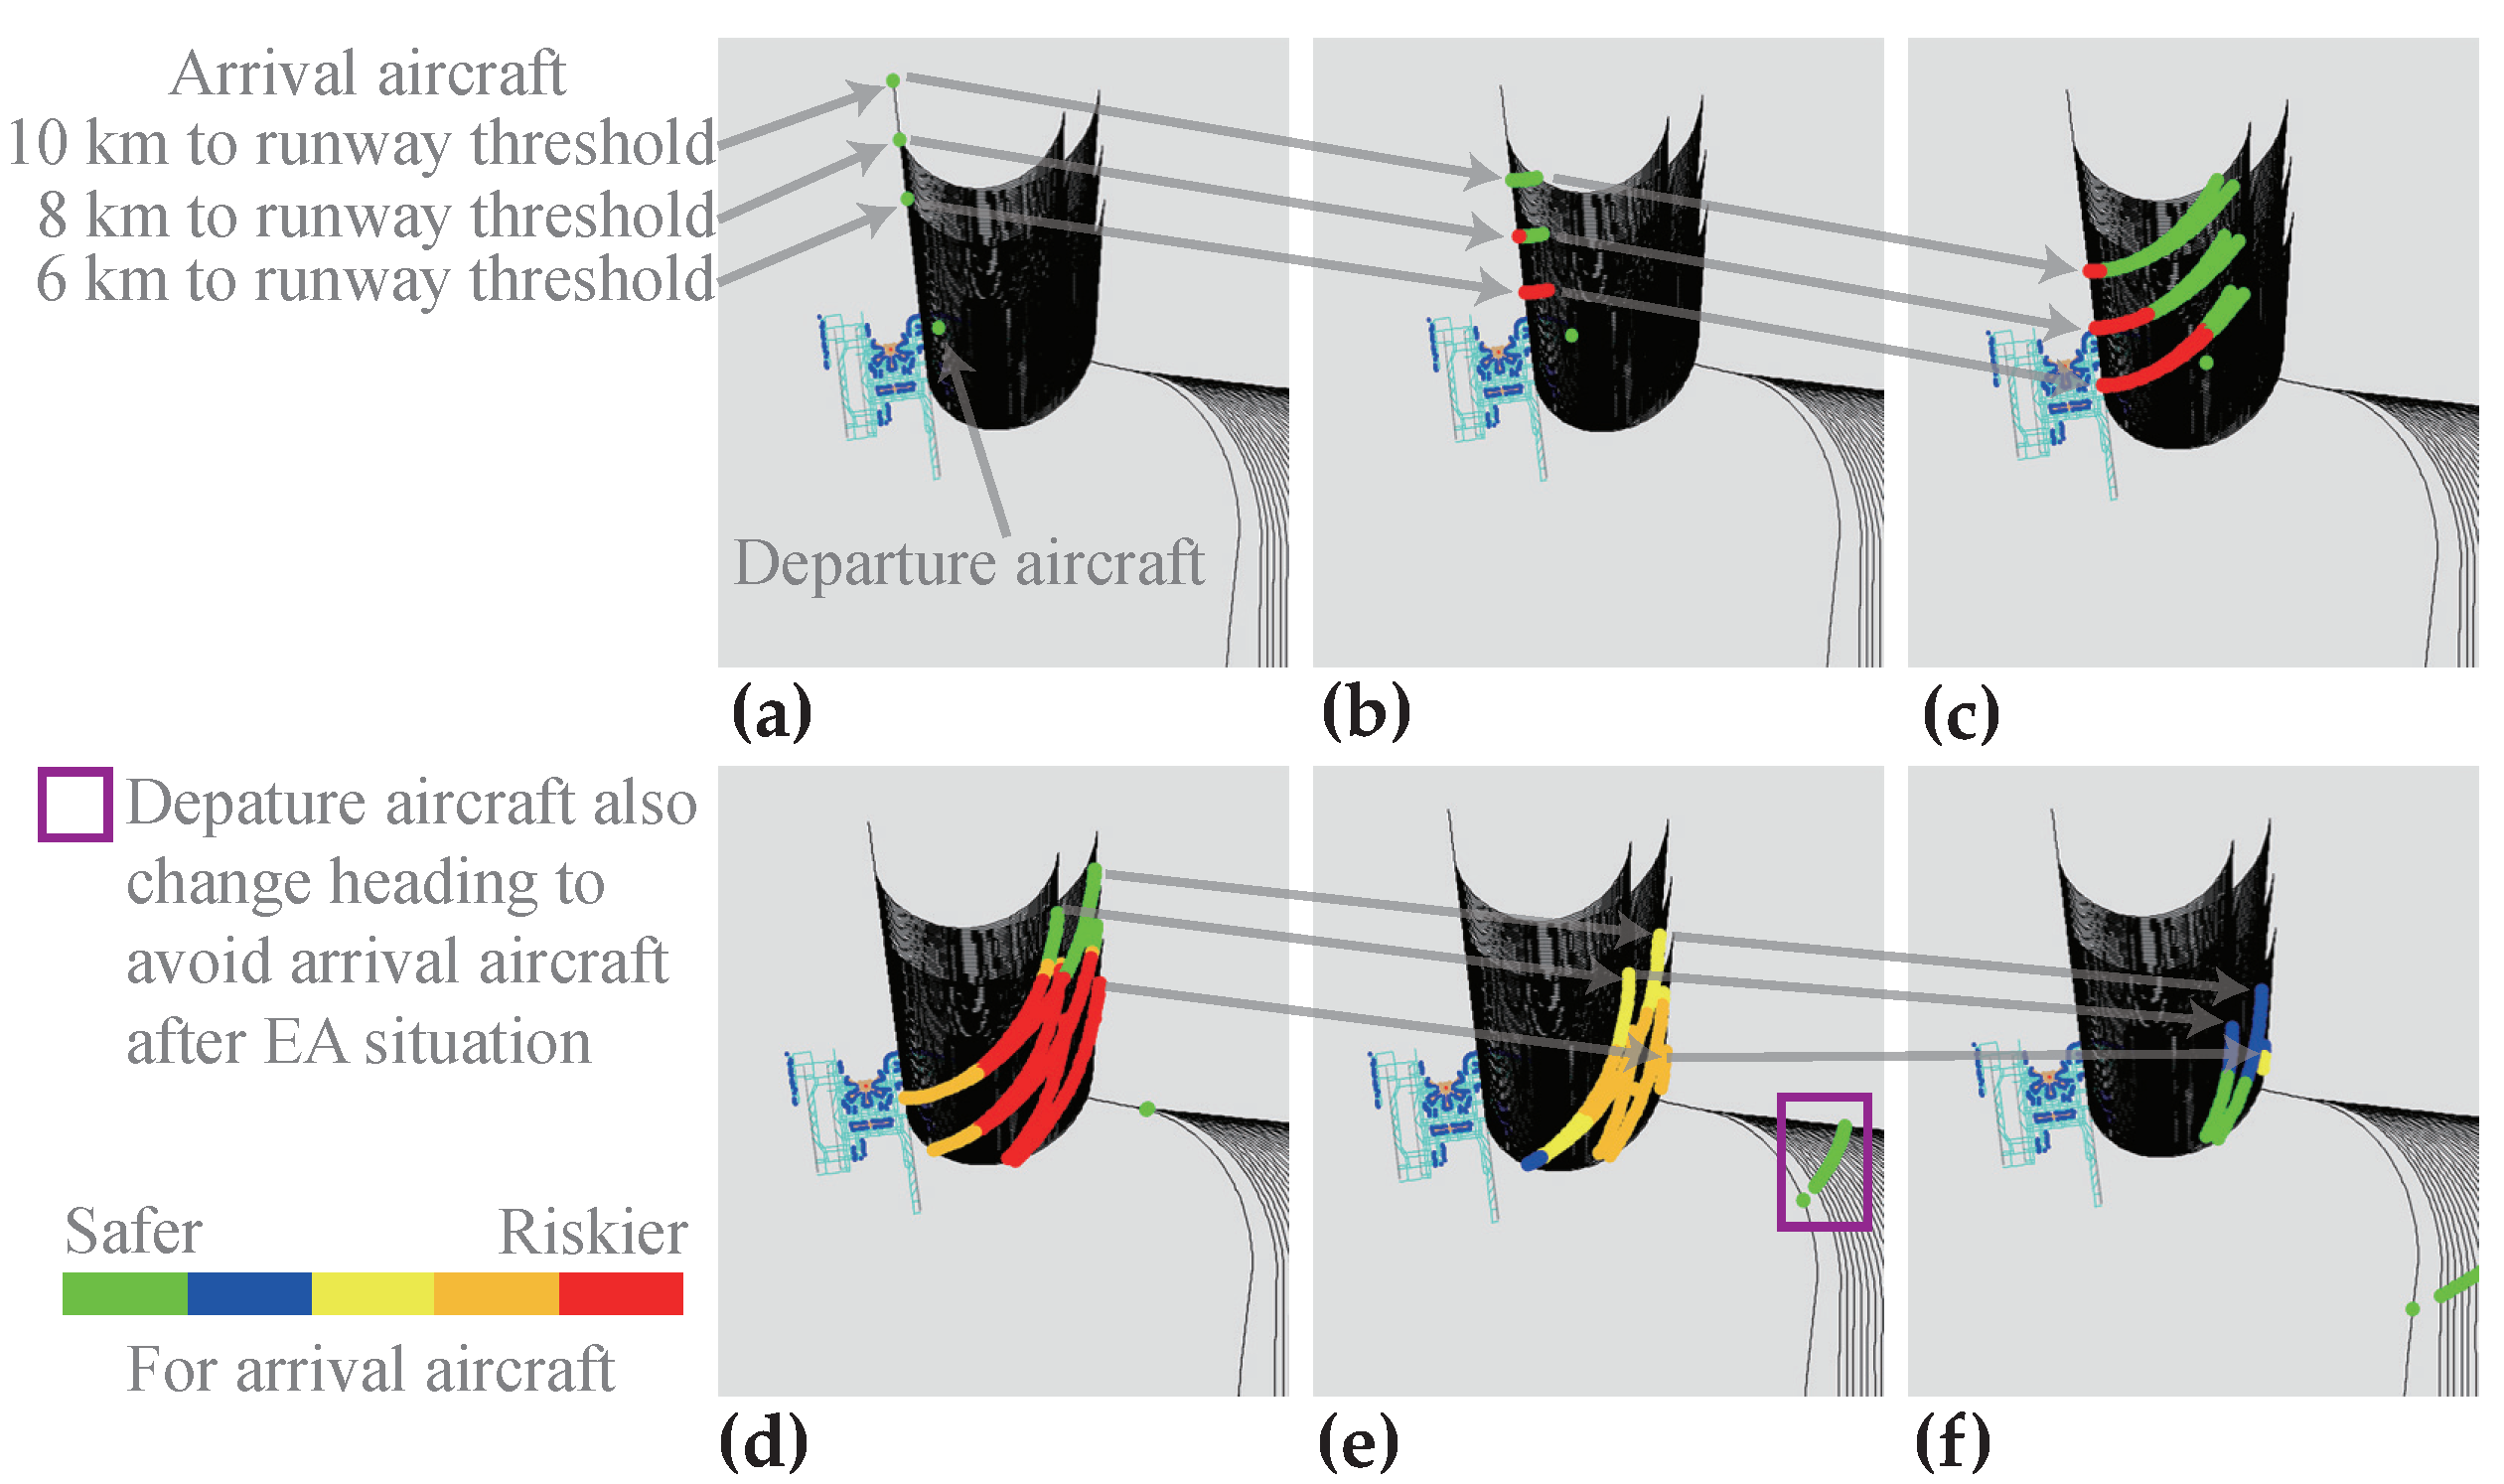
The colors of the dynamic track points for arrival aircraft in Figure 12 and Figure 13 were divided into green, blue, yellow, orange, and red. Green indicated that the horizontal separation between the arrival aircraft to runway 01L/19R and the departure aircraft from runway 11L was greater than, or equal to, 12 km, or the vertical separation was greater than, or equal to, 300 m. Blue represented horizontal separation greater than, or equal to, 10 km but less than 12 km, and the vertical separation being less than 300 m. Yellow represented horizontal separation greater than, or equal to, 8 km but less than 10 km, and the vertical separation being less than 300 m. Orange meant the horizontal separation was greater than, or equal to, 5.6 km but less than 8 km, and the vertical separation was less than 300 m. Red represented horizontal separation being less than 5.6 km, and vertical separation being less than 300 m. According to different color labels, we could intuitively understand the proximity of the two aircraft in 3D space.
The trajectory of an arrival aircraft in an EA situation resembles a helix, and an EA situation may occur at any time during the approach procedure. Therefore, when the simulation granularity was 1 s, the top-view representation of all arrival aircraft’s nominal trajectories was a collection of multiple helical-like configurations.
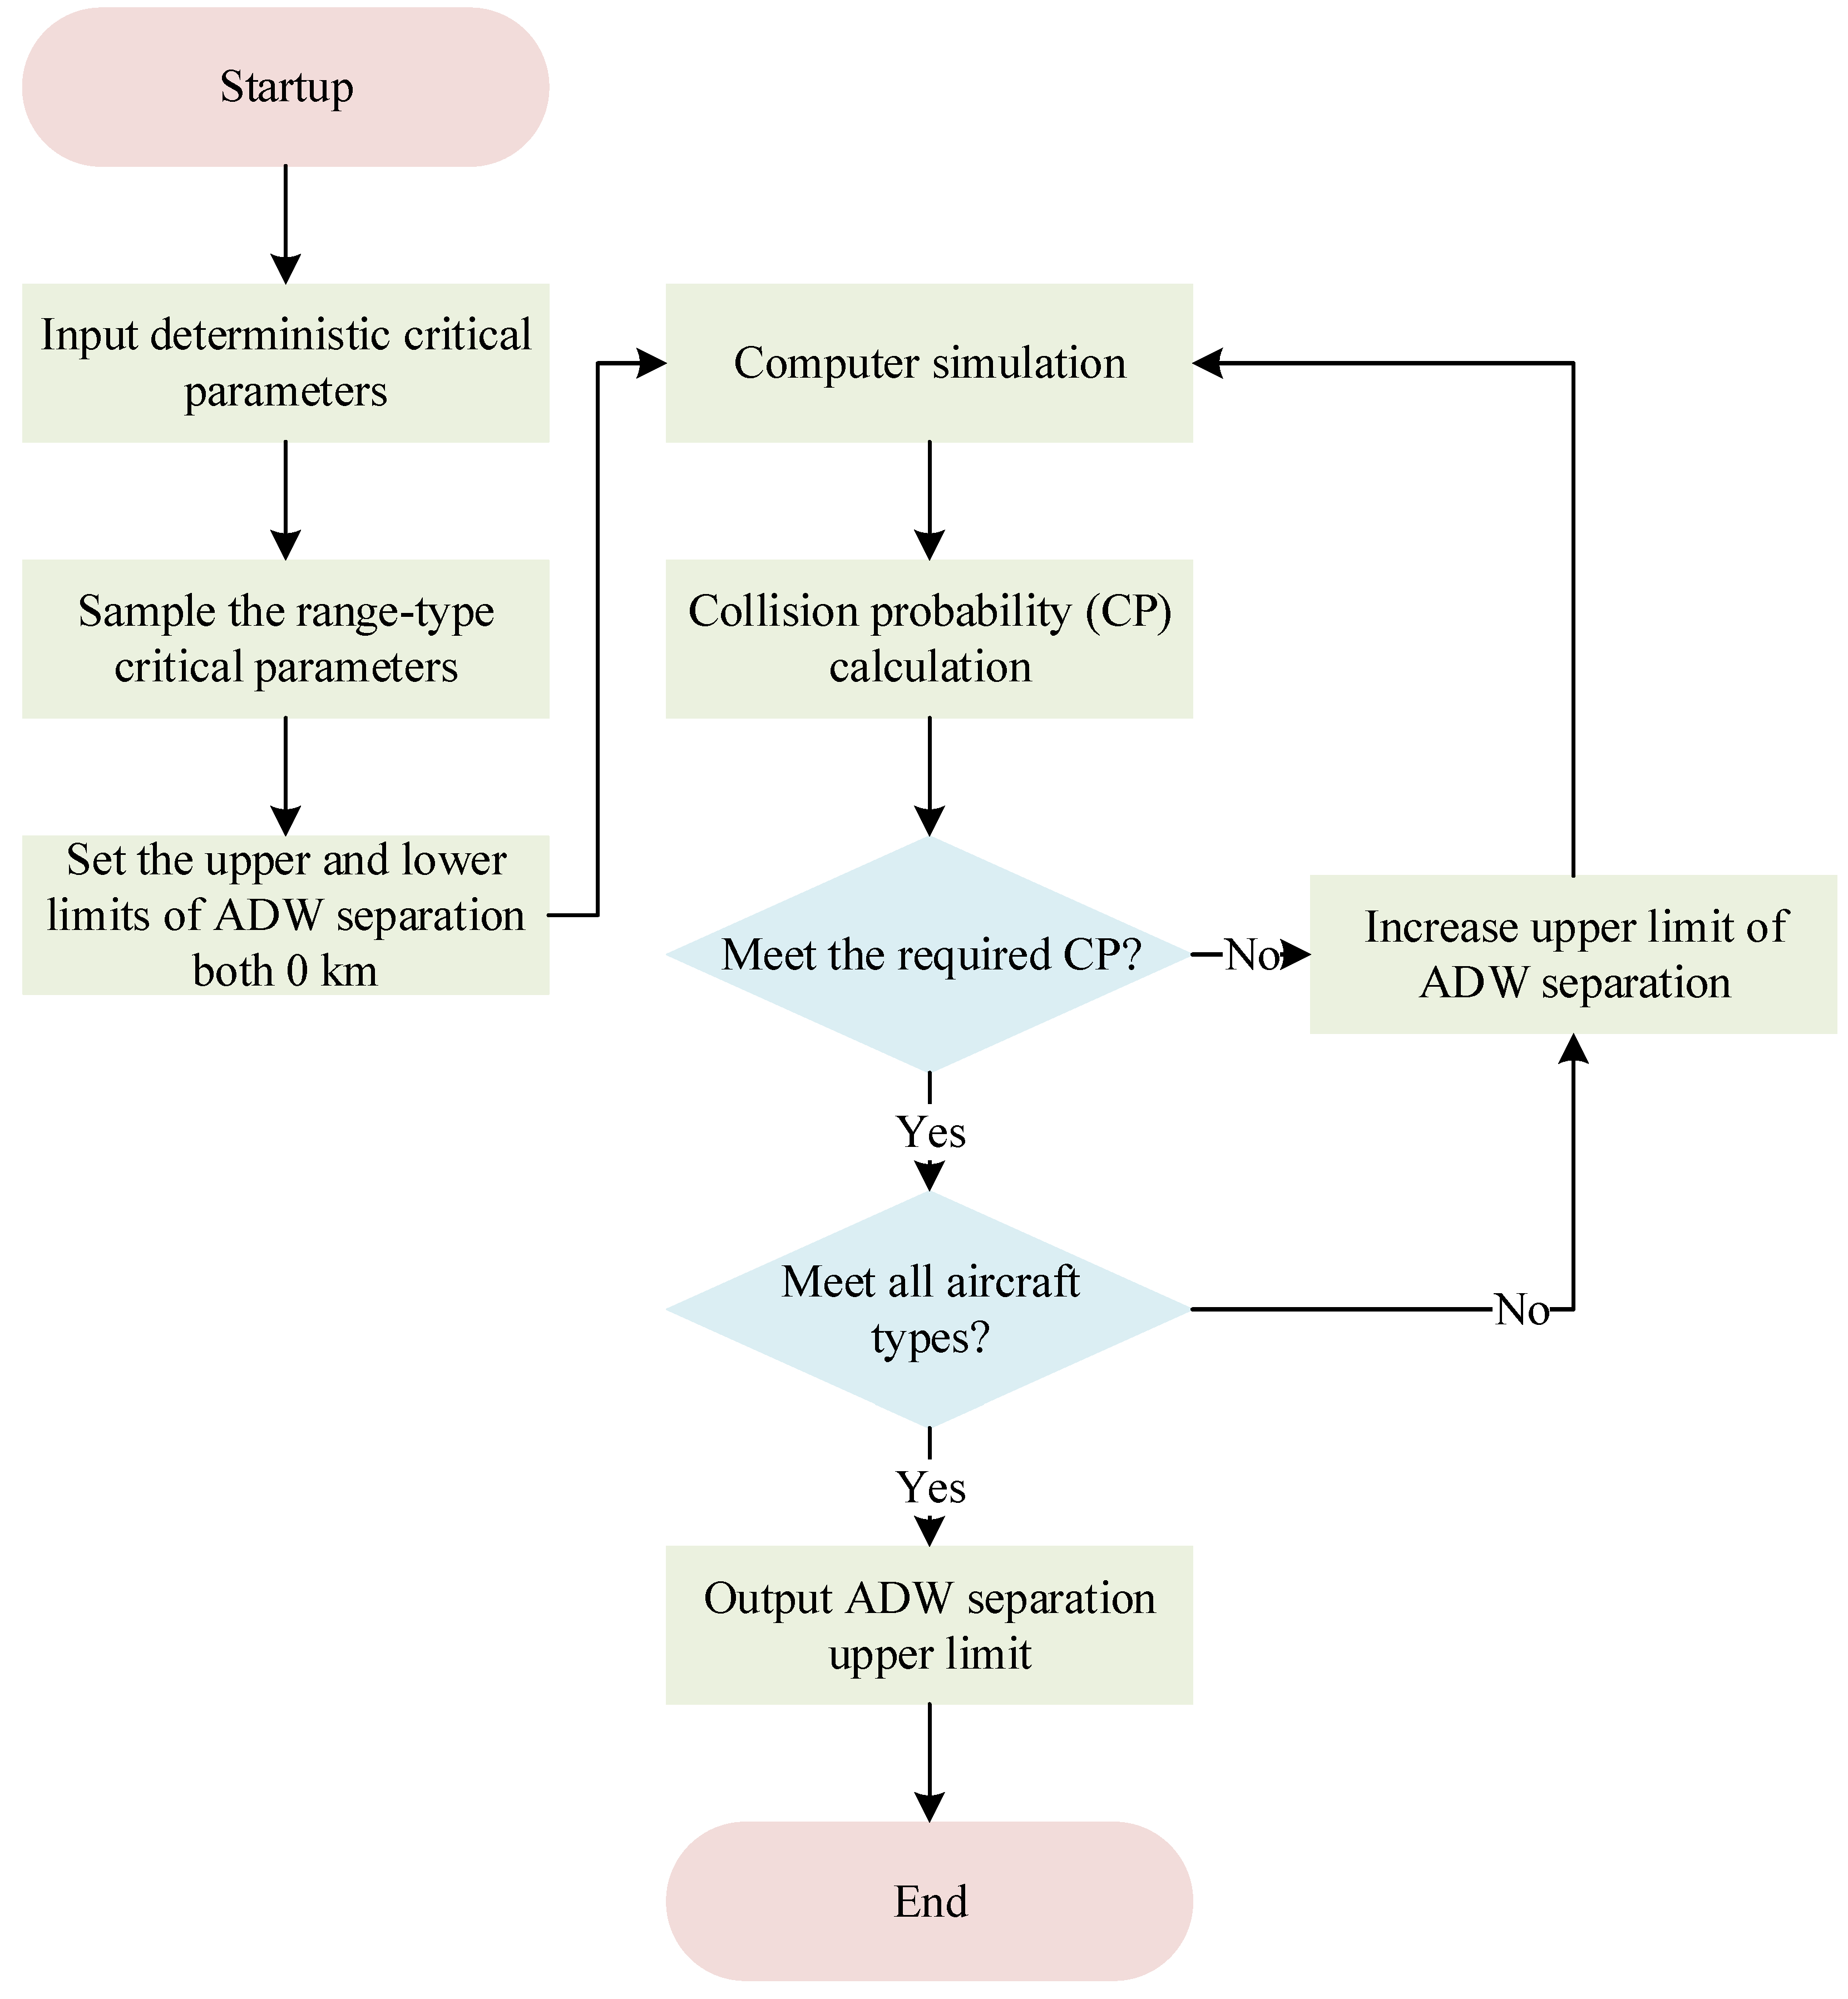
The calculation process of the upper limit of the ADW separation is shown in Figure 14. For the sampling results of each range-type critical parameter, the process of Figure 14 needed to be executed until the upper limit of the ADW separation that satisfied the constraint was output. The reason for no infinite loop was that when the upper limit of the ADW separation was large enough, the CP of two aircraft was certainly less than, or equal to, any positive value greater than 0.
To determine the lower limit of the ADW separation, it was necessary to consider the position of the approach procedure of runway 01L/19R corresponding to the minimum decision altitude of runway 36L/18R. After the minimum decision height of runway 36L/18R, the arrival aircraft to runway 36L/18R would directly choose to land without deflection, and the arrival aircraft to runway 01L/19R would not be forced to EA. Under the premise that TLS was satisfied, after the upper limit of ADW separation was determined according to the process of Figure 14 (the lower limit of ADW separation was 0 km by default). If the lower limit of ADW separation increased, the value of CP would not increase. Therefore, TLS was certainly satisfied after adjustment, and sufficient security redundancy was guaranteed.
3.3. Result Analysis
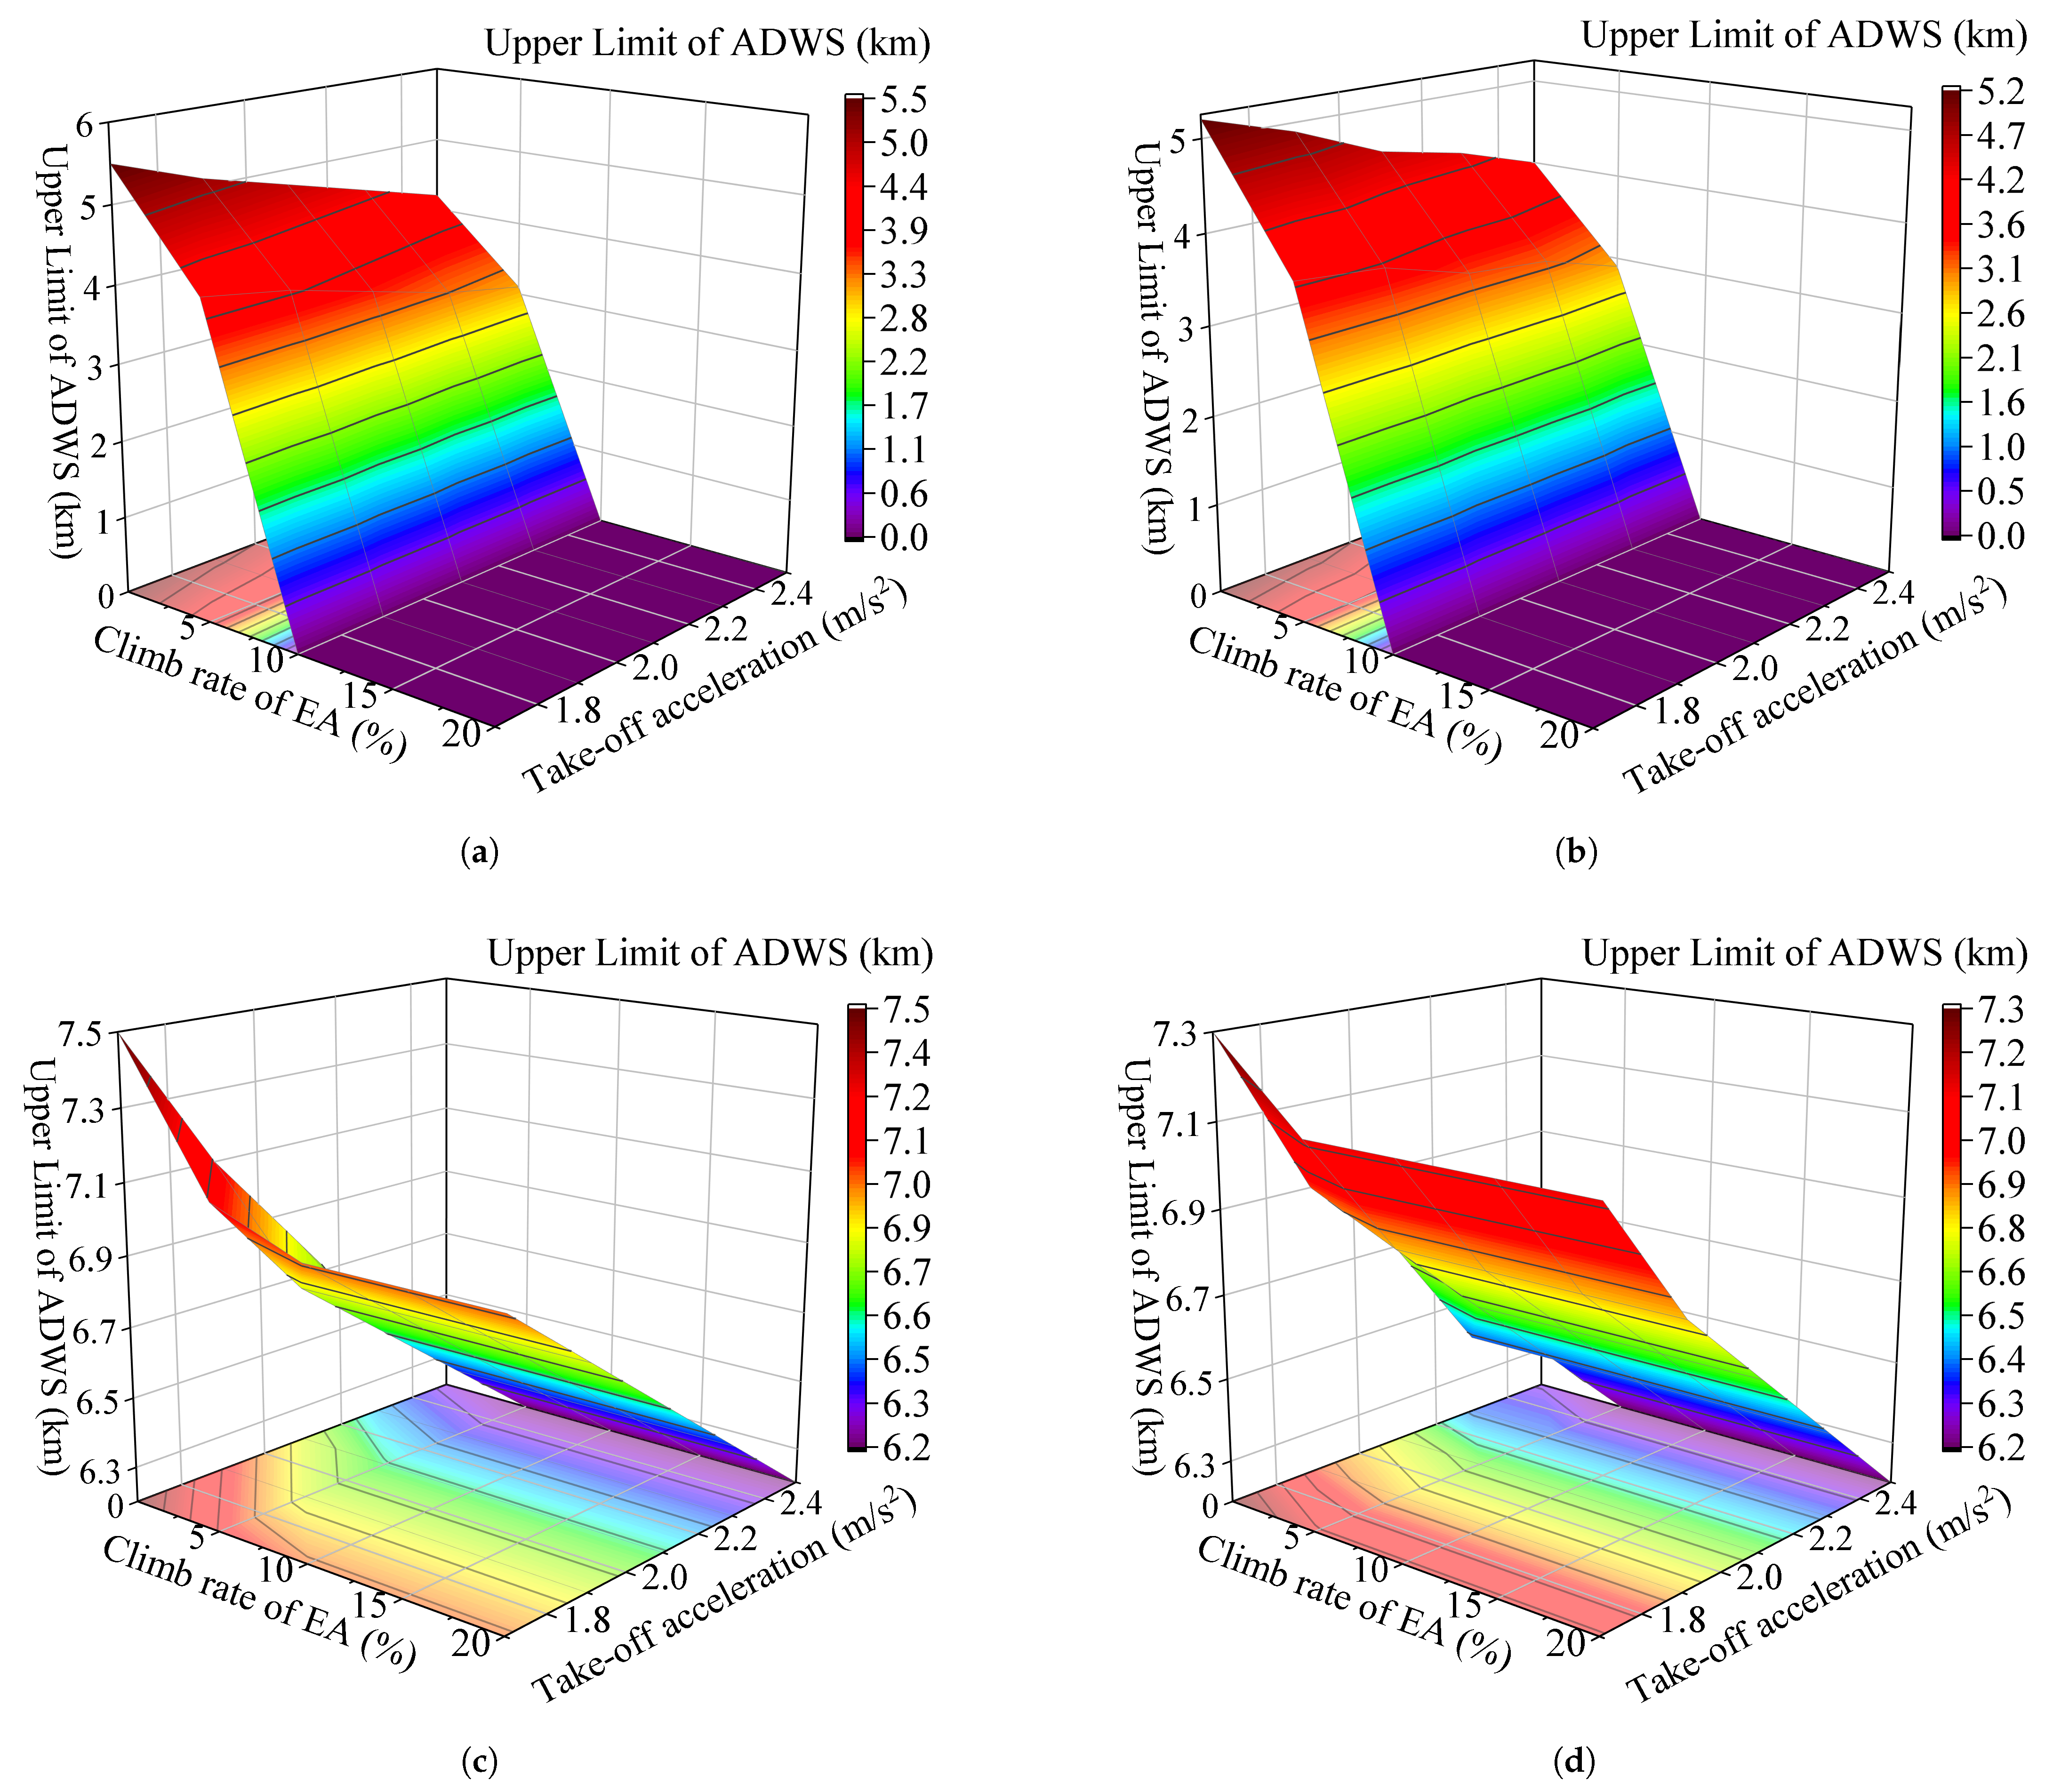
According to the parameter settings in Section 3.1, the parameter values of the EA minimum speed limit, the EA climb rate of arrival aircraft, take-off acceleration of departure aircraft were not unique.Furthermore, the possible aircraft type pairs were also not unique. Therefore, based on the calculation process in Section 3.2, multiple calculations needed to be performed according to the process in Figure 14, and the corresponding multiple calculation results are shown in Figure 15. The significance of multiple calculations was that, through the comparative analysis of the range-type input parameters, the sensitivity of the input parameters to the results could be excavated so that the range-type parameters could be tightened at the level of verbal agreement or normative documents. Then, to a practical extent, the distance of ADW separation and increase runway capacity could be reduced.
It can be seen from Figure 15a that when PKX was running northward, and the EA maximum speed limit was 230 kt (118.3 m/s), the upper limit of ADW separation changed significantly. When the EA climb rate of the arrival aircraft was 10% or above, no matter how the take-off acceleration of the departure aircraft was distributed between 1.7 m/s to 2.5 m/s, the upper limit of the ADW separation could reach 0 km, that is, no ADW separation was required.
From the comparison of Figure 15a and Figure 15b, it can be seen that the upper limit of the ADW separation was slightly larger if the EA maximum speed limit was 230 kt (118.3 m/s). This was because, when an EA occurs for an arrival aircraft, the horizontal status of the arrival aircraft and the departure aircraft are mostly gradually approaching, and the altitude of the arrival aircraft is greater than that of the departure aircraft in most cases. If the arrival aircraft climbed to a higher altitude as soon as possible at this time, and then established sufficient vertical separation with the departure aircraft, even if the horizontal separation between the two aircraft was minimal, the CP could still meet the TLS under EA situation.
From the comparison of Figure 15a and Figure 15c, it can be seen that when the EA maximum speed limit was the same, the upper limit of ADW separation for northward operation was obviously smaller than that for the southward operation, which echoed the nominal trajectories of computer simulation shown in Figure 12 and Figure 13.
In terms of runway configuration, the reason was that, when PKX runs northward, the approach threshold of runway 01L is far away from the departure threshold of runway 11L. On the contrary, when PKX runs southward, the approach threshold of runway 19R is remarkably close to the departure threshold of runway 11L. If PKX runs southward for a much extended period over that of northward, then the runway configuration would cause a significant drop in operational efficiency. Therefore, in the airport construction stage, it is essential to properly consider the runway operation separation caused by the runway configuration, which has a decisive impact on the upper limit of the airport’s runway capacity.
The comparison of Figure 15c and Figure 15d was similar to that of Figure 15a and Figure 15b. No matter whether PKX was running northward or southward, the upper limit of ADW separation of the EA maximum speed limit of 230 kt (118.3 m/s) was slightly larger than that of 200 kt (102.9 m/s) but was not apparent. Similarly, the comparison of Figure 15b and Figure 15d with Figure 15a and Figure 15c was also similar, which once again showed that no matter what the other range-type parameters were, the upper limit of ADW separation for southward operation was obviously greater than that for northward operation.
According to Section 3.2, since runway 36L/18R is on the north side of runway 01L/19R, combined with the location of the minimum decision height of runway 36L/18R, it can be concluded that the lower limit of ADW separation for northward operation was 0 km, and for southward operation was 3.2 km.
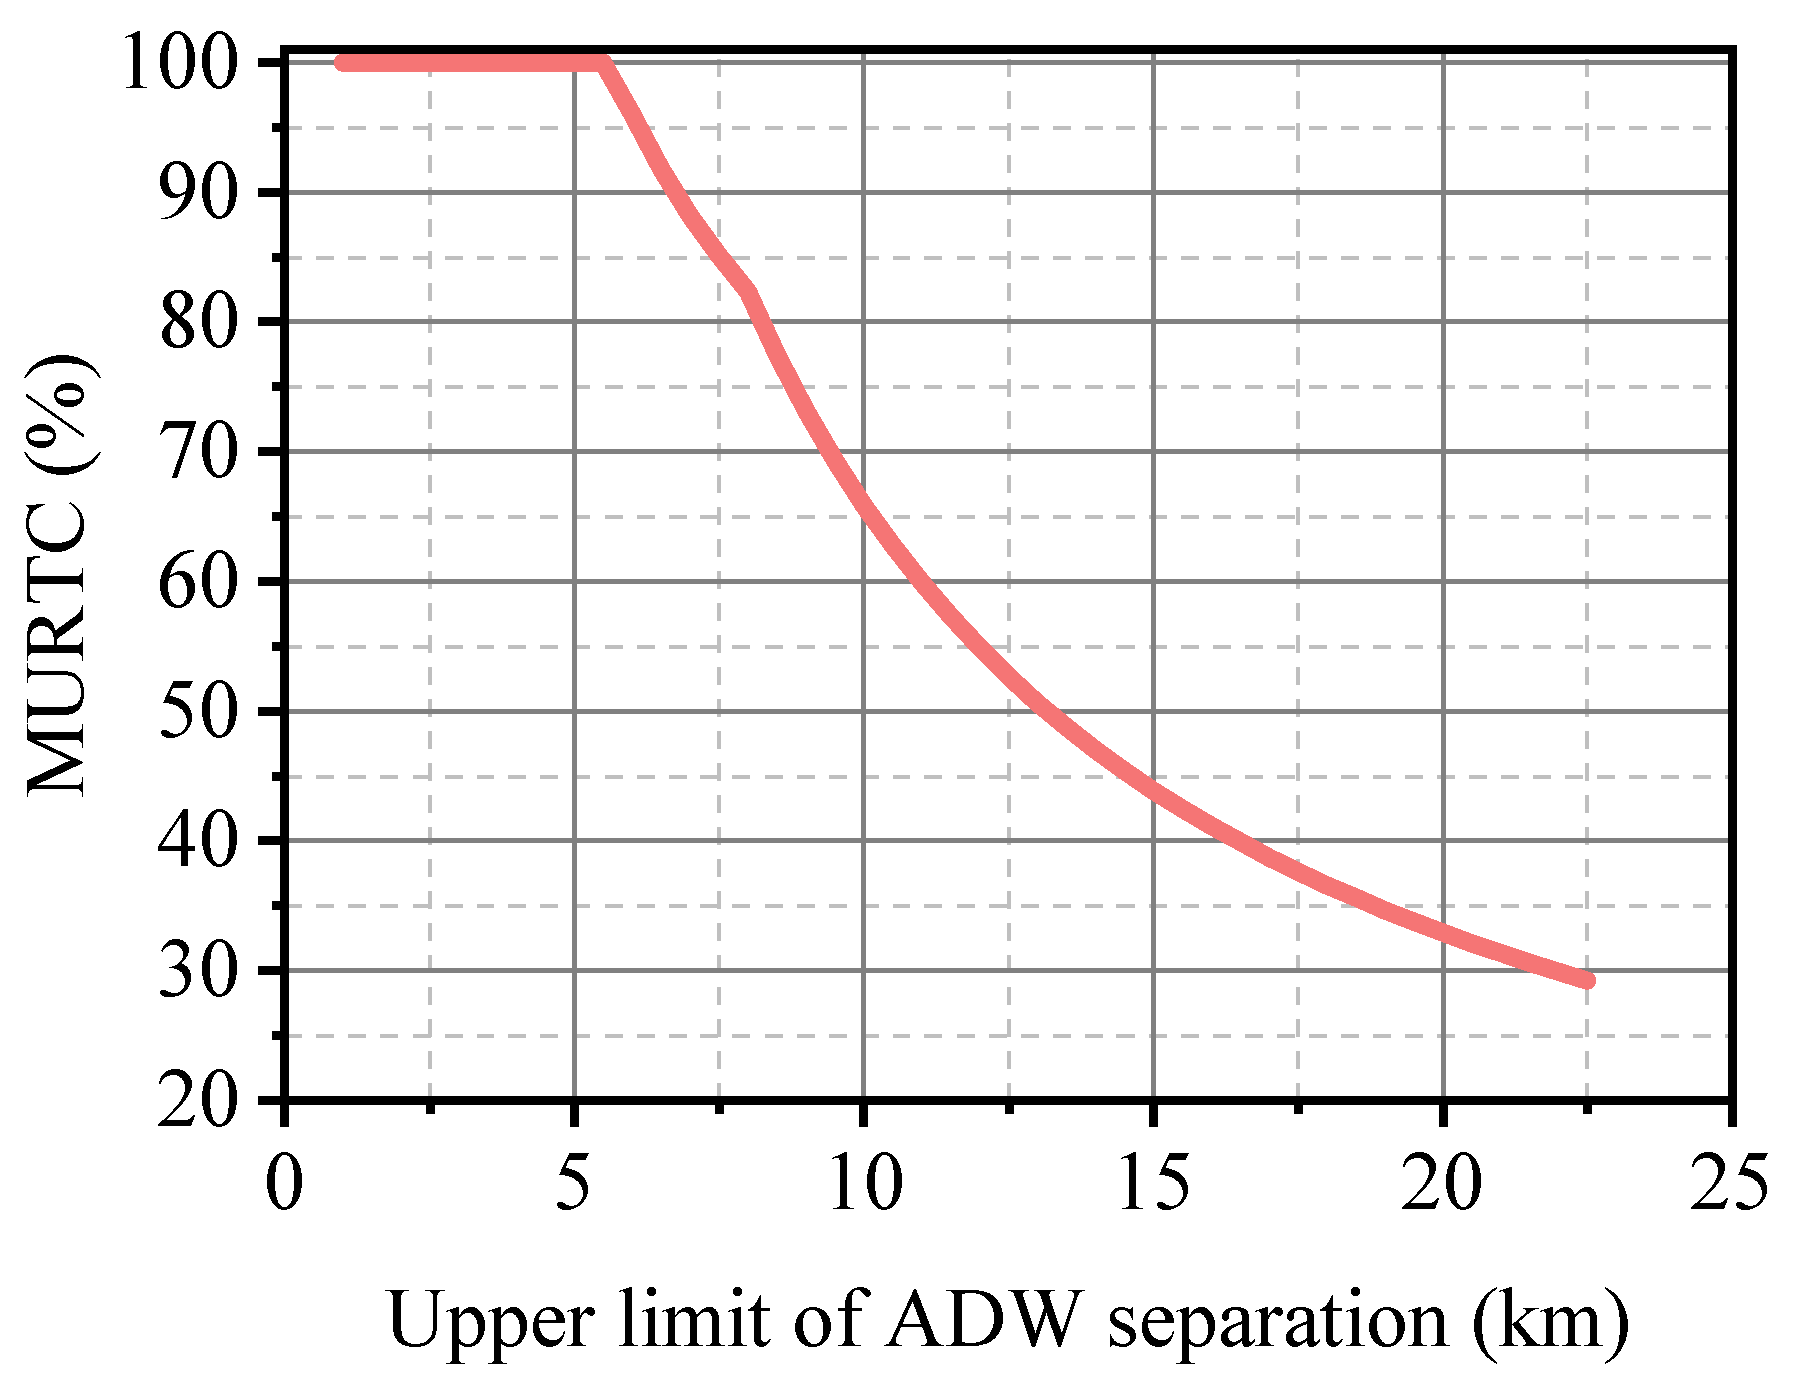
Based on the calculation method of theoretical runway capacity [24], the theoretical capacity of the runways in the ideal situation cab first be calculated, that is, runways 01L/19R and 11L are running in isolation. Then, the theoretical capacity of the runways under different ADW separations is calculated. Finally, the ratio of the latter to the former is taken as the maximum utilization of runway theoretical capacity (MURTC), as shown in Figure 16. With the continuous decrease of the upper limit of ADW separation, the MURTC of runways 01L/19R and 11L showed an upward trend, and, then, the trend gradually strengthened and, finally, remained unchanged. For example, when the distance between ADW separation was reduced from 18 km to 12 km, MURTC increased by less than 20%; when the distance was reduced from 12 km to 6 km, the MURTC could increase by more than 40%; when the distance was reduced to 5.6 km or below, and the ADW separation had almost no effect on the MURTC of runways 01L/19R and 11L. At this time, the arrival aircraft to runway 01L/19R landed continuously, and the departure aircraft from runway 11L took off between any two arrival aircraft.
Based on the above analysis, to the design of flight procedures at PKX it should be added that the EA minimum climb rate for arrival aircraft to runway 01L/19R is 10%, and the EA maximum speed limit is 200 kt (102.9 m/s). Even if it is convenient for the controller to operate, conservatively set the lower limit of the ADW separation to 0 km. There is no need to configure the ADW separation when PKX is running northward. The upper limit of the ADW separation is 7.1 km when PKX is running southward. Accordingly, the MURTC is 100% for running northward and 88% for southward, respectively. If the above two conditions cannot be constrained, then the upper limits of ADW separation for northward and southward operations are 5.5 km and 7.5 km, and the MURTCs are 100% and 85%, respectively. Although the MURTC is 100% when running northward, the presence of, or absence of, ADW separation would significantly impact the controller’s workload. When there is an ADW separation, the controller needs to continuously pay attention to whether there are arrival aircraft within the ADW separation range and control so as not to allow departure aircraft to take off on runway 11L, resulting in a large amount of additional workload.
4. Discussion and Conclusions
Starting from the EA incidence rate analysis method proposed in this paper, we first determined the required CP calculation method in the case of EA. Then, the nominal trajectories of the aircraft were outputted, based on the computer simulation model we built. Finally, by the calculation process presented in this paper, we calculated the ADW separation in the case of EA, based on the CP. Based on the methods we proposed above, the case study of PKX verified the effectiveness of these methods and significantly improved the operational efficiency of PKX. The main contributions include the following:
- A calculation method for EA incidence rate was proposed for airports where EA has never occurred. From the reliability perspective, the quantitative calculation determines the value of the EA incidence rate.
- The combination of computer simulation and CP calculation not only considers the complex representation of aircraft performance and control behavior, but also combines the mathematical method of probability analysis. A more accurate output result, close to the actual operation, can be ensured within a reasonable time range.
- Whether a collision occurs between aircraft is no longer based on whether the traditional standard geometric collision volumes (usual cuboids) intersect. Instead, this paper combined computer-aided 3D design [22] and other technologies to carry out high-precision digital 3D models of the aircraft’s shapes. The Boolean operations [25] of the constructive solid geometry were then used to more accurately analyze whether a collision between aircraft during the simulation process occurs. In the meantime, the calculation speed of 3D graphics operation was appropriately dealt with.
- The established models and methods were applied to the NID runway configuration of PKX. Then the influence of different range-type parameters on the ADW separation results was analyzed, providing a quantitative reference for policy-related or normative parameter constraints.
- Under the constraints of an EA maximum speed limit of 200 kt (102.9 m/s) and an EA minimum climb rate of 10%, PKX does not need to set ADW separation for northward operation, and the ADW separation for southward operation is from 3.2 km to 7.1 km. This result was approved by the Civil Aviation Administration of China and applied to PKX, significantly enhancing MURTC under the premise of satisfying TLS.
Although this paper has made the above five contributions, there are still some areas for improvement. In follow-up research, parameter settings and calculation methods should be further studied, including:
- Refining the parameter granularity of computer simulation, and analyzing the probability distribution of parameters related to aircraft performance and control behavior through the analysis of a large amount of historical data (such as actual trajectories, airborne equipment, and control voice records). Conducting real-life experiments with control simulators and flight simulators. This has extremely stringent requirements for the breadth and accuracy of data sources, and the data sources available at the time of writing were incapable of supporting such a level of data analysis.
- In this paper, the uncertainty of aircraft position was considered in the calculation of CP. However, methods like the Tunnel Gaussian Process [3] and others [4] can also calibrate the distribution of various aircraft performance parameters. Based on the probability distribution of each parameter, using the Monte Carlo simulation method to randomize each parameter’s value and repeatedly performing tens of billions or even hundreds of billions of simulation hours of deduction should be considered. In this way, the relationship between CP and TLS could be more rigorously demonstrated on the premise of satisfying statistical significance at the extremely small magnitude threshold of the accident rate. Such a large-scale and time-consuming simulation deduction necessitates the utilization of multiple high-performance computers, parallel computing [26], and cloud computing [27] in order to be completed in a reasonable amount of time.
The recommendations of the above two points of follow-up research are not only specific to the collision probability analysis in the case of EA, but also apply to the collision probability analysis between aircraft in any scenario. At present, the breadth and accuracy of aircraft operation data sources are improving day by day, and computer performance and cluster computing models [28] are also gradually developing, which preliminarily possess the feasibility of promoting the above follow-up research. Therefore, in the case of satisfying the objective conditions, it is necessary to further improve the accuracy of aircraft CP calculation and infinitely approach the real world.
Author Contributions
Conceptualization, C.L. and Y.H.; methodology, C.L.; software, C.L.; validation, C.L. and Z.Z.; formal analysis, C.L.; investigation, C.L. and Z.Z.; resources, C.L. and Y.P.; data curation, C.L.; writing—original draft preparation, C.L.; writing—review and editing, C.L. and Z.Z.; visualization, C.L.; supervision, M.H.; project administration, M.H. and Z.Z.; funding acquisition, M.H. All authors have read and agreed to the published version of the manuscript.
Funding
This research was funded by the National Key R&D Program of China (No.2021YFB1600500).
Data Availability Statement
Not applicable.
Acknowledgments
We gratefully acknowledge Beijing Daxing Airport for case verification of the models and methods. We also thank the Air Traffic Management Bureau of China Civil Aviation Administration for their assistance in parameter verification.
Conflicts of Interest
The authors declare no conflict of interest. The funders had no role in the design of the study; in the collection, analyses, or interpretation of data; in the writing of the manuscript; or in the decision to publish the results.
Abbreviations
The following abbreviations are used in this work:
| 3D | Three-dimensional |
| AIP | Aeronautical information publication |
| ADW | Arrival and departure window |
| ADWS | Arrival and departure window separation |
| CP | Collision probability |
| EA | Emergency avoidance |
| IAS | Indicated airspeed |
| ICAO | International Civil Aviation Organization |
| ISA | International standard atmosphere |
| MURTC | Maximum utilization of runway theoretical capacity |
| NAA | Number of arrival aircraft |
| NID | Non-intersecting diverging |
| PKX | Beijing Daxing Airport |
| TAS | True airspeed |
| TLS | Target level of safety |
References
- ICAO. Safety Management Manual; ICAO: Montreal, QC, Canada, 2018. [Google Scholar]
- ICAO. Operating Procedures and Practices for Regional Monitoring Agencies in Relation to the Use of a 300 m (1000 ft) Vertical Separation Minimum between FL 290 and FL 410 Inclusive; ICAO: Montreal, QC, Canada, 2010. [Google Scholar]
- Goh, S.K.; Singh, N.P.; Lim, Z.J.; Alam, S. Interpretable Tracking and Detection of Unstable Approaches Using Tunnel Gaussian Process. IEEE Trans. Aerosp. Electron. Syst. 2022; early access. [Google Scholar] [CrossRef]
- Singh, N.P.; Goh, S.K.; Alam, S. Real-time unstable approach detection using sparse variational gaussian process. In Proceedings of the 2020 International Conference on Artificial Intelligence and Data Analytics for Air Transportation (AIDA-AT), Singapore, 3–4 February 2020; pp. 1–10. [Google Scholar]
- Wang, L.; Zhong, L. Study on the method of dividing arrival-departure window for closely spaced parallel runway. Flight Dyn. 2020, 38, 18. [Google Scholar]
- Kullstam, P.A. Parallel Runway Spacing. Navigation 1972, 19, 19–28. [Google Scholar] [CrossRef]
- Hsu, D. The Evaluation of Aircraft Collision Probabilities at Intersecting Air Routes. J. Navig. 1981, 34, 78–102. [Google Scholar] [CrossRef]
- Blom, H.; Bakker, G.; Blanker, P.; Daams, J.; Everdij, M.; Klompstra, M. Accident Risk Assessment for Advanced ATM; National Aerospace Laboratory NLR: Rotterdam, The Netherlands, 1999. [Google Scholar]
- Campos, L.M.; Marques, J.M. On probabilistic risk of aircraft collision along air corridors. Aerospace 2021, 8, 31. [Google Scholar] [CrossRef]
- Mitici, M.; Blom, H.A.P. Mathematical Models for Air Traffic Conflict and Collision Probability Estimation. IEEE Trans. Intell. Transp. Syst. 2019, 20, 1052–1068. [Google Scholar] [CrossRef] [Green Version]
- Reich, P.G. Analysis of long-range air traffic systems: Separation standards—I. J. Navig. 1966, 19, 88–98. [Google Scholar] [CrossRef]
- Reich, P.G. Analysis of long-range air traffic systems: Separation standards—II. J. Navig. 1966, 19, 169–186. [Google Scholar] [CrossRef]
- Reich, P.G. Analysis of long-range air traffic systems: Separation standards—III. J. Navig. 1966, 19, 331–347. [Google Scholar] [CrossRef]
- Bakker, G.J.; Blom, H.A.P. Air Traffic Collision Risk Modelling. In Proceedings of the 32nd IEEE Conference on Decision and Control, San Antonio, TX, USA, 15–17 December 1993; pp. 1464–1469. [Google Scholar] [CrossRef]
- Endoh, S. Aircraft Collision Models. Master’s Thesis, Massachusetts Institute of Technology, Cambridge, MA, USA, 1982. [Google Scholar]
- Blom, H.A.; Krystul, J.; Bakker, G.; Klompstra, M.B.; Obbink, B.K. Free flight collision risk estimation by sequential MC simulation. In Stochastic Hybrid Systems; Taylor and Francis Group: Abingdon, UK, 2007; pp. 249–281. [Google Scholar]
- Matthews, R.A. The science of murphy’s law. Sci. Am. 1997, 276, 88–91. [Google Scholar] [CrossRef]
- Sulov, V. Iteration vs recursion in introduction to programming classes: An empirical study. Cybern. Inf. Technol. 2016, 16, 63–72. [Google Scholar] [CrossRef] [Green Version]
- Liu, Y.A.; Stoller, S.D. From recursion to iteration: What are the optimizations? In Proceedings of the 2000 ACM SIGPLAN Workshop on Partial Evaluation and Semantics-Based Program Manipulation, Boston, MA, USA, 22–23 January 1999; pp. 73–82. [Google Scholar]
- Gracey, W. Measurement of Aircraft Speed and Altitude; National Aeronautics and Space Administration Hampton Va Langley Research Center: Hampton, VA, USA, 1980. [Google Scholar]
- Cavcar, M. The international standard atmosphere. Anadolu Univ. Turk. 2000, 30, 1–6. [Google Scholar]
- Piegl, L.A. Ten challenges in computer-aided design. Comput.-Aided Des. 2005, 37, 461–470. [Google Scholar] [CrossRef]
- Stein, A.; Geva, E.; El-Sana, J. CudaHull: Fast parallel 3D convex hull on the GPU. Comput. Graph. 2012, 36, 265–271. [Google Scholar] [CrossRef]
- Tee, Y.Y.; Zhong, Z.W. Modelling and simulation studies of the runway capacity of Changi Airport. Aeronaut. J. 2018, 122, 1022–1037. [Google Scholar] [CrossRef]
- Zhou, Q.; Grinspun, E.; Zorin, D.; Jacobson, A. Mesh arrangements for solid geometry. ACM Trans. Graph. TOG 2016, 35, 39. [Google Scholar] [CrossRef] [Green Version]
- Chen, G.L.; Sun, G.Z.; Zhang, Y.Q.; Mo, Z.Y. Study on parallel computing. J. Comput. Sci. Technol. 2006, 21, 665–673. [Google Scholar] [CrossRef]
- Surbiryala, J.; Rong, C.; Soc, I.C. Cloud Computing: History and Overview. In Proceedings of the 3rd IEEE International Conference on Cloud and Fog Computing Technologies and Applications (IEEE Cloud Summit), Washington, DC, USA, 8–10 August 2019; pp. 1–7. [Google Scholar] [CrossRef]
- Khallouli, W.; Huang, J. Cluster resource scheduling in cloud computing: Literature review and research challenges. J. Supercomput. 2021, 78, 6898–6943. [Google Scholar]
Figure 1.
Schematic diagram of emergency avoidance (EA) situation.

Figure 2.
Schematic diagram of the arrival and departure window (ADW) separation.
Figure 3.
Schematic diagram of ADW calculation.
Figure 4.
Reliability analysis of the EA incidence rate of different numbers of arrival aircraft (NAA).
Figure 4.
Reliability analysis of the EA incidence rate of different numbers of arrival aircraft (NAA).
Figure 5.
Indicated airspeed (IAS) and true airspeed (TAS) for aircraft A320 in the international standard atmosphere (ISA) condition.
Figure 5.
Indicated airspeed (IAS) and true airspeed (TAS) for aircraft A320 in the international standard atmosphere (ISA) condition.
Figure 6.
Climb and descent rates for aircraft A320 in the ISA condition.
Figure 7.
Turn rate for aircraft A320 in the ISA condition.

Figure 8.
Examples of the intersection space of circumscribed cuboids of two aircraft A320. (a) The aircraft on the left is descending, whereas the aircraft on the right is climbing. The circumscribed cuboids of the two aircraft do not intersect. (b) Both aircraft are in level flight. Although the circumscribed cuboids of these two aircraft intersect (marked in red), the actual aircraft shapes do not intersect. Therefore, these two aircraft do not collide with each other.
Figure 9.
Three views of the three-dimensional (3D) model and convex hull of the aircraft A320. (a) Three views of the 3D model of the aircraft A320. (b) Three views of the 3D convex hull of the aircraft A320 based on 3D model.
Figure 9.
Three views of the three-dimensional (3D) model and convex hull of the aircraft A320. (a) Three views of the 3D model of the aircraft A320. (b) Three views of the 3D convex hull of the aircraft A320 based on 3D model.
Figure 10.
Beijing Daxing International Airport (PKX) runway configuration: runways 36L/18R and 01L/19R marked in red are for arrival only, and runways 36R/18L and 11L marked in blue are for departure only. Runways 01L/19R and 11L are a set of non-intersecting diverging runways.
Figure 10.
Beijing Daxing International Airport (PKX) runway configuration: runways 36L/18R and 01L/19R marked in red are for arrival only, and runways 36R/18L and 11L marked in blue are for departure only. Runways 01L/19R and 11L are a set of non-intersecting diverging runways.
Figure 11.
The relationship between the number of arrival aircraft, the EA incidence rate and the required CP (90% reliability).
Figure 11.
The relationship between the number of arrival aircraft, the EA incidence rate and the required CP (90% reliability).

Figure 12.
Schematic diagram of the northward operation of PKX under EA situation (the ADW separations were 0 km to 6/8/10 km respectively, and the aircraft type was A320). The screenshots in subgraphs (a–f) illustrate the progression of simulation time. The gray arrows represent the relationship between arrival aircraft at various distances in successive simulation time frames. In the simulation process, EA situations might occur in every time frame for every arrival aircraft. Consequently, each sub-graph represents the EA situation of every arrival aircraft at a particular time.
Figure 13.
Schematic diagram of the southward operation of PKX under EA situation (the ADW separations are 0 km to 6/8/10 km respectively, aircraft type is A320). The screenshots in sub-graphs (a–f) illustrate the progression of simulation time. The gray arrows represent the relationship between arrival aircraft at various distances in successive simulation time frames. In the simulation process, EA situations might occur in every time frame for every arrival aircraft. Consequently, each sub-graph represents the EA situation of every arrival aircraft at a particular time.
Figure 14.
The calculation flowchart of the upper limit of the ADW separation.
Figure 15.
Results of the upper limit of the arrival and departure window separation (ADWS). (a) The EA maximum speed limit was 230 kt (118.3 m/s), and PKX was running northward. (b) The EA maximum speed limit was 200 kt (102.9 m/s), and PKX was running northward. (c) The EA maximum speed limit was 230 kt (118.3 m/s), and PKX was running southward. (d) The EA maximum speed limit was 200 kt (102.9 m/s), and PKX was running southward.

Figure 16.
Relationship between ADW separation and maximum utilization of runway theoretical capacity (MURTC).
Figure 16.
Relationship between ADW separation and maximum utilization of runway theoretical capacity (MURTC).

Table 1.
Critical parameters of departure aircraft (A320) from runway 11L.
| Description | Parameter | Source |
|---|---|---|
| Acceleration of take-off roll | 1.7 m/s to 2.5 m/s | Historical data analysis, expert experience |
| Acceleration from the lift-off of the aircraft to the retraction of the landing gear | 0.8 m/s | Historical data analysis, expert experience |
| Acceleration after retracting the landing gear | 1.2 m/s | Historical data analysis, expert experience |
| Normal departure climb gradient | 4.5% | AIP data |
Table 2.
Critical parameters of arrival aircraft (A320) to runway 01L/19R.
| Description | Parameter | Source |
|---|---|---|
| Maximum speed limit under EA situation | 200 kt (102.9 m/s) or 230 kt (118.3 m/s) | Procedure design specifications, expert experience |
| Duration of controller’s command to arrival aircraft under EA situation | 8 s | Expert experience |
| Duration of pilot read-back command of arrival aircraft under EA situation | 4 s | Expert experience |
| Duration from the time the pilot begins operating the arrival aircraft until the aircraft begins to change the attitude | 8 s | Expert experience |
| Turn slope under EA situation | 25° | Procedure design specifications, expert experience |
| Climb rate under EA situation | 0.0% to 20.0% | Expert experience |
| Acceleration under EA situation | 1.2 m/s | Historical data analysis, expert experience |
| Normal approach glide angle | 3° | AIP data |
Disclaimer/Publisher’s Note: The statements, opinions and data contained in all publications are solely those of the individual author(s) and contributor(s) and not of MDPI and/or the editor(s). MDPI and/or the editor(s) disclaim responsibility for any injury to people or property resulting from any ideas, methods, instructions or products referred to in the content. |
© 2023 by the authors. Licensee MDPI, Basel, Switzerland. This article is an open access article distributed under the terms and conditions of the Creative Commons Attribution (CC BY) license (https://creativecommons.org/licenses/by/4.0/).
Share and Cite
MDPI and ACS Style
Li, C.; Hu, M.; Zhao, Z.; Hu, Y.; Peng, Y. Non-Intersecting Diverging Runways Separation under Emergency Avoidance Situation. Aerospace 2023, 10, 131. https://doi.org/10.3390/aerospace10020131
AMA Style
Li C, Hu M, Zhao Z, Hu Y, Peng Y. Non-Intersecting Diverging Runways Separation under Emergency Avoidance Situation. Aerospace. 2023; 10(2):131. https://doi.org/10.3390/aerospace10020131
Chicago/Turabian StyleLi, Changcheng, Minghua Hu, Zheng Zhao, Yuxin Hu, and Ying Peng. 2023. "Non-Intersecting Diverging Runways Separation under Emergency Avoidance Situation" Aerospace 10, no. 2: 131. https://doi.org/10.3390/aerospace10020131
Note that from the first issue of 2016, this journal uses article numbers instead of page numbers. See further details here.