
Experimental and Numerical Investigation of a Novel Vortex Reducer in a Co-Rotating Cavity of Aeroengines

College of Energy and Power Engineering, Nanjing University of Aeronautics and Astronautics, Nanjing 210016, China
*
Author to whom correspondence should be addressed.
Aerospace 2024, 11(3), 225; https://doi.org/10.3390/aerospace11030225
Submission received: 20 January 2024
/
Revised: 9 March 2024
/
Accepted: 11 March 2024
/
Published: 13 March 2024
(This article belongs to the Section Aeronautics)
Abstract
:Improving airflow pressure is of great significance for the cooling and sealing of aeroengines. In a co-rotating cavity with radial inflow, vortex reducers are used to decrease the pressure drop. However, the performance of traditional vortex reducers is limited by their drag reduction mechanism and cannot meet the needs of next-generation aeroengines. In this study, a novel vortex reducer (NVR) consisting of de-swirl shroud orifices and fins is proposed. Meanwhile, a design strategy is developed to ensure the NVR provides steady airflow and excellent drag reduction performance. Furthermore, experiments and numerical simulations are utilized to investigate the flow characteristics and drag reduction mechanism of the NVR. The results reveal that the de-swirl jets created by the de-swirl shroud orifices limit the enhancement of the Ekman layers at large radii, while the fins break down the high-speed vortices at small radii. Compared to a traditional finned vortex reducer with identical fins, the pressure drop of the NVR is relatively reduced by 28.52%. Specifically, the pressure drop of the NVR is monotonous in the operating range, indicating its suitability for engineering. Finally, a surrogate model and particle swarm optimization (PSO) are utilized to identify the optimal parameters of the de-swirl shroud orifices in the design range. This study provides a potential solution for the design of next-generation vortex reducers.
1. Introduction
Modern aeroengines aim for greater thermodynamic cycle efficiency, which leads to higher turbine inlet temperatures. Thus, the cooling of hot-end components in the core engine becomes more difficult [1]. A secondary air system (SAS) is employed for thermal management in modern aeroengines [2,3]. As indicated in Figure 1, cooling airflow is taken from the compressor and enters the SAS through the compressor disk cavity. However, due to the strong centrifugal force, the airflow in the cavity has a high pressure drop. To solve the aforementioned problem, vortex reducers [4,5,6] are used to reduce the pressure drop, among which traditional vortex reducers include tubeless vortex reducers (TLVRs), tubed vortex reducers (TVRs), and finned vortex reducers (FVRs).
For a co-rotating cavity with radial inflow, Hide [7] was the first to investigate a source–sink flow based on smoke visualization experiments. Based on this, Owen et al. [8] theoretically analyzed the linear and nonlinear solutions of the Ekman layer. Due to the complexity of nonlinear solutions, Barcilon [9] and Owen [10] attempted to improve the linear solutions via modification. Furthermore, Firouzian et al. [11] developed a mathematical model for predicting the pressure coefficient based on linear solutions. However, it should be noted that linear solutions are not applicable to engineering. In addition, Firouzian et al. [12] also pointed out that the Ekman layer and core region are the primary regions of high pressure drops, and high-speed, large-scale vortices generate centripetal pressure drops. In principle, vortex reducers limit the enhancement of the Ekman layer and vortices by suppressing tangential flow.
In a TLVR, the nozzles weaken the tangential velocity in the downstream region by generating de-swirl jets [13]. Under ideal conditions, the nozzles can reduce the pressure drop in the downstream region to 0. However, Pfizner et al. [14] and Negulescu et al. [15] pointed out that TLVRs have unsteady air-entraining characteristics, which might lead to gas intrusion into the SAS under extreme conditions. When the local pressure drop in the nozzles is considered, the pressure drop of a TLVR will be higher than that of a rigid body [16]. Furthermore, Shen et al. [17] found that the nozzles have a large number of small-scale vortices and high turbulent fluctuations, which leads to high energy dissipation. Thus, Lee et al. [18] and Liu et al. [19] proposed vane-shaped nozzles to reduce the local pressure drop. It is worth noting that the collaborative optimization of multiple geometrical parameters of nozzles is a challenge. In recent years, using high-dimensional surrogate models for predicting the effects of multiple geometrical parameters has become an acceptable approach [18,20,21].
Unlike a TLVR, TVRs and FVRs decrease the pressure drop by breaking high-speed, large-scale vortices [22,23,24]. Specifically, the rigid-body vortices formed in the tube and fin channel can only decrease the swirl ratio to one, resulting in the TVR and FVR having steady air-entraining characteristics. However, the aforementioned phenomenon does not mean that the performance of the TVR and FVR is superior to that of a TLVR. On the one hand, Owen et al. [8] discovered that the centripetal pressure drop in the cavity is directly proportional to the square of the swirl ratio. Therefore, the TVR and FVR still inevitably experience a centripetal pressure drop caused by the centrifugal force. On the other hand, Luo et al. [25] and Ma et al. [26] pointed out that TVRs have high levels of stress, which poses a threat to their operation. Overall, traditional vortex reducers are limited by their drag reduction mechanisms and structural characteristics.
To reduce the pressure drop, Du et al. [27] attempted to improve the fin profile. Sibilli et al. [28] and Mucci et al. [29] reduced the local pressure drop at the tube inlet by tilting the tubes. However, it should be noted that simple optimization cannot fundamentally tackle the defects of traditional vortex reducers. Interestingly, Wei et al. [30] developed a hybrid vortex reducer (HVR) by combining nozzles and tubes, and the test results demonstrated that it could significantly minimize the tube length while maintaining drag reduction performance. However, their results indicated that the HVR still had unsteady air-entraining characteristics. Theoretically, the key to ensuring steady air-entraining characteristics is to control the swirl ratio so that it is never less than −1. At the same time, maintaining the swirl ratio to approach 0 is crucial for significantly reducing the pressure drop.
Overall, previous studies have revealed the drag reduction mechanism of traditional vortex reducers and carried out extensive optimization. However, the limitations of traditional vortex reducers have not been overcome. In this study, an NVR configuration, which consists of de-swirl shroud orifices and fins, is proposed. Furthermore, a design strategy is developed to ensure the NVR has steady air-entraining characteristics. Experiments and numerical simulations are conducted to investigate the drag reduction mechanism of the NVR and verify its performance. Finally, the surrogate model and PSO are applied to improve the monotonicity of the pressure drop.
The subsequent sections are as follows. In Section 2, the test configuration and computational procedure are described in detail. Section 3 presents a design strategy for the NVR. In Section 4, the performance of the NVR is validated by tests and numerical simulations. The main conclusions of this study are summarized in Section 5.
2. Experimental Configuration and Computational Procedure
2.1. Experimental Configuration
2.1.1. Test System
A test system is used to investigate the NVR’s performance, as shown in Figure 2. The compressed air enters the test rig via pipelines, and five solenoid valves control the flow rate precisely. The airflow in the test rig initially enters a collecting chamber before passing through the shroud orifices into the rotating cavity. Furthermore, a 15 kW three-phase motor is connected to the shaft by a flexible coupling, and a controller controls its rotating speed. For data collection, static data such as flow rates and intake conditions are sent directly to the computer via data lines. Due to the high-speed rotation of the test rig, the rotating data are saved by a recorder positioned on the shaft. Additionally, the shroud and fins bolted between the two disks are configured to be removable to facilitate the replacement of the test article.
2.1.2. Vortex Reducer Configurations
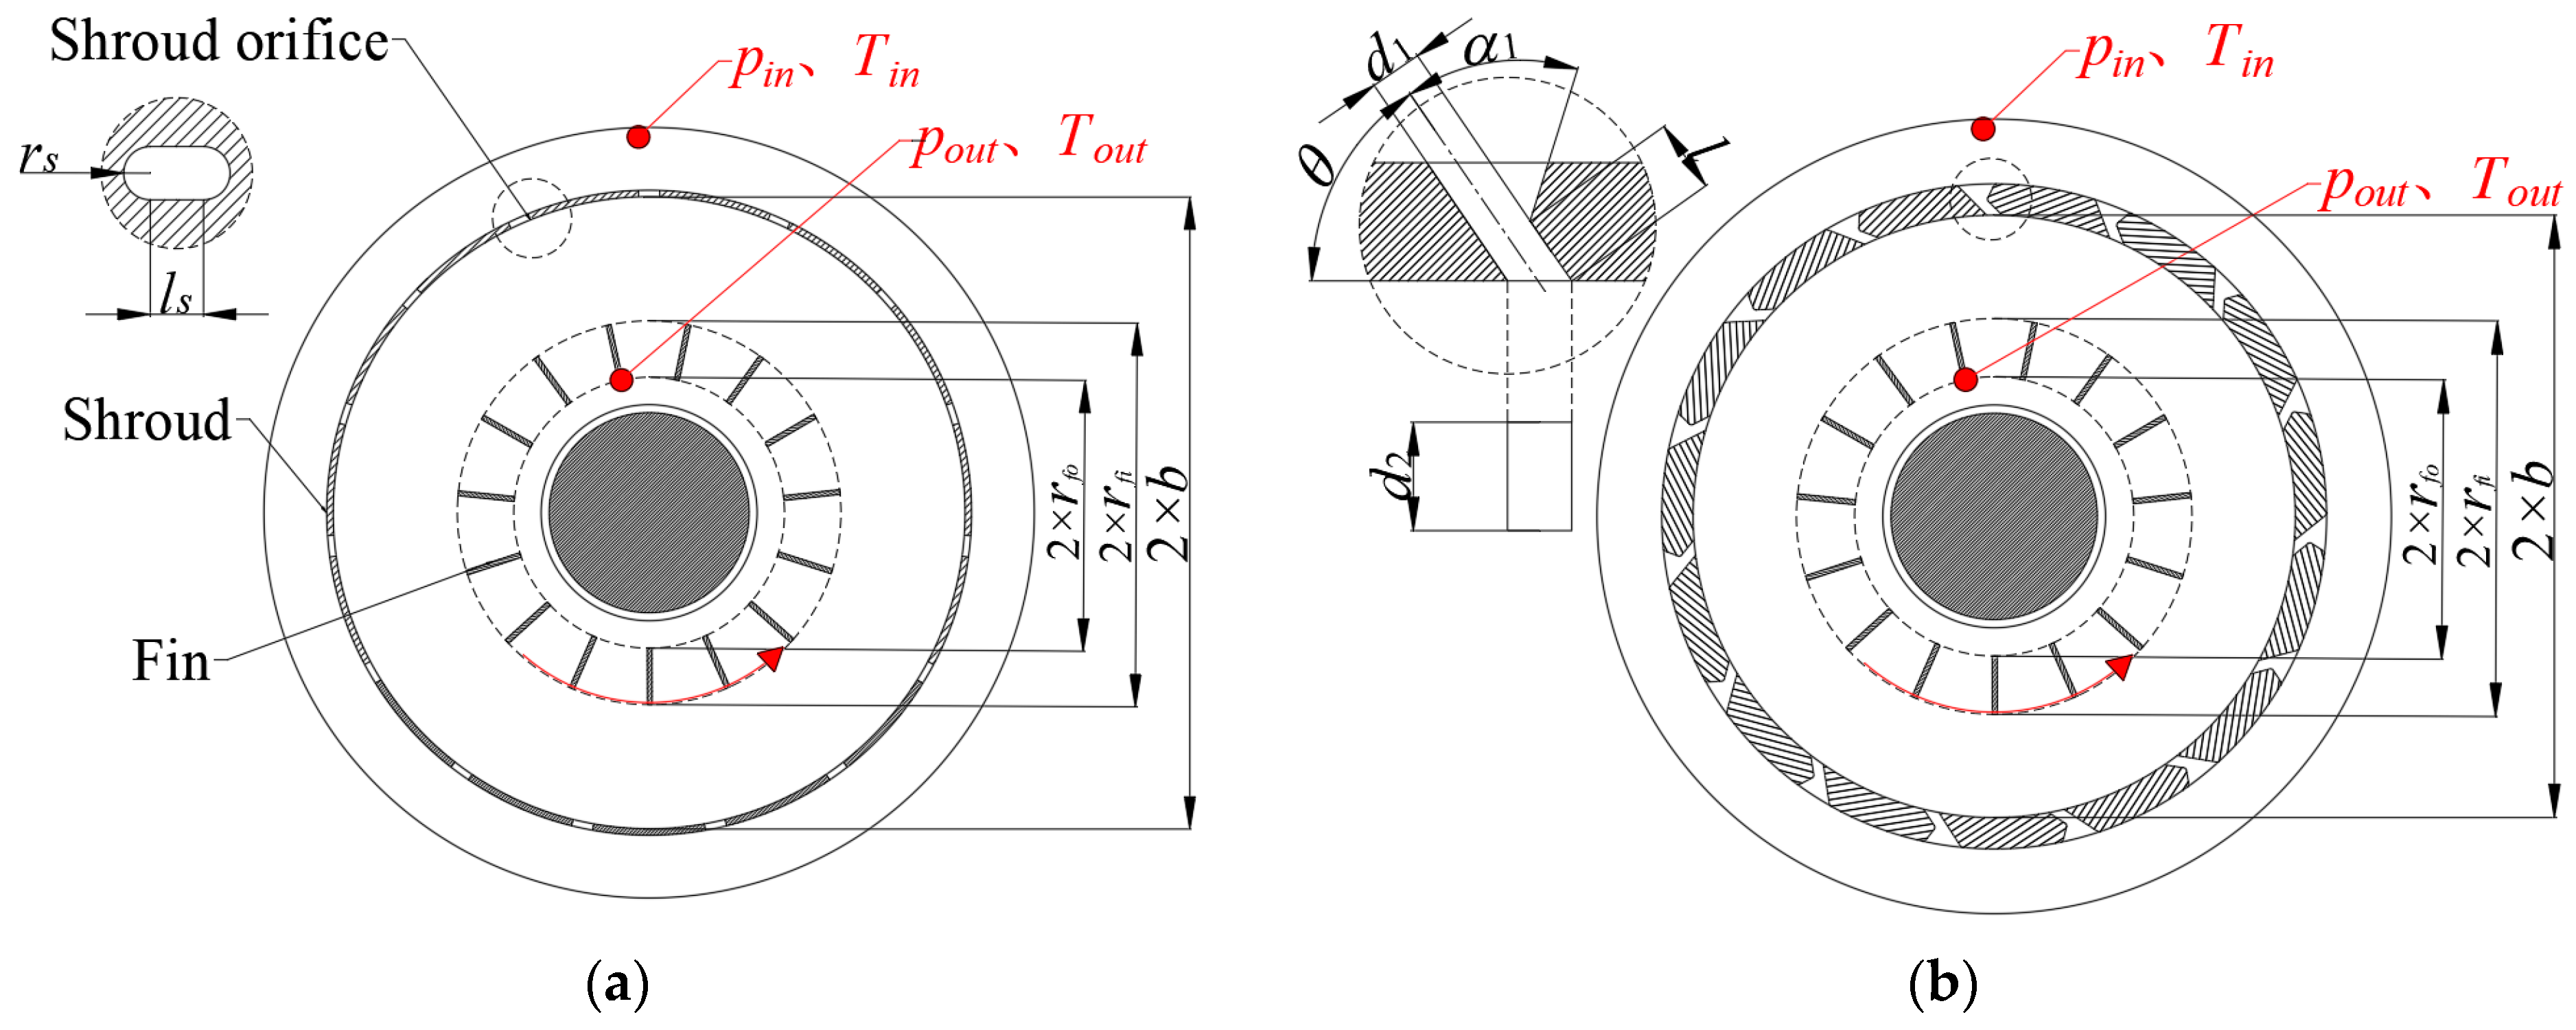
In this study, two vortex reducers are experimentally investigated, as shown in Figure 3. For the convenience of the subsequent analysis, the FVR with identical fins as the NVR is named FVR1. Compared to FVR1, the NVR has a different shroud. Given the actual aeroengine configuration, the outer radius of the NVR shroud remains unchanged, while the inner radius, b, is lowered to 185 mm. In FVR1, the inner radius, b, of the shroud is 195 mm. Thus, FVR1’s and the NVR’s shroud thicknesses are 4 mm and 14 mm, respectively. Furthermore, the inner radius, a, and axial width, S, of the cavities are 67 mm and 50 mm, respectively. The outer radius, rfi, and inner radius, rfo, of the fins are 130 mm and 75 mm, respectively. In the present study, the number of shroud orifices and fins is 15. Table 1 displays all the geometrical parameters.
In terms of data collection, measuring points are set at the collecting chamber as well as the inner radius of the fins. Table 2 shows the range of experiments. According to the mathematical model made by Shen et al. [17], the theoretical temperature drop under the experimental conditions in this study is less than 1 K, while the error of K-type thermocouples is ±1 K. Therefore, the temperatures measured experimentally are used only to set the boundary conditions of the computational model.
2.1.3. Experimental Uncertainty
The flow rate is measured using two vortex flowmeters, each with a 30–300 m3/h measuring range and an accuracy of ±5% FS. A P9216 pressure scanner with a measurement range of 0–500 kPa and an accuracy of 0.01% of the reading value is used to measure static data. Kulite pressure sensors, which have a measuring range of 0–500 kPa with an accuracy of ±0.5% of the reading value, are used to measure rotating data. Furthermore, K-type thermocouples are used to measure the temperature, offering a 173–673 K measuring range and an accuracy of ±1 K. In this study, three dimensionless parameters are focused on, including the rotating Reynolds number, , the dimensionless flow rate, , and the turbulence parameter, , where ρ, ω, μ, and m denote the density, the rotating angular velocity, the dynamic viscosity, and the mass flow rate, respectively. According to the error transfer theory [31], the maximum relative errors of the rotating Reynolds number, dimensionless flow rate, and turbulence parameter are 0.527%, 2.068%, and 2.111%, respectively.
2.2. Computational Procedure
2.2.1. Computational Models and Boundary Conditions
The take-off and cruising statuses directly impact the geometrical parameters of the HVR (this will be discussed in Section 3). However, our experimental speed makes it difficult to reach a cruising status. Thus, numerical simulations are used to investigate the flow characteristics of the vortex reducers under high-speed conditions.
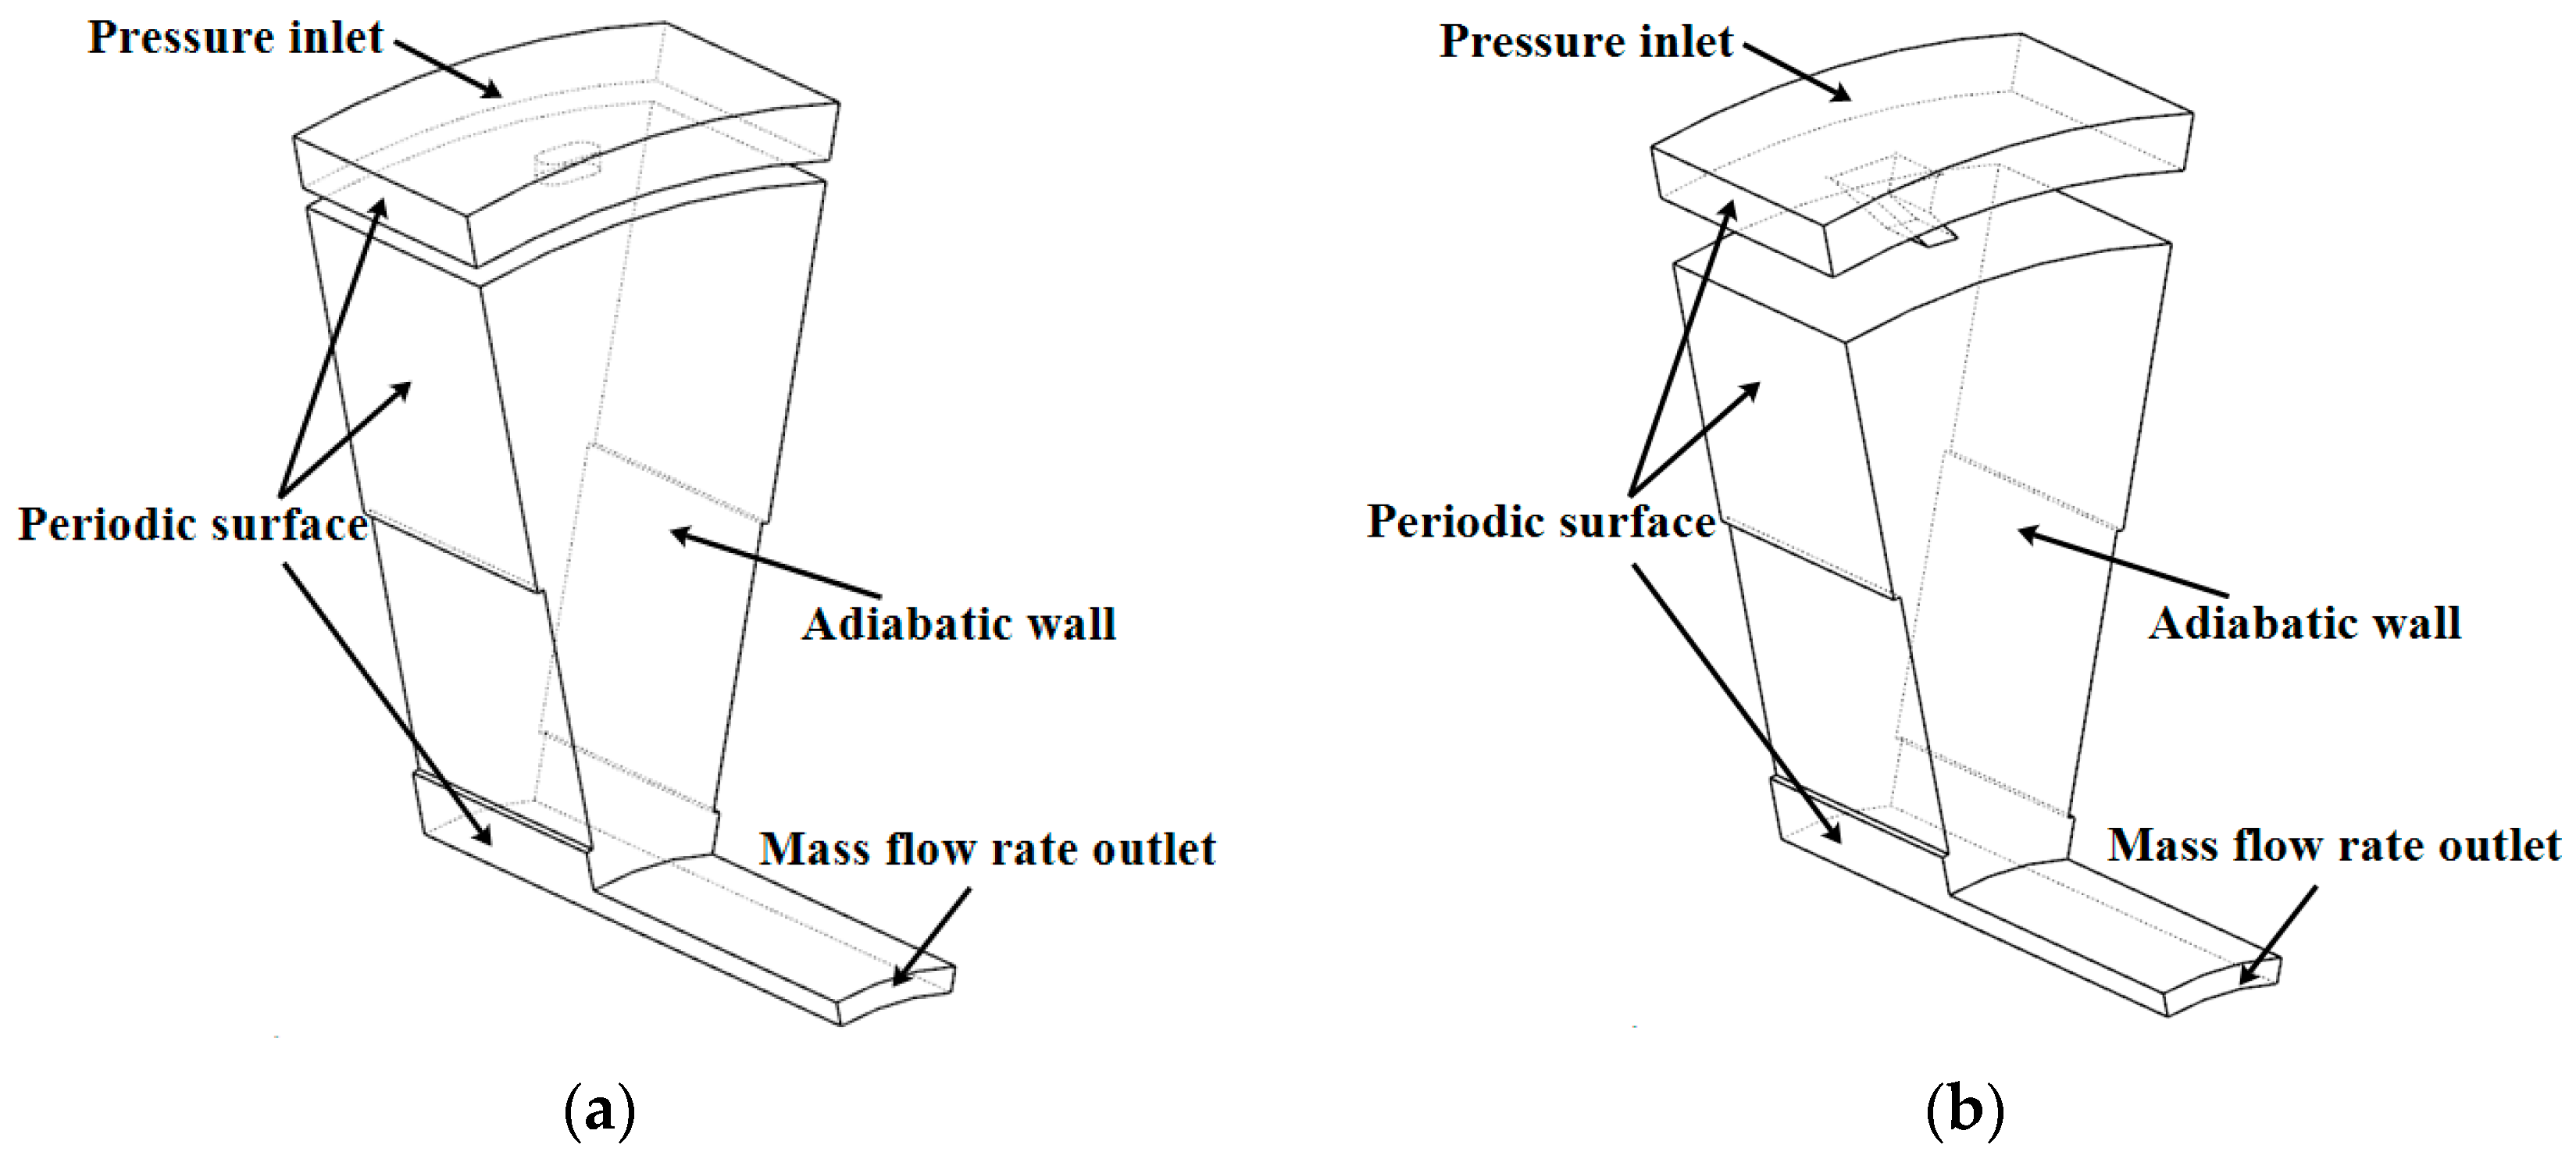
As illustrated in Figure 4, the computational models are extracted based on the test rig. For numerical simulations of rotating cavities, Li et al. [32] discovered that a periodic model and a full model generate similar results. Thus, 1/15 of the whole cavity is defined as a computational domain to save computing resources. CFX 17.2 software is used to simulate a steady flow in the cavities. The inlet for the aforementioned model is configured as a pressure inlet, the outlet as a mass flow outlet, and the wall as an adiabatic wall. Table 3 shows the boundary conditions of the computational model.
When the outer radius of the fins is extended to the outer radius of the cavity, the FVR has the best drag reduction effect [22]. To highlight the excellent performance of the NVR, a finned vortex reducer (FVR2) with a fin outer radius of 195 mm is also numerically investigated.
2.2.2. Grid and Numerical Methods
An ANSYS mesh is used to generate unstructured grids, as shown in Figure 5. The maximum grid size allowed is 1.5 mm. In this study, the scalable wall function is employed to deal with the boundary layer. Thus, the height of the first layer grid near the wall is set to 0.02 mm to ensure that y+ is below 100. In particular, the grids at the shroud orifice are locally encrypted.
It is worth noting that the high-speed rotating cavity has a significant swirling flow. Because of the lack of a description mechanism, Jones et al. [33] and Poncet et al. [34] concluded that the k–ε model is unsuitable for calculating swirl. Furthermore, Vinod et al. [35] stated that the RSM model is better suited for rotating cavities than the k–ε and S–A models. Thus, the RSM model is chosen as the turbulence model. Its Reynolds mean momentum equation is as follows:
where is the modified pressure, and is the sum of body forces and the fluctuating Reynolds stress.
A grid independence test is performed, as shown in Figure 6. The pressure drop (Δp = pin − pout) in the NVR is utilized as an indication. The numerical results tend to flatten as the number of grids rises. Thus, the number of grids is set to 2 million to preserve computational resources. The statistical results show that the average mesh metric is about 0.46.
2.2.3. Validation of Numerical Methods
The pressure drop in the NVR and FVR1 is utilized to validate the numerical methods, as seen in Figure 7. The dimensionless flow rate, Cm, is 2.166 × 10⁴. Compared to the experiment, the average relative error of the numerical simulation is 8.21%, indicating that the numerical methods in this study are effective.
3. Design Strategy and Methods for the NVR
3.1. Control Parameters
3.1.1. De-Swirl Shroud Orifice
For a high-speed co-rotating cavity with radial inflow, the centripetal pressure drop caused by centrifugal force is as follows [16]:
where x = r/b is the dimensionless radius. And , where Vϕ denotes the absolute tangential velocity of the airflow. According to Equation (3), the centripetal pressure drop is proportional to the square of the swirl ratio. Specifically, the centripetal pressure drop is 0 when the swirl ratio is 0 (the absolute tangential velocity of the airflow is 0). Farthing et al. [6] pointed out that the swirl ratio distribution in a cavity depends on the inlet swirl ratio, c, and the turbulence parameter, . Based on the conservation of angular momentum and the linear Ekman equations, the swirl ratio distribution [8] is expressed as follows:
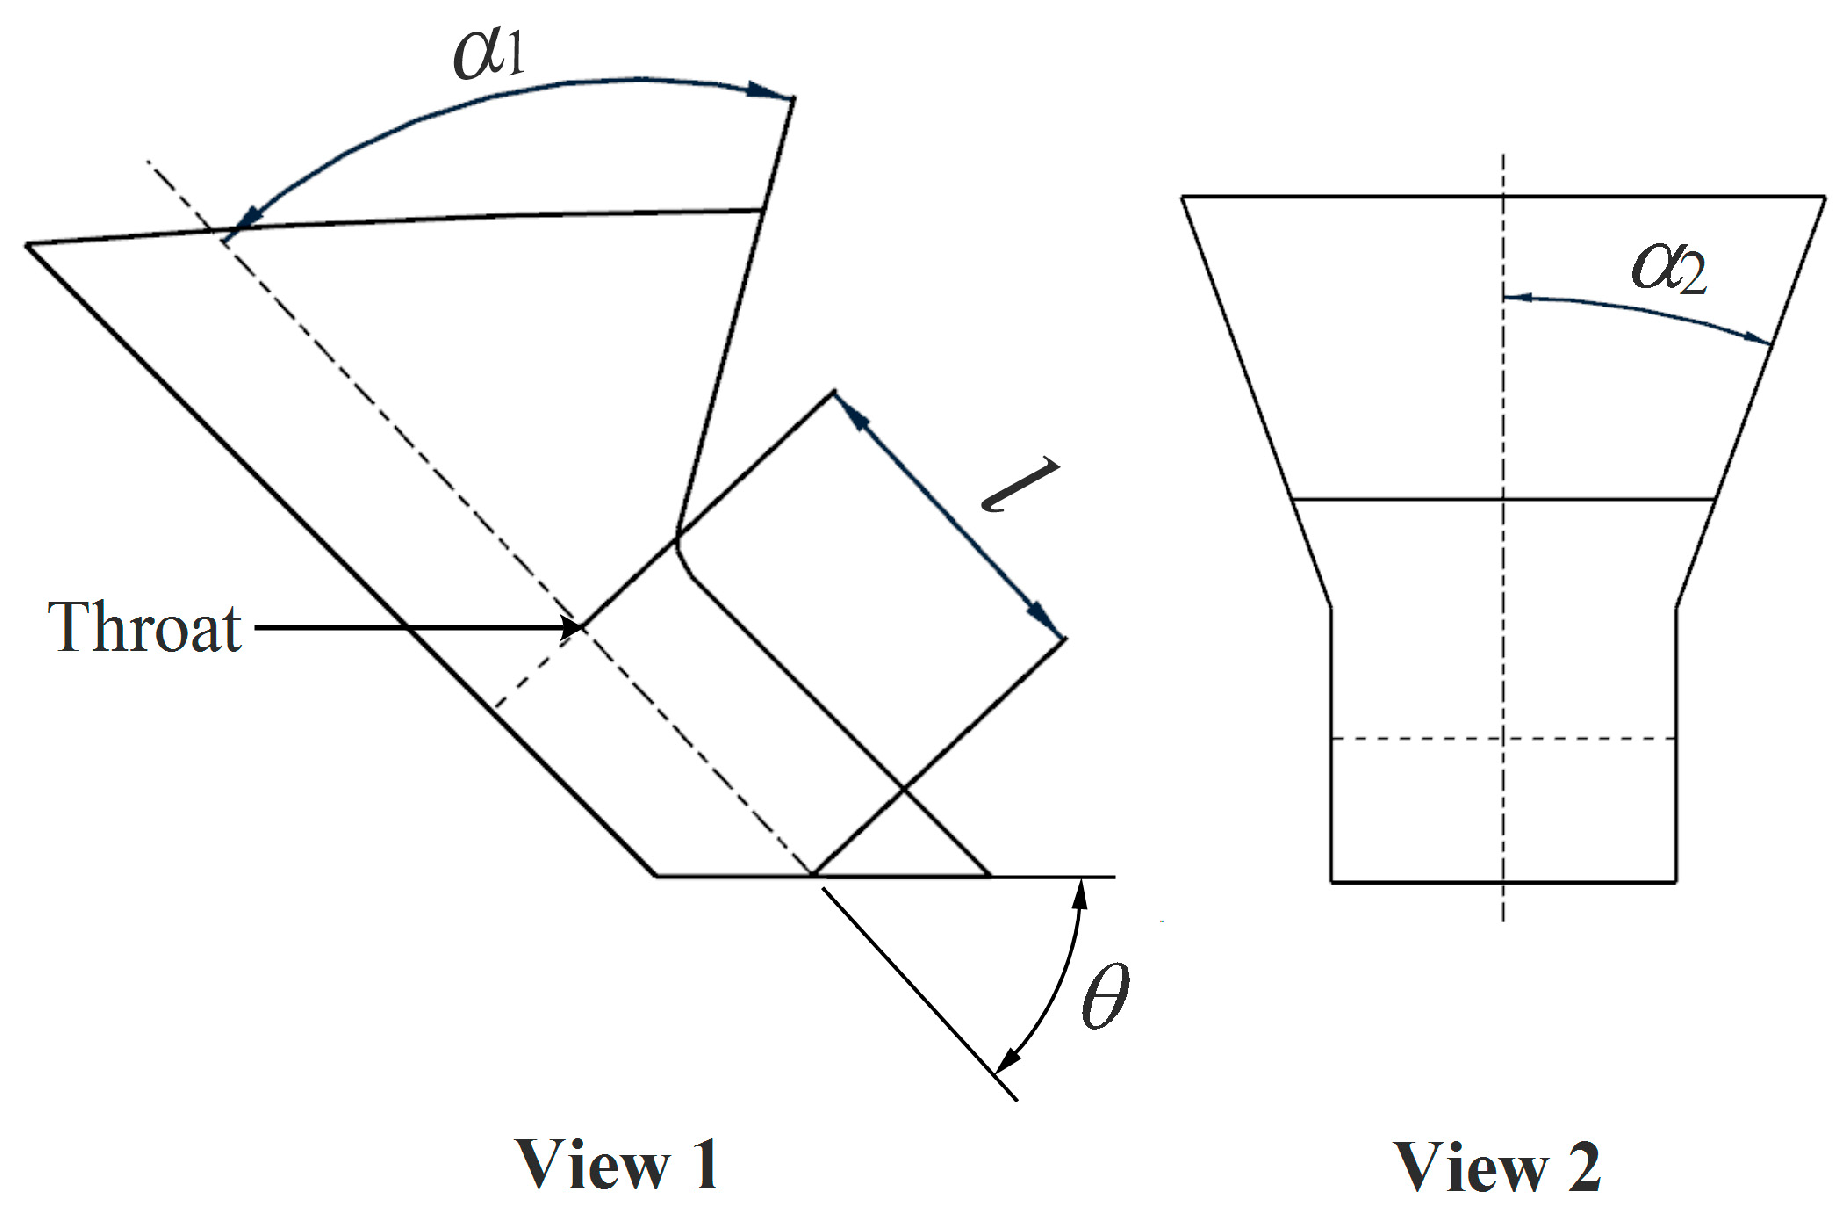
Equations (4) and (5) can be used to calculate the swirl ratio in the source and core regions, respectively. In theory, the swirl ratio in the cavity is 0 when the inlet swirl ratio, c, is 0. Thus, de-swirl jets are an efficient way to decrease the inlet swirl ratio. However, a nozzle has two shortcomings: a high local pressure drop and unsteady air-entraining characteristics [24]. Due to the sudden change in flow area, the rapidly changing velocity generates a high local pressure drop. To address the first problem, the de-swirl shroud orifices are angled to form nozzle-like structures capable of directly removing the local pressure drop caused by additional nozzles, as shown in Figure 8. For the second problem, when the inlet swirl ratio is below −1, the centripetal pressure drop will increase sharply. Thus, the inclined angle and throat area of the de-swirl shroud orifices must be limited. Based on the conservation of mass, the inlet swirl ratio is represented as follows:
where θ, N, and S are the inclined angle, number, and throat area of de-swirl shroud orifices, respectively. Equation (6) can be simplified as follows:
When the vortex reducer is running, the turbulence parameter is usually between 0.1 and 0.5 [17,36]. Meanwhile, a turbulence parameter of 0.3 is the design point for the vortex reducer. Thus, the inlet swirl ratio should be greater than 0 to ensure it does not fall below −1 at extremely high flow rates. Assuming that the SAS always has a steady operating status (λt = 0.3), Equation (7) shows that when the rotating speed decreases, so does the inlet swirl ratio. If a high rotating speed is selected as the operating condition of the design point and c = 0 is taken as the target, the air-entraining characteristics of the vortex reducer may deteriorate at low rotating speeds.
In the case of modern aeroengines, such as the CFM 56, the rotating speed of the high-pressure compressor in cruising mode is typically between 15,000 rev/min and 16,000 rev/min. In this study, the rotating angular velocity corresponding to the design point of the cruising status is 1675.4 rad/s. Furthermore, the lower limit of the operating condition in reference to the take-off status is established as 167.5 rad/s. According to the aforementioned operating range, when the inlet swirl ratio is higher than 0.4 at the design point of the cruising status, the corresponding inlet swirl ratio at the design point of the take-off status is greater than 0. In the present study, the inlet swirl ratio is limited to about 0.5 at the design point of the cruising status.
Similar to nozzles, de-swirl shroud orifices also have high local pressure drops. To further improve the NVR’s performance, the geometrical parameters of the de-swirl shroud orifices need to be optimized. In this study, the parameters to be optimized include the straight length, l, the leeward angle, α1, and the expansion angle, α2, as shown in Table 4.
3.1.2. Fin
According to Equations (4) and (5), when the inlet swirl ratio is 0.5, the swirl ratio at a small radius will be higher than 1. Thus, the fins are installed at a small radius to restrict the tangential flow of airflow, and the swirl ratio in the fin channel will be limited to around 1. Studies by Wei et al. [36] and Shen et al. [37] showed that when the swirl ratio is 1 (and the relative tangential velocity is 0), the local pressure drop at the outer radius of the fins is minimized, and the fins can suppress the swirl ratio in the cavity to the lowest level. At the design point, the dimensionless outer radius of the fins is 0.703 based on Equation (4).
3.1.3. Design Procedure
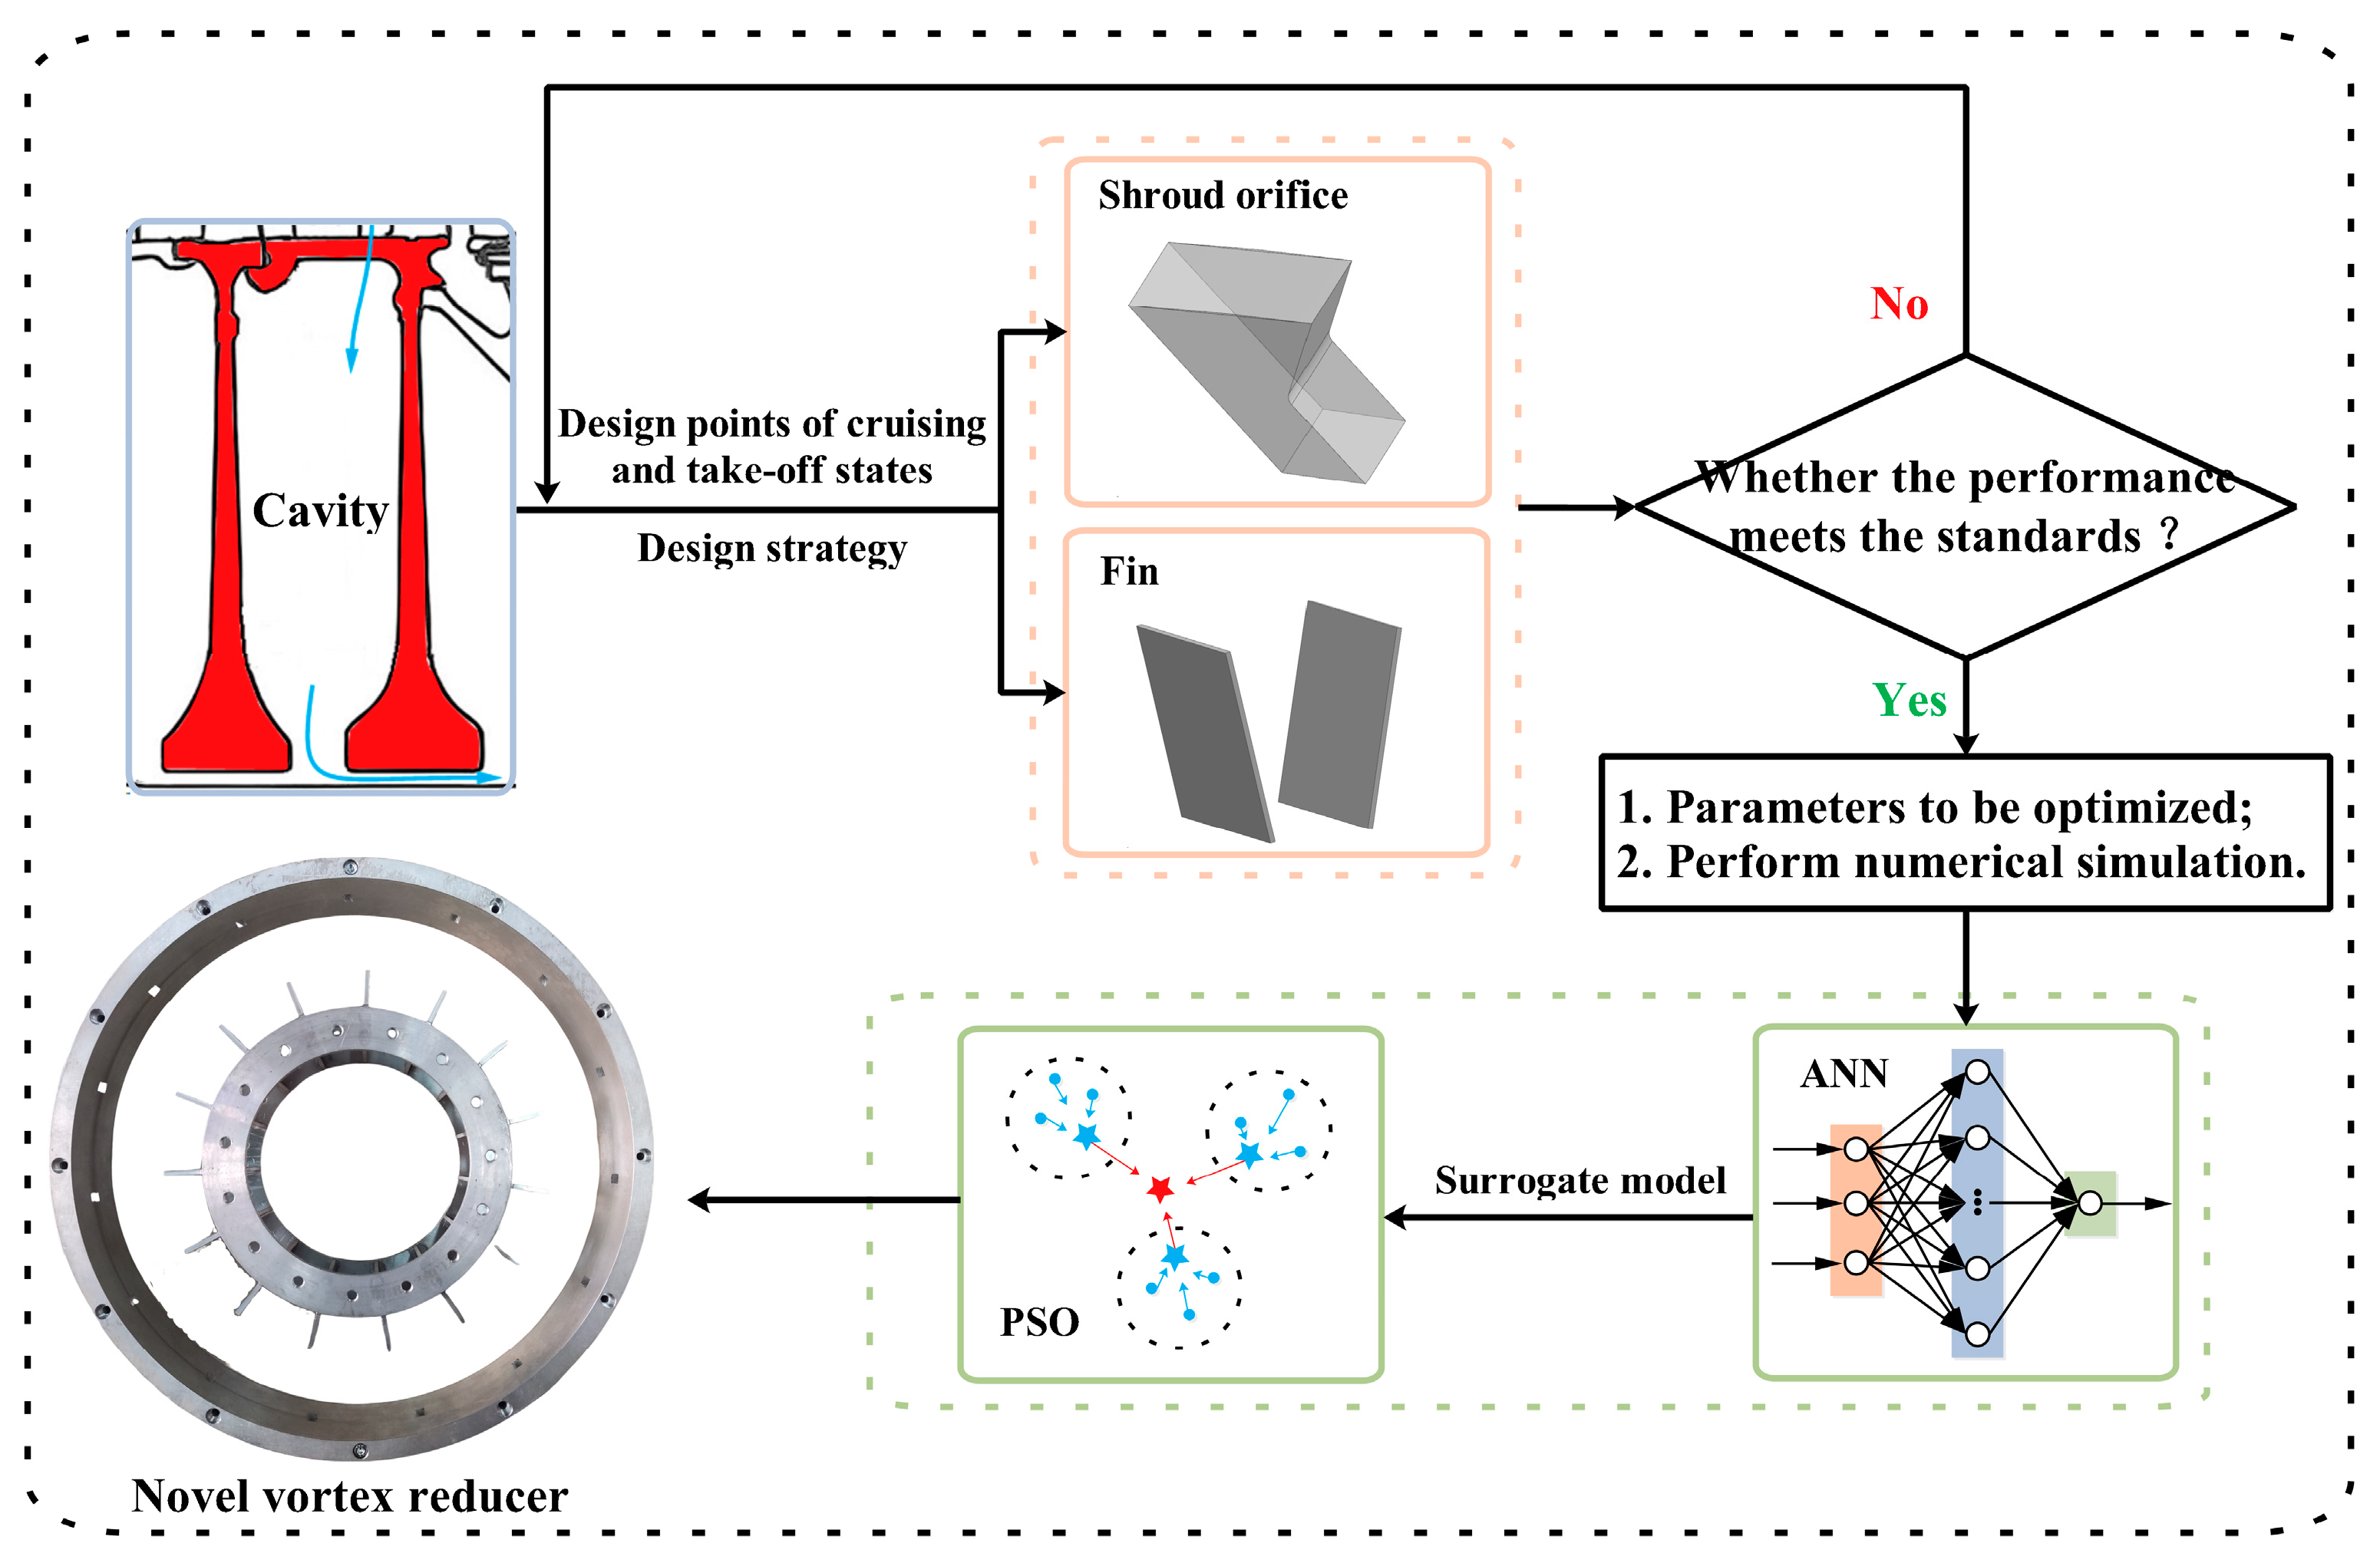
Figure 9 shows the design procedure for the NVR. Step 1: the design points of the cruising and take-off statuses are determined based on the actual compressor disk cavity. Step 2: the inlet swirl ratio at the design point of the cruising status is estimated. Step 3: the inclined angle and throat area of the de-swirl shroud orifices, as well as the outer radius of the fins, are determined based on the design strategy. Step 4: whether the air-entraining characteristics and drag reduction performance of the NVR meet the standards are checked. If not, we return to step 2. Step 5: the geometrical parameters to be optimized are subjected to numerical simulations. Step 6: an artificial neural network (ANN) is used to establish the surrogate model, and PSO is used to find the optimal parameters in the design range.
3.2. ANN Procedure
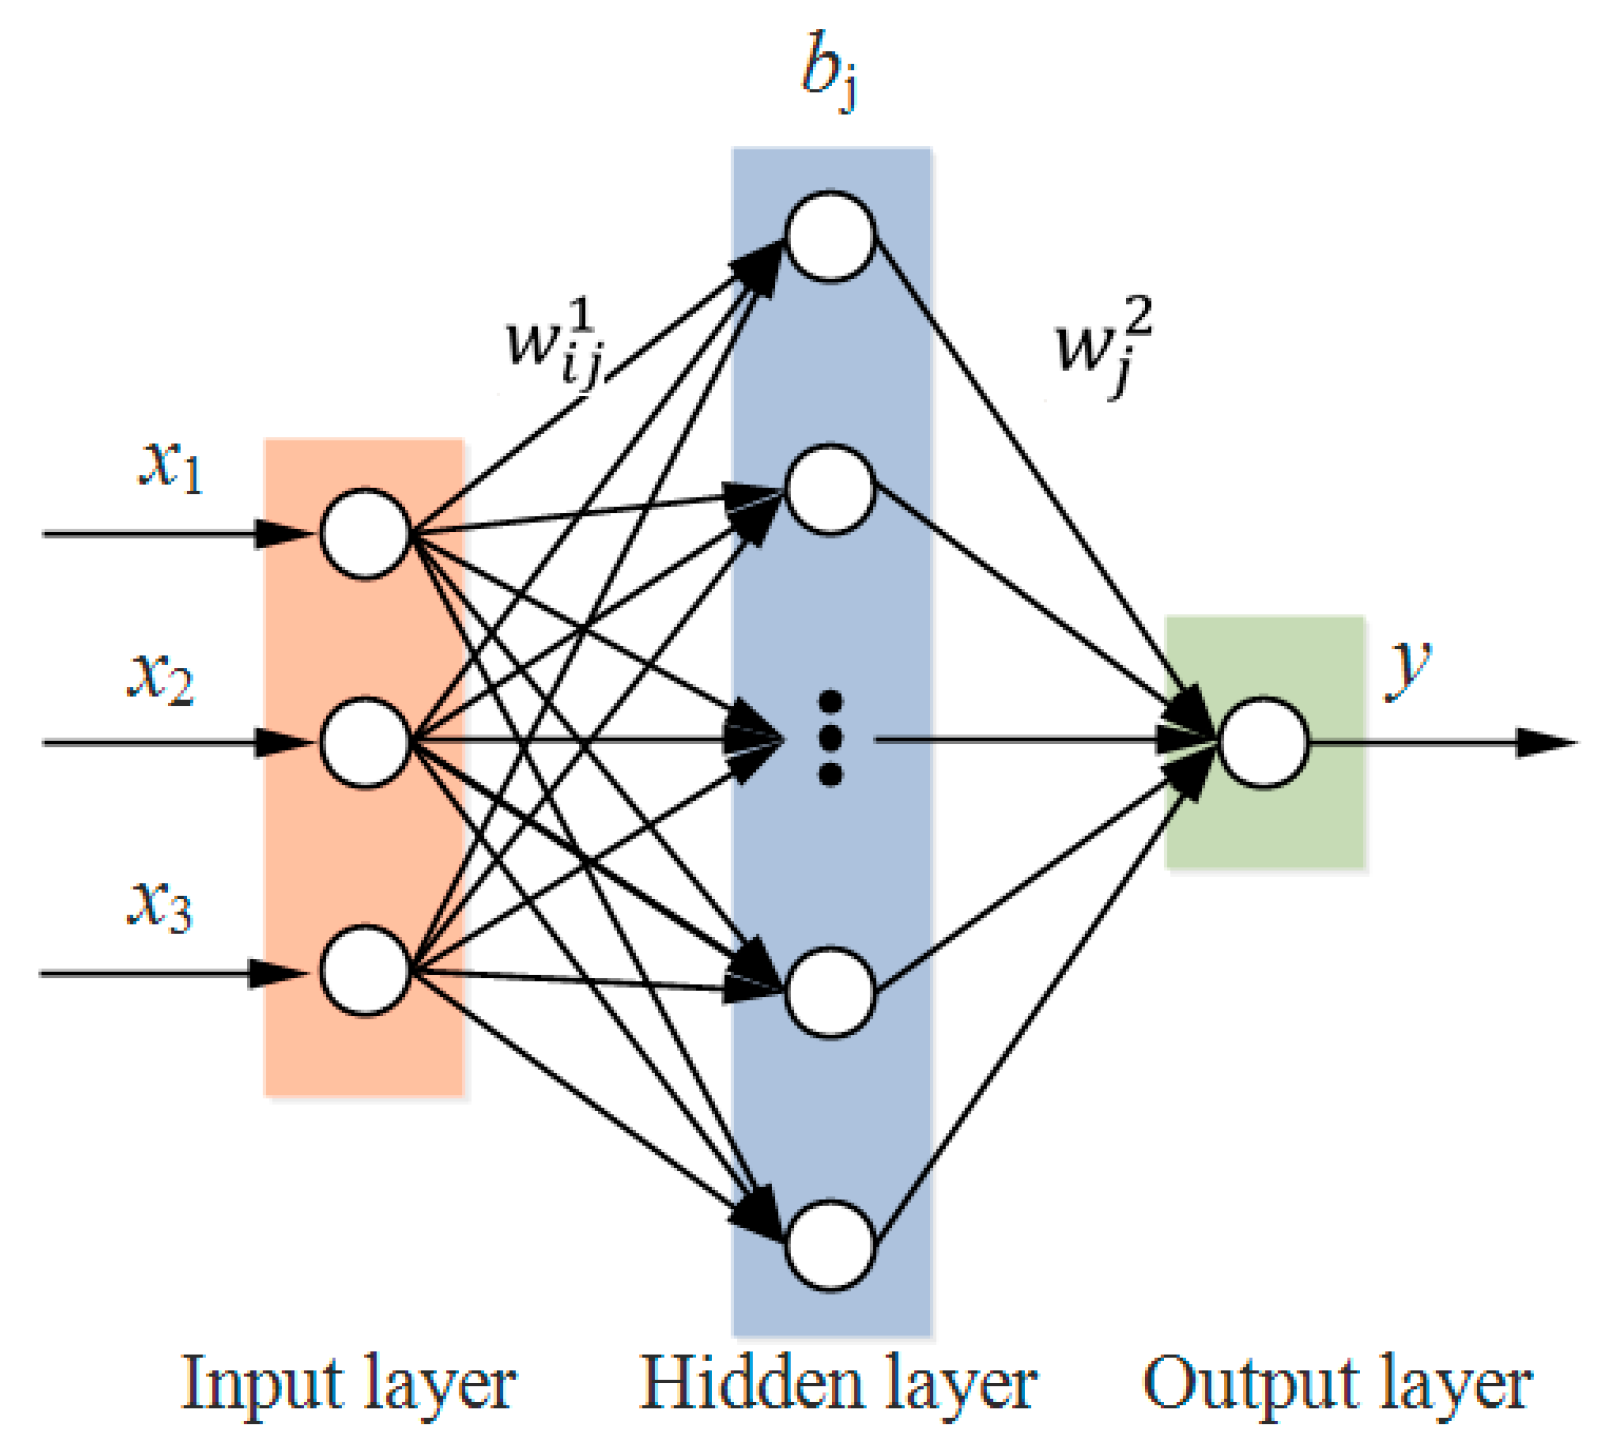
The ANN in this study is shown in Figure 10 [38] and has three inputs, one output, and a hidden layer with ten nodes. The output of the hidden layer is as follows:
where , , and represent the hidden layer input parameters, weighting, and bias, respectively. In this study, the sigmoid function is selected as the activation function. In the output layer, linear correlation is applied:
where represents the weighting of the output layer. In this study, the Levenberg–Marquardt algorithm is used to train the ANN, and the mean square error (MSE) is used as the loss function.
3.3. PSO Procedure
Assuming that there are m particles in N-dimensional space, the initial position and initial velocity of the particles are and , where i = 1, 2, …, m. and are used to represent the historical optimal location of the particles and the historical optimal location of the community, respectively. In the PSO [39,40], the updating equation of particle velocity and position is as follows:
where k and w = 1 are the current iteration step and weighting factor, respectively. n = 1, 2, …, N. = 1 and = 1 are learning factors. and are uniform random numbers in (0, 1).
In this study, the de-swirl shroud orifice needs to be optimized to reduce the local pressure drop. Thus, the fitness function is as follows:
where , , and . It is inappropriate to use the local pressure drop, Δplocal, as a fitness function directly (because the surrogate model needs a normalized parameter when training). Thus, the local pressure coefficient, is used to dimensionalize the local pressure drop. Figure 11 shows the flowchart of the PSO.
4. Results
4.1. Flow Characteristics in the Cavities
The distribution of the swirl ratio in the cavities at the design point of the cruising status is displayed in Figure 12. In FVR1, because the tangential flow at large radii is unrestricted, the swirl ratio increases quickly along the radial direction. When the airflow reaches the outer radius of the fins, the swirl ratio maximizes. However, the swirl ratio is suppressed to 1 throughout most of the region in FVR2. Due to rigid-body vortices, the swirl ratio in the fin channel approaches 1. Under ideal conditions, the pressure drop caused by the Coriolis force is 0 when the swirl ratio is 1. However, long fins have the potential to generate strong vibrations that could jeopardize the safe operation of aeroengines. In the NVR, the de-swirl jet formed by the de-swirl shroud orifices reduces the inlet swirl ratio to 0.52. Based on the conservation of angular momentum, the tangential flow in the cavity is significantly suppressed. Overall, the NVR has the lowest swirl ratio.
In terms of flow structure, the core region between the two Ekman layers is the main region generating the high pressure drop. Thus, delaying the development of the Ekman layers is conducive to decreasing the pressure drop (the Ekman layer and core region are symbiotic). Figure 13 shows the radial velocity at the design point of the cruising status. At a radius of 0.9b, a strong jet is present in the central region in the NVR and FVR1. Because of the rapid increase in tangential velocity at large radii in FVR1, the developed Ekman layers allow for a rapid rise in radial velocity near the wall. In the FVRs, the development of the Ekman layers is inhibited as the airflow enters the fin channel. Furthermore, the Ekman equation [8] indicates that when the swirl ratio is one, there is no Ekman layer in the cavity. The NVR, in contrast to the FVRs, has a high radial velocity in the central region due to the de-swirl jet. It can be seen in detail that the NVR does not have Ekman layers. Because of the direct effect of the axial outlet, the corresponding radial velocity increases at a radius of 0.6b.
Although vortex reducers are used to decrease the pressure drop, the flow temperature is equally critical to the SAS. Figure 14 depicts the pressure and temperature along the radial direction. In FVR1, the high swirl ratio and strong Coriolis force cause the pressure to drop quickly as the radius decreases. When the outer radius of the fins is increased to 195 mm (FVR2), the pressure drop in the cavity reduces by 45.84%. It is worth pointing out that the NVR with short fins still has the lowest pressure drop. According to Figure 12 and Equation (3), the de-swirl jet generated by the de-swirl shroud orifices reduces the pressure drop caused by the Coriolis force and centrifugal force, whereas the fins remove the effect of the Coriolis force. In particular, as the de-swirl jet reaches the cavity, its decreased dynamic pressure increases the static pressure.
When the entire cavity is treated as a control body, the temperature drop is proportional to the centrifugal force and the relative velocity at the inlet and outlet. When the operating conditions are the same, the three vortex reducers have the same relative velocity at the inlet and centripetal temperature drop. Furthermore, due to the direct effect of the fins, the three vortex reducers have similar relative velocities at the outlet. Therefore, the FVRs and NVR have similar outlet temperatures. In FVR1, because the relative tangential velocity decreases rapidly at the outer radius of the fins, the dynamic temperature is swiftly converted to a static temperature. However, the de-swirl jet causes a significantly smaller local temperature change in the NVR than in FVR1. In particular, the dissipation of the jet raises the local temperature.
4.2. Performance Evaluation of the NVR
The evaluation indicators for the performance of vortex reducers include air-entraining characteristics, drag reduction performance, and weight. From the perspective of aerodynamics, the air-entraining characteristics and drag reduction performance are the most significant elements of vortex reducers. For aeroengines as a whole, lightweight components are also advantageous.
Figure 15 shows the effect of the rotating Reynolds numbers and dimensionless flow rates on the pressure drop in the cavities. As the rotating Reynolds number increases, the enhanced centrifugal force increases the pressure drop. However, for high dimensionless flow rates and low rotating Reynolds numbers, the pressure drop in the NVR decreases as the rotating Reynolds number increases. According to Equations (3) and (7), a high dimensionless flow rate and a low rotating Reynolds number generate a strong de-swirl jet, resulting in an inlet swirl ratio of less than −1. Thus, increasing the rotating Reynolds number weakens the de-swirl jet, leading to a lower centripetal pressure drop. In particular, because the de-swirl jet inhibited the development of the Ekman layers, the growth rate of the pressure drop in the NVR is lower than in FVR1.
As the dimensionless flow rate increases, the pressure drops in the NVR and FVRs gradually increase. Due to the direct effect of the fins, the dimensionless flow rate has no significant impact on the swirl ratio of FVR2, but the local pressure drop at the shroud orifices increases. In FVR1, the shroud orifices and the outer radius of the fins have high local pressure drops. Furthermore, as the dimensionless flow rate increases, the source region at large radii gradually expands, increasing the swirl ratio and the centripetal pressure drop, which is also responsible for FVR1’s pressure drop growing faster than that of FVR2 and the NVR at low dimensionless flow rates. Although the NVR has a comparable pressure drop to FVR2, their mechanics are entirely different. Increasing the dimensionless flow rate improves the de-swirl jet in the NVR, which decreases the centripetal pressure drop at large radii. However, the local pressure drop at the shroud orifices and the outer radius of the fins increases the total pressure drop. Overall, the experimental pressure drop in the NVR is 28.52% lower on average than that of FVR1 with identical fins. It is worth mentioning that the pressure drop in the NVR is 4.31% less than that of the traditional vortex reducer (FVR2), which has the highest drag reduction performance.
Inaccurate control of the de-swirl jet easily generates a rapid increase in the pressure drop, posing a risk to the turbine blades and the rotor–stator seals. Thus, the design strategy proposed in this study must be verified. To unify the analysis of the pressure drop in the NVR under all operating conditions, the turbulence parameter and pressure coefficient, are used, as illustrated in Figure 16. The pressure coefficient increases monotonically with the turbulence parameter, indicating that the NVR has steady air-entraining characteristics. When the cavity has unsteady air-entraining characteristics, the pressure coefficient profile is “S”-shaped [6,16] (increases first, then decreases, and finally rises rapidly). During the initial stage of turbulence parameter growth, the expanded source region generates a higher swirl ratio, which increases the pressure coefficient. Although the de-swirl jet is constantly enhancing, the fins and local pressure drop let the pressure coefficient increase. In particular, negative vortices form at large radii when the turbulence parameters are well over 0.5. Thus, the de-swirl jet may boost the pressure drop [17]. Overall, the NVR can provide steady airflow for the SAS.
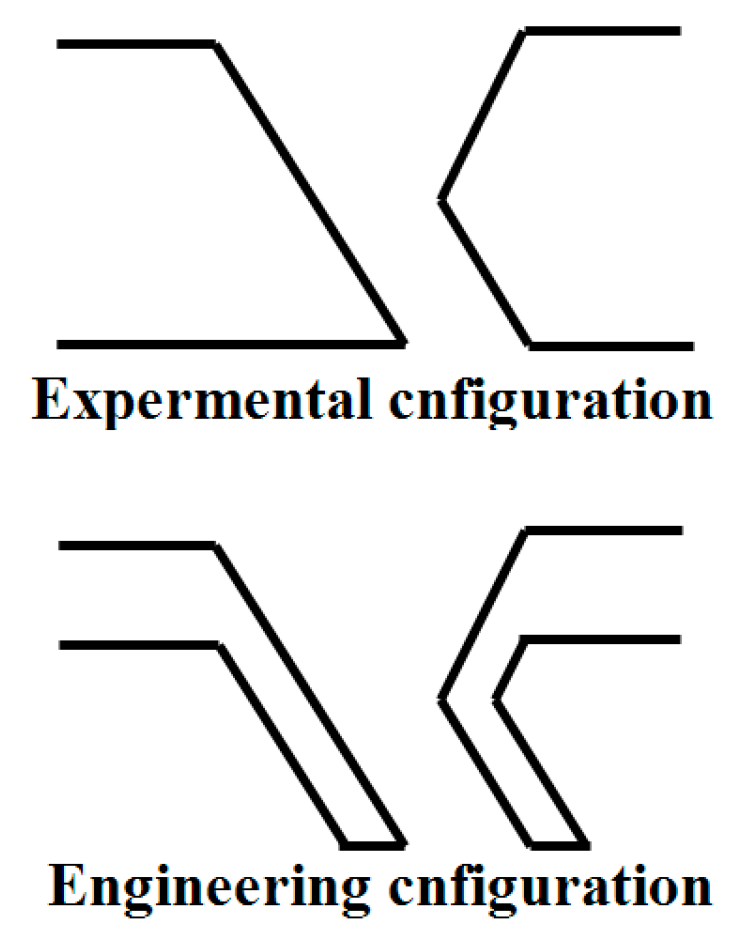
In this study, the NVR shroud is thickened to facilitate the processing of experimental articles. However, in engineering, just the de-swirl shroud orifices would be expanded to decrease the weight, as illustrated in Figure 17. Assuming a 2 mm wall thickness for the de-swirl shroud orifices, the NVR’s shroud weighs around 5.09% more than the FVRs’ shrouds. Furthermore, the fins of the NVR are 54.17% lighter than those of FVR2. Overall, the NVR weighs 25.82% less than FVR2.
In general, this study provides a potential solution for next-generation vortex reducers. Compared to traditional vortex reducers [22,23], an NVR generates better drag reduction performance while maintaining low weight. In particular, the developed design strategy ensures that the NVR does not suffer from a hysteresis phenomenon, which may occur in tubeless and hybrid vortex reducers [16,30].
4.3. Optimization of the NVR
4.3.1. Surrogate Model
Training a reasonable surrogate model is beneficial for shortening the design cycle. Tumse et al. [41,42] used neural networks to optimize wind energy recovery and a non-slender wing, and they pointed out that the developed model can reduce experimental costs. In this study, the training and testing data are displayed in Table 5. The orthogonal test table indicates that the setup with three factors and seven levels necessitates 49 sets of tests. Furthermore, 70% of the data used in developing the surrogate model are utilized for training and 30% for testing. The relative error between the predicted and target values is less than 2%, as shown in Figure 18. Generally, the surrogate model accurately predicts the local pressure coefficient.
4.3.2. Optimization Procedure
The PSO process is depicted in Figure 19. As the iteration develops, the fitness function flattens. When the straight length, l, leeward angle, α1, and expansion angle, α2, of the de-swirl shroud orifices are 7 mm, 65.7°, and 17.3°, respectively, the local pressure coefficient reaches a minimum of 0.616 within the design range. It can be seen in detail that the optimized straight length falls toward the lower boundary of the design range, indicating that its optimal value may be less than 7 mm. However, it should be noted that the straight length controls the velocity and the direction of the de-swirling jet, while significantly shortening the straight length may be detrimental to active control.
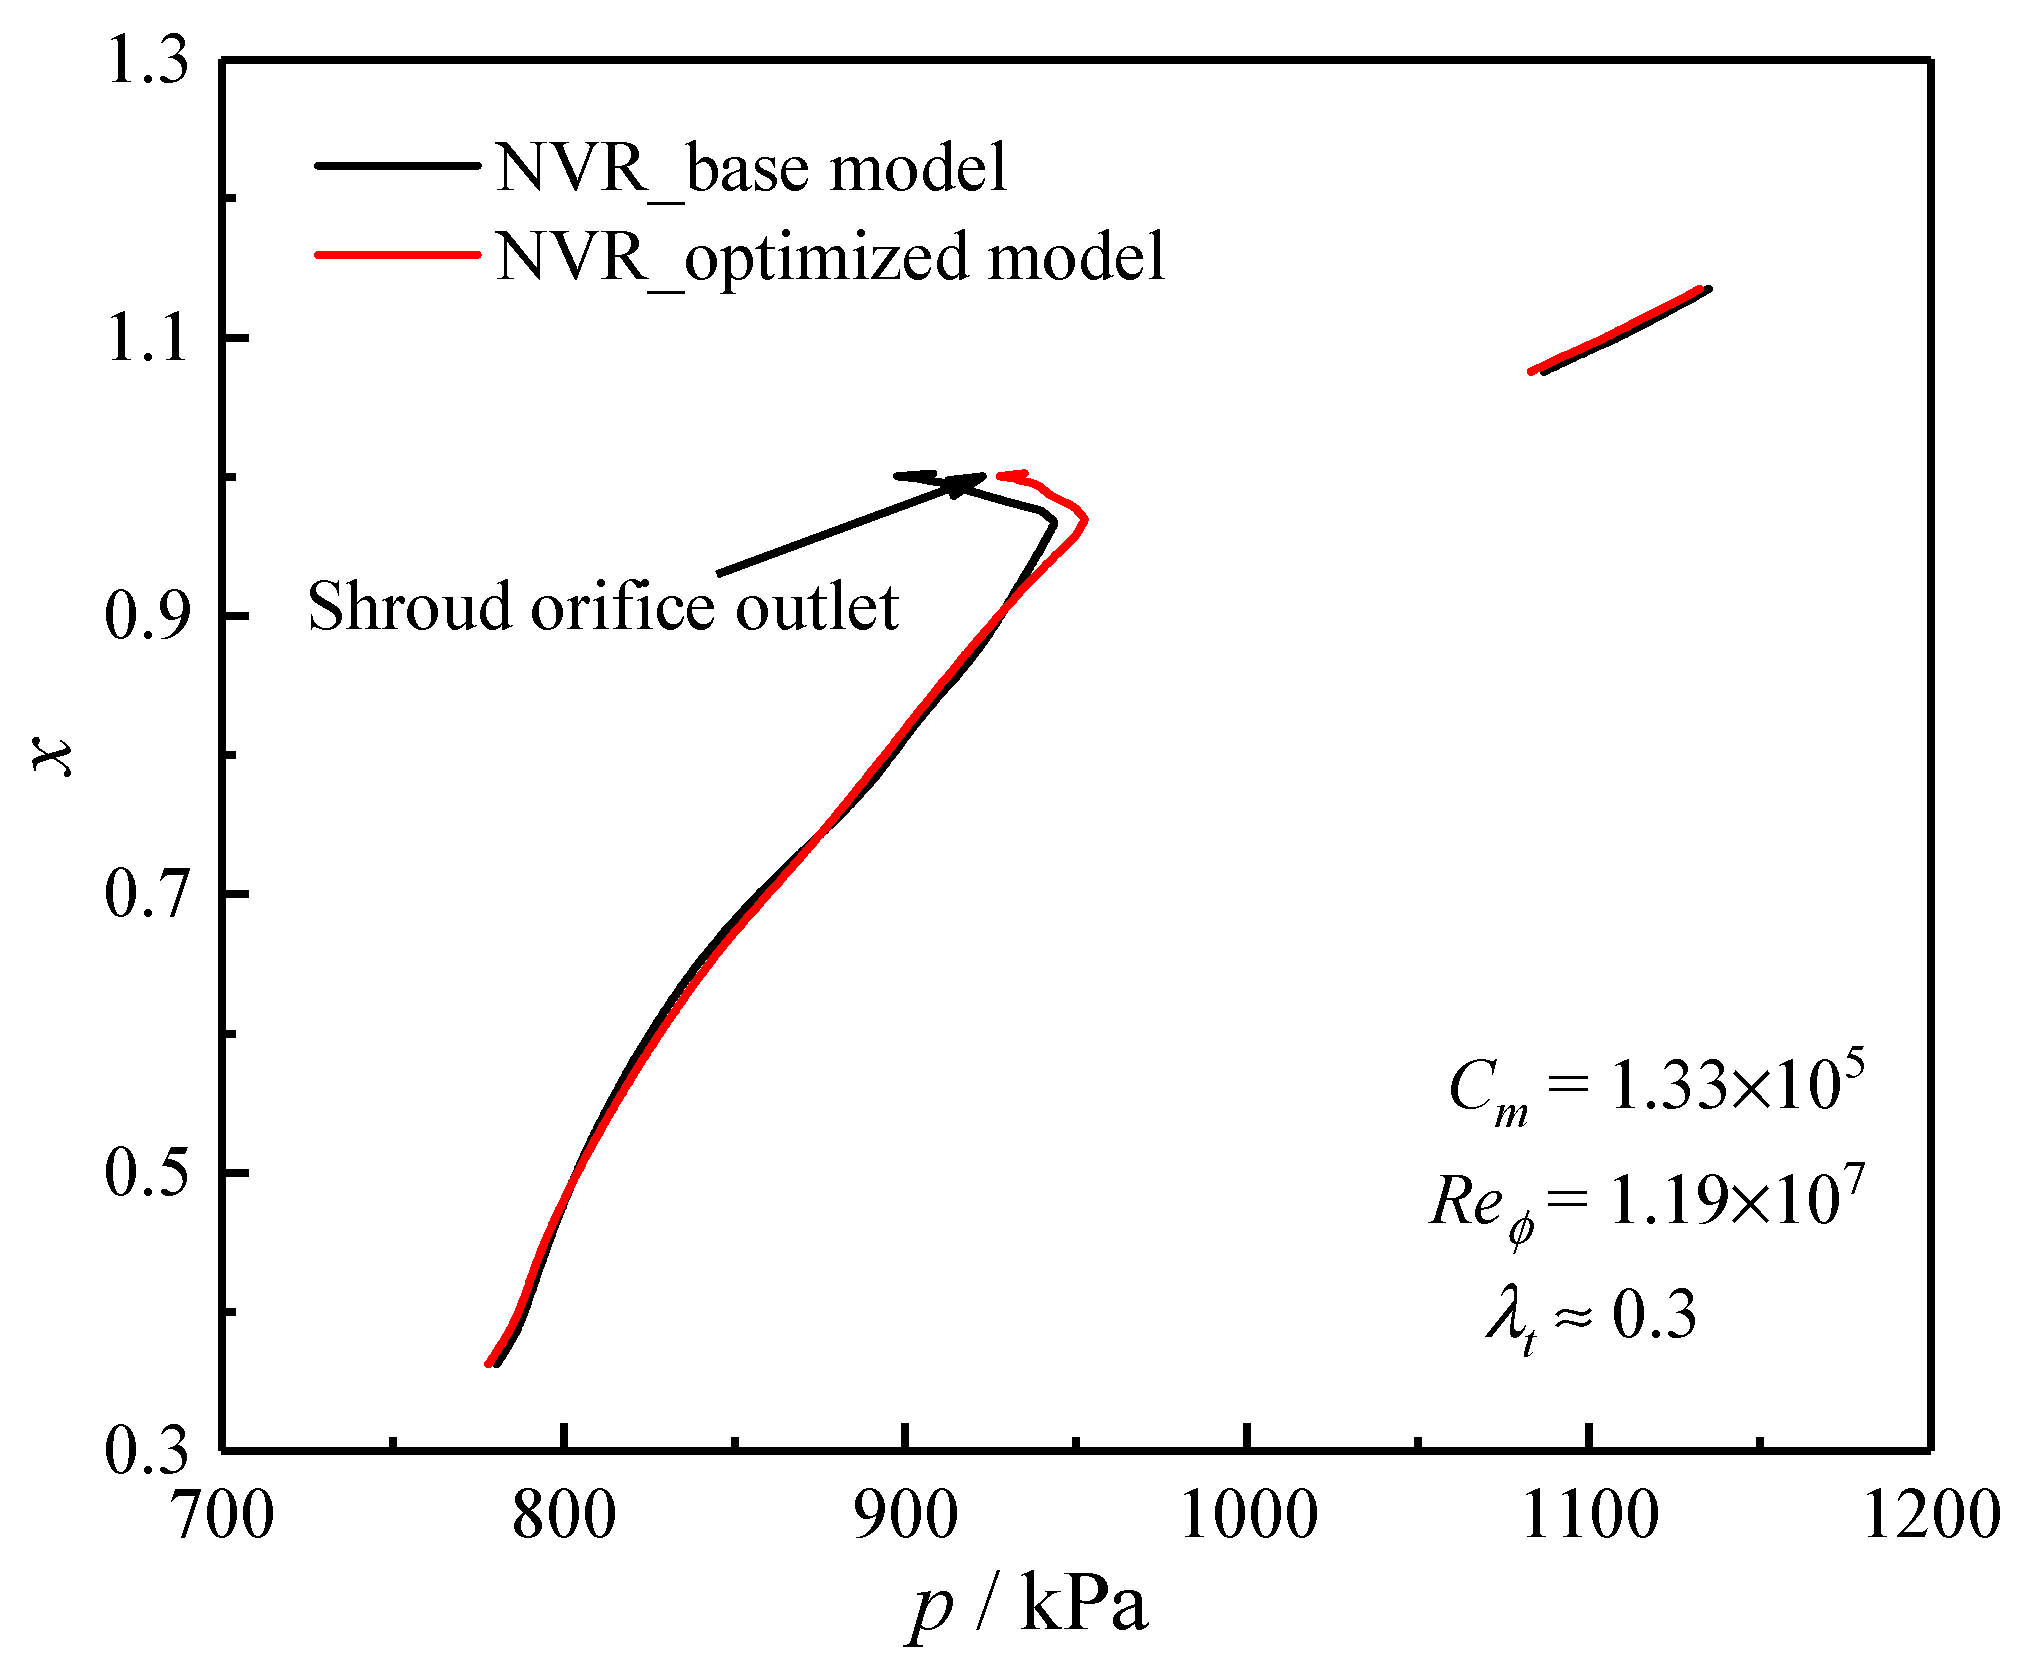
Figure 20 depicts a comparison of the pressures before and after optimization at the design point of the cruising status. Compared with the base model, the local pressure drop of the optimized model is reduced by 15.34%. However, the total pressure drop of the two models is nearly identical. Due to the high pressure, the optimized model has a weaker de-swirl jet than the base model, increasing the centripetal pressure drop. It is worth mentioning that the weak de-swirling jet can delay the decrease in the inlet swirl ratio at high turbulence parameters, thus improving the air-entraining characteristics of the NVR.
5. Conclusions
To decrease the pressure drop in a co-rotating cavity with radial inflow, an NVR made of de-swirl shroud orifices and fins is proposed. In particular, a design strategy that includes control mechanisms for the de-swirl jet and fins is developed to ensure that the NVR provides both steady airflow and outstanding drag reduction performance. By actively controlling the inlet swirl ratio at the design point of the cruising status, the pressure drop in the NVR is guaranteed to be monotonous in the operating range of aeroengines. Simultaneously, the outer radius of the fins is estimated using the conservation of angular momentum to maximize their role. Furthermore, the surrogate model and PSO are utilized to find the optimal geometrical parameters for the de-swirl shroud orifices within the design range. The key findings are as follows:
- Due to the effect of the de-swirl jet, the enhancement of vortices at large radii and the development of the Ekman layers are suppressed by the de-swirl shroud orifices. The low inlet swirl ratio slows down the development of the Ekman layers by reducing the increase rate of the swirl ratio at large radii. Furthermore, the fins limit the increase in tangential velocity at the low radius, resulting in strong centripetal airflow.
- The NVR generates a lower pressure drop than traditional vortex reducers. The de-swirl jet and rigid-body vortices suppress the generation of the centripetal pressure drop at large and small radii, respectively. At the same time, the decreased relative tangential velocity reduces the local pressure drop at the outer radius of the fins. Compared to the FVR with identical fins, the NVR reduces the pressure drop by 28.52%. In particular, the NVR is 25.82% lighter than the FVR, which has the best drag reduction performance.
- At turbulence parameters ranging from 0.1 to 0.5, the pressure drop in the NVR is monotonic. Considering the effect of the rotating speed and flow rate together, when the inlet swirl ratio at the design point of the cruising status is limited to 0.5, the inlet swirl ratio will not be less than −1 in the operating range of aeroengines. Therefore, the pressure drop grows monotonically as the turbulence parameter increases.
- The optimized NVR exhibits steadier air-entraining characteristics. The local pressure coefficient at the shroud orifices is employed as a fitness function, and the optimized local pressure drop is lowered by 15.34%. However, the decreased de-swirl velocity increases the centripetal pressure drop. Although the overall pressure drop does not change significantly before and after optimization, the weakened de-swirl jet improves the air-entraining characteristics.
It should be noted that fins with constant geometrical parameters do not enable the NVR to achieve optimal drag reduction performance under all operating conditions. Theoretically, the centripetal pressure drop in the cavity is 0 when the inlet swirl ratio is 0, and the vortex reducer does not require fins. Thus, future studies can focus on adjusting the inclined angle and throat area of the de-swirl shroud orifices in real time. Of course, the safety of adaptable structures at high rotating speeds must be taken seriously.
Author Contributions
Conceptualization, writing—original draft, methodology, software, validation, W.S.; writing—review and editing, supervision, S.W.; visualization, data curation, M.W., J.S. and Z.Z. All authors have read and agreed to the published version of the manuscript.
Funding
The authors gratefully acknowledge the financial support for this project from the National Science and Technology Major Project of China (No. 2017-III-0011-0037).
Data Availability Statement
Data are contained within the article.
Acknowledgments
The authors would like to express their gratitude to the NUAA Rotating Laboratory.
Conflicts of Interest
The authors declare no conflicts of interest.
Abbreviations and Nomenclature
| Nomenclature | |
| a | Inner radius of the cavity |
| b | Outer radius of the cavity |
| c | Inlet swirl ratio |
| Cm | Dimensionless flow rate, m/μb |
| Cp | Pressure coefficient, 2Δp/ρω2b2 |
| ls | Straight length of the de-swirl shroud orifices |
| m | Mass flow rate |
| r | Radius |
| Reϕ | Rotating Reynolds number, ρωb2/μ |
| p | Static pressure |
| S | Axial width of the cavity |
| Sr | Swirl ratio, Vϕ/ωb |
| T | Static temperature |
| Vϕ | Tangential velocity in the stationary frame |
| x | Dimensionless radius, r/b |
| X | Axial coordinates |
| Greek letters | |
| α1 | Leeward angle of the de-swirl shroud orifices |
| α2 | Expansion angle of the de-swirl shroud orifices |
| ρ | Density |
| ω | Rotating angular velocity |
| μ | Dynamic viscosity |
| θ | Inclined angle of the shroud orifices |
| λt | Turbulence parameter, Cm/Reϕ0.8 |
| Subscripts | |
| fi | Outer radius of the fins |
| fo | Inner radius of the fins |
| local | Shroud orifice region |
| ϕ | Tangential component |
| Abbreviations | |
| ANN | Artificial neural network |
| FVR | Finned vortex reducer |
| HVR | Hybrid vortex reducer |
| NVR | Novel vortex reducer |
| PSO | Particle swarm optimization |
| SAS | Secondary air system |
| TVR | Tubed vortex reducer |
References
- Zhang, G.; Ding, S. Safety analysis of flow parameters in a rotor-stator cavity. Chin. J. Aeronaut. 2012, 25, 831–838. [Google Scholar] [CrossRef]
- Gong, W.; Liu, G.; Wang, J.; Wang, F.; Lin, A.; Wang, Z. Aerodynamic and thermodynamic analysis of an aero-engine pre-swirl system based on structure design and performance improvement. Aerosp. Sci. Technol. 2022, 123, 107466. [Google Scholar] [CrossRef]
- Kong, X.; Huang, T.; Liu, Y.; Chen, H.; Lu, H. Effects of pre-swirl radius on cooling performance of a rotor-stator pre-swirl system in gas turbine engines. Case Stud. Therm. Eng. 2022, 37, 102250. [Google Scholar] [CrossRef]
- Günther, A.; Uffrecht, W.; Kaiser, E.; Odenbach, S.; Heller, L. Experimental analysis of varied vortex reducer configurations for the internal air system of jet engine gas turbines. In Proceedings of the ASME Turbo Expo 2008: Power for Land, Sea and Air, Berlin, Germany, 9–13 June 2008. [Google Scholar]
- Chew, J.W.; Farthing, P.R.; Owen, J.M.; Stratford, B. The use of fins to reduce the pressure drop in a rotating cavity with a radial inflow. J. Turbomach. 1989, 111, 349–356. [Google Scholar] [CrossRef]
- Farthing, P.R.; Chew, J.W.; Owen, J.M. The use of de-swirl nozzles to reduce the pressure drop in a rotating cavity with a radial inflow. J. Turbomach. 1989, 113, 106–114. [Google Scholar] [CrossRef]
- Hide, R. On source-sink flows in a rotating fluid. J. Fluid Mech. 1968, 32, 737–764. [Google Scholar] [CrossRef]
- Owen, J.M.; Pincombe, J.R.; Rogers, R.H. Source-sink flow inside a rotating cylindrical cavity. J. Fluid Mech. 1985, 155, 233–265. [Google Scholar] [CrossRef]
- Barcilon, V. Some inertial modifications of the linear viscous theory of steady rotating fluid flows. Phys. Fluids 1970, 13, 537–544. [Google Scholar] [CrossRef]
- Owen, J.M. An approximate solution for the flow between a rotating and a stationary disk. J. Turbomach. 1989, 111, 323–332. [Google Scholar] [CrossRef]
- Firouzian, M.; Owen, J.M.; Pincombe, J.R.; Rogers, R.H. Flow and heat transfer in a rotating cylindrical cavity with a radial inflow of fluid part 2: Velocity, pressure and heat transfer measurements. Int. J. Heat Fluid Flow 1986, 1, 21–27. [Google Scholar] [CrossRef]
- Firouzian, M.; Owen, J.M.; Pincombe, J.R.; Rogers, R.H. Flow and heat transfer in a rotating cylindrical cavity with a radial inflow of fluid part 1: The flow structure. Int. J. Heat Fluid Flow 1985, 6, 228–234. [Google Scholar] [CrossRef]
- Wang, C.; Wang, Z.; Zhang, J. Flow and heat transfer in a rotating cavity with de-swirl nozzles: An LES study. Int. Commun. Heat Mass Transf. 2020, 118, 104816. [Google Scholar] [CrossRef]
- Pfitzner, M.; Waschka, W. Development of an aeroengine secondary air system employing vortex reducers. In Proceedings of the International Congress of Aeronautical Sciences, ICAS, Harrogate, UK, 27 August–1 September 2000. [Google Scholar]
- Negulescu, D.; Pfitzner, M. Secondary air systems in aeroengines employing vortex reducers. In Proceedings of the ASME TURBO EXPO 2001: Turbomachinery Technical Conference and Exposition, New Orleans, LA, USA, 4–7 June 2001. [Google Scholar]
- Farthing, P.R.; Owen, J.M. De-swirled radial inflow in a rotating cavity. Int. J. Heat Fluid Flow 1991, 12, 63–70. [Google Scholar] [CrossRef]
- Shen, W.; Wang, S.; Zhang, X.; Liang, X. Large-eddy simulation and mathematical model of vortex breakdown and pressure drop in a cavity with tubeless vortex reducer. Eng. Appl. Comp. Fluid 2022, 16, 1344–1363. [Google Scholar] [CrossRef]
- Lee, J.; Lee, H.; Park, H.; Cho, G.; Kim, D.; Cho, J. Design optimization of a vane type pre-swirl nozzle. Eng. Appl. Comp. Fluid 2021, 15, 164–179. [Google Scholar] [CrossRef]
- Liu, Y.; Lu, B.; Kong, X.; Chen, H. Experimental study on the outlet flow field and cooling performance of vane-shaped pre-swirl nozzles in gas turbine engines. Case Stud. Therm. Eng. 2023, 44, 102878. [Google Scholar] [CrossRef]
- Gupta, S.; Paudel, A.; Thapa, M.; Mulani, S.B.; Walters, R.W. Optimal sampling-based neural networks for uncertainty quantification and stochastic optimization. Aerosp. Sci. Technol. 2023, 133, 108109. [Google Scholar] [CrossRef]
- Hines, D.; Bekemeyer, P. Graph neural networks for the prediction of aircraft surface pressure distributions. Aerosp. Sci. Technol. 2023, 137, 108268. [Google Scholar] [CrossRef]
- He, J.; Luo, X.; Bai, Y.; Song, A.; Yang, T. Experimental and numerical investigation on finned vortex reducer in a rotating cavity with a radial inflow. Aerospace 2023, 10, 655. [Google Scholar] [CrossRef]
- Liang, Z.; Luo, X.; Feng, Y.; Xu, G. Experimental investigation of pressure losses in a co-rotating cavity with radial inflow employing tubed vortex reducers with varied nozzles. Exp. Therm. Fluid Sci. 2015, 66, 304–315. [Google Scholar] [CrossRef]
- Luo, X.; Feng, A.; Quan, Y.; Zhou, Z.; Liao, N. Experimental analysis of varied vortex reducers in reducing the pressure drop in a rotating cavity with radial inflow. Exp. Therm. Fluid Sci. 2016, 77, 159–166. [Google Scholar] [CrossRef]
- Luo, Y.; Wang, Y.; Zhong, B.; Zhao, J.; Zhang, X. Fatigue life prediction of vortex reducer based on stress gradient. J. Mech. Design 2019, 141, 031701. [Google Scholar] [CrossRef]
- Ma, M.; Wei, D.; Wang, Y.; Li, D.; Zhang, H. Strength evaluation and failure analysis of the vortex reducer under overspeed condition. Aerospace 2021, 8, 394–409. [Google Scholar] [CrossRef]
- Du, X.; Zhu, H.; Zhang, Z. Numerical study on varied vortex reducer configurations for the flow path optimization in compressor cavities. In Proceedings of the ASME Turbo Expo 2011: Turbomachinery Technical Conference and Exposition, Vancouver, BC, Canada, 6–10 June 2011. [Google Scholar]
- Sibilli, T.; Cho, G.; Kholi, F.; Mucci, A. Numerical analysis of industrial gas turbine secondary air system employing vortex reducer. In Proceedings of the ASME Turbo Expo 2018: Turbomachinery Technical Conference and Exposition, Oslo, Norway, 11–15 June 2018. [Google Scholar]
- Mucci, A.; Kholi, F.K.; Sibilli, T.; Min, J.K.; Ha, M.Y.; Cho, G.H. Numerical analysis of secondary airflow in a rotating cavity of a gas-turbine at high operating points with vortex reducer implementation. Heat Mass Transf. 2021, 57, 1363–1378. [Google Scholar] [CrossRef]
- Wei, S.; Mao, J.; Yan, J.; Han, X.; Tu, Z.; Tian, R. Experimental study on a hybrid vortex reducer system in reducing the pressure drop in a rotating cavity with radial inflow. Exp. Therm. Fluid Sci. 2020, 110, 109942. [Google Scholar] [CrossRef]
- Kline, S.J. Describing uncertainties in single-sample experiments. Mech. Eng. 1963, 75, 3–8. [Google Scholar]
- Li, Y.; Zhang, H.; Yin, Z.; Wang, J.; Chen, H. Investigation of unsteady flow in the unscalloped radial turbine cavity. Aerosp. Sci. Technol. 2021, 113, 106675. [Google Scholar] [CrossRef]
- Jones, W.P.; Pascau, A. Calculation of confined swirling flows with a second moment closure. J. Fluids Eng. 1989, 111, 248–255. [Google Scholar] [CrossRef]
- Poncet, S.; Schiestel, R.; Chauve, M.P. Turbulence modelling and measurements in a rotor-stator system with throughflow. Eng. Turbul. Model. Exp. 2005, 185, 761–770. [Google Scholar]
- Vinod, K.B.; Chew, J.W.; Hills, N.J. Rotating flow and heat transfer in cylindrical cavities with radial inflow. In Proceedings of the ASME Turbo Expo 2012: Turbomachinery Technical Conference and Exposition, Copenhagen, Denmark, 11–15 June 2012. [Google Scholar]
- Wei, S.; Yan, J.; Mao, J.; Han, X.; Tu, Z. A mathematical model for predicting the pressure drop in a rotating cavity with a tubed vortex reducer. Eng. Appl. Comp. Fluid 2019, 13, 664–682. [Google Scholar] [CrossRef]
- Shen, W.J.; Wang, S.F.; Liang, X.D. Flow and heat transfer in a co-rotating cavity with tubes: A coupled prediction model. J. Appl. Fluid Mech. 2022, 15, 1403–1416. [Google Scholar]
- Huang, S.H.; Zhang, H. Artificial neural networks in manufacturing concepts applications and perspectives. IEEE Trans. Compon. Packag. Manuf. Technol. Part A 1994, 17, 212–228. [Google Scholar] [CrossRef]
- Mahmoodabadi, M.J.; Babak, N.R. Robust fuzzy linear quadratic regulator control optimized by multi-objective high exploration particle swarm optimization for a 4 degree-of-freedom quadrotor. Aerosp. Sci. Technol. 2020, 97, 105598. [Google Scholar] [CrossRef]
- Venter, G. Particle swarm optimization. AIAA J. 2003, 41, 1583–1589. [Google Scholar] [CrossRef]
- Tumse, S.; Bilgili, M.; Sahin, B. Estimation of aerodynamic coefficients of a non-slender delta wing under ground effect using artificial intelligence techniques. Neural Comput. Appl. 2022, 34, 10823–10844. [Google Scholar] [CrossRef]
- Tumse, S.; Ilhan, A.; Bilgili, M.; Sahin, B. Estimation of wind turbine output power using soft computing models. Energy Sources Part A Recovery Util. Environ. Eff. 2022, 44, 3757–3786. [Google Scholar] [CrossRef]
Figure 1.
A partial diagram of the SAS in an aeroengine.

Figure 2.
Test system configuration.

Figure 3.
Vortex reducer configurations: (a) FVR1 and (b) NVR.

Figure 4.
Computational models: (a) FVR1 and (b) NVR.

Figure 5.
Grid.

Figure 6.
Grid independence test: (a) pressure drop and (b) inlet swirl ratio.

Figure 7.
Pressure drop in the cavities.

Figure 8.
De-swirl shroud orifice.

Figure 9.
Flowchart for designing an NVR.

Figure 10.
Logic diagram of the ANN.

Figure 11.
Flowchart of the PSO.

Figure 12.
Distribution of the swirl ratio: (a) FVR1, (b) FVR2, and (c) NVR.

Figure 13.
Radial velocity along the axial direction: (a) r = 0.9b, (b) r = 0.8b, (c) r = 0.7b, and (d) r = 0.6b.
Figure 13.
Radial velocity along the axial direction: (a) r = 0.9b, (b) r = 0.8b, (c) r = 0.7b, and (d) r = 0.6b.

Figure 14.
Pressure and temperature along the radial direction: (a) pressure and (b) temperature.

Figure 15.
Effect of rotating Reynolds number and dimensionless flow rate on the pressure drop: (a) experimental pressure drop in FVR1, (b) experimental pressure drop in the NVR, (c) numerical pressure drop in the NVR, FVR1, and FVR2 under different rotating Reynolds numbers, and (d) numerical pressure drop in the NVR, FVR1, and FVR2 under different dimensionless flow rates.

Figure 16.
Effect of the turbulence parameter on the pressure coefficient in the NVR.

Figure 17.
Schematic diagram of experimental and engineering configurations of de-swirl shroud orifices.
Figure 17.
Schematic diagram of experimental and engineering configurations of de-swirl shroud orifices.

Figure 18.
Training and validation of the surrogate model: (a) training process and (b) predicted value vs. target value.
Figure 18.
Training and validation of the surrogate model: (a) training process and (b) predicted value vs. target value.

Figure 19.
Variation in the fitness function of PSO with iteration.

Figure 20.
Comparison of pressures before and after optimization.


Table 1.
Geometrical parameters.
| Parameter | Value | Unit |
|---|---|---|
| b | 185, 195 | mm |
| a | 67 | mm |
| rfi | 130 | mm |
| rfo | 75 | mm |
| S | 50 | mm |
| rs | 3.3 | mm |
| ls | 6.6 | mm |
| θ | 45 | ° |
| α1 | 60 | ° |
| α2 | 0 | ° |
| l | 7 | mm |
| d1 | 5 | mm |
| d2 | 12 | mm |
Table 2.
Experimental range.
| Parameter | Value | Unit |
|---|---|---|
| Rotating speed | 600, 900, 1200, 1500, 1800, 2100, 2400, 2700, 3000, 3300, 3600 | rev/min |
| Mass flow rate | 0.047, 0.07, 0.078, 0.099, 0.109 | kg/s |
Table 3.
Boundary conditions of the computational models.
| Parameter | Value | Unit |
|---|---|---|
| Inlet total pressure | 1538 | kPa |
| Inlet static temperature | 686 | K |
| Rotating speed | 4000, 6000, 8000, 10,000, 12,000, 14,000, 16,000 | rev/min |
| Mass flow rate | 0.15, 0.3, 0.45, 0.6, 0.75, 0.855, 1.005, 1.305, 1.5 | kg/s |
Table 4.
Design ranges of the geometrical parameters.
| Parameter | Value | Unit |
|---|---|---|
| l | 7~13 | mm |
| α1 | 50~80 | ° |
| α2 | 9~27 | ° |
Table 5.
Training and testing data.
| No. | l | α1 | α2 | Cp.local | No. | l | α1 | α2 | Cp.local |
|---|---|---|---|---|---|---|---|---|---|
| 1 | 7 | 50 | 9 | 0.666784 | 26 | 10 | 70 | 24 | 0.689993 |
| 2 | 7 | 55 | 24 | 0.647256 | 27 | 10 | 75 | 9 | 0.685423 |
| 3 | 7 | 60 | 18 | 0.64032 | 28 | 10 | 80 | 15 | 0.679867 |
| 4 | 7 | 65 | 12 | 0.67132 | 29 | 11 | 50 | 18 | 0.676843 |
| 5 | 7 | 70 | 27 | 0.639498 | 30 | 11 | 55 | 24 | 0.691834 |
| 6 | 7 | 75 | 21 | 0.619938 | 31 | 11 | 60 | 9 | 0.664121 |
| 7 | 7 | 80 | 15 | 0.641471 | 32 | 11 | 65 | 15 | 0.67464 |
| 8 | 8 | 50 | 27 | 0.667967 | 33 | 11 | 70 | 21 | 0.681215 |
| 9 | 8 | 55 | 12 | 0.665764 | 34 | 11 | 75 | 27 | 0.652976 |
| 10 | 8 | 60 | 18 | 0.703076 | 35 | 11 | 80 | 12 | 0.67063 |
| 11 | 8 | 65 | 24 | 0.648473 | 36 | 12 | 50 | 15 | 0.669183 |
| 12 | 8 | 70 | 9 | 0.66754 | 37 | 12 | 55 | 21 | 0.675068 |
| 13 | 8 | 75 | 15 | 0.664154 | 38 | 12 | 60 | 27 | 0.668888 |
| 14 | 8 | 80 | 21 | 0.671452 | 39 | 12 | 65 | 12 | 0.682464 |
| 15 | 9 | 50 | 24 | 0.668625 | 40 | 12 | 70 | 18 | 0.661655 |
| 16 | 9 | 55 | 9 | 0.656034 | 41 | 12 | 75 | 24 | 0.674608 |
| 17 | 9 | 60 | 15 | 0.644659 | 42 | 12 | 80 | 9 | 0.712577 |
| 18 | 9 | 65 | 21 | 0.675397 | 43 | 13 | 50 | 12 | 0.68493 |
| 19 | 9 | 70 | 27 | 0.645514 | 44 | 13 | 55 | 18 | 0.67875 |
| 20 | 9 | 75 | 12 | 0.709783 | 45 | 13 | 60 | 24 | 0.696995 |
| 21 | 9 | 80 | 18 | 0.665469 | 46 | 13 | 65 | 9 | 0.679933 |
| 22 | 10 | 50 | 21 | 0.716522 | 47 | 13 | 70 | 15 | 0.703142 |
| 23 | 10 | 55 | 27 | 0.703339 | 48 | 13 | 75 | 21 | 0.658171 |
| 24 | 10 | 60 | 12 | 0.68447 | 49 | 13 | 80 | 27 | 0.661261 |
| 25 | 10 | 65 | 18 | 0.644002 |
Disclaimer/Publisher’s Note: The statements, opinions and data contained in all publications are solely those of the individual author(s) and contributor(s) and not of MDPI and/or the editor(s). MDPI and/or the editor(s) disclaim responsibility for any injury to people or property resulting from any ideas, methods, instructions or products referred to in the content. |
© 2024 by the authors. Licensee MDPI, Basel, Switzerland. This article is an open access article distributed under the terms and conditions of the Creative Commons Attribution (CC BY) license (https://creativecommons.org/licenses/by/4.0/).
Share and Cite
MDPI and ACS Style
Shen, W.; Wang, S.; Wang, M.; Suo, J.; Zhang, Z. Experimental and Numerical Investigation of a Novel Vortex Reducer in a Co-Rotating Cavity of Aeroengines. Aerospace 2024, 11, 225. https://doi.org/10.3390/aerospace11030225
AMA Style
Shen W, Wang S, Wang M, Suo J, Zhang Z. Experimental and Numerical Investigation of a Novel Vortex Reducer in a Co-Rotating Cavity of Aeroengines. Aerospace. 2024; 11(3):225. https://doi.org/10.3390/aerospace11030225
Chicago/Turabian StyleShen, Wenjie, Suofang Wang, Mengyuan Wang, Jia Suo, and Zhao Zhang. 2024. "Experimental and Numerical Investigation of a Novel Vortex Reducer in a Co-Rotating Cavity of Aeroengines" Aerospace 11, no. 3: 225. https://doi.org/10.3390/aerospace11030225
Note that from the first issue of 2016, this journal uses article numbers instead of page numbers. See further details here.