
Approach and Landing Energy Prediction Based on a Long Short-Term Memory Model
1
Chinese Flight Test Establishment, Xi’an 710089, China
2
School of Aeronautics, Northwestern Polytechnical University, Xi’an 710072, China
*
Author to whom correspondence should be addressed.
†
These authors contributed equally to this work.
Aerospace 2024, 11(3), 226; https://doi.org/10.3390/aerospace11030226
Submission received: 12 November 2023
/
Revised: 3 March 2024
/
Accepted: 7 March 2024
/
Published: 14 March 2024
Abstract
:The statistical analysis of civil aircraft accidents reveals that the highest incidence of mishaps occurs during the approach and landing stages. Predominantly, these accidents are marked by abnormal energy states, leading to critical situations like stalling and heavy landings. Therefore, it is of great significance to accurately predict the aircraft energy state in the approach and landing stages to ensure a safe landing. In this study, a deep learning method based on time sequence data for the prediction of the aircraft approach and landing energy states is proposed. Firstly, by conducting an extensive overview of the existing literature, three characteristic parameters of altitude, velocity, and glide angle were selected as the indicators to characterize the energy state. Following this, a semi-physical simulation platform for a certain type of aircraft was developed. The approach and landing experiments were carried out with different throttle sizes and flap deflection under different wind speeds and wind directions. Then, a deep learning prediction model based on Long Short-Term Memory (LSTM) was established based on the experimental data to predict the energy state indicators during the approach and landing phases. Finally, the established LSTM model underwent rigorous training and testing under different strategies, and a comparative analysis was carried out. The results demonstrated that the proposed LSTM model exhibited high accuracy and a strong generalization ability in predicting energy states during the approach and landing phases. These results offer a theoretical basis for designing energy early warning systems and formulating the relevant flight control laws in the approach and landing stages.
1. Introduction
Recent data on civil aviation accidents highlight that the approach and landing stages, characterized by a gradual decrease in energy, are the most accident-prone stages, as shown in Figure 1 [1,2]. One of the key causes of an approach–landing accident is that of the improper management of the aircraft’s energy; an abnormal energy approach and landing are the main causes of further accidents such as stalling, heavy landing, off-runway accidents, and so on [3,4].
Most modern fly-by-wire aircraft exhibit neutral speed stability, thereby making it challenging for pilots to directly discern the speed change using the joystick. This difficulty often leads to a transition into an abnormal energy state, as noted in [5]. Dehais et al. collected the eye movement-tracking data of 12 flight crew members and flight parameters of a transport aircraft simulator during the approach stage. The findings revealed that two-thirds of the crew members exhibited critical trajectory deviation errors, indicating the occurrences of energy anomalies that had gone undetected [6]. Therefore, in the approach and landing stages, although most modern civil aircraft are equipped with angle-of-attack envelope protection, there remains a risk of pilots inadequately perceiving the aircraft’s energy state, potentially leading to accidents.
Addressing the challenge of low energy during the approach and landing phases, the Federal Aviation Administration (FAA) emphasizes the necessity of flight control systems to incorporate low-energy alarm functions and specify the corresponding performance requirements. This ensures that pilots can promptly recognize and recover from low energy states [7]. Recognizing the significance of abnormal energy states in aircraft operations, the implementation of an abnormal energy alarm function becomes imperative. This function is rooted in a profound understanding of energy status, serving as a foundational element for its effective development. The crucial aspect of energy state perception lies in selecting the appropriate energy metrics that accurately represent the aircraft’s condition during the approach stage and enable the identification and prediction of abnormal energy states.
In the domain of energy metric research, the Flight Safety Foundation of the United States established a precedent in 2000 by promoting stable approach maneuvers for large civil aircraft. They advocated for the utilization of speed, glide angle deviation, and the descent rate as the safety monitoring parameters to determine an aircraft’s energy state through meticulous monitoring and the prediction of these metrics [8]. Furthermore, Puranik et al. conducted extensive research on various energy state metrics, encompassing kinetic energy, potential energy, total energy, and their rates of change, thereby leveraging comprehensive flight data. Their findings revealed that relying solely on a single metric is insufficient for accurately characterizing an aircraft’s performance under abnormal energy conditions, necessitating the use of multiple metrics [9]. Chen et al. also delved into the safety implications of low energy states during the approach and landing phases. They introduced methodologies for assessing low kinetic energy based on aircraft velocity and low potential energy based on the glide angle deviation, aligning with prestigious standards such as CCAR-25-R4, AC25-7C, and other airworthiness criteria for transport aircraft [10]. They ultimately proposed remedial measures for distinct types of low energy states. Shish et al. employed high-precision simulation models for real-time predictions, providing pilots with critical awareness and alarms regarding the aircraft’s energy state through speed and altitude parameters [11]. Wang et al. recreated low-energy scenarios through a simulation using Quick Access Recorder (QAR) data from actual aircraft operations. In their study, they designated velocity deviation and glide angle deviation as the indicators of abnormal energy [12]. Lu et al. developed a sophisticated numerical simulation platform for civil aircraft and investigated the consequences of deviations in energy state parameters on approach and landing risks using advanced random simulation techniques. They identified velocity and glide angle as the pivotal metrics for describing abnormal energy states during an aircraft’s approach and landing phases [13].
The key parameters for identifying abnormal energy states during the approach and landing phases have consistently been identified as velocity, glide angle, altitude, and descent rate.
Focusing on the recognition and prediction of aircraft energy states, Shish et al. from NASA Ames Research Center have described the implementation and evaluation of innovative technologies. These technologies are designed to anticipate and assess the future energy state of aircraft and provide timely alerts to pilots, enabling them to better understand the implications of potential energy-related issues [14]. In their study, the researchers began by modeling the behavior of critical flight systems including flight management, autopilot, auto-throttle, and flight control systems. They then took the current state of the aircraft, encompassing parameters such as speed, altitude, and rudder declination, as the starting point for their analysis. Through the rigorous simulation of this model, they were able to predict the flight trajectory, which represents the aircraft’s future path assuming the current conditions remain unchanged. A crucial aspect of their methodology involved comparing the predicted trajectory with the flight envelope, which is a predefined set of limits within which the aircraft must operate safely. If the predicted state of the aircraft exceeded these limits within a specified timeframe, the system triggered an alert. This two-step process, encompassing state prediction based on the simulation model and exceedance detection through comparison, forms the core of their approach. However, it is worth noting that the reliability of this method heavily relies on the accuracy of the simulation model. Building precise simulation models for a diverse range of aircraft proved to be a demanding and complex task.
Given the intricacies and hurdles associated with simulation-based methodologies for pinpointing and anticipating abnormal energy states, data mining and deep learning techniques have surfaced as promising alternatives. In the realm of data mining, anomaly detection pertains to the identification of patterns within data that diverge from predefined norms or expectations [15,16]. Safety analysts in aviation are particularly invested in two distinct types of in-flight anomalies as follows: instantaneous and flight-level anomalies. While instantaneous anomalies are marked by aberrant occurrences within a narrow segment of the flight record [17], flight-level anomalies are characterized by persistent abnormal data patterns spanning entire flights or the designated flight phases [15,18]. Gavrilovski et al. have conducted a thorough examination of data mining and anomaly detection technologies in the context of flight data analysis. Presently, the aviation industry’s application of data mining techniques predominantly focuses on detecting flight-level anomalies, with a comparatively limited emphasis on instantaneous anomaly detection [17,19]. Aircraft-level anomaly detection typically entails retrospective analysis, leaning on time-series data encompassing the entire approach and landing phases to ascertain whether the energy state within this pivotal phase was abnormal. When it comes to instantaneous anomaly recognition, Orca has employed a scalable K-nearest neighbor method to detect anomalies across datasets encompassing both continuous and discrete features [20]. However, a notable limitation of this approach is that of its treatment of each data point as an isolated time sample, thereby posing challenges in detecting anomalies exhibiting temporal patterns or signatures. Other researchers such as Amidan and Ferryman have harnessed singular value decomposition to pinpoint instantaneous anomalies [21], while Mugtussidis has utilized Bayesian classification to distinguish between typical and atypical data points observed during flights [22]. Melnyk et al. have specifically tailored a vector autoregressive exogenous model for anomaly detection within in-flight data [23]. Furthermore, Lishuai Li et al. have introduced a data mining technique that leverages Gaussian Mixture Model (GMM) clustering on flight data to unveil latent risks [24]. This method has excelled in establishing operational norms and pinpointing abnormalities, emerging as a valuable tool for airlines to identify early safety degradation signs without relying on predefined criteria. Luis Basora et al. have delved into cutting-edge, data-driven techniques, particularly those of unsupervised methods for time-series data in aviation where labeled data scarcity prevails, thereby assessing their computational efficiency and detection effectiveness [25]. These advancements underscore the evolving landscape of anomaly detection in aviation where data mining and deep learning techniques are paving the way for enhanced safety and operational efficiency. Furthermore, Puranik et al. have proposed a framework for aircraft-level abnormal energy state detection based on energy metrics [9,26,27,28]. This framework has been further enhanced by integrating sliding window preprocessing technology and cluster analysis techniques based on the Gaussian Mixture Model for transient anomaly detection during the approach phase [17]. This method falls under the unsupervised learning category, and its accuracy is highly dependent on the detection threshold set by the analyst.
In aviation, two types of anomalies are commonly recognized as follows: instantaneous and flight-level anomalies. While aircraft-level anomaly detection aids in retrospectively recognizing and predicting energy states, it provides limited value for early warning systems during the critical approach stage. Existing techniques for instantaneous anomaly detection primarily focus on identifying current abnormalities without considering future energy states, which is essential for proactive measures. However, recent advancements in natural language processing and machine translation have given rise to recurrent networks, particularly Long Short-Term Memory (LSTM) models, which show promise in system state prediction [29,30,31]. For instance, studies like that of James Engelmann et al. have explored the use of LSTM in predicting various aircraft states, including near-stall, overspeed, and instability states [32,33]. Motivated by this, the present study proposes an LSTM-based method to predict the energy state of aircraft during the approach and landing stages. This approach involves analyzing changes in flight parameters that represent the energy state of the aircraft and developing a prediction model based on LSTM theory.
To develop this model, the study first identified the relevant flight parameters through a comprehensive literature review. These parameters were then collected through semi-physical simulation tests using an aircraft flight simulator, which were guided by the flight manual. The simulator replicated real flight conditions under varying throttle settings, wind speeds, and wind directions. Finally, an LSTM model was established and trained using the collected flight parameters to predict energy states during the approach and landing stages. This model can facilitate the perception, control, and correction of abnormal energy states, thereby enhancing flight safety.
The remaining sections of this paper are organized as follows: Section 2 delves into the theoretical underpinnings of low energy state prediction. This includes the selection of the appropriate energy indicators, the determination of safety thresholds for these indicators, and the foundational theories behind the LSTM model. Section 3 constructs a semi-physical platform for simulating aircraft approach and landing scenarios. Additionally, an LSTM model tailored for predicting energy states during these critical phases is established. Section 4 introduces various training strategies and provides a comparative analysis of the prediction results obtained under different training approaches. Finally, Section 5 concludes the paper with a synthesis of our findings and contributions to the field.
2. Theoretical Basis for the Prediction of the Low Energy State of Approach
2.1. Basis of Aircraft System Reliability Modeling
The central focus of this section is that of identifying the key indicators used to characterize the energy state of an aircraft during its approach and landing stages, which is the premise of the prediction of the aircraft’s instantaneous, abnormal energy state.
Energy includes both kinetic energy and potential energy, with the energy state describing the available kinetic and potential energy at any given time. The abnormal energy state of the aircraft mainly refers to the low energy state, which occurs when the aircraft exhibits too low kinetic energy, too low potential energy, or a combination of both of these [34,35].
Low kinetic energy is mainly manifested as low flight speed during approach and landing, which poses two significant safety risks as follows: (1) when the airspeed is between the normal state and stalling speed state, the control efficiency of each control surface of the aircraft continues to decline with the decrease in airspeed, thereby making it difficult for pilots to have control during approach and landing and making them prone to losing control, which induces flight accidents; (2) when the airspeed falls to stalling speed, the aircraft may enter into a stall, which directly endangers flight safety [9,10].
The impact of low potential energy on flight safety becomes particularly critical towards the end of the approach and landing stages. In these phases, when the aircraft either approaches or enters the critical speed of the reverse control zone, the risk of stalling increases, especially with a large pull joystick. Therefore, when the aircraft altitude is too low relative to the reference glide path, it is difficult for the pilot to quickly recover the altitude and ground the aircraft in the normal landing zone, which may lead to flight accidents such as collisions [9,10].
At present, there have been several research results on the indicators for representing the aircraft energy state in the approach and landing stages, as summarized in Table 1. Drawing from these research results, three key flight parameters including velocity, altitude, and glide angle are selected to characterize an aircraft’s energy state. In this study, velocity means the indicated airspeed of the aircraft and altitude means the radio altitude.
There is a general agreement in existing research findings that the parameters used to assess abnormal energy during the approach and landing phases are relatively consistent as follows: velocity, glide angle, altitude, and descent rate. Given that the descent rate can be derived from the velocity and glide angle, this paper opts to utilize velocity, glide angle, and altitude as the primary parameters for monitoring the energy state of the aircraft during the critical approach and landing stages.
In addition, similarly to reference [14], this paper intends to adopt the exceedance detection method for abnormal energy state detection, which is also the most common method for aircraft abnormal state detection at present. An exceedance is the deviation of a single parameter beyond an established threshold, and an event is the deviation of a single parameter or multiple parameters beyond the established thresholds. That is to say that in addition to the metrics defined earlier, defining the limits of aircraft operation is also important. Various methods of defining the aircraft’s operational envelope and the determination of the extent to which the current aircraft state is safe or allowable need to be identified. Energy metrics can potentially be used to measure this offset from the safe limits. It is important to distinguish what limit is more critical for the cause of accidents or incidents. The primary distinction between this paper and reference [14] lies in the methodology employed for predicting the future energy state of aircraft. While reference [14] relies on the establishment of a high-precision simulation model, which is both labor-intensive and technically challenging to construct, the approach proposed in this paper leverages deep learning to build an LSTM model for predicting the energy state during the aircraft’s approach and landing phases. This LSTM model simplifies the process by only requiring the manual design of the model structure, while all model parameters are determined through deep learning algorithms, thereby reducing the burden of manual modeling.
According to the research results of references [8,10,12], the warning boundary of abnormal energy can be summarized as follows:
In the criteria above, 1 dot ≈ 0.35°; γ0 = 3°; V is the velocity that indicates the indicated airspeed; Vref refers to the Reference Landing Speed, with its general value being 1.3 Vso and with Vso being the stall speed in the aircraft landing configuration. Energy states exceeding the range above are considered to be abnormal energy states in the approach and landing phases.
The given criteria outline specific ranges for velocity, glide path deviation, and descent rate that define the normal and abnormal energy states during the approach and landing phases of an aircraft. These criteria are explained as follows:
- Indicated airspeed: The indicated airspeed should fall within the range of Vref − 5 kt to Vref + 20 kt. The velocity outside this range might indicate abnormal kinetic energy, making the aircraft difficult to control during the approach and landing phases.
- Descent rate: A descent rate exceeding 1000 ft/min implies that the aircraft is descending too rapidly. Without proper longitudinal control, this could lead to accidents such as heavy landings, runway overruns, or a loss of control. The descent rate can be calculated using the speed index and glide path index.
Furthermore, altitude plays a crucial role in evacuation operations and flight strategies. During the approach and landing stages, various altitudes, such as the minimum stable altitude, landing entry point altitude, landing return altitude, and levelling altitude, have a specific significance. For instance, if the aircraft has not established a stable approach state by the time it reaches the minimum stable altitude, it might need to turn around. Therefore, although altitude is not directly contained in the three main criteria, it remains an important predictor due to its significance in going out of the abnormal energy states during the approach and landing phases.
2.2. Overview of LSTM
LSTM mainly mitigates the problem of gradient disappearance and gradient explosion of traditional RNNs in long-sequence training [40]. The basic unit consists of a memory unit and three gate controllers. The internal structure is shown in Figure 2. Memory cells in LSTM have the function of selective memory, memorizing only important information, filtering noise information, and reducing memory burden, which is very suitable for processing time series data.
According to Figure 2, the hidden node state at time t − 1 is denoted as ht−1 and the memory cell at time t − 1 is denoted as ct−1. The values of ht−1, ct−1 and the current input xt are processed by the basic unit in LSTM, resulting in the output of a new state ht and a new memory cell ct. The calculation formula is shown in Equations (1)–(6). The ft, it, and ot represent the forget gate, input gate, and output gate, respectively, and their value is between 0 and 1. The symbols σ and Tanh are the activation functions, and σ means the Sigmoid function. The symbol means the multiplication of the corresponding elements in the model, W is the weight matrix of the gates, and b is the bias of the gates.
The training of the LSTM model refers to estimating the weight matrix W and the bias b. The main steps are as follows:
- (1)
- Forward propagation: Input the flight parameters collected in the aircraft simulator into the LSTM model. The parameters are transmitted forward through the LSTM network by calculating the value of gate , and . The method of computing these values is shown in Equations (1)–(6). The calculation in this step is from inputs to hidden layers and inner gates and then finally to outputs, so it is called the forward propagation.
- (2)
- Loss function calculation: Calculate the loss function, as shown in Equation (7). The symbol M is the number of approach and landing experiments. The symbol Nj means the sample number in the jth experiment. The symbol means the output value of the velocity/altitude/glide angle at the time i, which is calculated through the forward propagation.
- (3)
- Backpropagation: Backpropagation means calculating the correction values of weight and bias given the function loss. It is a process from the outputs to the hidden layers and inner gates of LSTM, so it is called the backpropagation. Specifically, according to the calculated loss function and the gradient value in the current iteration, calculate the gradient value in the next iteration of the loss function for each parameter, as shown in Equation (8). In the equation, means the weight correction value of layer i and layer j in the LSTM model. The symbol means the bias correction value of bj, and means the learning rate.
The backpropagation can effectively update the weight and bias of the model from the loss function, making the loss function of the whole network minimized.
- (4)
- Parameter updating: the Adam gradient descent method is used to update the gradient values of each parameter of the LSTM model. Repeat the above steps until either the set number of training iterations or the convergence condition is reached.
3. Aircraft Approach and Landing Simulation and Prediction Model
3.1. Semi-Physical Simulation Experiment Based on a Flight Simulator
In this paper, we use simulation data collected from a semi-physical simulator we built to train and test the energy prediction model. The primary reasons for utilizing simulated data are its ease of acquisition and processing, cost-effectiveness, and the ability to safely test a wide range of low-energy anomaly scenarios in a controlled environment. In the aerospace domain, simulated data provides us with an invaluable tool to explore new flight concepts and algorithms without exposing ourselves to actual flight risks. In contrast, acquiring data using real aircraft not only incurs significant costs but also poses immeasurable safety risks, especially during the testing of anomaly scenarios. The semi-physical simulator is explained below.
In this study, the experimental platform adopts a human–computer interaction to simulate the flight approach and landing, which addresses the limitations of the traditional pure digital simulation methods, which often struggle to account for the pilot’s impact on flight quality. The method a of human–computer interaction makes the experimental results more realistic. The experimental scheme is as follows: (1) following the flight manual, multiple groups of flight experiments are set according to the throttle size, flap deflection, wind speed, wind direction, and turbulence; (2) initialize the aircraft’s approach and landing state, and then perform the simulation control in the aircraft approach and landing stages through a human–computer interaction such as pulling/pressing the joystick and sliding the throttle of the platform; (3) record aircraft flight parameters at all times in the simulator.
The human–computer interaction platform is shown in Figure 3. The right panel is used to display the aircraft state; then, input some control variables and set the environmental parameters including inputting the flap declination angle and setting the starting position of the approach, wind speed, wind direction, turbulence conditions, etc. To simulate the process of approaching and landing, the operator can handle the aircraft engine and control surface through hardware such as the throttle slider and joystick, as shown in the left part of Figure 3. Parameters in the simulation process are divided into three categories as follows: aircraft flight parameter, operation/control parameters during the flight, and scenario parameters. All the parameters, which are integral to the simulation’s accuracy and relevance, are meticulously recorded and analyzed, as shown in Figure 4. Figure 4 illustrates the operation and control parameters, which encompass the throttle size, rudder deflection angle, elevator deflection angle, aileron deflection angle, flap reflection angle (with three possible values as follows: 0°, 10°, and 15°), and landing gear setting (up/down). Pilots can adjust the throttle size by sliding the throttle slider and altering the deflection of the rudder, aileron, and elevator through joystick control. In essence, these operation and control parameters represent the commands issued by pilots. The aircraft flight parameters primarily comprise the static pressure, dynamic pressure, yaw angle, pitch angle, roll angle, attack angle, sideslip angle, indicated airspeed, and true airspeed. These parameters are the outputs generated by the flight dynamics and kinematics equations when pilots’ control commands are inputted into these equations. The equations can be found in reference [41]. The scenario parameters encompass turbulence, wind direction and speed, and initial aircraft position, as well as the coordinates for a five-side flight and the Instrument Landing System (ILS) station (latitude, longitude). Diverse approaches and landing scenarios, such as an aircraft approaching in a random turbulence condition, can be created by adjusting these parameter values in the semi-physical simulation platform depicted in Figure 3.
According to the flight manual and Figure 5, the correct procedure for operating the aircraft simulator during a five-sided approach is outlined as follows: First, the approach scene and the throttle are initialized, and the flap and the landing gear are opened. After a 10 s stabilization period, the aircraft approach is operated with a joystick to maintain a glide angle of about 3°. Before descending to an altitude of 15 m, the aircraft enters the runway entrance at an airspeed that is not less than 1.23 VSR (VSR refers to the reference stalling speed). After descending to 15 m, the speed of the aircraft should be reduced by reducing the throttle. When the aircraft slides down to about 5 m above the ground, a flare control should be performed by pulling the joystick. When the aircraft reaches above the ground, attention should be paid to gradually increasing the pitch attitude and angle of attack so that the nose can be raised to the correct landing attitude, with a gentle landing that is close to the actual situation finally being carried out. Figure 5 shows the change in the angle of attack.
To obtain the approach and landing samples under a real flight environment, the simulation experiment was divided into three groups as follows: wind-free, wind, and turbulent flow. According to Table 2, the wind speed can be set to 2 m/s, 4 m/s, 6 m/s, 8 m/s, and 10 m/s, respectively; the wind direction is set to downwind (0°), upwind (180°), and crosswind (90°). The throttle is set to 50%, 60%, 70%, and 80%. Flaps are set to 10° and 35°. In this type of flight simulator, each 0.01 s of the simulation time is a sampling point. Some parameters recorded in the simulation process are shown in Figure 6. The data collected in this experiment was used for the training and testing of the subsequent LSTM prediction model.
As evident from Figure 6, the initial altitude of the aircraft is approximately 500 m above the landing surface rather than at ground level. This is due to various practical considerations. Firstly, simulating an entire takeoff and landing flight sequence is highly time-consuming. Since this study requires ample data samples to train the predictive model, conducting multiple complete simulation tests would be both time- and labor-intensive. Secondly, given the standardized procedures for civil aircraft approach and landing, this paper take-off focuses on the final stages of the instrument approach and landing. As per relevant specifications and manuals [42,43], approach and landing simulation tests can commence at an initial altitude of approximately 500 m. During the approach simulation test, pilots need to establish the initial conditions based on the semi-physical simulation platform by setting parameters such as altitude, velocity, wind conditions, and geographical coordinates. It should be noted that flight dynamic and kinematic equations are highly complex. The equilibrium state of the aircraft in this initial scenario—which includes factors like the angle of attack and pitch angle—is not readily known and cannot be manually calculated. Standard flight manuals typically do not provide such detailed data. Consequently, the initial approach and landing scenarios configured by the pilot are in a non-equilibrium state at the start of the simulation. Once the simulation scenario is configured, the pilot’s primary task is to stabilize the aircraft using the control commands before proceeding with the approach and landing simulation test. The initial state imbalance is also reflected in the significant fluctuations observed in parameters like the angle of attack and pitch angle during the first 10 s of the simulation as the pilot attempts to stabilize the aircraft. Although the subplot in row 1 and column 3 indicates a stable approach and safe landing in the simulation test, some parameters exhibit instability at the end stage of the approach and landing phases (evident in the three subplots of row 2). This instability can be attributed to variations in piloting skills. While the pilot may have achieved a safe landing, passenger comfort might have been compromised. In essence, Figure 7 highlights how this simulation test takes into account the impact of human factors on the quality of approach and landing. By incorporating these variables, the trained intelligent prediction model generalizes the influence of pilot proficiency, thereby ensuring consistent a predictive performance for the approach and landing phases even when operated by different pilots.
3.2. The Prediction Model Based on LSTM
Figure 7 illustrates the structure of the LSTM models established in this study to predict the speed, altitude, and glide angle of aircraft during the approach and landing phases. Each colored circle represents a node within an LSTM layer. The number of layers and nodes per layer have been carefully adjusted through rigorous training experiments. These models take flight parameter values, denoted as x(t), at specific time intervals to predict the corresponding altitude, velocity, or glide angle, represented as y(t), at a future time. x(t) and y(t) are referred to as feature quantities and label quantities, respectively, in the LSTM context. The step time Δτ for the model can be flexibly set, and the predicted time step, represented by k, can also be varied as needed. This approach allows for accurate predictions based on a wide range of flight parameters and time intervals.
In the model structure depicted in Figure 7, each colored circle represents a node within an LSTM layer. In the model design, both the number of LSTM layers and the number of nodes in each layer are carefully adjusted through training experiments. In this paper, the final model architecture trained consists of one LSTM layer with 20 nodes. As Figure 8 shows, before training and testing the designed LSTM model, the samples should be preprocessed and normalized. Preprocessing includes data cleaning, filling, smoothing and other routine processing. In addition, to address dimensional disparities in the data, expedite model convergence, enhance prediction precision, and bolster the model’s generalization capabilities, and this study undertook the normalization procedures for both the feature quantities (serving as inputs into the model) and label quantities (representing the model’s outputs) before their introduction into the LSTM architecture. All datasets specifically underwent scaling to confine their values within the [0, 1] range. Consequently, post-training and testing, the label data outputted by the LSTM model necessitated a de-normalization step to revert it to its original scale. It should be noted that data preprocessing, normalization, and subsequent de-normalization constitute standard procedures within the broader data processing workflow and hence will not be delved into in detail herein. Moreover, the Adam gradient descent method is adopted here to train LSTM. Adam can adjust the learning rate adaptively, which can prevent overfitting to some extent and make the convergence effect better. The gate unit of LSTM typically uses the Sigmoid activation function and the Tanh activation function to control the inflow and outflow of information. The gate unit in LSTM can effectively process sequential data by knowing what information needs to be forgotten and what information needs to be retained. For example, in LSTM, the Sigmoid activation function is typically used to control the input gate and forget gate. The Tanh activation function is typically used to control the output gates. The Relu activation function is a nonlinear function, which can directly set the output value of negative numbers to zero, alleviating the problem of gradient disappearance in LSTM. Other details about the hyperparameters of LSTM are provided in the left panel of Figure 8. To be specific, the selection of these specific hyperparameters is preceded by a comprehensive series of experiments and evaluations. Initially, a set of hyperparameters is initialized based on prior knowledge and experience. Subsequently, these hyperparameters are fine-tuned by closely monitoring the model’s performance on the validation set. This iterative process involves the model being repeatedly retrained and validated after each adjustment until a relatively optimal set of hyperparameters that yielded superior performance is found.
4. Experiments of LSTM on the Flight Data
4.1. Strategies for Training and Testing LSTM
A total of 80 approach and landing experiments were conducted in this study, including three types of conditions as follows: wind-free, wind, and turbulent flow. The time series data of the flight parameters in each flight experiment were recorded in one file. The sampling frequency of each flight was 100 Hz, and 80 recorded files were formed in the flight simulator. The process from the initial approach state to the aircraft touching the ground is about 150 s, which is to say that the data in each recorded file through an approach and landing flight experiment include about 15,000 lines. The most basic condition in the approach and landing stages is wind-free. Therefore, taking the wind-free condition as the typical case and according to the principle that the generalization ability of the prediction model is from moderate to strong, six strategies for the training and testing of the designed LSTM are proposed.
- (1)
- Randomly select a single wind-free file without perturbing the time sequence of data in the file; divide the data in the file into 8:2 as a training set and test set, respectively.
- (2)
- Randomly select a single wind-free file; randomly mix up the time sequence of data in the file; divide the data in the file into 8:2 as a training set and test set, respectively.
- (3)
- Randomly select a single wind-free file; sparse the data in the file as follows: 1 in every 10 raw data is kept as a sample; randomly disorder the time sequence of these samples; divide the samples into 8:2 as a training set and test set, respectively.
- (4)
- Select all the wind-free files; sparse the data in each file as follows: 1 in every 100 raw data is kept as a sample; randomly shuffle the time sequence of all the samples in the files; divide the samples into 8:2 as a training set and test set, respectively.
- (5)
- Randomly select eight files including the wind and wind-free conditions for training and select one wind file and one wind-free file for testing; sparse the data in each file as follows: 1 in every 100 raw data is kept as a sample; randomly disarrange the time sequence of the samples in the training set, and do not disarrange the time sequence of samples in the test set.
- (6)
- Randomly select 56 files including the wind, wind-free, and turbulent conditions for training, and select 14 files including the wind, wind-free, and turbulent conditions for testing; sparse the data in each file as follows: one in every 100 raw data is kept as a sample; randomly disorder the time sequence of the samples in the training set, and do not disorder the time sequence of samples in the test set.
For the six strategies, there are two points to explain.
- (1)
- In the simulator used for this study, energy state indicators are recorded at specific time intervals as follows: t = 0.01, 0.02, 0.03, and so on. Given the parameters k = 2 and n = 5, the samples extracted from each approach and landing flight experiment for LSTM training and testing are structured as follows:Sample 1: X1 = {x(t = Δt), x(t = 2Δt), x(t = 3Δt), x(t = 4Δt), x(t = 5Δt), y(t = 7Δt)}Sample 2: X2 = {x(t = 2Δt), x(t = 3Δt), x(t = 4Δt), x(t = 5Δt), x(t = 6Δt), y(t = 8Δt)}
…and so on. Assuming Nj represents the number of raw data lines recorded in the jth flight experiment and that the raw data is dense (i.e., Δt = 0.01), the recorded file contains the Nj – k – n + 1 samples.
When feeding these samples (X1, X2, …) into the LSTM model, two approaches are considered.
Sequential feeding: if the samples are fed into LSTM in the order they appear (X1, X2, …), this is referred to as “not disordering the time sequence”.
Random feeding: If the samples are fed into LSTM in a random order, this is called “disordering the time sequence”. See Figure 9 for an illustration.
Now, different strategies with varied parameters are considered.
Strategies 1 and 2
Parameters: n = 20, k = 1, Δt = 0.01
Sample structure:
Sample 1: X1 = {x(t = Δt), x(t = 2Δt) … x(t = 20Δt), y(t = 21Δt)}
Sample 2: X2 = {x(t = 2Δt), x(t = 3Δt) … x(t = 21Δt), y(t = 22Δt)}
…and so on.
Number of samples: Nj – k – n + 1
Strategy 3
Parameters: n = 20, k = 1, Δt = 0.1
Sample structure is the same as in Strategies 1 and 2.
Number of samples: – k – n + 1
Strategies 4 to 6
Parameters: n = 20, k = 3, Δt = 1
Sample structure:
Sample 1: X1 = {x(t = Δt), x(t = 2Δt) … x(t = 20Δt), y(t = 23Δt)}
Sample 2: X2 = {x(t = 2Δt), x(t = 3Δt) … x(t = 21Δt), y(t = 24Δt)}
…and so on.
Number of samples: – k – n + 1
- (2)
- Given the value of the altitude/velocity/glide angle at time t −nΔt, t − nΔt + Δt…t − Δt, the LSTM designed in this study can predict the energy state in the approach and landing stages by computing the value of the altitude/velocity/glide angle at time t + (k − 1)Δt. The units of altitude, velocity, and the glide angle are m, km/h, and °, respectively. The value of n, k, and Δt under different strategies is provided in Table 3. Under the premise of satisfying the prediction accuracy, the generalization ability of the prediction model gradually increases with the increase in the values of k and Δt.
4.2. Result Analysis
This study evaluates the performance of LSTM according to the indices R-square (R2), Mean Absolute Error (MAE) and Mean Bias Error (MBE). R2 represents the coefficient of determination, and its value ranges from 0 to 1. The closer it is to 1, the more accurate the model is. The MAE represents the error level of the model; the lower the MAE is, the more accurate the LTMS is. The MBE represents the deviation direction of the model. The positive value of the MBE means that the LSTM model overestimates the true value; the negative value means that the model underestimates the true value; and the value is close to 0, which means that the model deviation is average. The three indices calculated are as those in Equations (9)–(11).
The symbol yi is the true value, represents the predicted value, is the average of the true value, and m is the number of samples.
Due to the limitation of space, this paper only presents the training and testing results of the LSTM used to predict the indicator of velocity under six strategies (see Figure 10, Figure 11 and Figure 12 and Table 3).
In these figures, the horizontal coordinate indicates the serial number of the samples. The vertical axis represents the values of the flight parameters that are to be predicted. Due to the high amount of sample data contained in each figure, displaying the true values and predicted results of all the sample points would result in a visually cluttered and unreadable image, especially in the case of the training and testing results under the strategy of disordering the time sequence. This lack of clarity would hinder the readers’ ability to assess the alignment between model training outcomes and sample’s true values. Therefore, after the model is trained and tested with the samples, sparse processing was applied to the sample points in the figures for clarity in the presentation of training and testing results. For instance, in Figure 10a, which corresponds to the training strategy of non-disordering the time sequence, “1 Hz” indicates that the predicted results and true values of all the sample points are displayed in the figure. Specifically, the true values and predictions of 14,000 sample points in Figure 10a and 3500 sample points in Figure 10b are shown. On the other hand, in Figure 10c, which represents the training strategy of disordering the time sequence, “100 Hz” means that one sample point out of every 100 is retained for display in the figure. Thus, among the 14,000 sample points in Figure 10c and 3500 sample points in Figure 10d, only 140 and 175 true values and predictions are, respectively, shown. The parameters in Figure 11 have the same meaning as those described in Figure 10.
The training and testing results of the LSTM used to predict the indicators of the altitude and glide angle under the sixth strategy is given (see Figure 12c–f and Table 4). In addition, the training time for each model was approximately 5 h in the experiments. This duration was measured on a specific hardware configuration (ADM Ryzen 5, 3600 6-Core Processor, 3.6 GHz) without any parallelization techniques. We did not employ distributed training or other hardware acceleration methods in this study. The training time may vary depending on the computing resources available. We have now included this information in the revised version of the paper for clarity and transparency. Finally, regarding the time required for each prediction, we have found that it averages at approximately 0.08 s. This rapid prediction time is a significant advantage of our models, allowing for quick analysis and decision making in real-time scenarios. According to these training and testing results, three points can be demonstrated.
- (1)
- To prevent an “overfitting phenomenon”, the time sequence data used for model training must be disordered.
It can be seen from Figure 10 that the designed LSTM model has a good degree of fitting in the training set and a poor degree of fitting in the test set. This is a phenomenon of overfitting. To further prove the phenomenon, Strategy 1 is also applied to train and test the other wind-free files, respectively, and all the results are similar to those in Figure 10. Theoretically speaking, the phenomenon can be corrected by adjusting the network structure, dropout, regularization, and early stopping. However, after adopting these methods to mitigate the overfitting phenomenon, the degree of fitting in the test set is still poor. In addition, it can be seen from Figure 10b that the prediction effect deteriorates as the simulation time progresses in the approach and landing experiment. That is, the prediction effect is better in the early stage of approach and landing and worse in the final stage of approach and landing.
The study suggests that the reason for the “overfitting phenomenon” is that pilots operate the aircraft differently at different stages of approach and landing. In the initial and middle stages, to ensure that the aircraft can approach at a stable glide angle, the main task of the pilot is to fly with the joystick (due to external factors and visual errors, they need to constantly pull and press the joystick at a low amplitude), and there is little need for throttle operation during the initial stage. However, after the altitude is reduced to about 15 m, the pilots need to reduce the throttle and mainly perform the operation of pulling the joystick. Different operations lead to differences in flight parameter characteristics. If the time sequence is not disordered, the samples in the training set include little flight parameters in the final stage of the approaching and landing experiment. In other words, the trained LSTM model can only capture the flight parameter characteristics in the early stage of the approach and landing process, and it cannot capture the flight parameter characteristics in the final stage. Therefore, the prediction effect in the test set is poor, showing the “overfitting phenomenon”.
According to the reason suggested in this study, one effective measure to solve the “overfitting phenomenon” is to disorder the time sequence of the samples in the training set, and the LSTM model theoretically has a good prediction ability no matter whether the time sequence of the samples in the test set is disordered or not. The underlying theory for solving the “overfitting phenomenon” is demonstrated in Figure 10, Figure 11 and Figure 12.
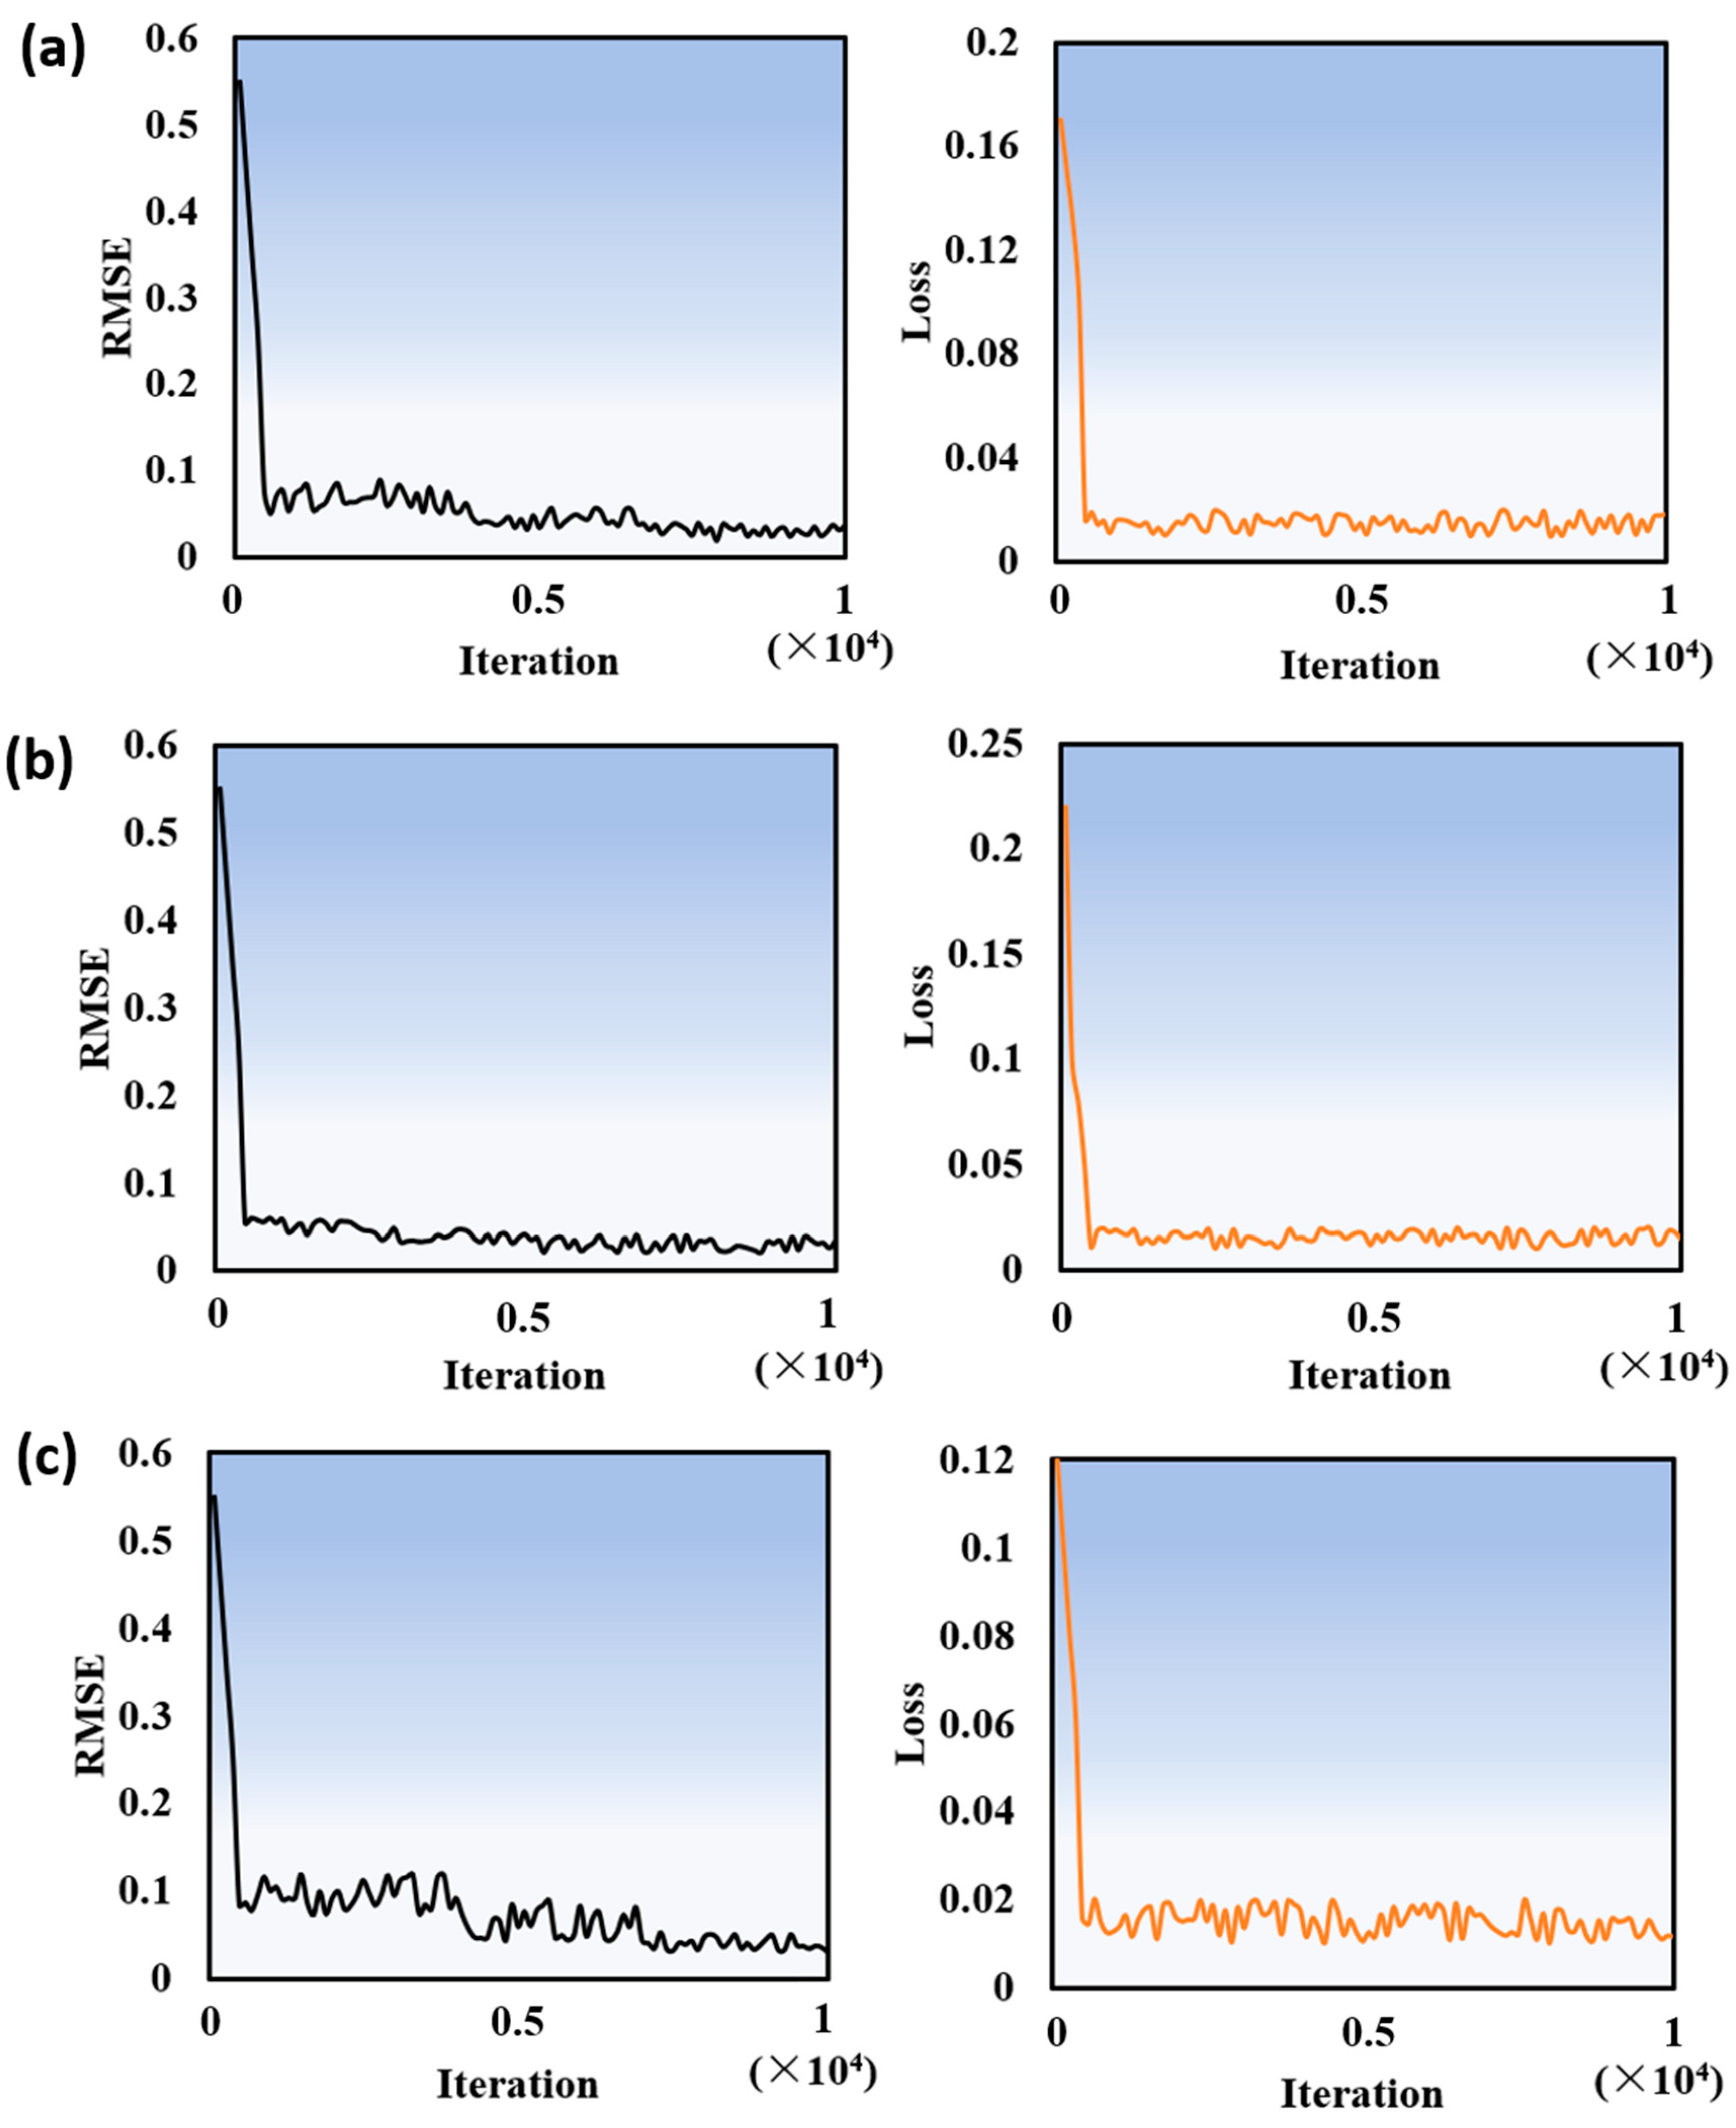
In addition, Figure 13 provides the error variation (root-mean-square error and loss) curves during the model training process under Strategy 6. It can be seen from the curves that in the early stages of training, the validation error decreases as the training error decreases. However, after a certain number of rounds, the error stabilizes around a certain value and fluctuates.
The reason for this fluctuation mainly lies in the fact that our experimental samples include flight data under turbulence. Due to the randomness of turbulence, the flight parameters also exhibit corresponding fluctuations. Therefore, during the training process, even if the error decreases to a certain stable value, fluctuations still occur. In addition, from the curves of the training set sample error and the test set sample error shown in Figure 11 and Figure 12, it can be seen that the prediction results of the model in this paper are highly consistent with those of the samples regardless of the test set or the training set and that the error is minimal, so there is no overfitting phenomenon in the strategy of disordering the time sequence.
- (2)
- LSTM has high accuracy and a good generalization ability in energy state indicator prediction.
The indices R2, MAE, and MBE in Table 3 and Table 4 show that the LSTMs trained under Strategy 2–Strategy 6 all have higher accuracy. In addition, with the increase in k and n, the values of the LSTM quality indices R2, MAE, and MBE are still relatively high on the whole. This indicates that LSTM has a strong generalization ability and that LSTM can both predict the energy state indicators under the conditions of wind-free and also predict the energy state indicators under the influence of different wind conditions and turbulence.
Among these strategies, the prediction ability of LSTM under Strategies 5 and 6 is expressed as follows: LSTM under Strategy 5 can predict the aircraft’s velocity in the future 3 s under the condition of no turbulence and LSTM under Strategy 6 can predict the aircraft’s velocity in the future 3 s under different wind conditions and turbulent conditions. Therefore, LSTM can be used for an early warning of an abnormal energy state in the approach and landing stages, which is conducive to the design of the pilot’s control law and automatic correction system.
Finally, the randomness of the turbulence has always been a difficult problem for pilots when making a stable approach and landing. LSTM under Strategy 6 has a good prediction ability, which is of high significance for guiding pilots when approaching and landing in a turbulent flow. However, for some extreme values with high randomness, the prediction accuracy needs to be further improved.
- (3)
- Although the prediction accuracy is different for the three energy state indicators, its potential application value is not affected.
First, considering the influence of different wind speeds, wind directions, and turbulence, the prediction accuracy for altitude is the highest and the glide angle is the lowest. The reason for this is that the LSTM built in this study essentially solves the regression problem. For the regression problem, there is a rule that the higher the continuity of the sample data and the more consistent the change trend the better the effect. In the approach and landing phases, the altitude change trend is the most consistent one with this rule, except for a slight rebound in altitude during a very small period at the end of landing whereby the altitude slowly decreases overall.
Second, for the two aircraft parameters of the glide angle and velocity, in the early and middle stages of a stable approach and landing, although their values vary (increasing and decreasing) from time to time under the influence of wind speed, direction, and turbulence, the variation amplitude is not too high under the operation of the pilots, so the prediction effect of LSTM is good. However, on the one hand, the prediction results of the model in this paper are highly consistent with those of the samples in the later stage, which inevitably lead to a high change in velocity in a short time, thereby reducing the prediction accuracy of the velocity. On the other hand, in the approach stage, there is an aiming point, with the main task of the pilots being that of operating the aircraft to fly to the aiming point in a nearly straight line. In the stage from approach to landing, the pilots should pull the joystick to avoid the aircraft directly hitting the aiming point. The operation directly changes the flight path, which is manifested as a drastic increase in the glide angle, as shown in the peaks in Figure 12e,f. Therefore, the prediction accuracy of the glide angle is worst in these peak moments, while the prediction accuracy is satisfactory in other moments.
Finally, it should be noted that the highest significance of predicting the glide angle in engineering is that of providing a warning of a future approach trend that is possibly unstable in advance so that this kind of abnormal energy state can be corrected in advance to avoid accidents. In the final stage of approach and landing, the throttle is reduced, and the joystick is pulled slowly to turn the aircraft into a level flight, and the aiming point is no longer meaningful. Because the concept of the glide angle is a concept based on the aiming point being a reference point, the glide angle becomes of little significance to the pilot in the final stage. Therefore, although the accuracy of LSTM in predicting the glide angle is not high enough in the final stage of approach and landing, it still does not affect its guiding significance in predicting an abnormal energy state in advance.
Compared with the Vector Autoregression (VAR) method, the LSTM method has higher accuracy in predicting the energy indicators of aircraft during the approach and landing stages.
To deeply explore and highlight the significant advantages of Long Short-Term Memory (LSTM) networks in the field of aircraft approach and landing prediction, this paper not only constructs an LSTM model but also establishes a Vector Autoregression (VAR) model as a reference comparison. Such a comparative setup aims to specifically reveal the improvement of the LSTM method in prediction accuracy compared with the VAR method through empirical analysis.
The VAR method, which is a classic time series prediction model, has been widely used in multiple fields. However, when facing complex and dynamic systems like aircraft approach and landing, the VAR method may struggle to capture long-term dependencies and nonlinear characteristics in data due to its linear assumptions and fixed-lag structure. This highly limits the performance of the VAR method in terms of prediction accuracy, especially when dealing with high-dimensional, nonlinear, and non-stationary data.
In contrast, the LSTM method, with its unique memory mechanism and gated structure, exhibits significant advantages when processing such complex time series data. LSTM can adaptively learn and remember long-term dependencies in the data while effectively handling nonlinear characteristics. This makes LSTM capable of providing more accurate and reliable prediction results in complex scenarios like aircraft approach and landing prediction.
To specifically validate the superiority of the LSTM method, this paper conducts a detailed empirical analysis. By comparing the prediction results of the VAR method and the LSTM method using the same dataset (see Table 3 and Table 4 for details), it is clear that the LSTM method demonstrates higher accuracy in predicting energy indicators. This result fully proves the effectiveness and superiority of the LSTM method in the field of aircraft approach and landing prediction, providing strong support for subsequent related research and practical applications.
5. Conclusions and Future Work
The approach and landing stages are recognized as the stages with the highest rate of accidents in civil aviation. Abnormal energy states are an important cause of these accidents. Therefore, accurately predicting the energy state indicators during these stages is of high significance in guiding pilots to execute safe and precise landings.
- (1)
- Through an extensive review of the existing literature, three key flight parameters have been extracted as indicators to characterize the energy state during the approach and landing phases as follows: velocity, altitude, and glide angle.
- (2)
- A semi-physical simulation platform integrating a human–computer interaction for a specific aircraft model has been developed, which overcomes the disadvantage that the traditional pure digital simulation method has in making it difficult to consider the impact of pilots on flight quality. Moreover, the platform can conduct approach and landing simulation experiments under three environmental conditions as follows: calm, windy, and turbulent flow, which are close to the real flight environment. Comprehensive and sufficient flight parameters can be obtained in a short time to train deep learning models with a strong generalization ability.
- (3)
- The established deep learning model, based on LSTM, demonstrated high accuracy in predicting energy state indicators. The R2 value of the altitude prediction model is higher than 0.99, the R2 value of the velocity prediction model is higher than 0.98, and the R2 value of the glide angle prediction model is higher than 0.98. The generalization ability of the model is strong, and the established LSTM model can better predict the aircraft velocity, altitude, and glide angle value in the future 3 s under different wind and turbulent conditions. This predictive strength is invaluable for the early detection of abnormal energy states and for devising control laws tailored to manage and correct such states.
- (4)
- The training strategy of disordering the time sequence of the samples has been proposed to improve the predictive accuracy of LSTM. The training results showed that if a deep learning network for flight parameter prediction is to be established in the aircraft approach and landing stages, the time sequence of training samples should be disordered. A failure to carry this out may result in an “overfitting phenomenon”, which is characterized by high accuracy in the training set but poor performance in the test set. This finding is not only pivotal in optimizing LSTM models but also holds significant implications for developing other types of deep neural networks.
Due to the time-consuming and labor-intensive nature of building the simulation platform and running the simulations, our current study has only been able to uniformly and comprehensively cover the sample space with 80 effective simulations. However, we acknowledge that this pool of samples is limited and plan to design and conduct more additional simulations in the future. These will explore different combinations of wind speeds and directions, throttle settings, and flap deflection angles to further enhance the accuracy of energy predictions during the aircraft’s approach and landing phases. By expanding our pool of samples accordingly, we aim to improve the reliability and applicability of our models for real-world scenarios. Additionally, when flying in thunderstorms, aircraft may encounter strong winds, severe turbulence, low visibility, lightning, and other dangerous factors, which highly increase the uncertainty and risk of flights. Therefore, in the future, we will explore the impact of various complex weather conditions including thunderstorms on aircraft approach and landing. Through in-depth research on these weather conditions, we hope to more accurately predict and assess their impact on aircraft operations, providing strong support for ensuring aviation safety and improving flight punctuality. Finally, in our future work, we will prioritize the investigation of the versatility and adaptability of the thresholds utilized in defining low energy states. Specifically, we aim to expand the scope of validation as follows: we will extend our analysis to include a broader range of aircraft types, weights, and weather conditions. This comprehensive validation will enable us to assess the variability of thresholds across different scenarios and ensure the reliability of our methodology.
Author Contributions
Methodology, Y.H.; writing—review and editing, J.Y.; software, E.C.; data curation, Y.Y.; investigation, H.T.; project administration, H.H. All authors have read and agreed to the published version of the manuscript.
Funding
This research was funded by the Fundamental Research Funds for the Central Universities [grant number D5000230052], the Shaanxi Innovation Ability Support Plan Project Funds [grant number 2024RS-CXTD-29] and the Shaanxi Key Research and Development Plan Project Funds [grant number 2024GX-YBXM-263].
Data Availability Statement
The raw data supporting the conclusions of this article will be made available by the authors on request.
Acknowledgments
This work was supported by Chinese Flight Test Establishment and Northwestern Polytechnical University.
Conflicts of Interest
The authors declare no conflict of interest.
References
- Noort, M.C.; Reader, T.W.; Gillespie, A. Safety voice and safety listening during aviation accidents: Cockpit voice recordings reveal that speaking-up to power is not enough. Saf. Sci. 2021, 139, 105260. [Google Scholar] [CrossRef]
- Kalagher, H.; de Voogt, A.; Boulter, C.J.A.P.; Factors, A.H. Situational Awareness and General Aviation Accidents. Aviat. Psychol. Appl. Hum. Factors 2021, 11, 112–117. [Google Scholar] [CrossRef]
- Perboli, G.; Gajetti, M.; Fedorov, S.; Lo Giudice, S. Natural Language Processing for the identification of Human factors in aviation accidents causes: An application to the SHEL methodology. Expert Syst. Appl. 2021, 186, 7. [Google Scholar]
- Chang, M.; Huang, L.; You, X.Q.; Wang, P.; Francis, G.; Proctor, R.W. The black hole illusion: A neglected source of aviation accidents. Int. J. Ind. Erg. 2022, 87, 7. [Google Scholar] [CrossRef]
- Zajdel, A.; Krawczyk, M.; Szczepanski, C. Pre-Flight Test Verification of Automatic Stabilization System Using Aircraft Trimming Surfaces. Aerospace 2022, 9, 11. [Google Scholar] [CrossRef]
- Dehais, F.; Behrend, J.; Peysakhovich, V.; Causse, M.; Wickens, C.D. Pilot flying and pilot monitoring’s aircraft state awareness during go-around execution in aviation: A behavioral and eye tracking study. Int. J. Aerosp. Psychol. 2017, 27, 15–28. [Google Scholar] [CrossRef]
- Kaszycki, M. Special Conditions: Bombardier Aerospace, Models BD-500-1A10 and BD-500-1A11. In Electronic Flight Control System: Lateral-Directional and Longitudinal Stability and Low-Energy Awareness; FAA: Renton, WA, USA, 2015. [Google Scholar]
- Flight Safety Foundation. Flight safety foundation approach-and-landing accident reduction briefing note 4.2-energy management. Flight Saf. Dig. 2000, 19, 75–80. [Google Scholar]
- Puranik, T.; Jimenez, H.; Mavris, D. Energy-based metrics for safety analysis of general aviation operations. J. Aircr. 2017, 54, 2285–2297. [Google Scholar] [CrossRef]
- Chen, J.P.; Wang, L.X. Hazards of low energy state to flight safety and recovery methods. Acta Aeronaut. Astronat. Sin. 2017, 38, 121077. [Google Scholar]
- Shish, K.; Kaneshige, J.; Acosta, D.; Schuet, S.; Lombaerts, T.; Martin, L.; Madavan, A.N. Aircraft mode and energy-state prediction, assessment, and alerting. J. Guid. Control Dyn. 2017, 40, 804–816. [Google Scholar] [CrossRef]
- Wang, X.; Sembiring, J.; Koppitz, P.; Höhndorf, L.; Wang, C.; Holzapfel, F. Modeling of the aircraft’s low energy state during the final approach phase using operational flight data. In Proceedings of the AIAA Scitech 2019 Forum, San Diego, CA, USA, 7–11 January 2019. [Google Scholar]
- Lu, Z.; Zhang, S.; Dai, R.; Huang, M. Abnormal energy risk criteria of large civil airplanes in approach and landing. Acta Aeronaut. Astronaut. Sin. 2021, 42, 102–115. [Google Scholar]
- Shish, K.H.; Kaneshige, J.; Acosta, D.M.; Schuet, S.; Lombaerts, T.; Martin, L.; Madavan, A.N. Trajectory Prediction and Alerting for Aircraft Mode and Energy State Awareness. In Proceedings of the AIAA Infotech@Aerospace, Kissimmee, FL, USA, 5–9 January 2015. [Google Scholar]
- Li, L.; Das, S.; John Hansman, R.; Palacios, R.; Srivastava, A.N. Analysis of flight data using clustering techniques for detecting abnormal operations. J. Aerosp. Inf. Syst. 2015, 12, 587–598. [Google Scholar] [CrossRef]
- Chandola, V.; Banerjee, A.; Kumar, V. Anomaly Detection: A Survey. ACM Comput. Surv. 2009, 41, 1–58. [Google Scholar] [CrossRef]
- Puranik, T.G.; Mavris, D.N. Identification of instantaneous anomalies in general aviation operations using energy metrics. J. Aerosp. Inf. Syst. 2020, 17, 51–65. [Google Scholar] [CrossRef]
- Matthews, B.; Das, S.; Bhaduri, K.; Das, K.; Martin, R.; Oza, N. Discovering anomalous aviation safety events using scalable data mining algorithms. J. Aerosp. Inf. Syst. 2013, 10, 467–475. [Google Scholar] [CrossRef]
- Gavrilovski, A.; Jimenez, H.; Mavris, D.N.; Rao, A.H.; Shin, S.; Hwang, I.; Marais, K. Challenges and opportunities in flight data mining: A review of the state of the art. In Proceedings of the AIAA Infotech@ Aerospace, San Diego, CA, USA, 4–8 January 2016. [Google Scholar]
- Bay, S.D.; Schwabacher, M. Mining distance-based outliers in near linear time with randomization and a simple pruning rule. In Proceedings of the Ninth ACM SIGKDD International Conference on Knowledge Discovery and Data Mining, Washington, DC, USA, 24–27 August 2003; pp. 29–38. [Google Scholar]
- Amidan, B.G.; Ferryman, T.A. APMS SVD Methodology and Implementation (No. PNWD-3026); Pacific Northwest National Lab. (PNNL): Richland, WA, USA, 2000.
- Mugtussids, I.B. Flight Data Processing Techniques to Identify Unusual Events. Ph.D. Thesis, Virginia Polytechnic Institute and State University, Blacksburg, VA, USA, 2000. [Google Scholar]
- Melnyk, I.; Matthews, B.; Valizadegan, H.; Banerjee, A.; Oza, N. Vector autoregressive model-based anomaly detection in aviation systems. J. Aerosp. Inf. Syst. 2016, 13, 161–173. [Google Scholar] [CrossRef]
- Li, L.; Hansman, R.J.; Palacios, R.; Welsch, R. Anomaly detection via a Gaussian Mixture Model for flight operation and safety monitoring. Transp. Res. Part C Emerg. Technol. 2016, 64, 45–57. [Google Scholar] [CrossRef]
- Basora, L.; Olive, X.; Dubot, T. Recent advances in anomaly detection methods applied to aviation. Aerospace 2019, 6, 117. [Google Scholar] [CrossRef]
- Puranik, T.G.; Harrison, E.; Min, S.; Jimenez, H.; Mavris, D.N. Energy-Based Metrics for General Aviation Flight Data Record Analysis. In Proceedings of the 16th AIAA Aviation Technology, Integration, and Operations Conference, Washington, DC, USA, 13–17 June 2016; Volume 3915. [Google Scholar]
- Puranik, T.G.; Mavris, D.N. Anomaly detection in general-aviation operations using energy metrics and flight-data records. J. Aerosp. Inf. Syst. 2018, 15, 22–36. [Google Scholar] [CrossRef]
- Li, G.; Cao, E.; Jia, B.; Zhang, X.; Wang, W.; Huang, H. Mechanical properties and failure behaviors of T1100/5405 composite T-joint under in-plane shear load coupled with initial defect and high-temperature. Compos. Struct. 2023, 324, 117722. [Google Scholar] [CrossRef]
- Karim, F.; Majumdar, S.; Darabi, H.; Harford, S. Multivariate LSTM-FCNs for time series classification. Neural. Netw. 2019, 116, 237–245. [Google Scholar] [CrossRef]
- Lazzara, M.; Chevalier, M.; Colombo, M.; Garcia, J.G.; Lapeyre, C.; Teste, O. Surrogate modelling for an aircraft dynamic landing loads simulation using an LSTM AutoEncoder-based dimensionality reduction approach. Aerosp. Sci. Technol. 2022, 126, 16. [Google Scholar] [CrossRef]
- Zhou, D.; Zhuang, X.; Zuo, H.F. A hybrid deep neural network based on multi-time window convolutional bidirectional LSTM for civil aircraft APU hazard identification. Chin. J. Aeronaut. 2022, 35, 344–361. [Google Scholar] [CrossRef]
- Engelmann, J.; Mourning, C.; De Haag, M.U. Feasibility of machine learning methods for predictive alerting of the energy state for aircraft. In Proceedings of the 2018 IEEE/AIAA 37th Digital Avionics Systems Conference (DASC), London, UK, 23–27 September 2018; pp. 1–10. [Google Scholar]
- Mi, B.; Huang, H. Intake grille design for an embedded ventilation-and-cooling system in an aircraft. Proc. Inst. Mech. Eng. Part G J. Aerosp. Eng. 2022, 236, 2352–2365. [Google Scholar] [CrossRef]
- De Jong, P.M.; De Gelder, N.; Verhoeven, R.P.M.; Bussink, F.J.L.; Kohrs, R.; Van Paassen, M.M.; Mulder, M. Time and energy management during descent and approach: Batch simulation study. J. Aircr. 2015, 52, 190–203. [Google Scholar] [CrossRef]
- Al-Bakri, F.F.; Al-Bakri, A.F.; Kluever, C.A. Approach and landing guidance for an unpowered gliding vehicle. J. Guid. Control Dyn. 2020, 43, 2366–2371. [Google Scholar] [CrossRef]
- Civil Aviation Administration of China. Requirements for the Certification of the Operation of Large Aircraft Public Air Transport Carriers: CCAR-121-R5; Civil Aviation Administration of China: Beijing, China, 2017.
- Civil Aviation Administration of China. General Operation and Flight Rules: CCAR-01-R3; Civil Aviation Administration of China: Beijing, China, 2018.
- Chiu, T.Y.; Lai, Y.C. Unstable Approach Detection and Analysis Based on Energy Management and a Deep Neural Network. Aerospace 2023, 10, 565. [Google Scholar] [CrossRef]
- Federal Aviation Administration. Windshear Training Aid; Federal Aviation Administration: Washington, DC, USA, 1987.
- Memory, L.S.T. Long short-term memory. Neural Comput. 2010, 9, 1735–1780. [Google Scholar]
- Vepa, R. Flight Dynamics, Simulation, and Control: For Rigid and Flexible Aircraft; CRC Press: Boca Raton, FL, USA, 2023. [Google Scholar]
- Civil Aviation Administration of China. Visual and Instrument Flight Specifications: MH/T 4023-2007; Civil Aviation Administration of China: Beijing, China, 2007.
- Airbus, S.A.S. A320 Flight Crew Operating Manual; Airbus SAS: Toulouse, France, 2009. [Google Scholar]
Figure 1.
Accident distribution per flight phase, 2002–2022.
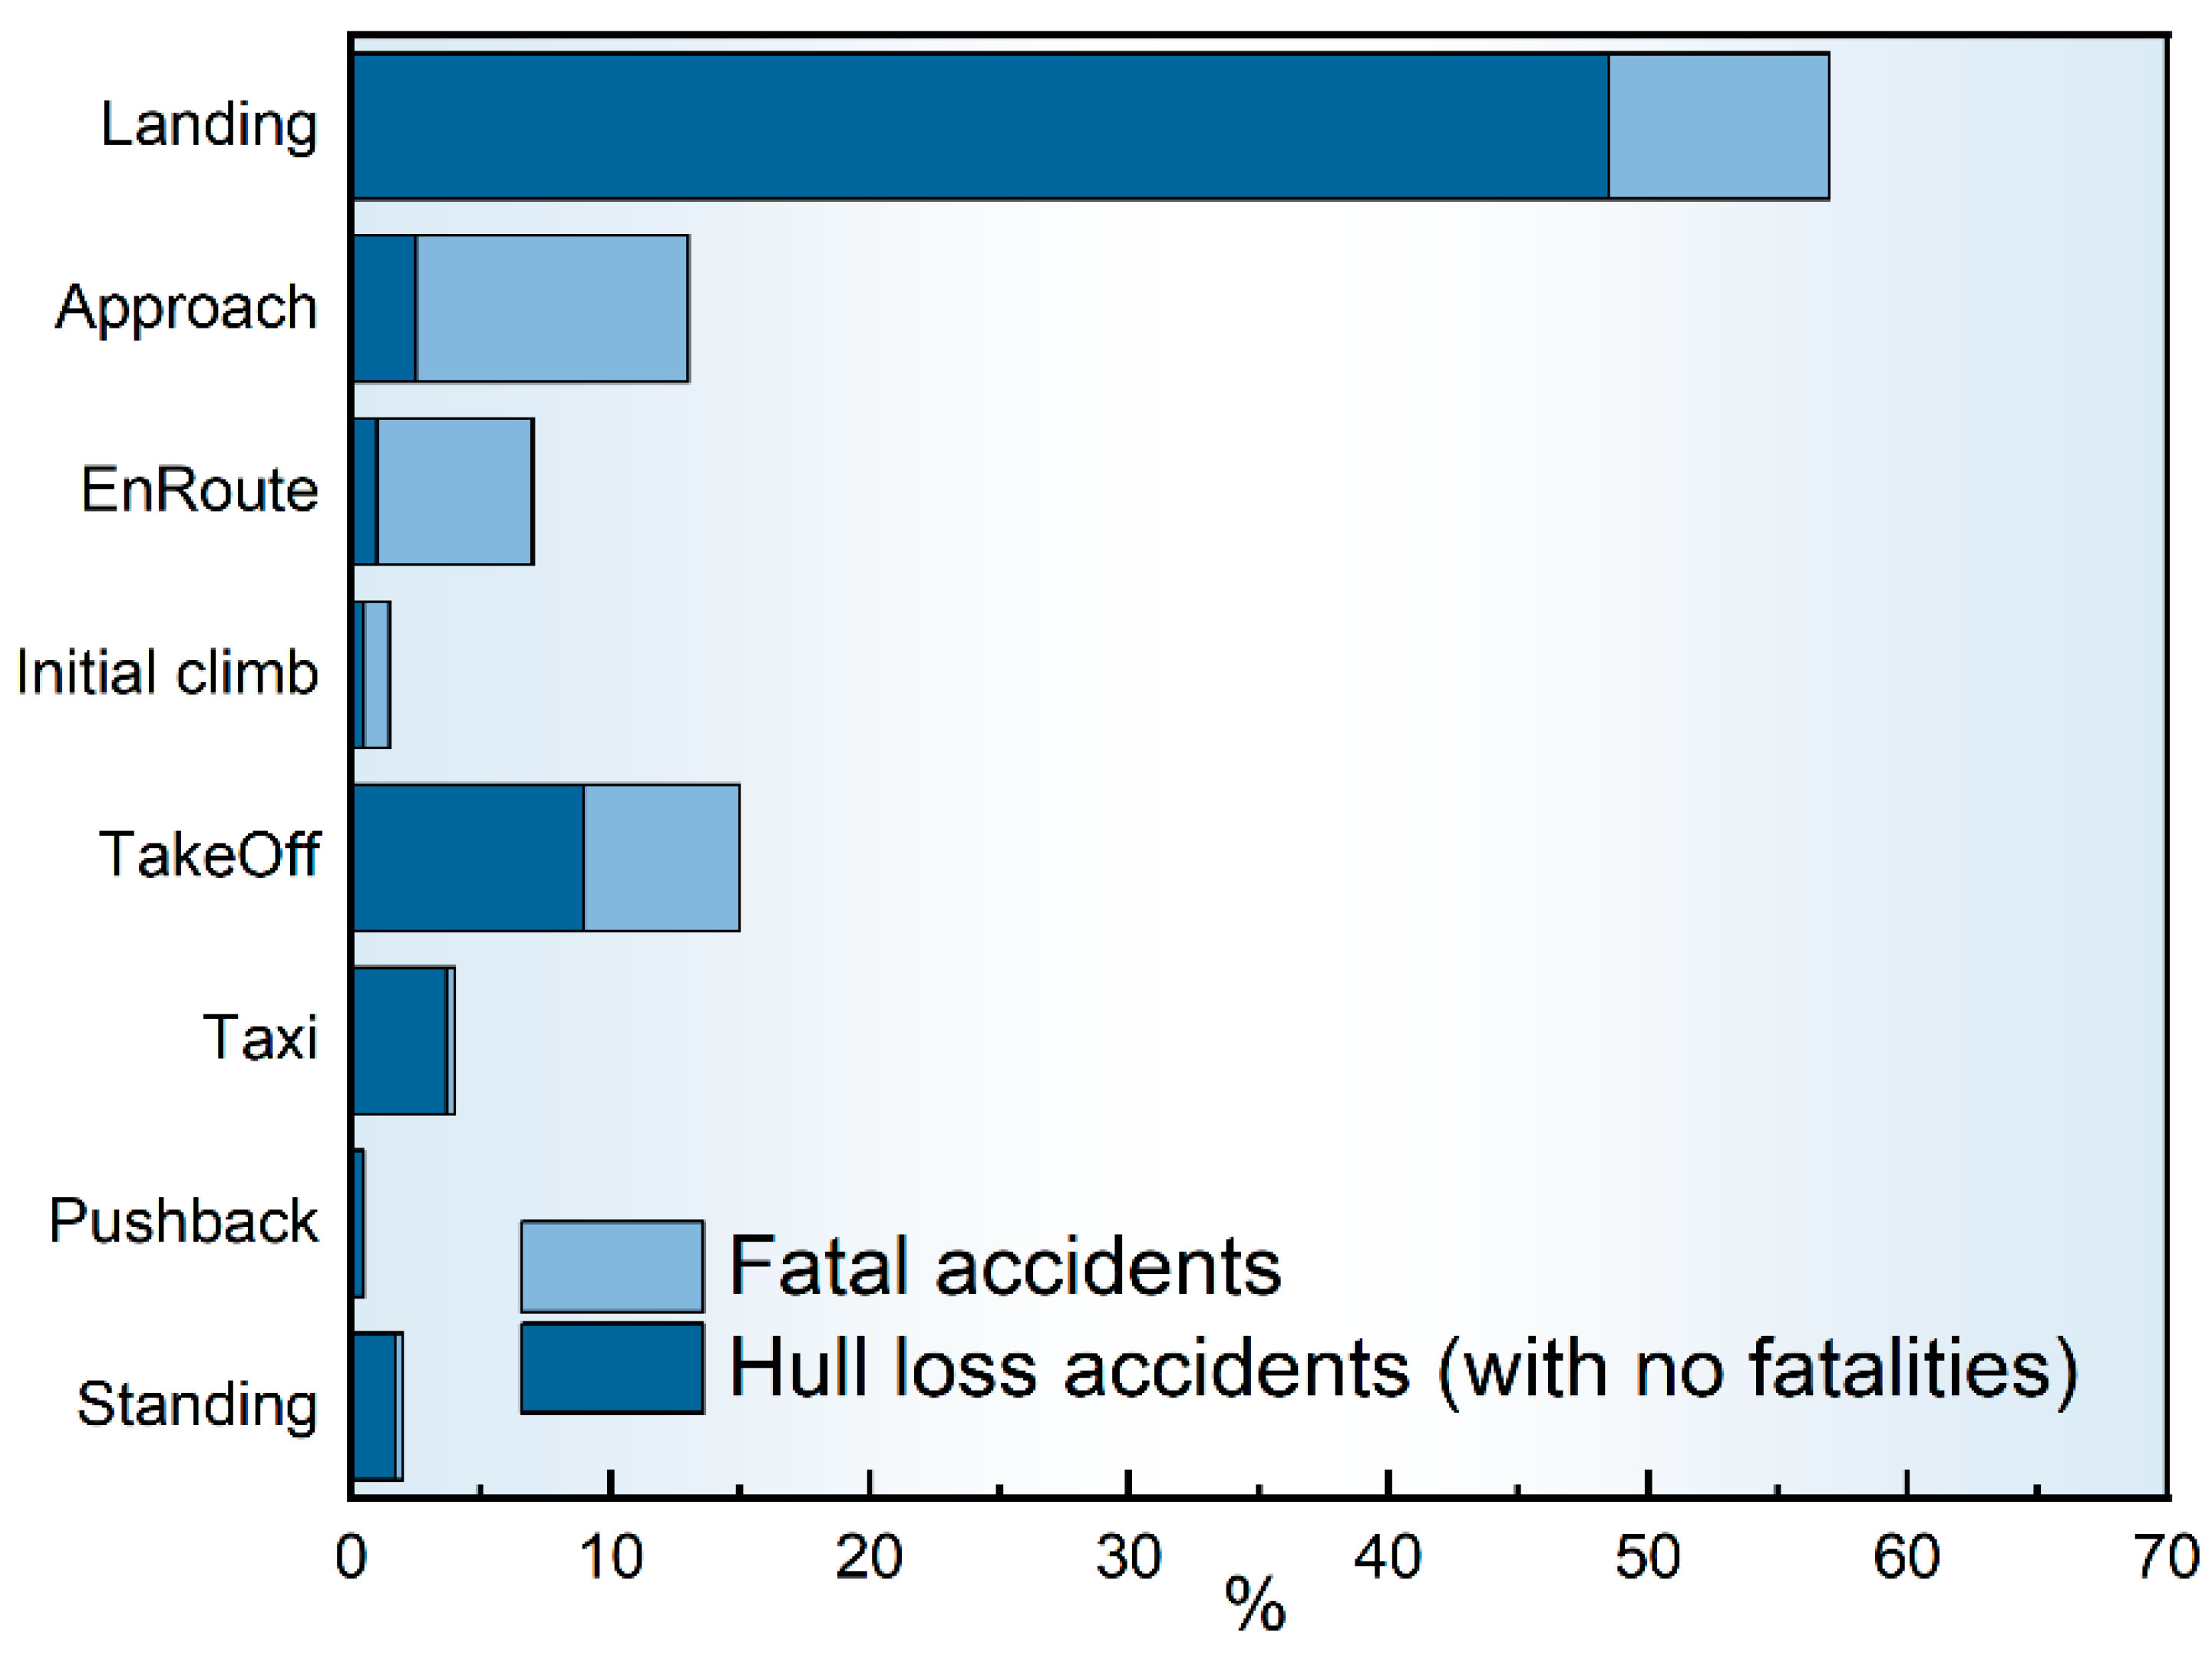
Figure 2.
The structure of LSTM.
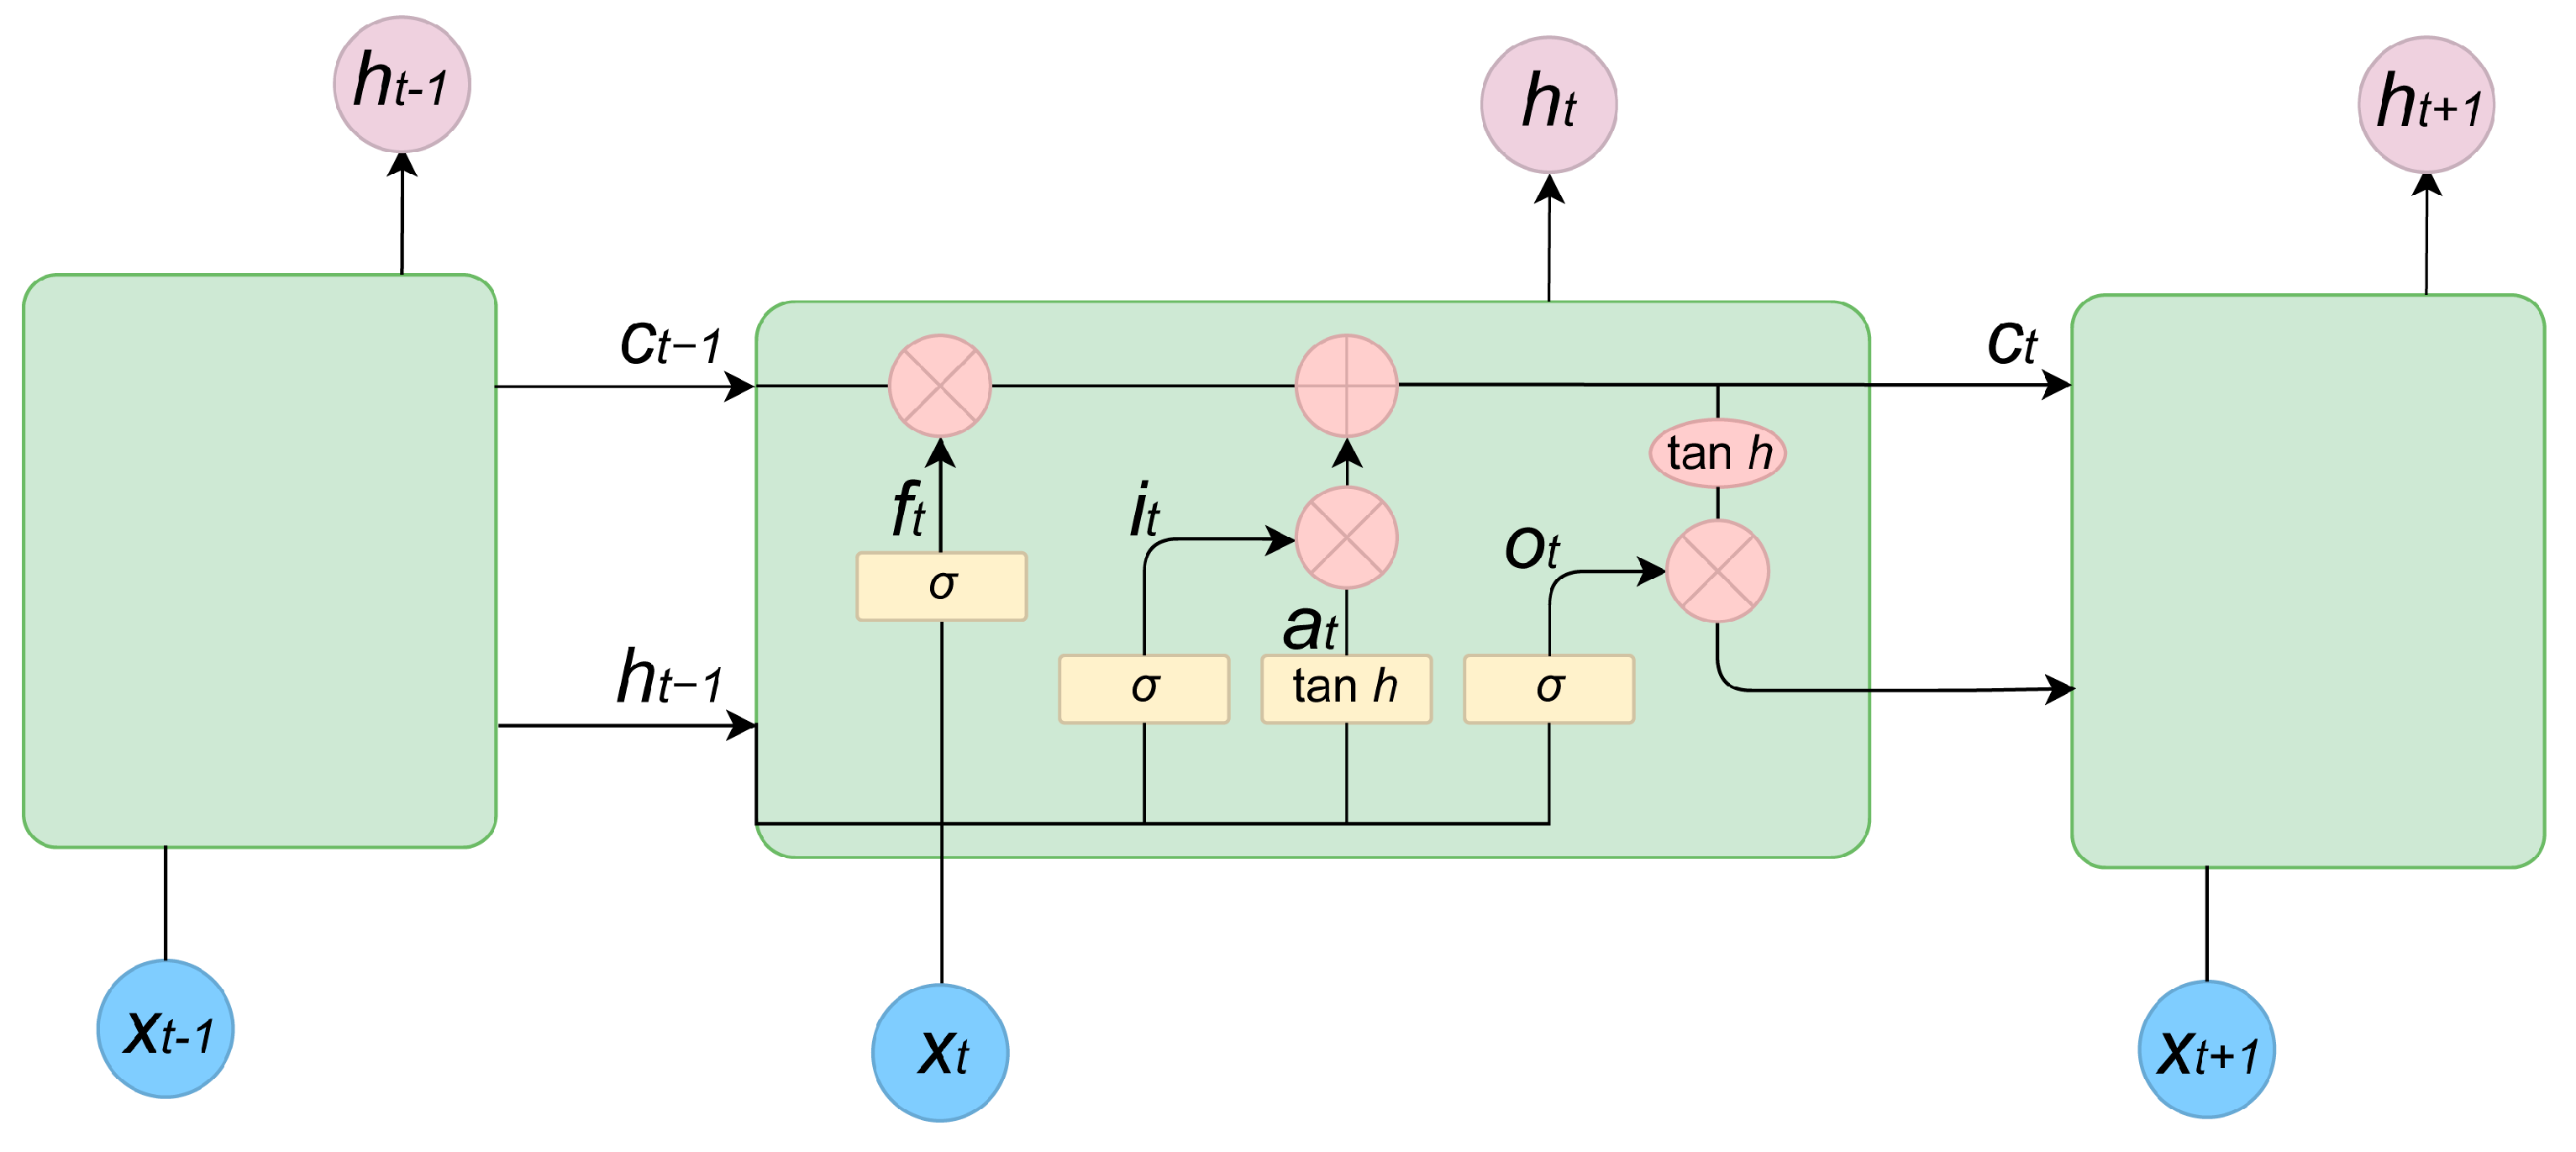
Figure 3.
Parameter panel and operating console of the semi-physical simulation platform.
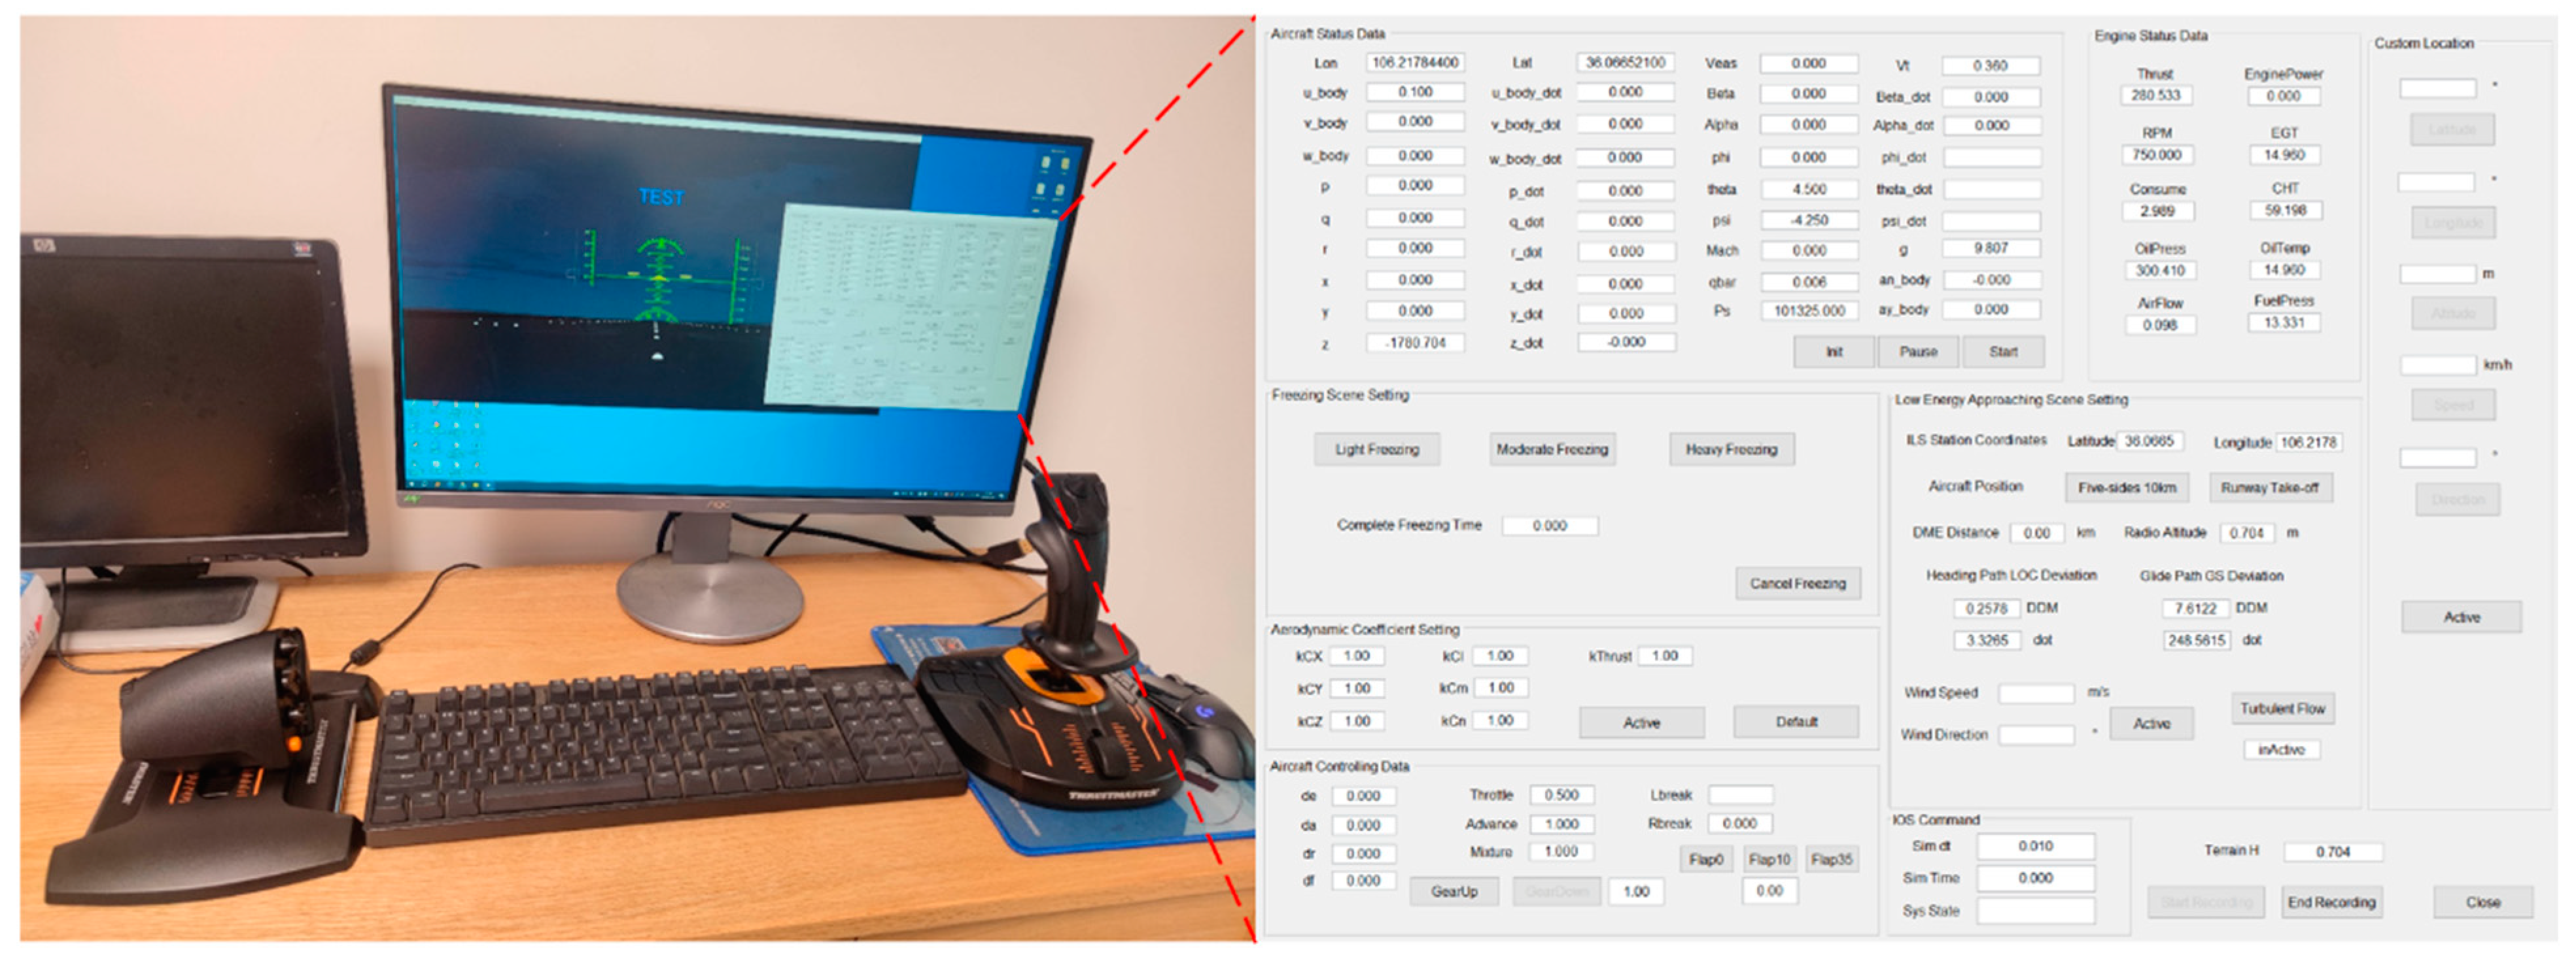
Figure 4.
Parameter classification in the approach and landing simulation.
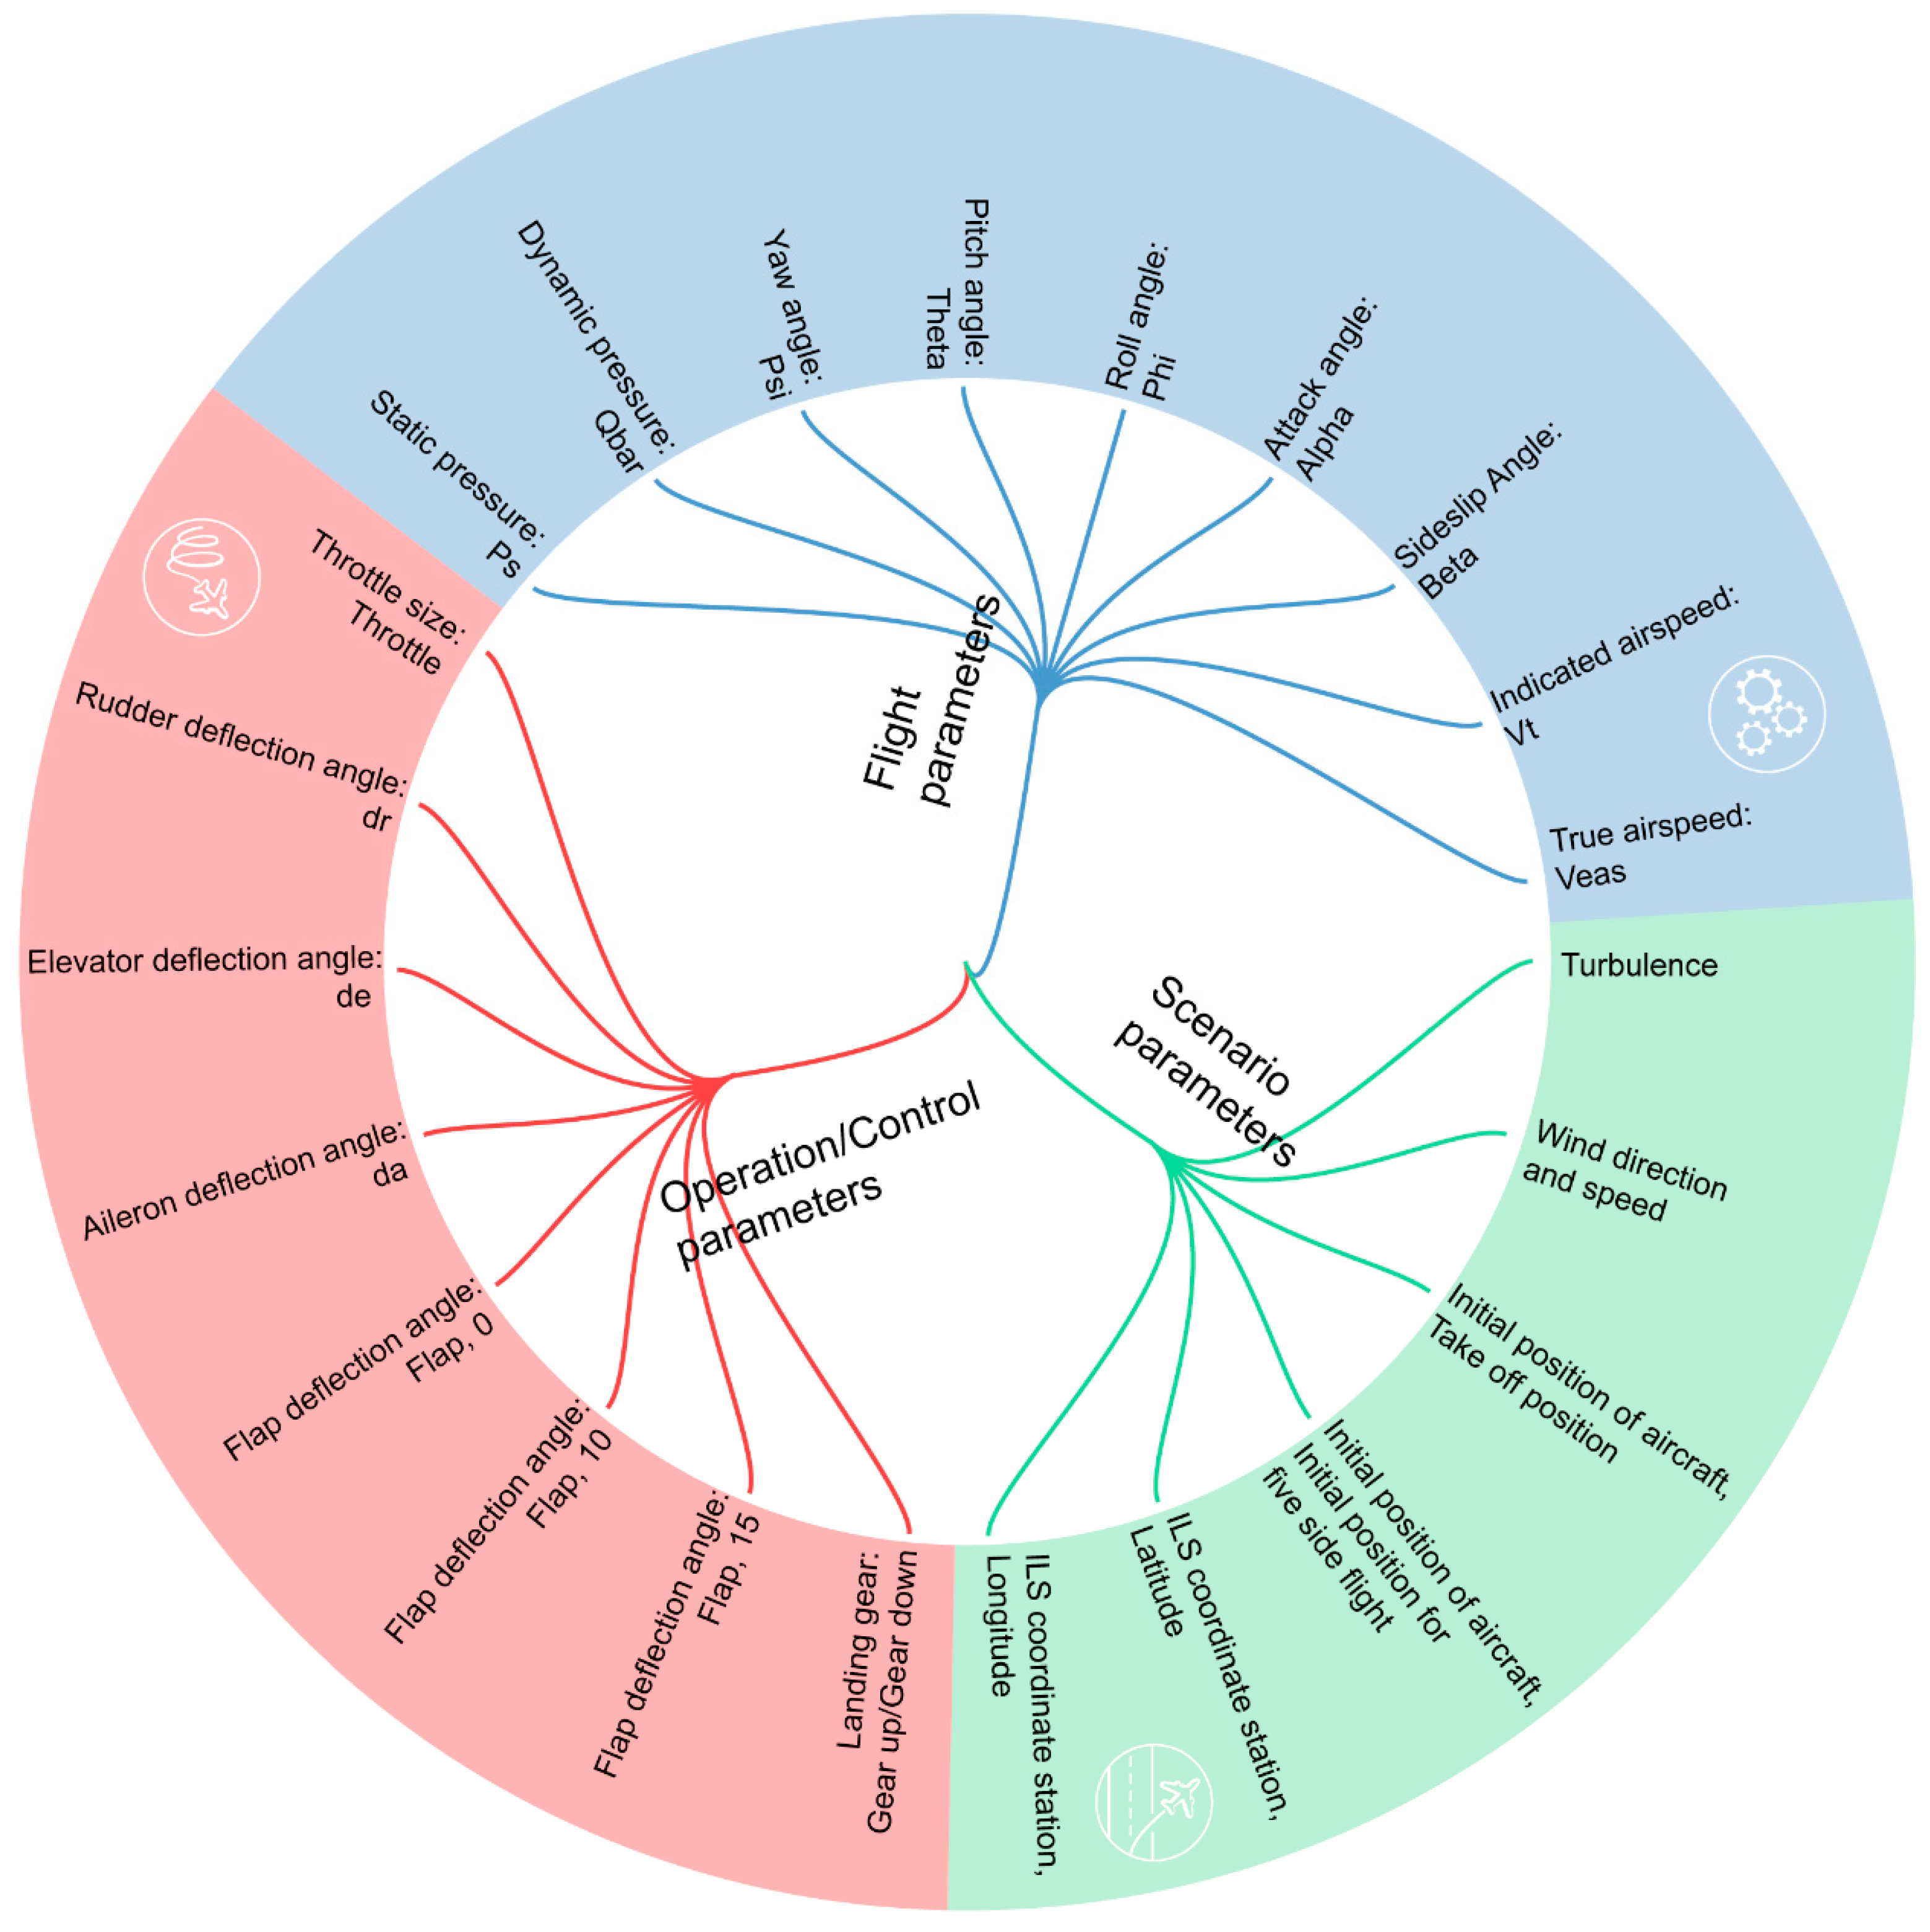
Figure 5.
Changes in the angle of attack of the aircraft during approach and landing.
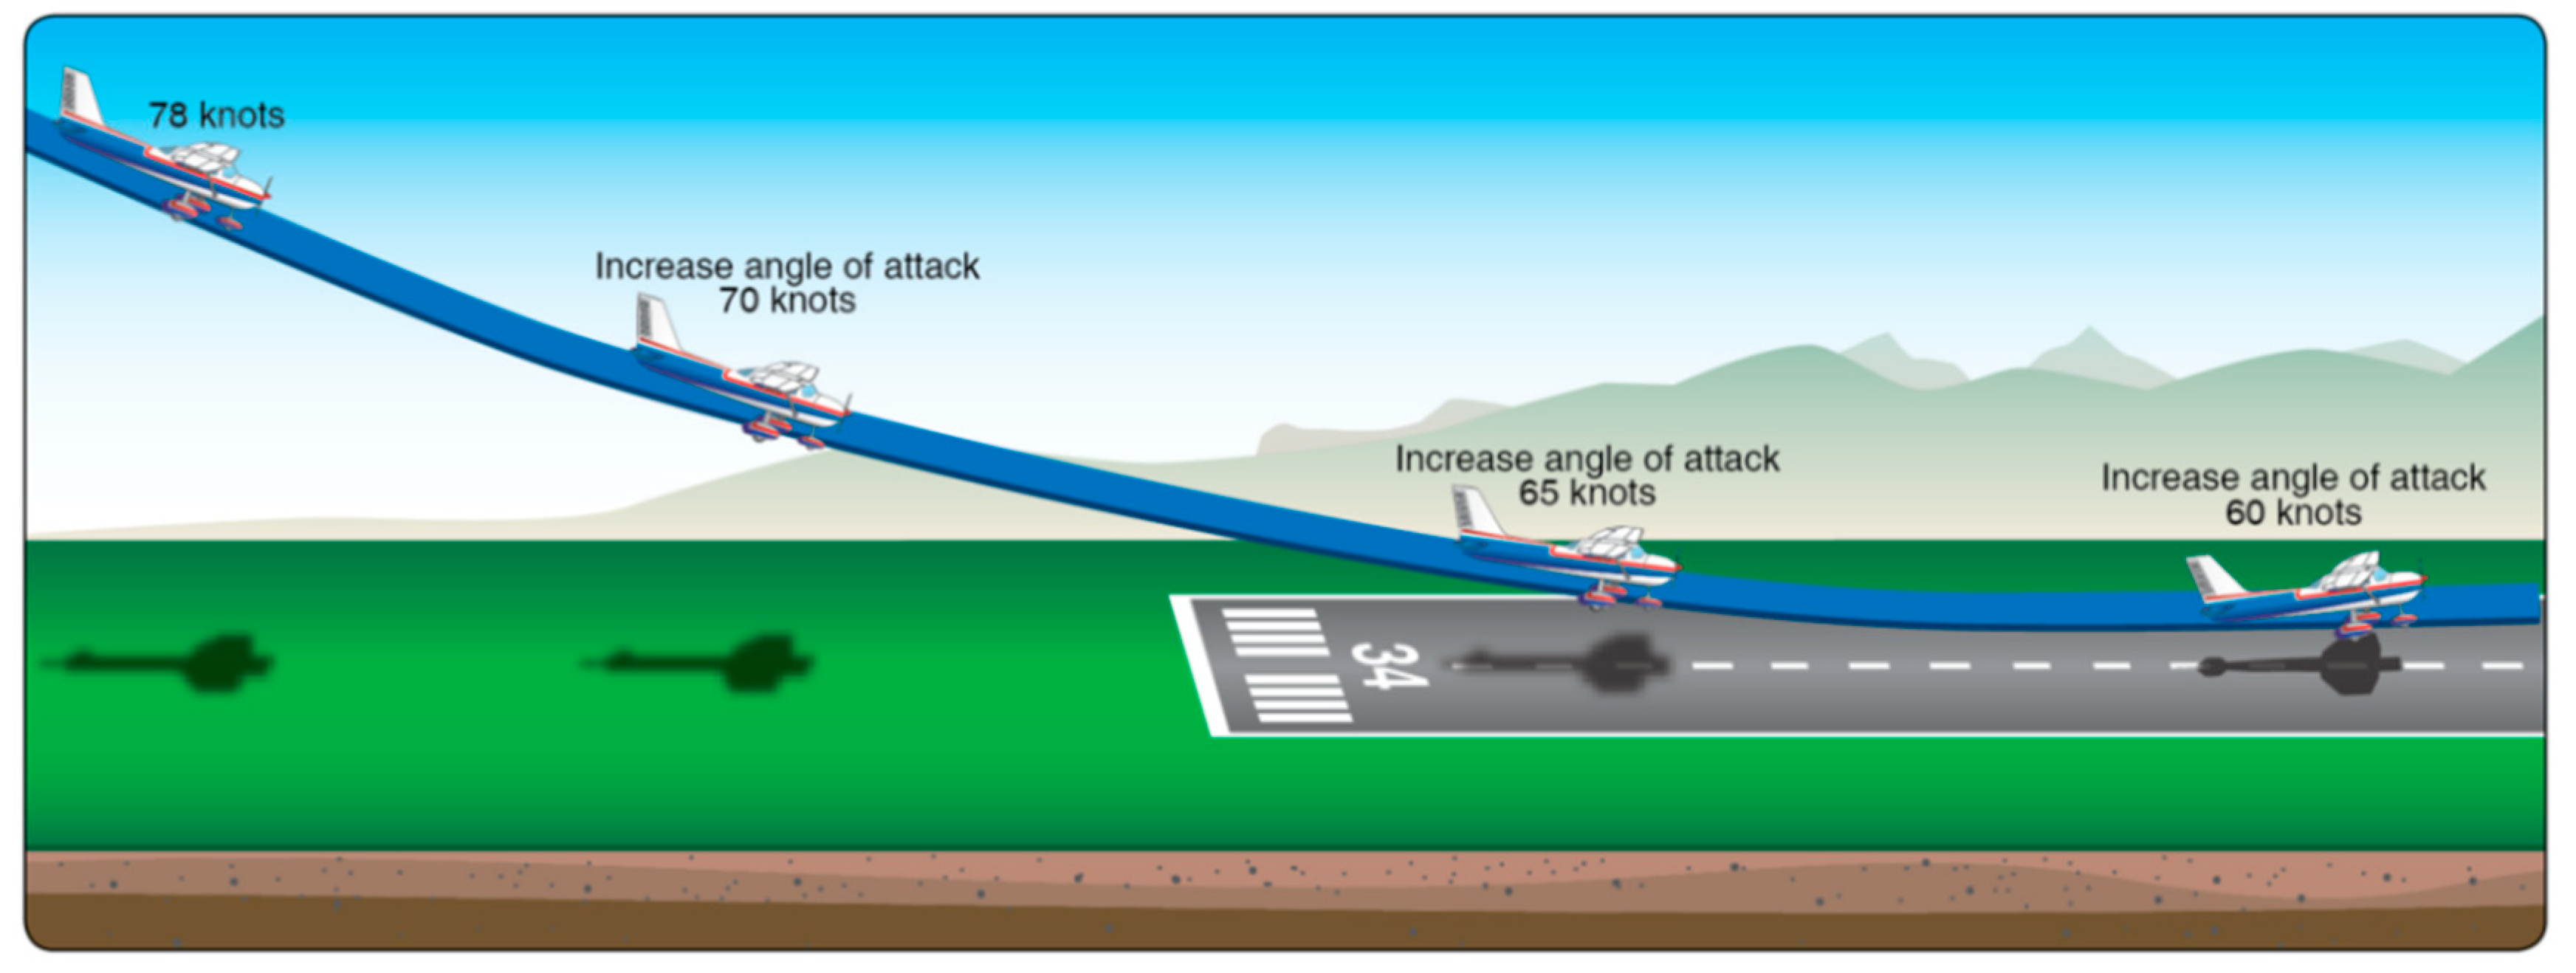
Figure 6.
Partial sample of the file recorded in each simulation.
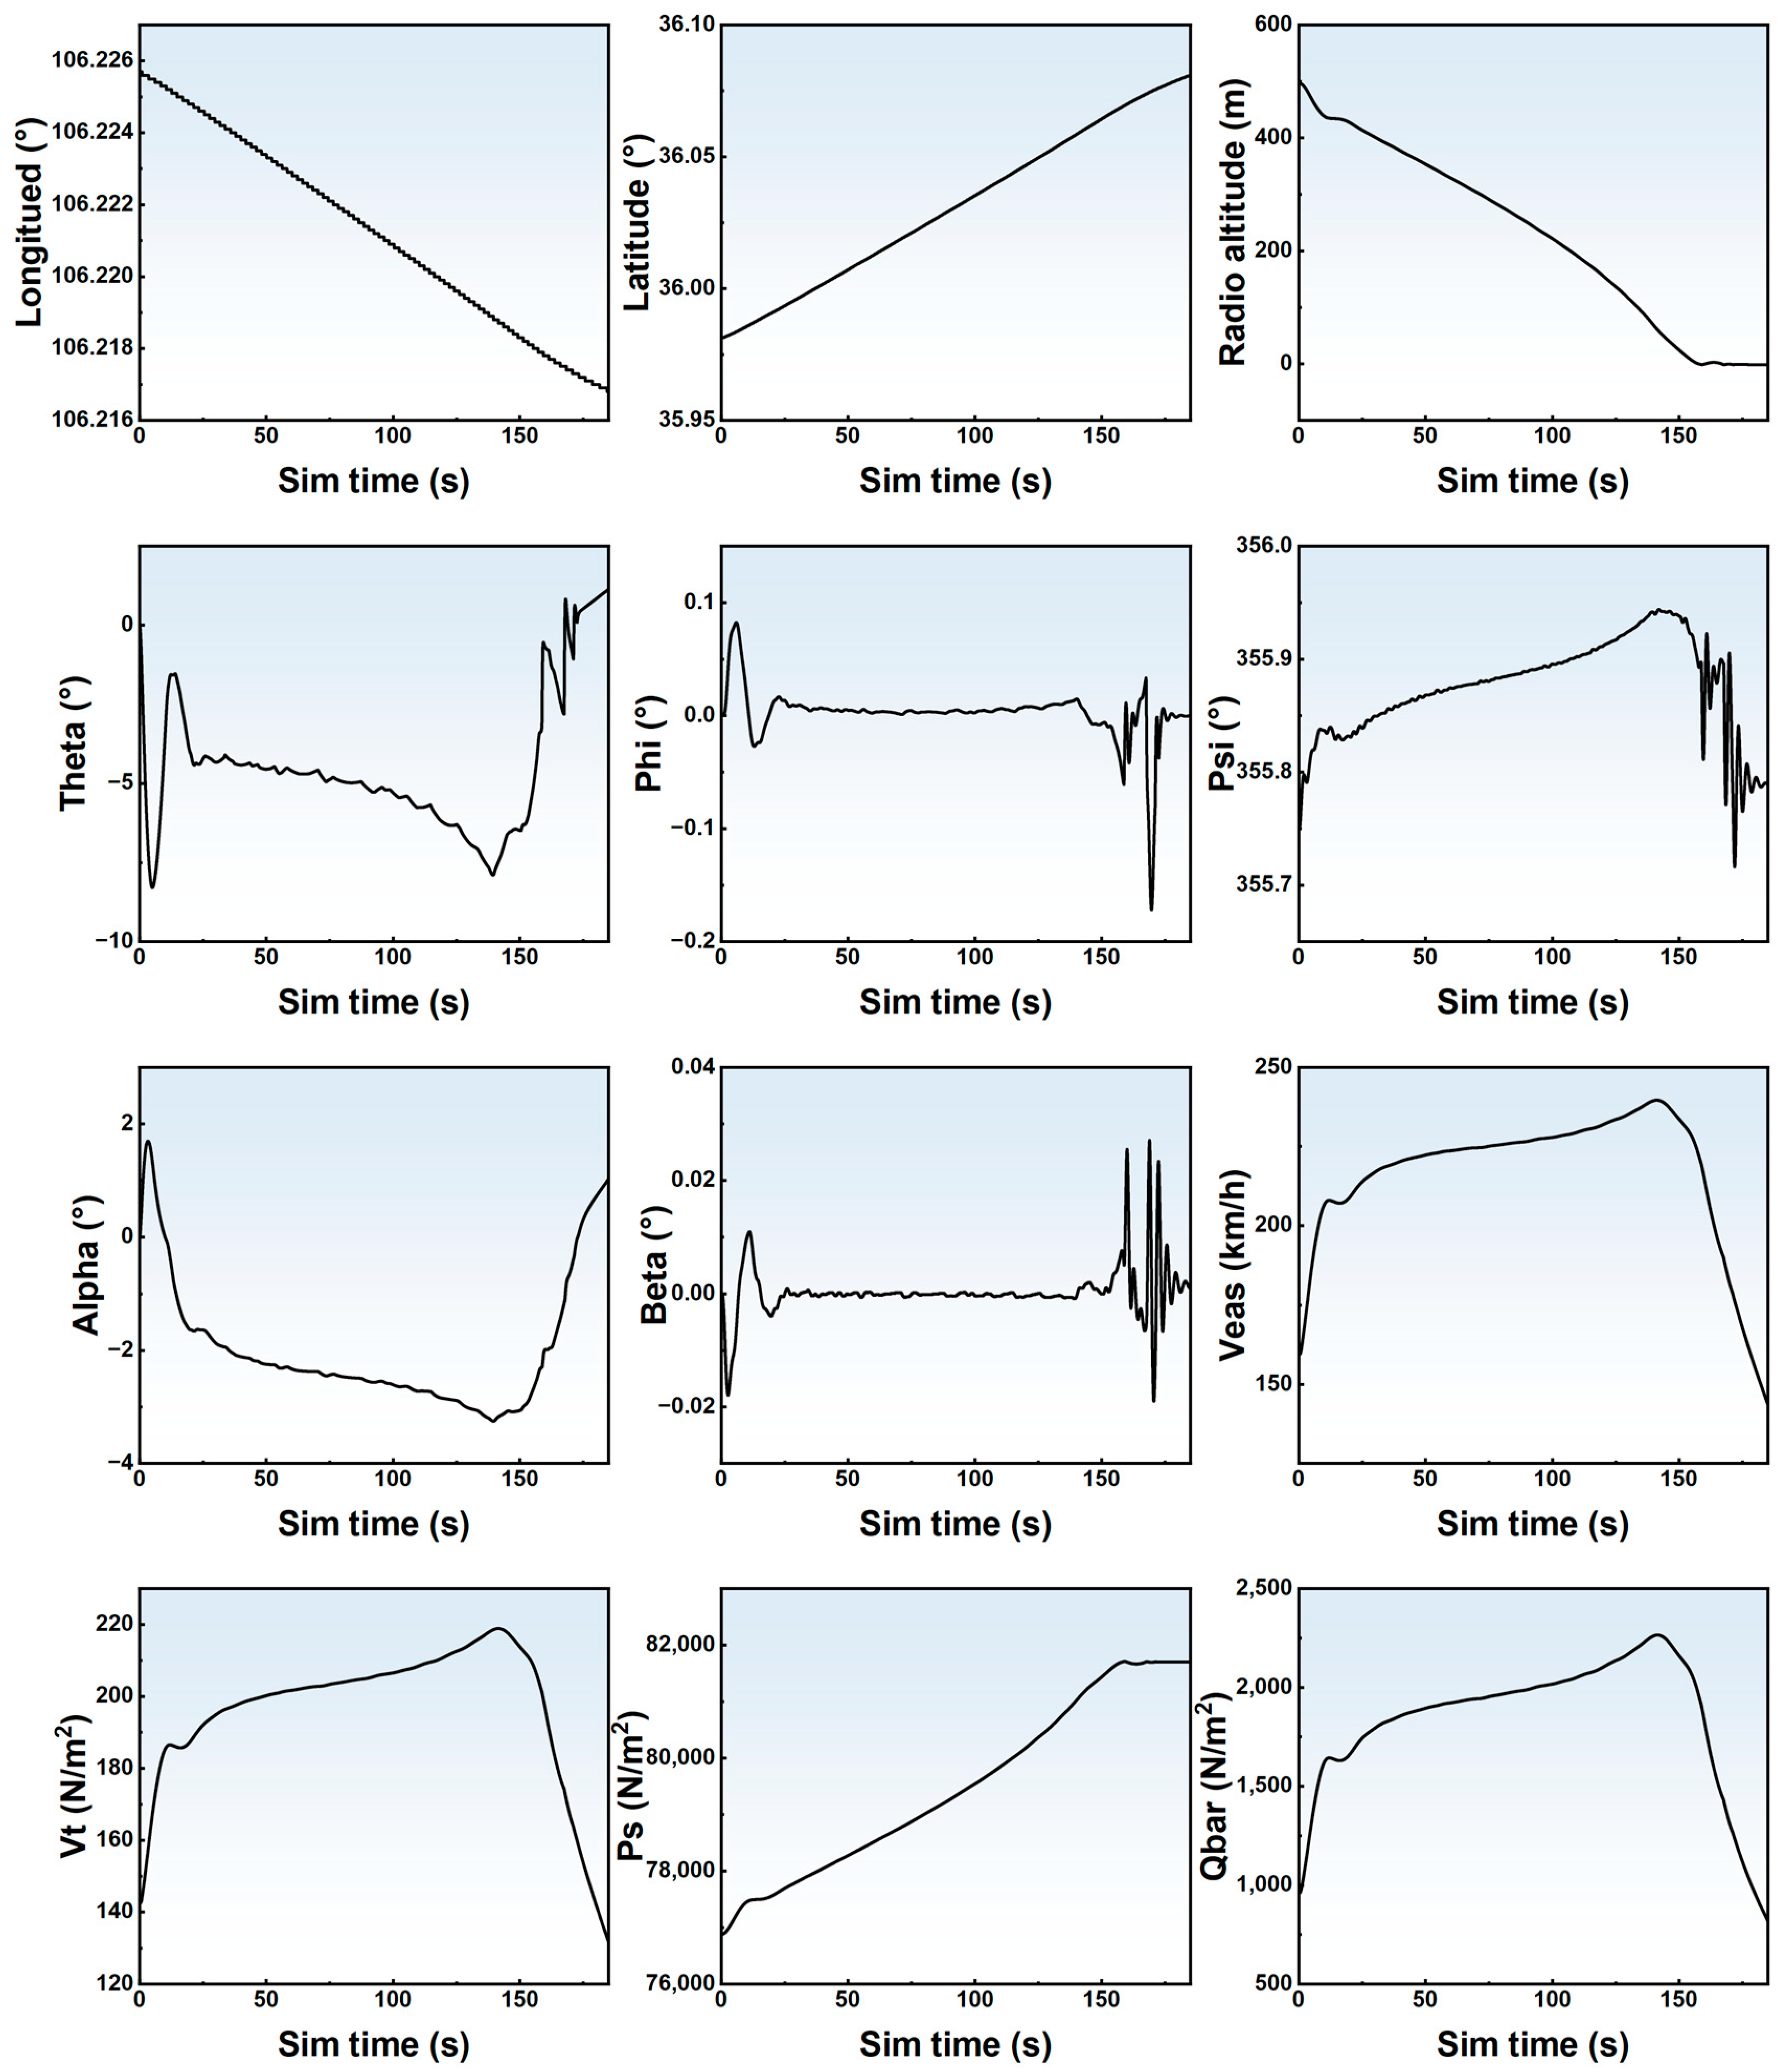
Figure 7.
LSTM model for energy state prediction of approach and landing.
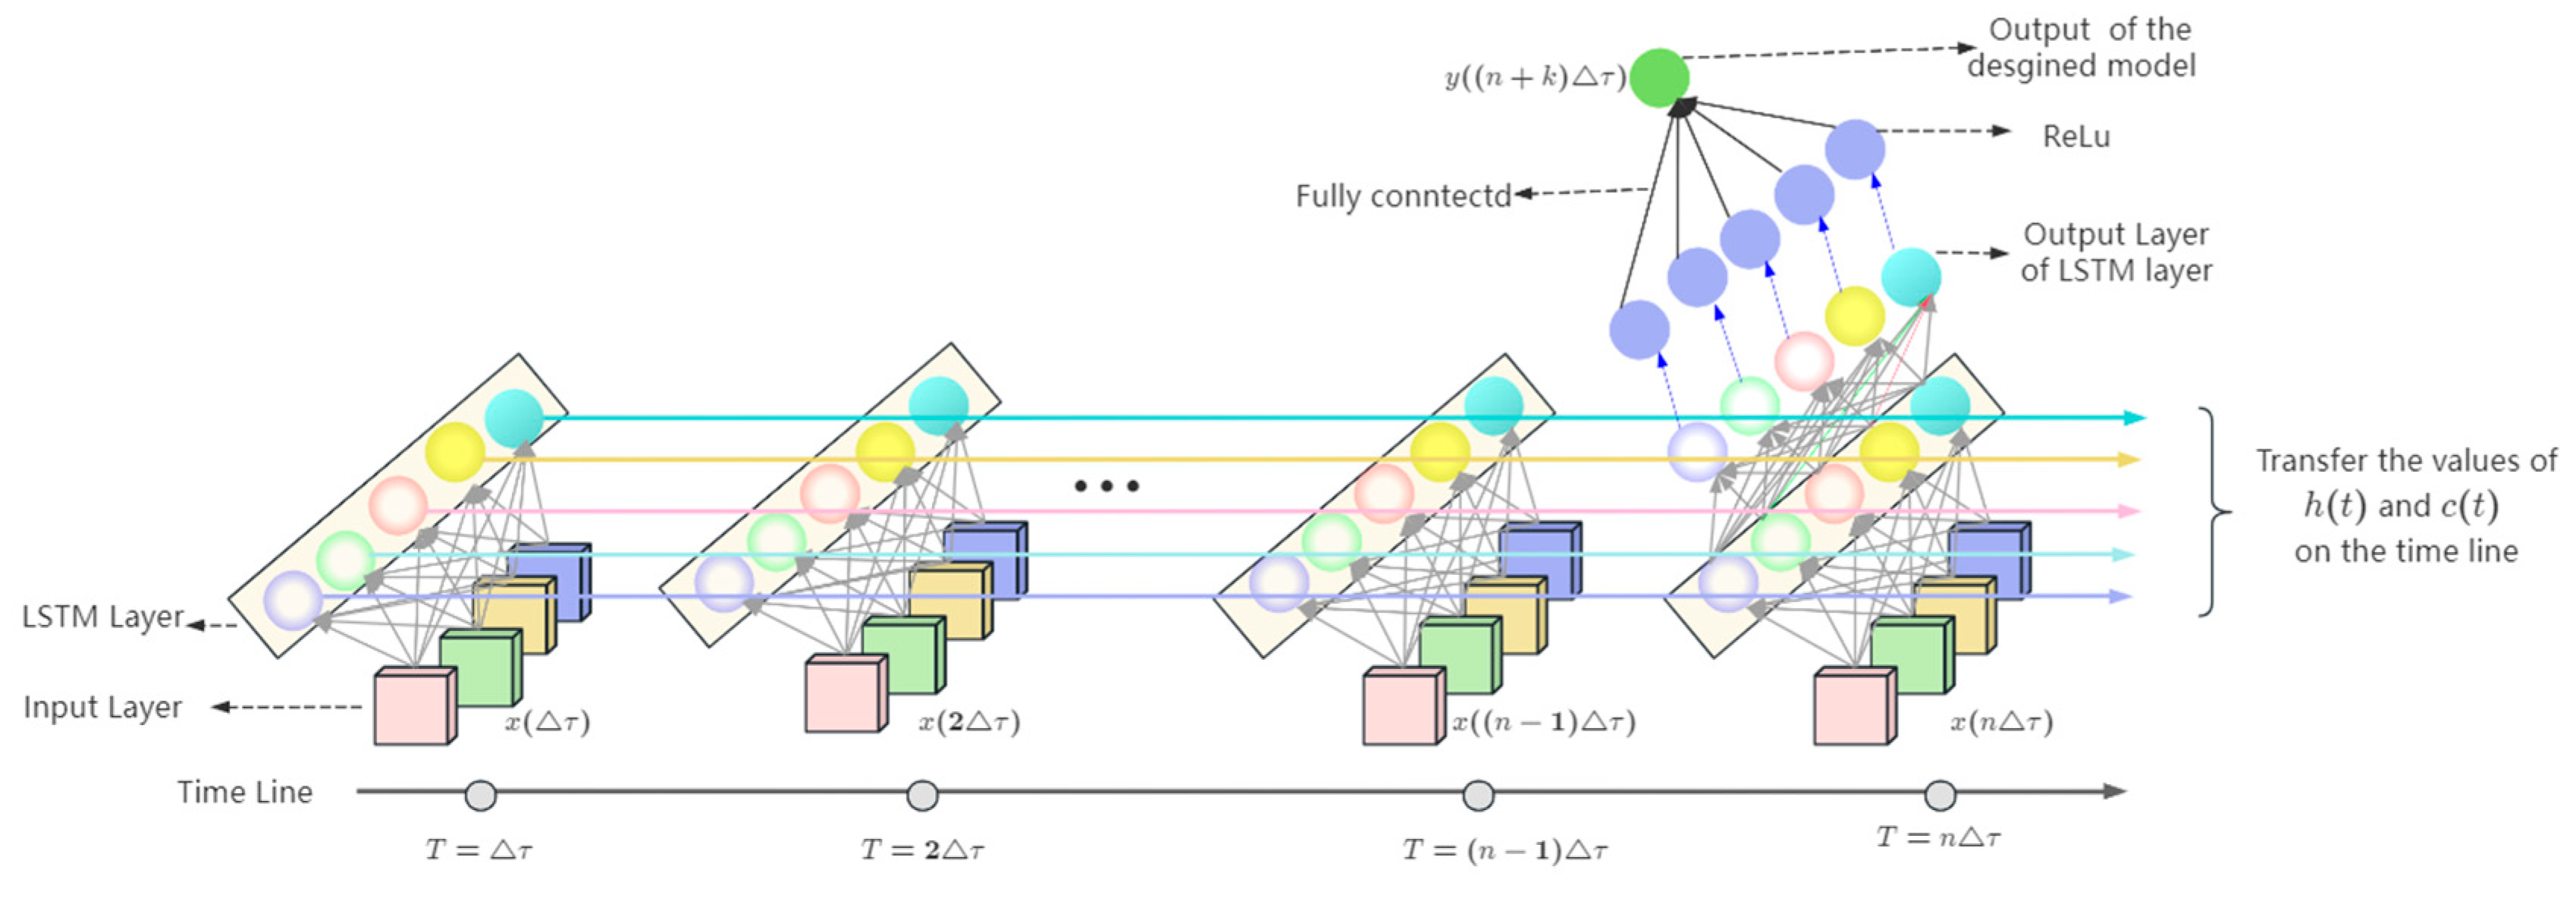
Figure 8.
The details of the LSTM model.
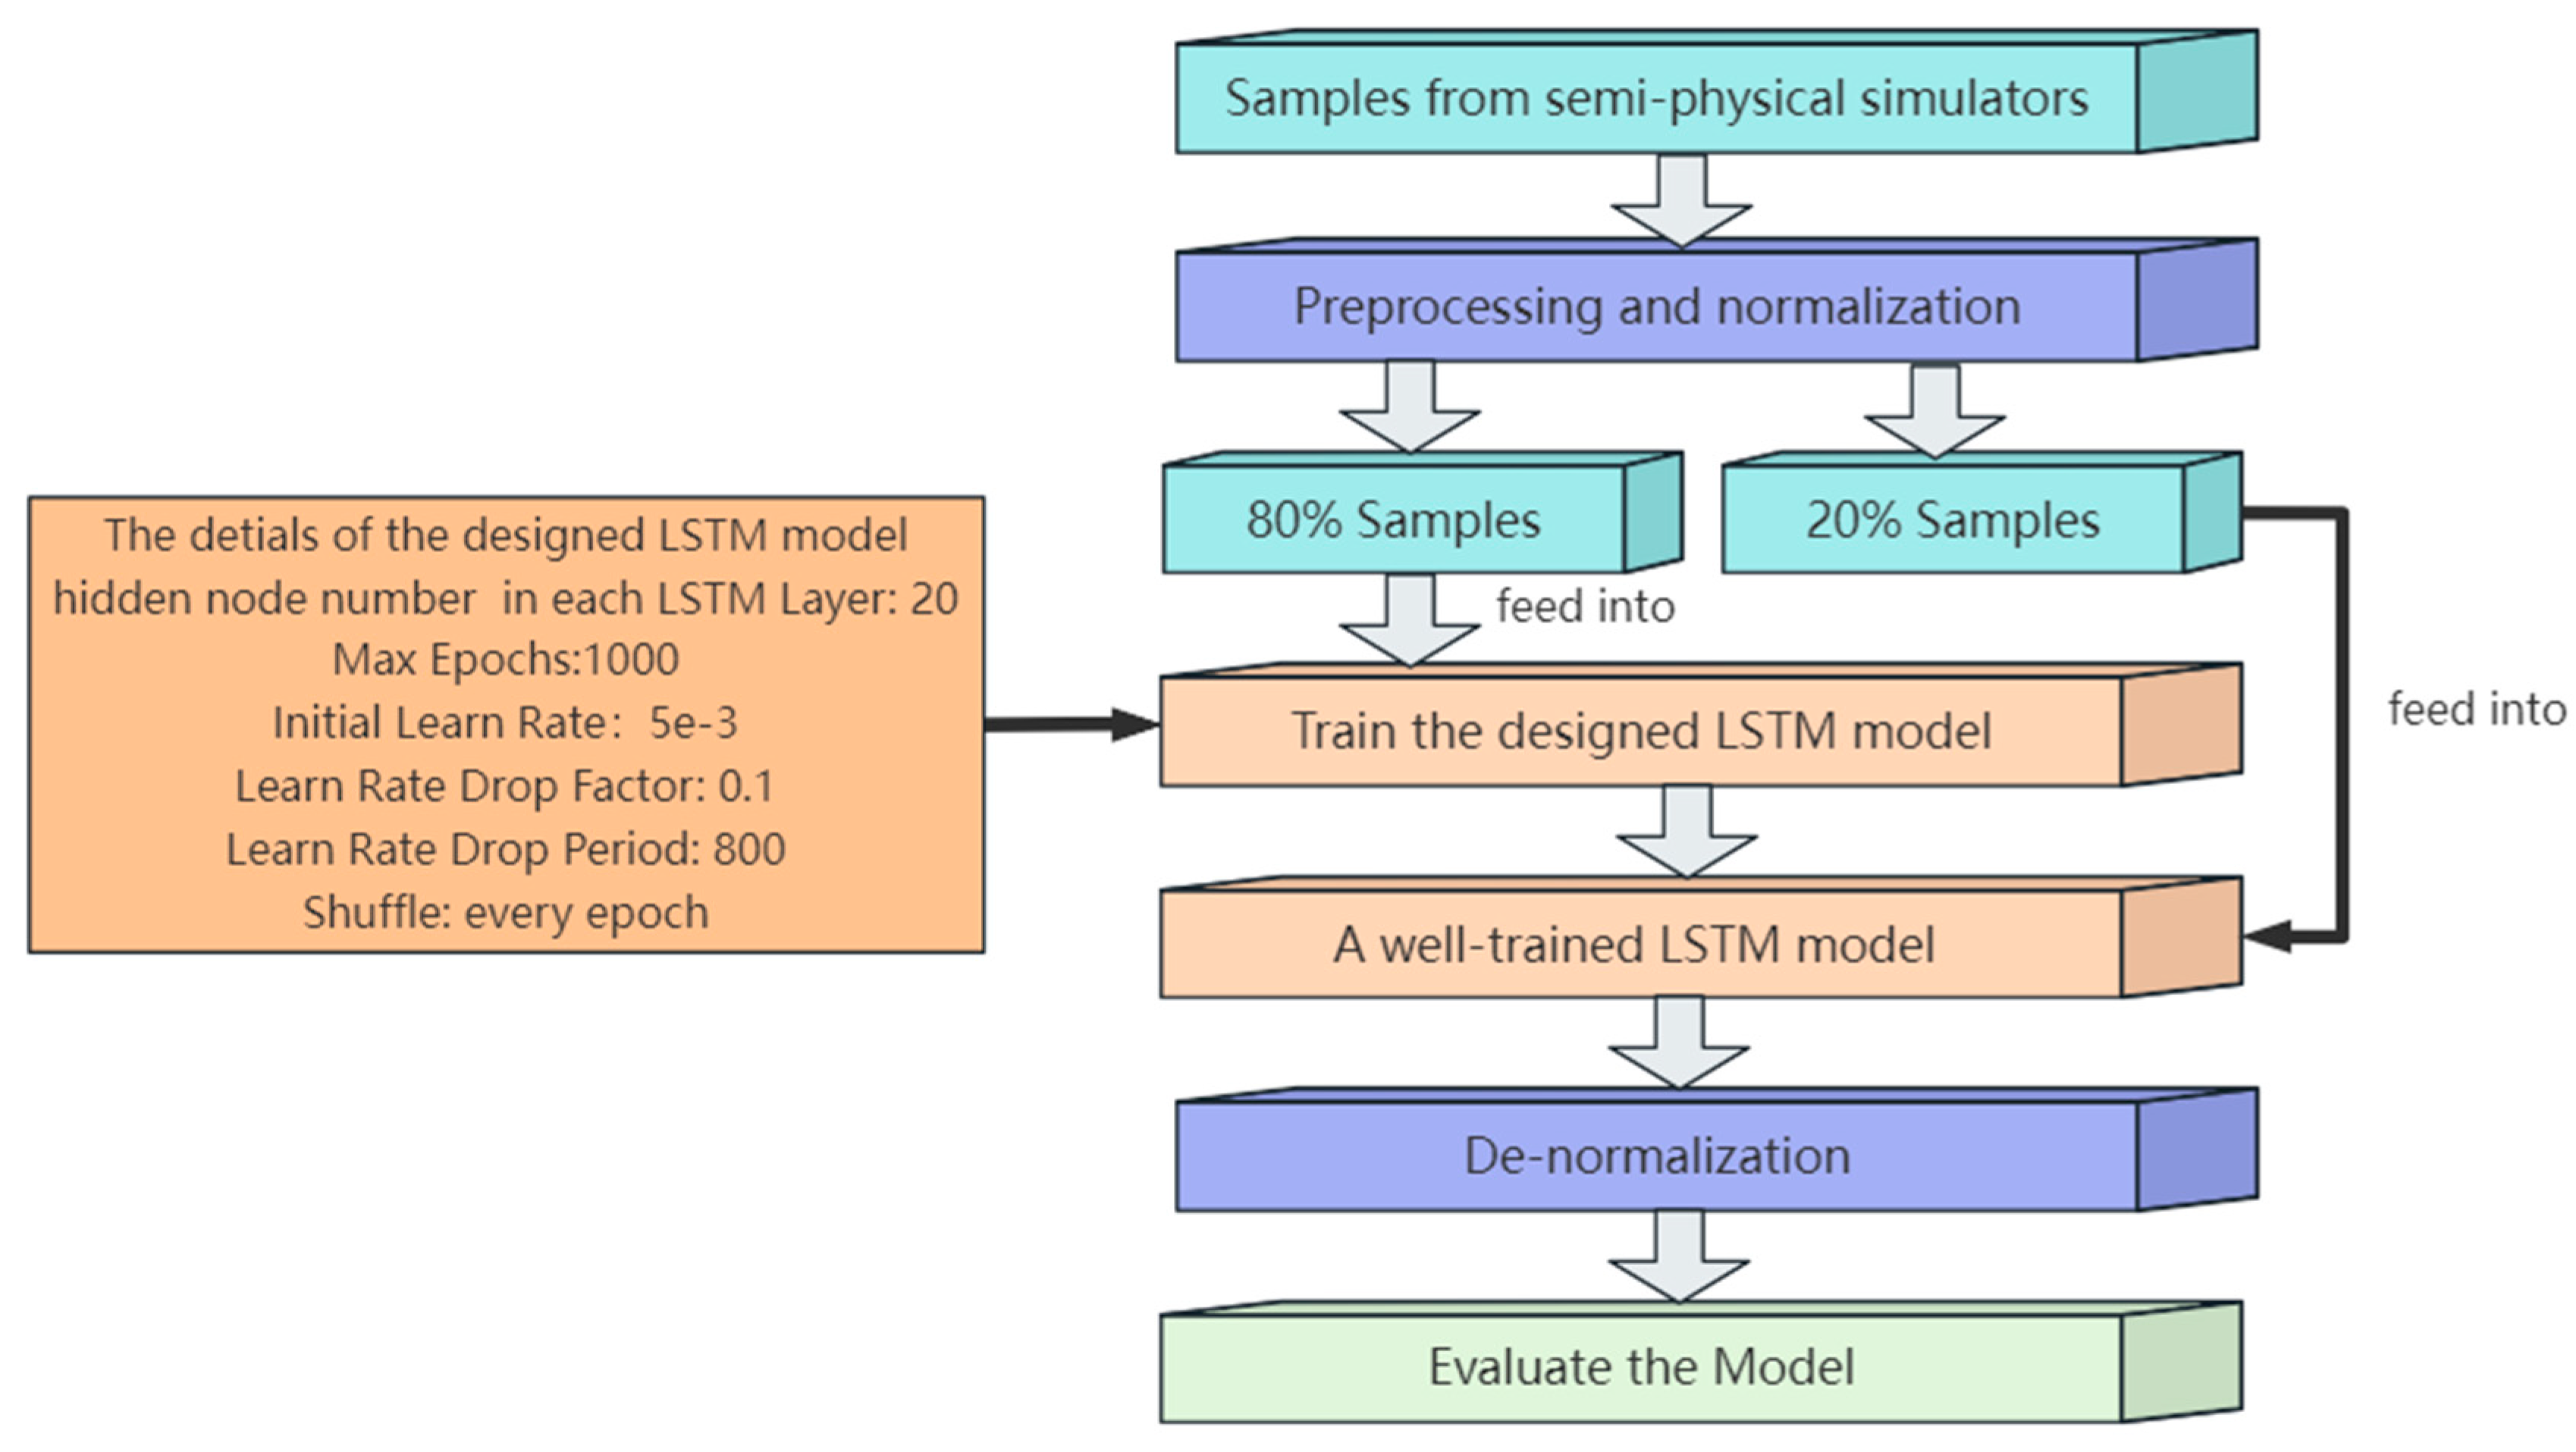
Figure 9.
The way of (not) disordering the time sequence.
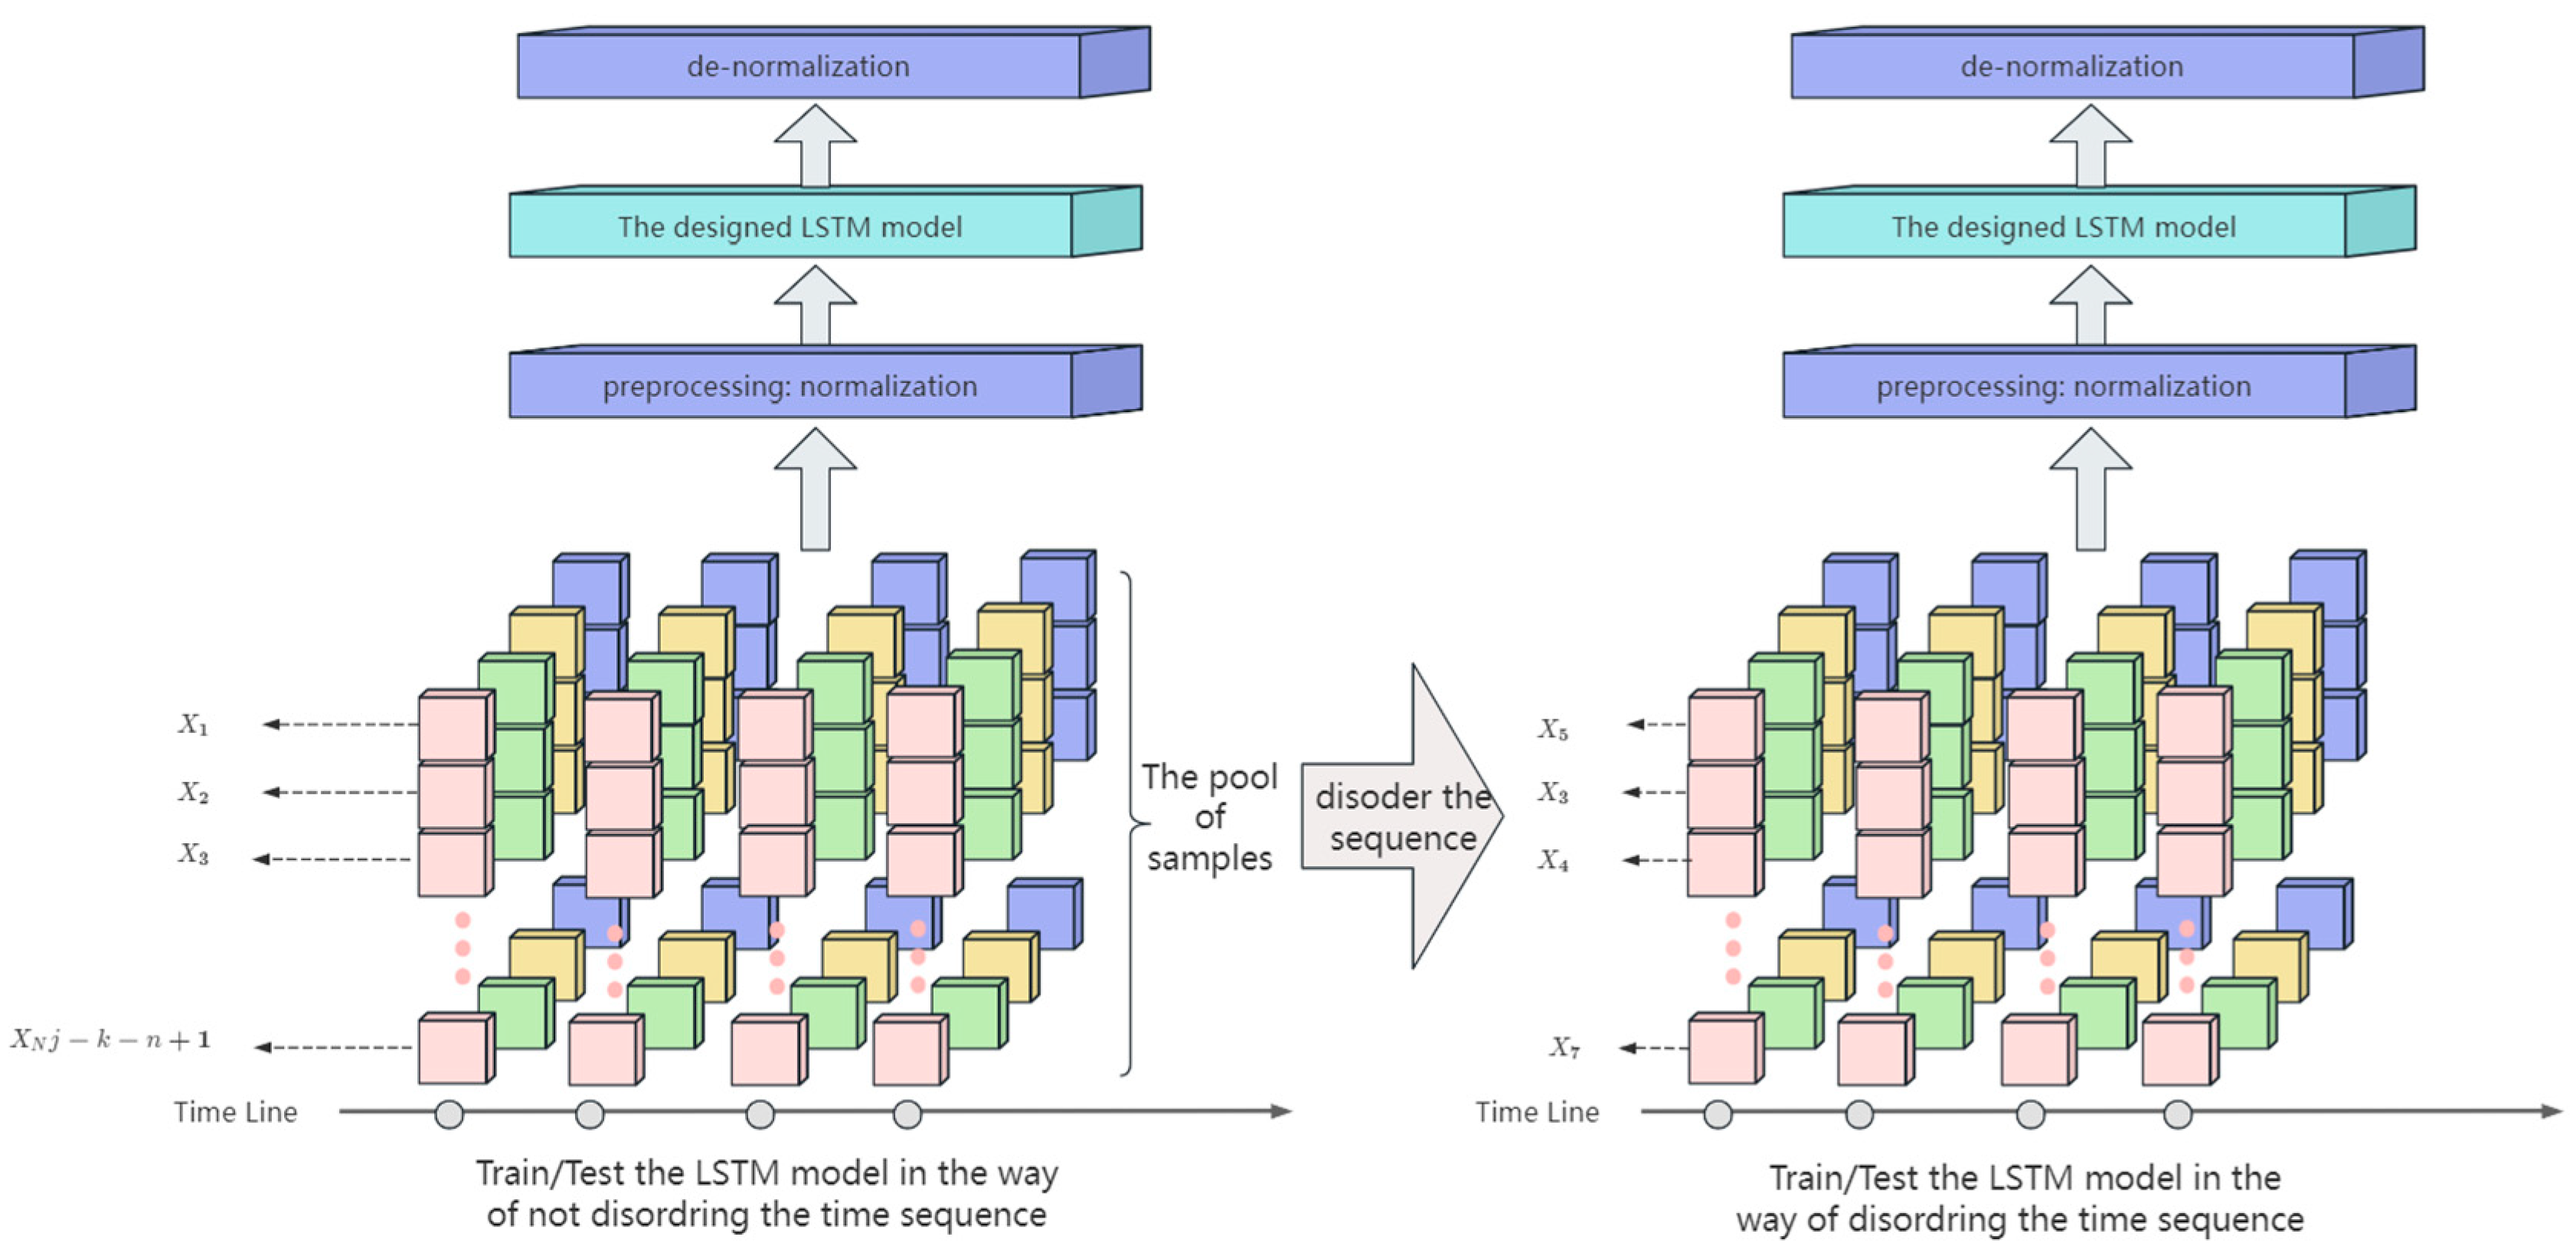
Figure 10.
Prediction results in (a) training and (b) the test set under Strategy 1. Prediction results in (c) training and (d) test set under Strategy 2.
Figure 10.
Prediction results in (a) training and (b) the test set under Strategy 1. Prediction results in (c) training and (d) test set under Strategy 2.
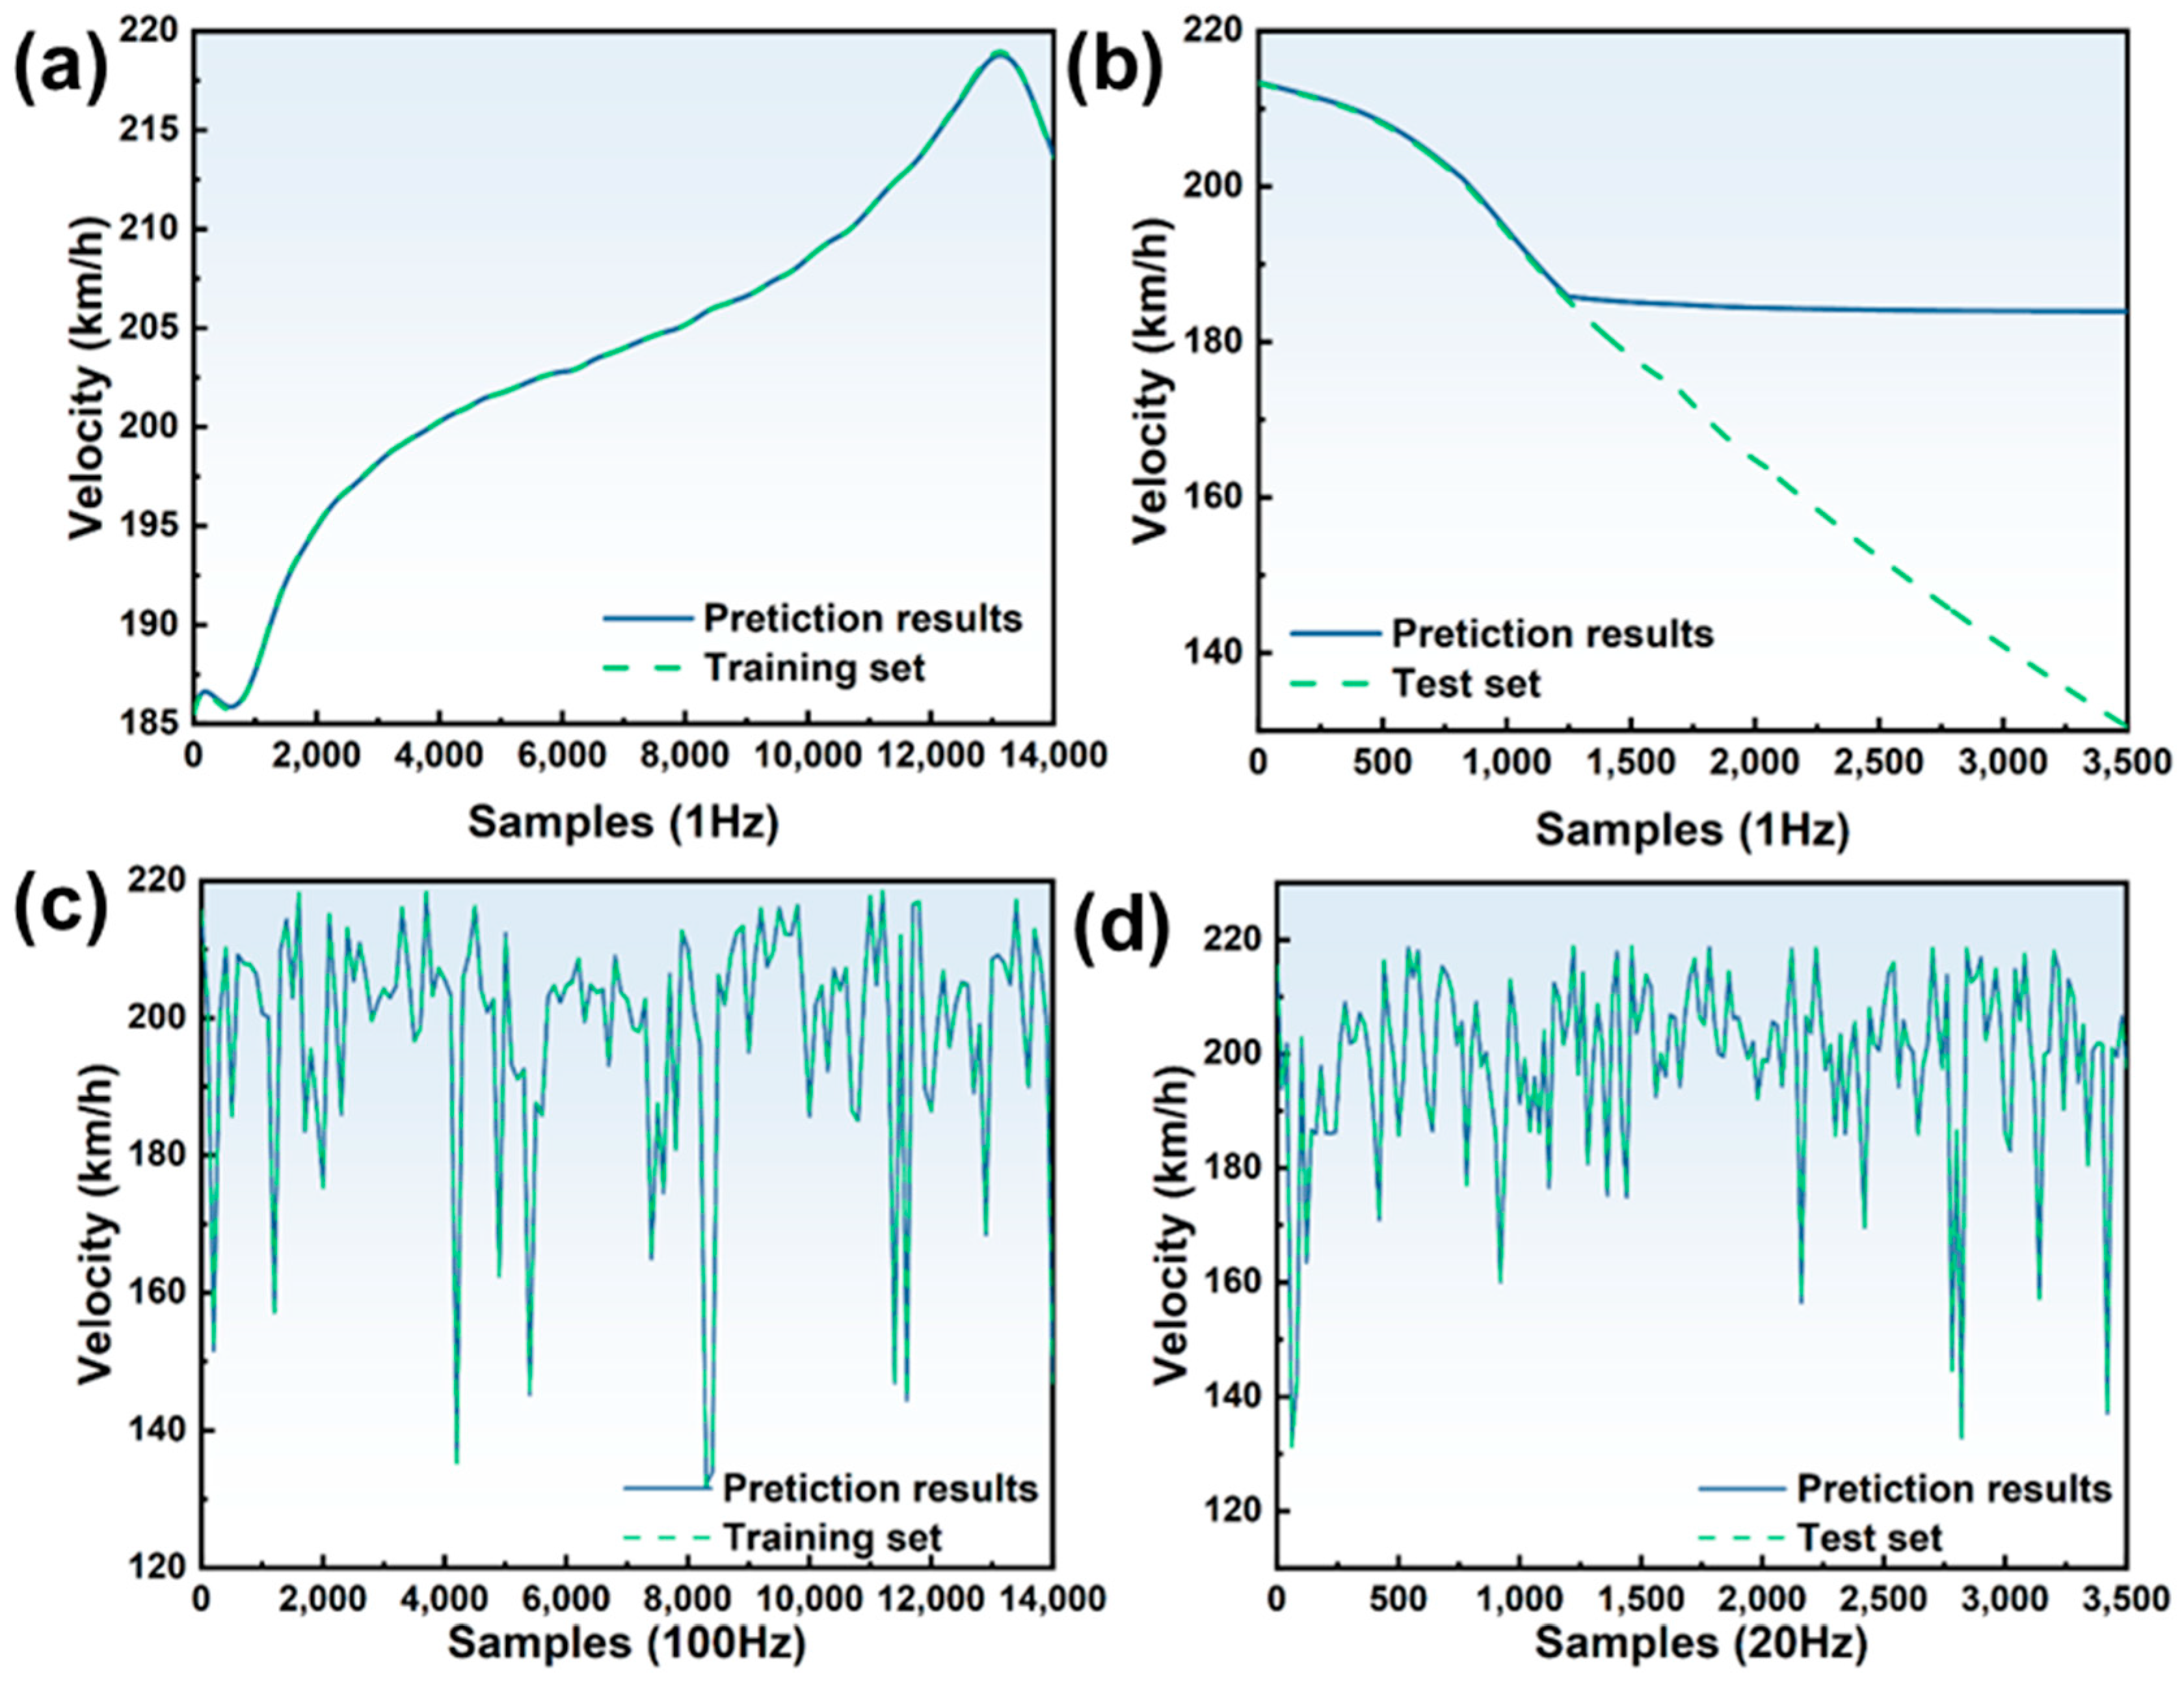
Figure 11.
Prediction results in (a) training and (b) test set under Strategy 3, those in (c) training and (d) test set under Strategy 4, and those in (e) training and (f) test set under Strategy 5.
Figure 11.
Prediction results in (a) training and (b) test set under Strategy 3, those in (c) training and (d) test set under Strategy 4, and those in (e) training and (f) test set under Strategy 5.
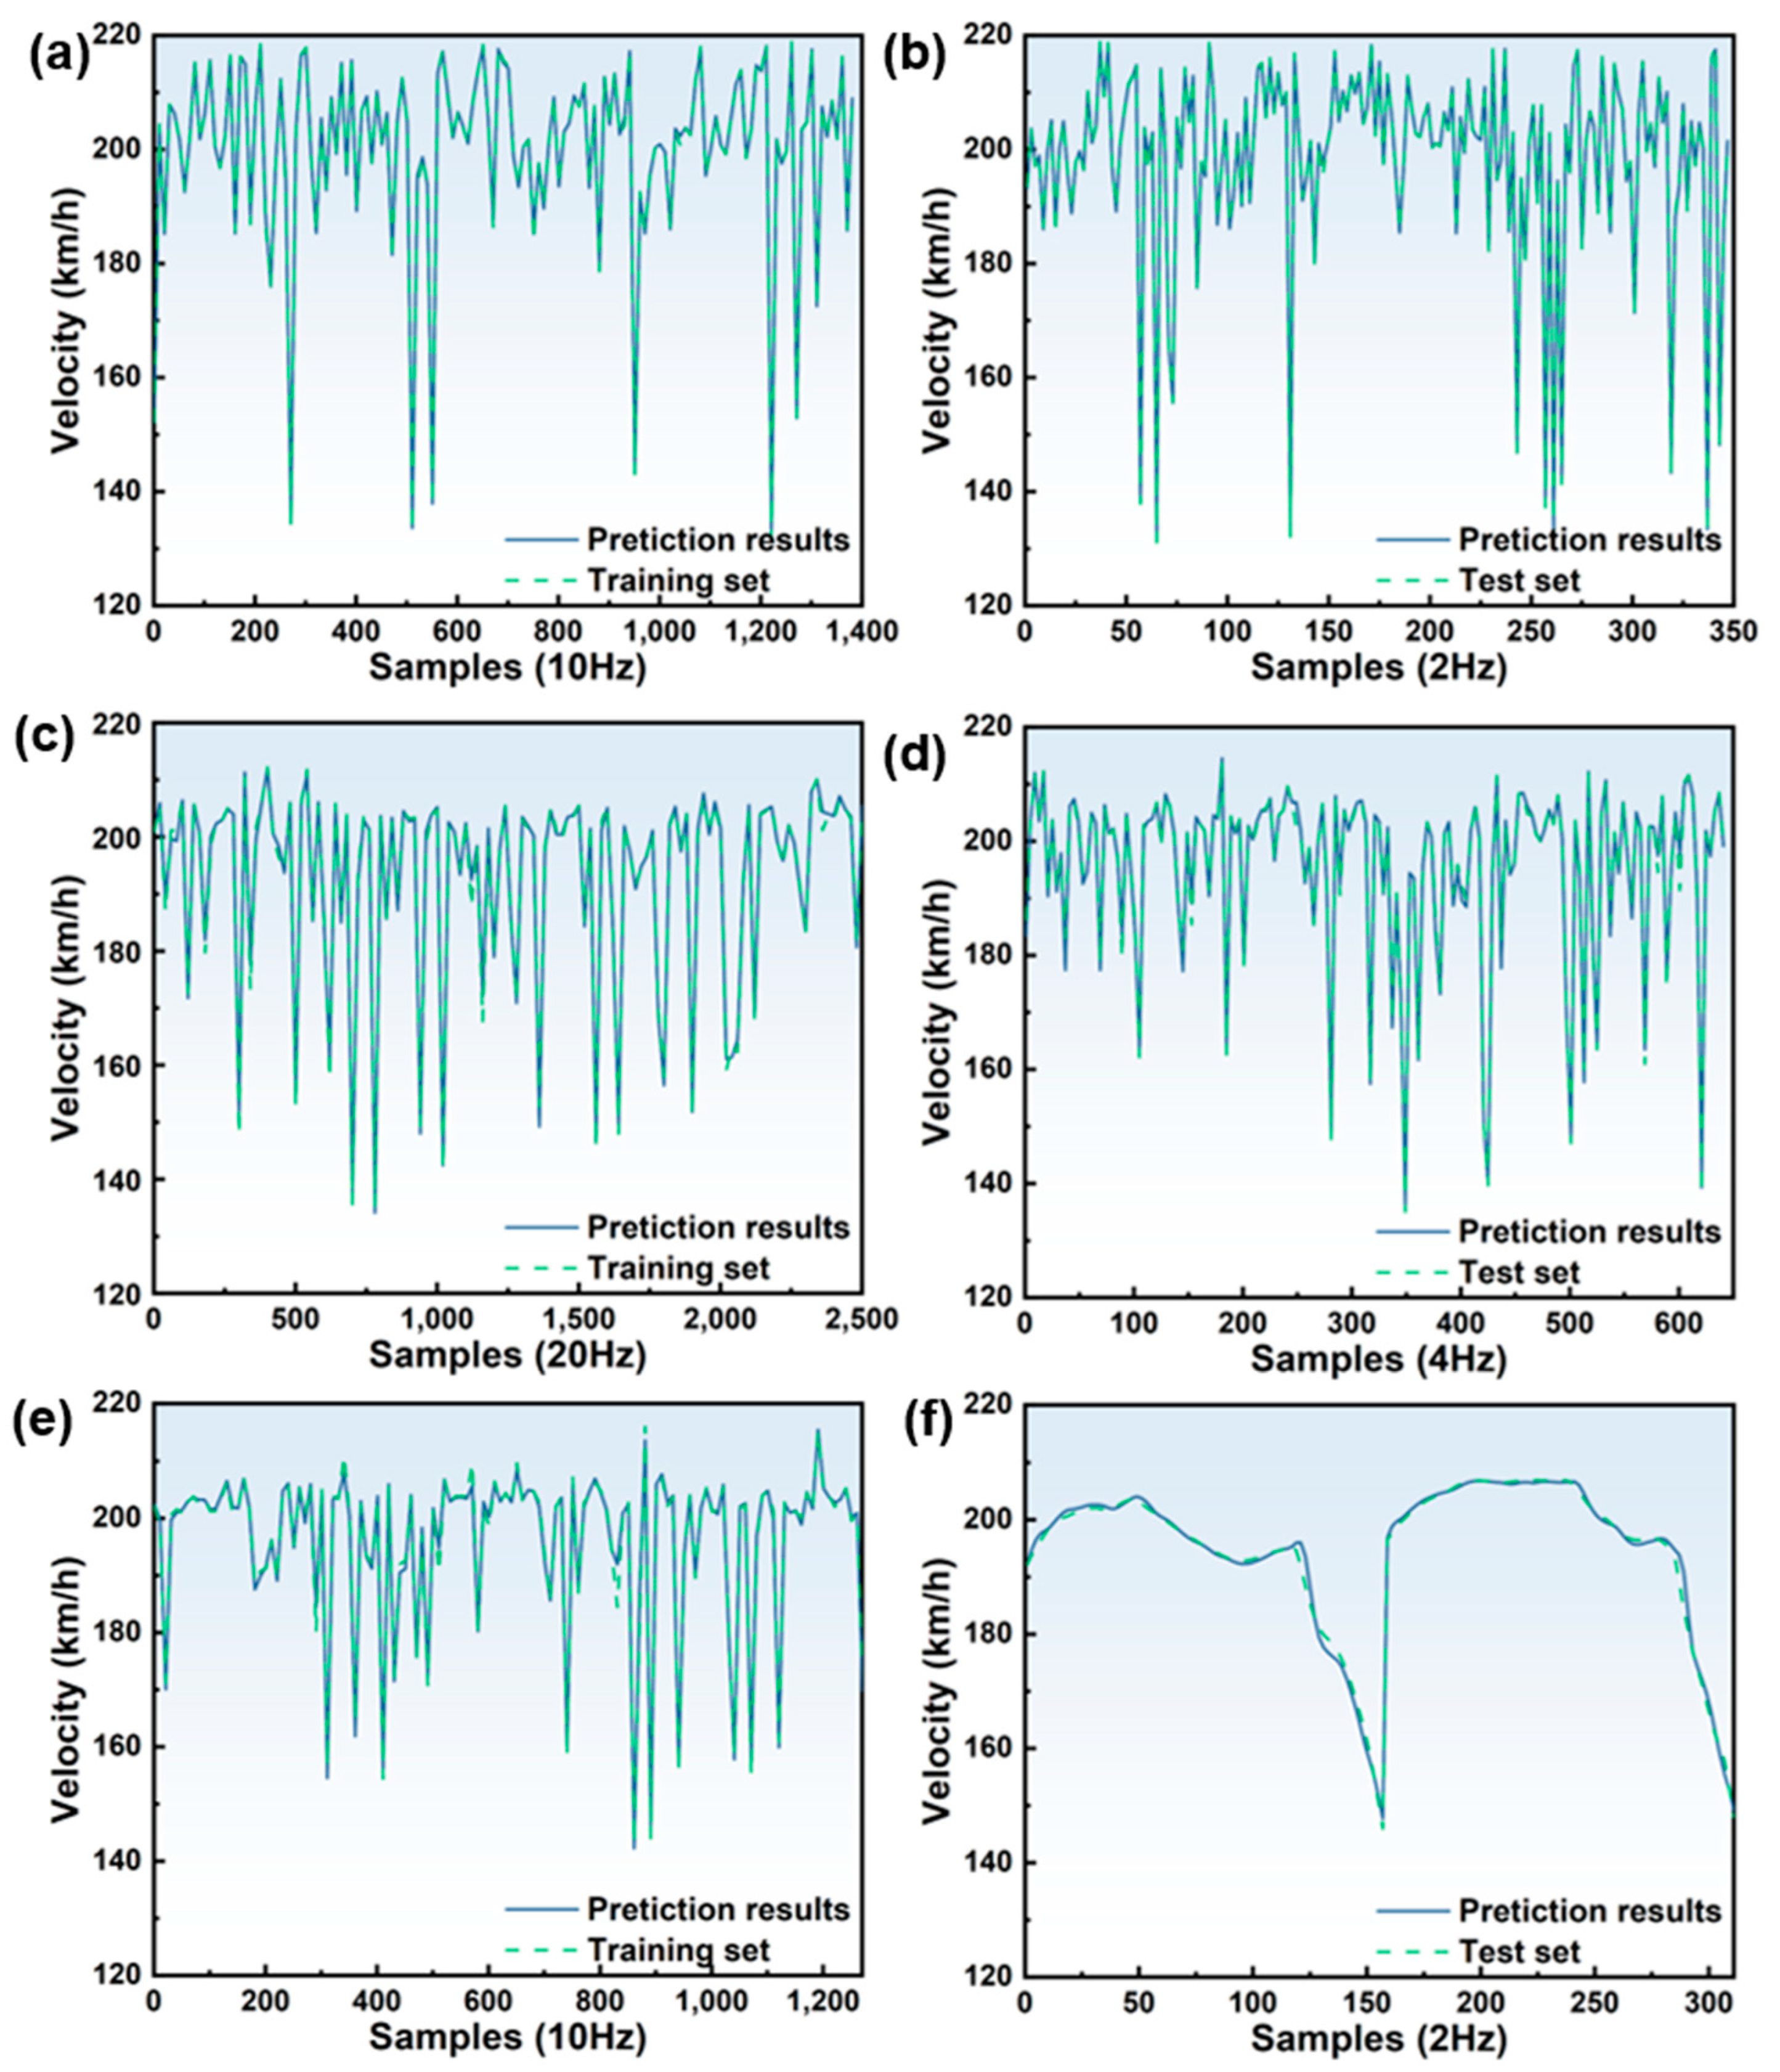
Figure 12.
Prediction results in (a) training and (b) test set under Strategy 6, prediction of the altitude in (c) training and (d) test set under Strategy 6, and prediction of the glide angle in (e) training and (f) test set under Strategy 6.
Figure 12.
Prediction results in (a) training and (b) test set under Strategy 6, prediction of the altitude in (c) training and (d) test set under Strategy 6, and prediction of the glide angle in (e) training and (f) test set under Strategy 6.

Figure 13.
Training progress for predicting (a) velocity, (b) altitude and (c) glide angle under Strategy 6.
Figure 13.
Training progress for predicting (a) velocity, (b) altitude and (c) glide angle under Strategy 6.

Table 1.
Summary of research results representing the aircraft energy state.
| Energy State Indicators in the Approach and Landing Phase | Sources of the Literature |
|---|---|
| Velocity deviation, glide path deviation, descent rate | Flight Safety Foundation (FSF) [8] |
| Velocity criterion for identifying low kinetic energy and slip deviation criterion for identifying low potential energy | From the airworthiness regulatory requirements [10] |
| Velocity and altitude | Aircraft mode and energy state prediction, assessment as well as alerting [11] |
| Velocity deviation and glide path deviation | Robust autopilot design for landing a large civil aircraft in crosswind [12] |
| Nominal profile deviation and data analysis; data comes from the high-fidelity simulation model and aircraft operation data | CCAR approach and landing procedure of large transport civil aircraft [36,37] |
| Kinetic energy, potential energy, total energy, and their rate of change | Energy-based metrics for safety analysis of general aviation operations [9] |
Table 2.
Speed limit values of different wind directions.
| Crosswind | 25 knots (13 m/s, 46 km/h, indicated airspeed) |
| Upwind | 40 knots (20 m/s, 74 km/h, indicated airspeed) |
| Downwind | 20 knots (10 m/s, 37 km/h, indicated airspeed) |
Table 3.
Velocity prediction quality of LSTM under different learning and test strategies.
| Strategy | Strategy Parameter | Indices of Model Quality | LSTM Method | VAR Method | ||
|---|---|---|---|---|---|---|
| Training Set | Test Set | Training Set | Test Set | |||
| 1 | n = 20, k = 1, Δt = 0.01 | R2 | 0.999960 | 0.038281 | 0.919961 | 0.025812 |
| MAE | 0.033427 | 18.30630 | 0.145758 | 20.67242 | ||
| MBE | −0.011397 | 18.30630 | −0.282941 | 21.28936 | ||
| 2 | n = 20, k = 1, Δt = 0.01 | R2 | 0.999950 | 0.999950 | 0.899952 | 0.889947 |
| MAE | 0.091720 | 0.092625 | 0.275299 | 0.296551 | ||
| MBE | 0.018886 | 0.015178 | 0.129375 | 0.121329 | ||
| 3 | n = 20, k = 1, Δt = 0.1 | R2 | 0.999400 | 0.999290 | 0.909424 | 0.899261 |
| MAE | 0.288590 | 0.291230 | 0.702818 | 0.728703 | ||
| MBE | −0.006848 | 0.003985 | 0.306001 | 0.405864 | ||
| 4 | n = 20, k = 3, Δt = 1 | R2 | 0.994890 | 0.994030 | 0.894941 | 0.883791 |
| MAE | 0.763620 | 0.771280 | 4.723623 | 4.326705 | ||
| MBE | 0.128520 | 0.109820 | 0.810808 | 0.824212 | ||
| 5 | n = 20, k = 3, Δt = 1 | R2 | 0.993760 | 0.992720 | 0.914259 | 0.912721 |
| MAE | 0.840780 | 0.737380 | 1.958741 | 1.984753 | ||
| MBE | 0.141060 | 0.134040 | 0.329649 | 0.362082 | ||
| 6 | n = 20, k = 3, Δt = 1 | R2 | 0.986040 | 0.989760 | 0.956179 | 0.939248 |
| MAE | 1.373400 | 1.803200 | 1.904735 | 2.611392 | ||
| MBE | 0.126260 | −0.083124 | 0.318684 | 0.264489 | ||
Table 4.
Quantification of model effects (predicted height and glide angle).
| Indices for Predicting Energy State | Prediction Strategy Parameter | Indices of Model Quality | LSTM Method | VAR Method | ||
|---|---|---|---|---|---|---|
| Training Set | Test Set | Training Set | Test Set | |||
| Altitude | n = 20, k = 3, Δt = 1 | R2 | 0.998840 | 0.999220 | 0.938909 | 0.939149 |
| MAE | 3.261000 | 2.659300 | 4.065346 | 3.939079 | ||
| MBE | 1.348400 | 0.815020 | 2.294469 | 1.363921 | ||
| Glide angle | n = 20, k = 3, Δt = 1 | R2 | 0.8476 | 0.85117 | 0.695124 | 0.712240 |
| MAE | 1.178 | 1.3524 | 2.178762 | 2.379448 | ||
| MBE | 0.35965 | 0.23721 | 0.499659 | 0.521442 | ||
Disclaimer/Publisher’s Note: The statements, opinions and data contained in all publications are solely those of the individual author(s) and contributor(s) and not of MDPI and/or the editor(s). MDPI and/or the editor(s) disclaim responsibility for any injury to people or property resulting from any ideas, methods, instructions or products referred to in the content. |
© 2024 by the authors. Licensee MDPI, Basel, Switzerland. This article is an open access article distributed under the terms and conditions of the Creative Commons Attribution (CC BY) license (https://creativecommons.org/licenses/by/4.0/).
Share and Cite
MDPI and ACS Style
Hu, Y.; Yan, J.; Cao, E.; Yu, Y.; Tian, H.; Huang, H. Approach and Landing Energy Prediction Based on a Long Short-Term Memory Model. Aerospace 2024, 11, 226. https://doi.org/10.3390/aerospace11030226
AMA Style
Hu Y, Yan J, Cao E, Yu Y, Tian H, Huang H. Approach and Landing Energy Prediction Based on a Long Short-Term Memory Model. Aerospace. 2024; 11(3):226. https://doi.org/10.3390/aerospace11030226
Chicago/Turabian StyleHu, Yahui, Jiaqi Yan, Ertai Cao, Yimeng Yu, Haiming Tian, and Heyuan Huang. 2024. "Approach and Landing Energy Prediction Based on a Long Short-Term Memory Model" Aerospace 11, no. 3: 226. https://doi.org/10.3390/aerospace11030226
Note that from the first issue of 2016, this journal uses article numbers instead of page numbers. See further details here.