
Observation of Oblique Laser-Supported Detonation Wave Propagating in Atmospheric Air

1
Department of Space Systems Engineering, Kyushu Institute of Technology, Fukuoka 804-8550, Japan
2
Department of Aeronautics and Astronautics, The University of Tokyo, Tokyo 113-8656, Japan
3
Department of Advanced Energy, The University of Tokyo, Chiba 277-8561, Japan
*
Author to whom correspondence should be addressed.
Aerospace 2024, 11(4), 327; https://doi.org/10.3390/aerospace11040327
Submission received: 29 February 2024
/
Revised: 14 April 2024
/
Accepted: 16 April 2024
/
Published: 22 April 2024
(This article belongs to the Special Issue Laser Propulsion Science and Technology)
Abstract
:Elucidation of the propagation velocity of a laser-supported detonation (LSD) wave and its propagation mechanism is necessary for various engineering applications. This study was conducted to observe an oblique laser-supported detonation wave off the laser axis. The relation between the local laser intensity and detonation-wave propagation velocity was investigated. For this purpose, the time-space distribution of the laser intensity was measured precisely. The change of the LSD wavefront shape was visualized using an ultrahigh-speed camera. The relation between the local laser intensity and the propagation velocity of the oblique LSD wave measured off the laser axis was found to be identical to the relation between the local laser intensity and the detonation propagation velocity at the laser axis.
1. Introduction
Laser-induced discharge and its accompanying blast wave has been an interesting subject for aeronautical and astronautical engineering applications [1,2,3,4]. When an incident laser intensity exceeds a certain threshold, such as 1012–1013 W/m2, an ionization front propagates with an attached shock wave in a direction opposite to the laser beam irradiation [1]. This phenomenon is known as laser-supported detonation (LSD). However, when the laser intensity is not sufficiently high to induce the LSD wave, a shock wave precedes an ionization wave and propagates separately. This phenomenon is designated laser-supported combustion (LSC). In the LSD regime, because the laser energy is converted efficiently to blast-wave energy, several studies have been conducted to ascertain its energy conversion efficiency [5,6,7], termination threshold [7,8,9,10], and plasma property with plasma diagnostics [11,12].
The relation between the LSD propagation velocity and laser intensity is an important topic for ascertaining the propagation structure of LSD [13,14]. Several propagation models have been proposed. Raizer deduced the analytical propagation velocity using hydrodynamic equation, which is an analog to Chapman–Jouguet (C–J) detonation. The velocity is proportional to the cubic root of the laser intensity, irrespective of the gaseous species [15]. Additionally, Raizer discussed another model by which ultraviolet radiation from bulk plasma generates seed electrons ahead of the ionization front via the photoionization effect. The precursor, consisting of photoelectrons, plays a role of initiating laser absorption [15].
To validate the propagation model and to elucidate the LSD mechanism, comparison with experimental data is necessary. As presented in Figure 1, however, depending on the study, the relations between propagation velocity and laser intensity mutually differ [7,10,16,17,18,19]. The difference in propagation velocity trends is regarded as attributable to the two-dimensional effects of focusing optics, such as the beam quality factor, beam waist, and f-number. These parameters determine the plasma size and affect the lateral enthalpy dissipation, which in turn affects the propagation velocity and termination condition [15]. This two-dimensional effect has been observed by experimentation in several studies. Mori et al. investigated f-number effects on the termination condition and expressed the laser intensity of the termination as a function of the f-number [6]. Ushio et al. observed line-focused LSD with and without confinement to compare the effects of lateral expansion. Results showed that the propagation velocity with confinement was higher than that without confinement [7]. To eliminate two-dimensional effects, Matsui et al. used focusing optics with sufficiently large beam diameters and f-numbers. With focusing optics, the velocity is determined uniquely by the laser intensity [20]. Shimano et al. reported gas-species effects on the propagation velocity with sufficiently large beam diameters. The velocities in argon, helium, and air have mutually differing tendencies in terms of laser intensity [21].
As described above, the propagation velocity dependence on laser intensity is necessary for validation using the calculation model. However, some studies have relied on evaluation using the average laser intensity, whereas others have relied on evaluation using the peak laser intensity. Figure 2 portrays a typical image of the ionization front of the LSD wave. The wavefront forms a bow shape, which suggests that the spatial distribution of laser intensity affects the formation of the structure. An earlier study by the authors [20] evaluated the propagation velocity with a large beam diameter and f-number with the averaged laser intensity. For this study, we investigated the dependence of local propagation velocity on local laser intensity by considering the laser intensity profile. Also, we evaluated the local propagation velocity as the velocity in the direction normal to the wavefront, similarly to analysis of oblique detonation of chemical explosives. Oblique detonation is observed around a hypersonic projectile in a detonative gas [22,23]. The propagation velocity of oblique detonation is found using the C–J velocity. The wavefront angle is expressed as the ratio of the C–J velocity to the projectile velocity. After calculating the wavefront angle as taken by a high-speed camera with high resolution, we used the laser intensity profile to elucidate the relation between the local propagation velocity of oblique laser-supported detonation and the local laser intensity.
2. Measurement of the Laser Intensity Distribution
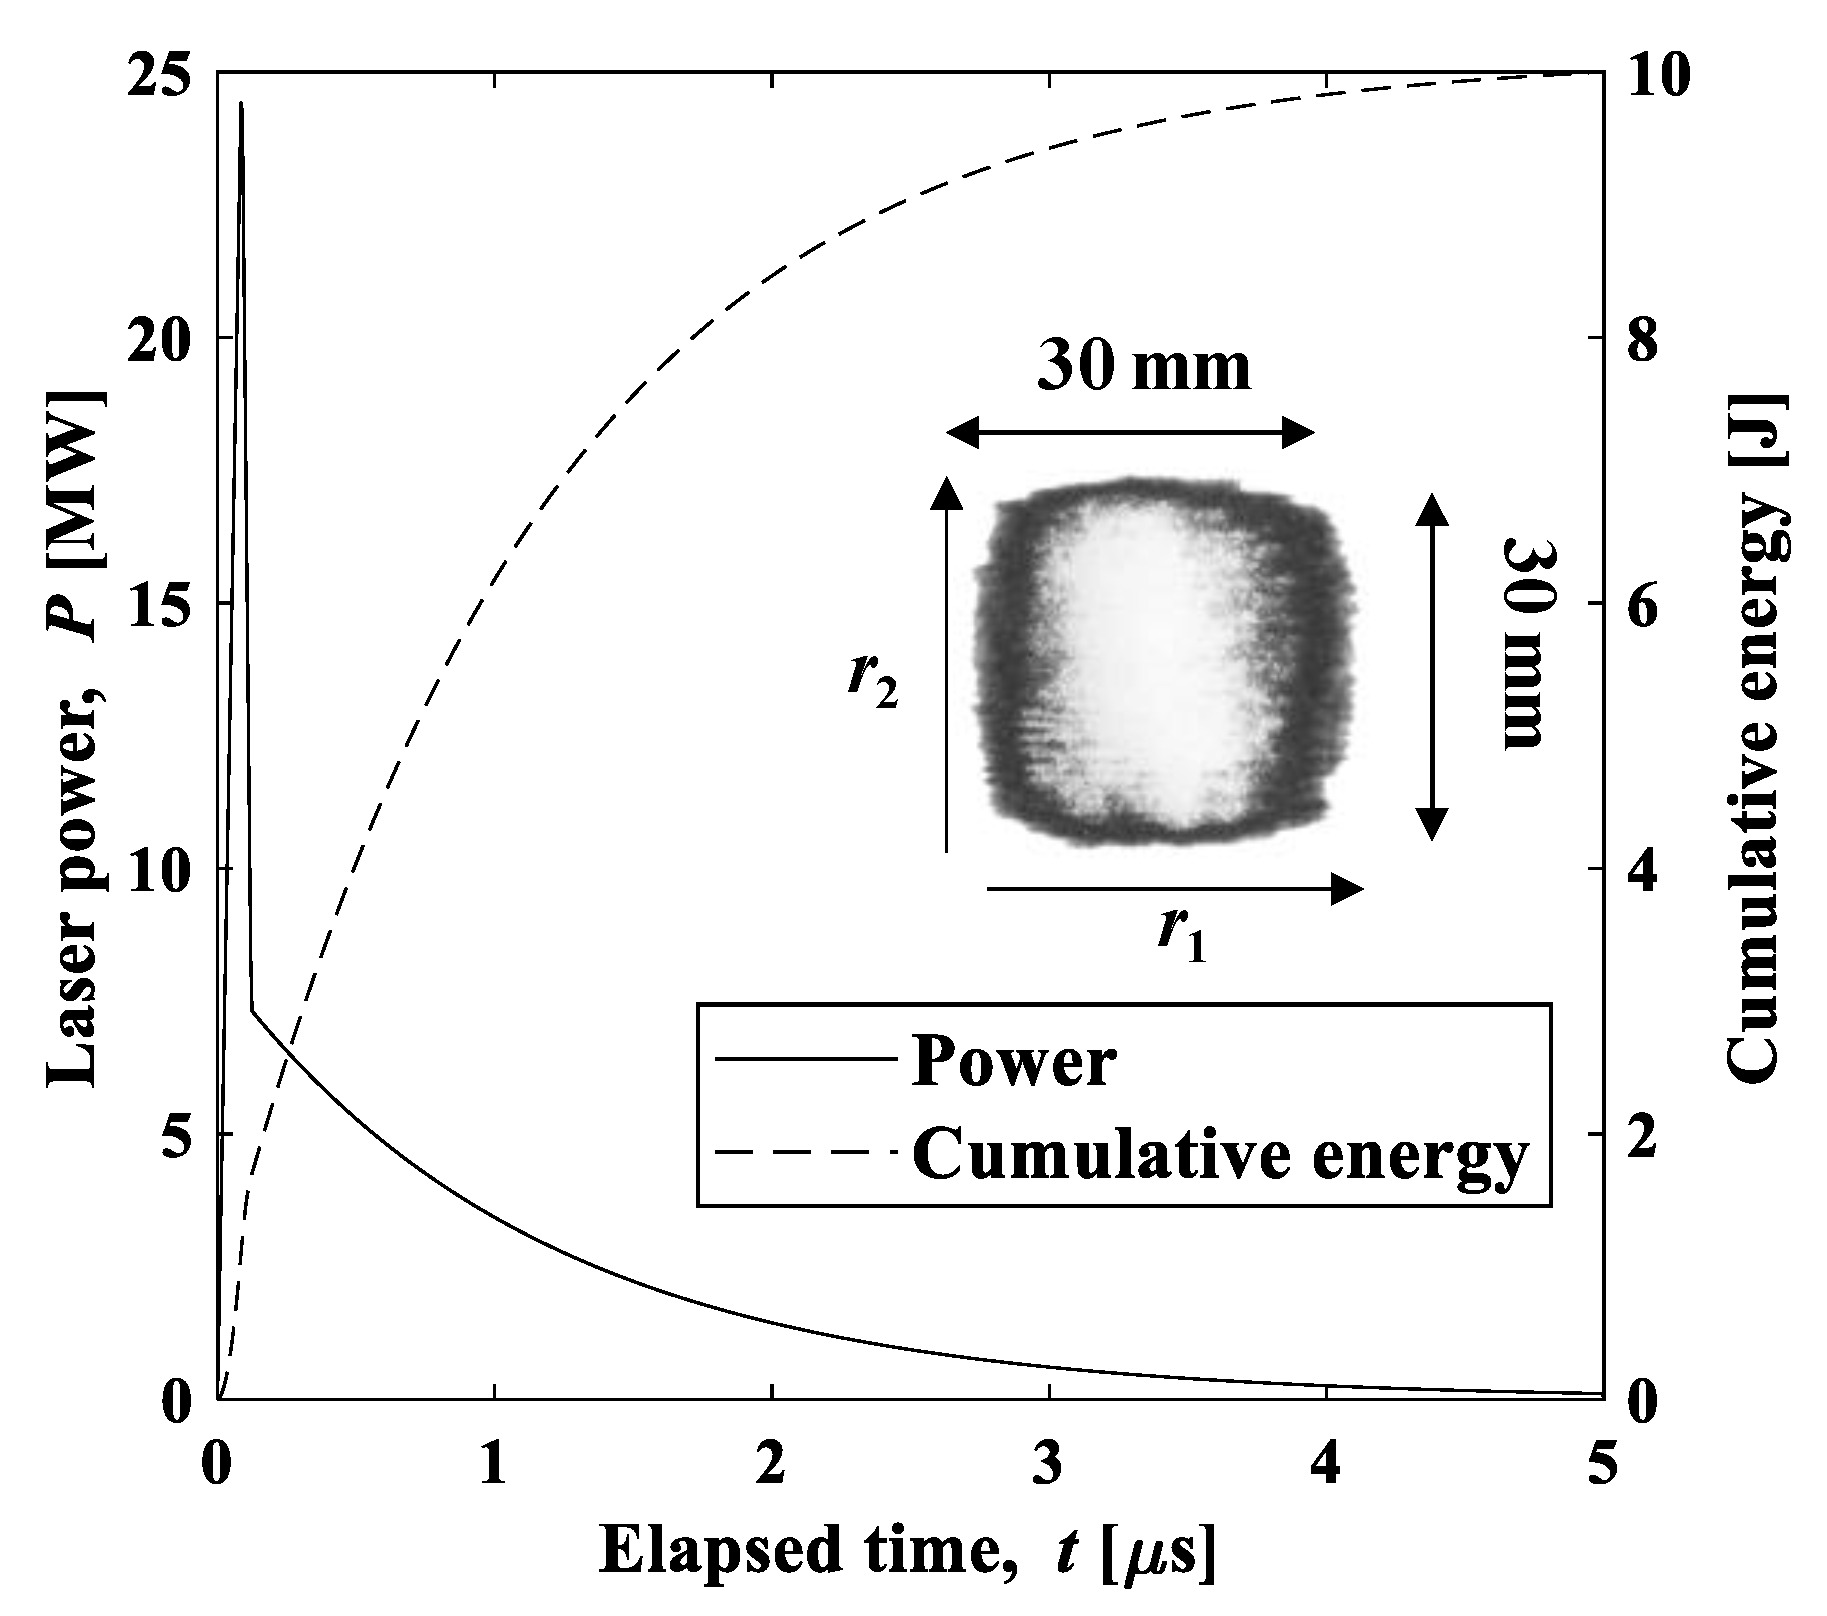
A laser-induced discharge is produced using a Transversely Excited Atmospheric (TEA) CO2 laser with typical maximum pulse energy and wavelength of 10 J/pulse and 10.6 μm, respectively. The laser energy deviation was ±5% before and after the experiment. The laser power profile is measured with a photon-drag detector (B749, Hamamatsu photonics). The FWHM of the spike of the profile was 0.12 + 0.02 μs. The historical profile of power and cumulative energy is depicted in Figure 3. The laser beam cross-section before focusing was a 30 mm × 30 mm rectangular shape, with spatial intensity profiles of Gaussian in the horizontal direction and top-hat in the vertical direction. The direction for which the laser intensity profile of Gaussian is defined as r1, as depicted in Figure 3; that of top-hat is r2. Also, WG0 and WT0, respectively, stand for beam radii at the beam waist of Gaussian and the top-hat distribution. They are defined, respectively, as half-lengths of the region that includes 86% of the total beam power in each plane. The laser intensity has a non-axisymmetric distribution. This characteristic leads to the difference between the spot sizes at the beam waist of both directions. The equivalent beam diameter D is defined as shown below.
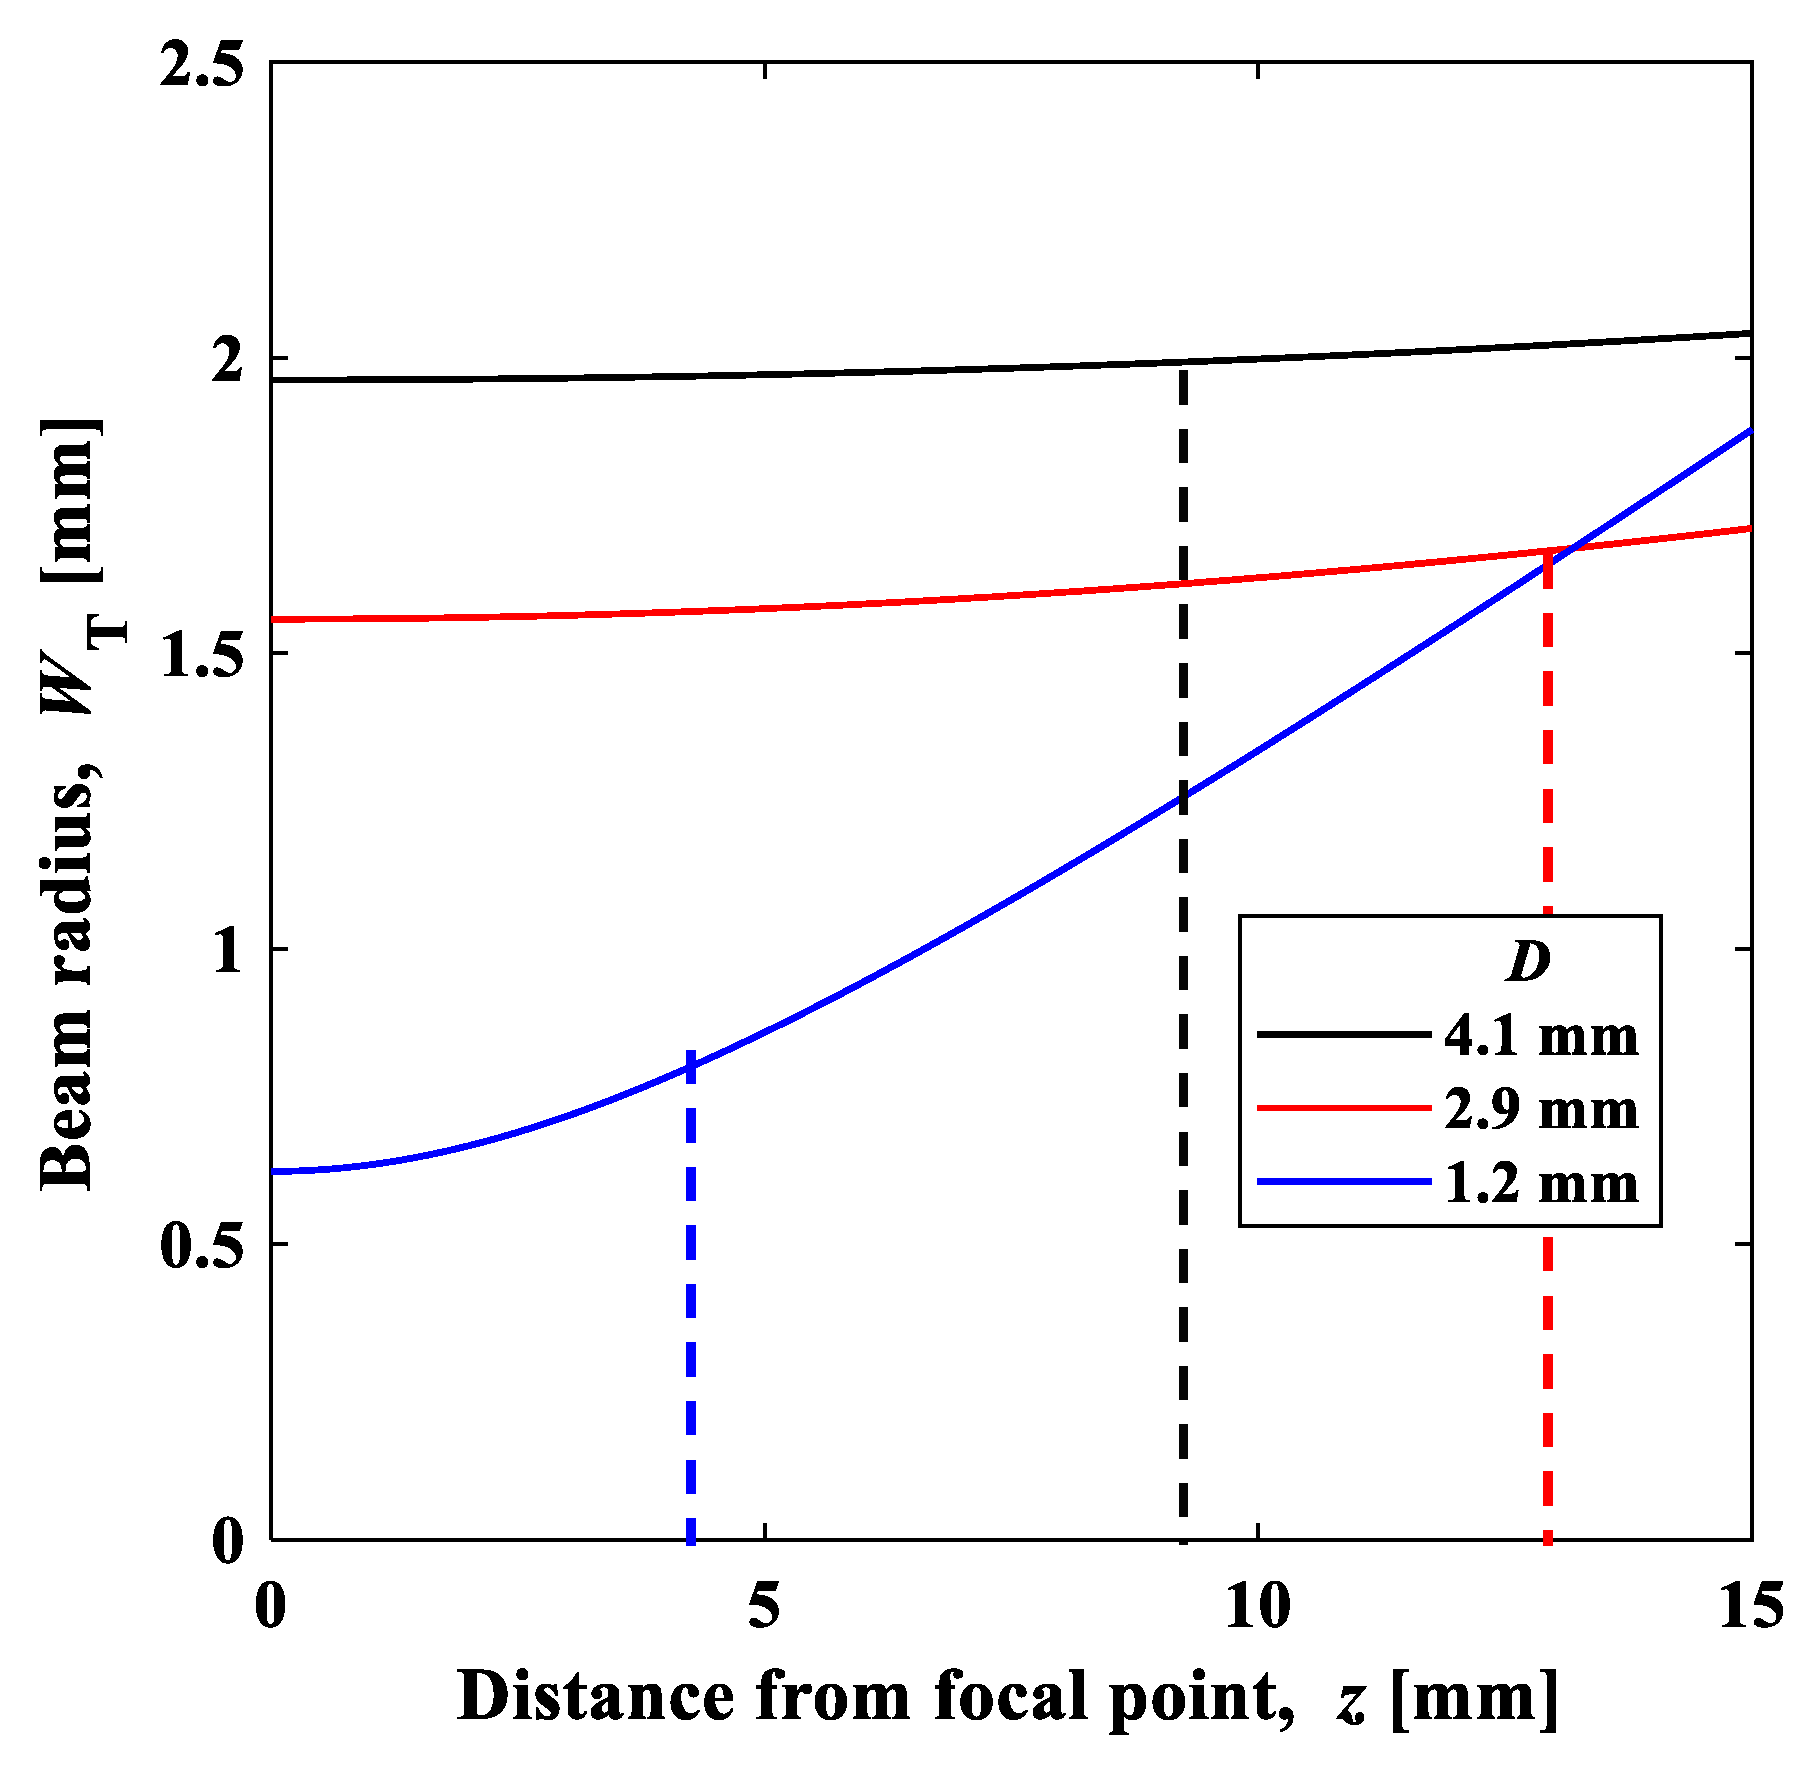
As portrayed in Figure 4, the laser beam is focused onto an aluminum plate to initiate breakdown by ZnSe lenses (f = 127 mm and 317.5 mm) or parabolic mirrors (f = 400 mm and 500 mm) for which the beam diameters at focus are, respectively, 1.2 mm (WG0 = 0.4 mm, WT0 = 0.6 mm), 2.9 mm (WG0 = 1.1 mm, WT0 = 1.6 mm) and 4.1 mm (WG0 = 1.7 mm, WT0 = 2.0 mm). Table 1 shows the focal length, F-number, beam radii at the beam waist, and the equivalent beam diameter of each focusing optics. Figure 5 shows the measured and fitted intensity profiles with D = 4.1 mm in the r1 and r2 directions for which the profiles are Gaussian and top-hat. The beam quality factors are found by measuring the intensity profile near the beam waist by ISO 11146 [24]. The beam quality factors are 15 and 21, respectively, in the r1 and r2 directions. Relation between beam radius in r2 direction and distance from beam waist of each focusing optics is shown in Figure 6.
3. Propagation Velocity of Laser-Supported Detonation along the Laser Axis
The ionization wave image was taken using a high-speed ICCD camera (512 × 512 pixel resolution, 10 ns minimum exposure time, Ultra8; DRS Hadland Ltd., Hertfordshire, UK), which can take eight images sequentially in each laser shot. To measure the propagation velocity in the direction normal to the wavefront, we used another high-speed camera (pixel resolution: 2560 × 2160, 3 ns minimum exposure time, iStar sCMOS; Andor Technology, Belfast, UK) because the wavefront shape must be captured with as high a resolution as possible. The exposure time was set to 10 ns in Ultra 8 and to 5 ns in iStar sCMOS. The shutter timing and laser pulse signal are synchronized using a pulse delay generator (DG 535; Stanford Research Systems Inc., Sunnyvale, CA, USA). The laser-induced plasma is projected to the camera via two lenses. Spatial resolution is 0.009 mm/pixel. All experiments were conducted in air at 1 atm pressure. Figure 7 presents the relation between the propagation velocity of an ionization front V and laser intensity Speak at the laser axis with various beam diameters. The propagation velocity was calculated from eight images per laser shot, and the plot was drawn by performing the experiment five times. Error bars indicate the standard error of the five data. With D ≥ 2.9 mm, the propagation velocity shows a unique tendency in terms of laser intensity, which is the same as earlier results. The beam diameter was measured more accurately than in previous studies conducted by the authors [21]. Also, the laser intensity is evaluated as the local laser intensity at the laser axis, with D = 1.2 mm. However, the propagation velocity trend differs from that of D ≥ 2.9 mm. Therefore, with D = 1.2 mm, the result suggests that two-dimensional energy dissipation affects the propagation velocity. The measured value is fitted using a power function. The results are and , respectively, with D ≥ 2.9 mm and D = 1.2 mm. Although this experiment is conducted in air as described above, evaluation using the Mach number is important for comparison with other gas species. Therefore, we normalized the propagation velocity by the speed of sound a as shown below.
The laser intensity is normalized using the Chapman–Jouguet velocity [15].
In that equation, and , respectively, represent the specific heat ratio behind the wavefront and the atmospheric density. The Mach number is obtained by dividing Equation (3) by the speed of sound.
Here, the Mach number is a function of laser intensity. We defined normalized laser intensity as
The speed of sound and atmospheric density are 347 m/s and 1.18 kg/m3, respectively, in the atmospheric conditions of 1 atm and 300 K. The functions for line 1 and line 2 are normalized and expressed using Equations (2) and (5) as shown below.
These fitted lines are depicted as line 1 and line 2 in Figure 7. The obtained relations are used in the next chapter for analysis of oblique detonation.
4. Propagation Velocity of Oblique Laser-Supported Detonation
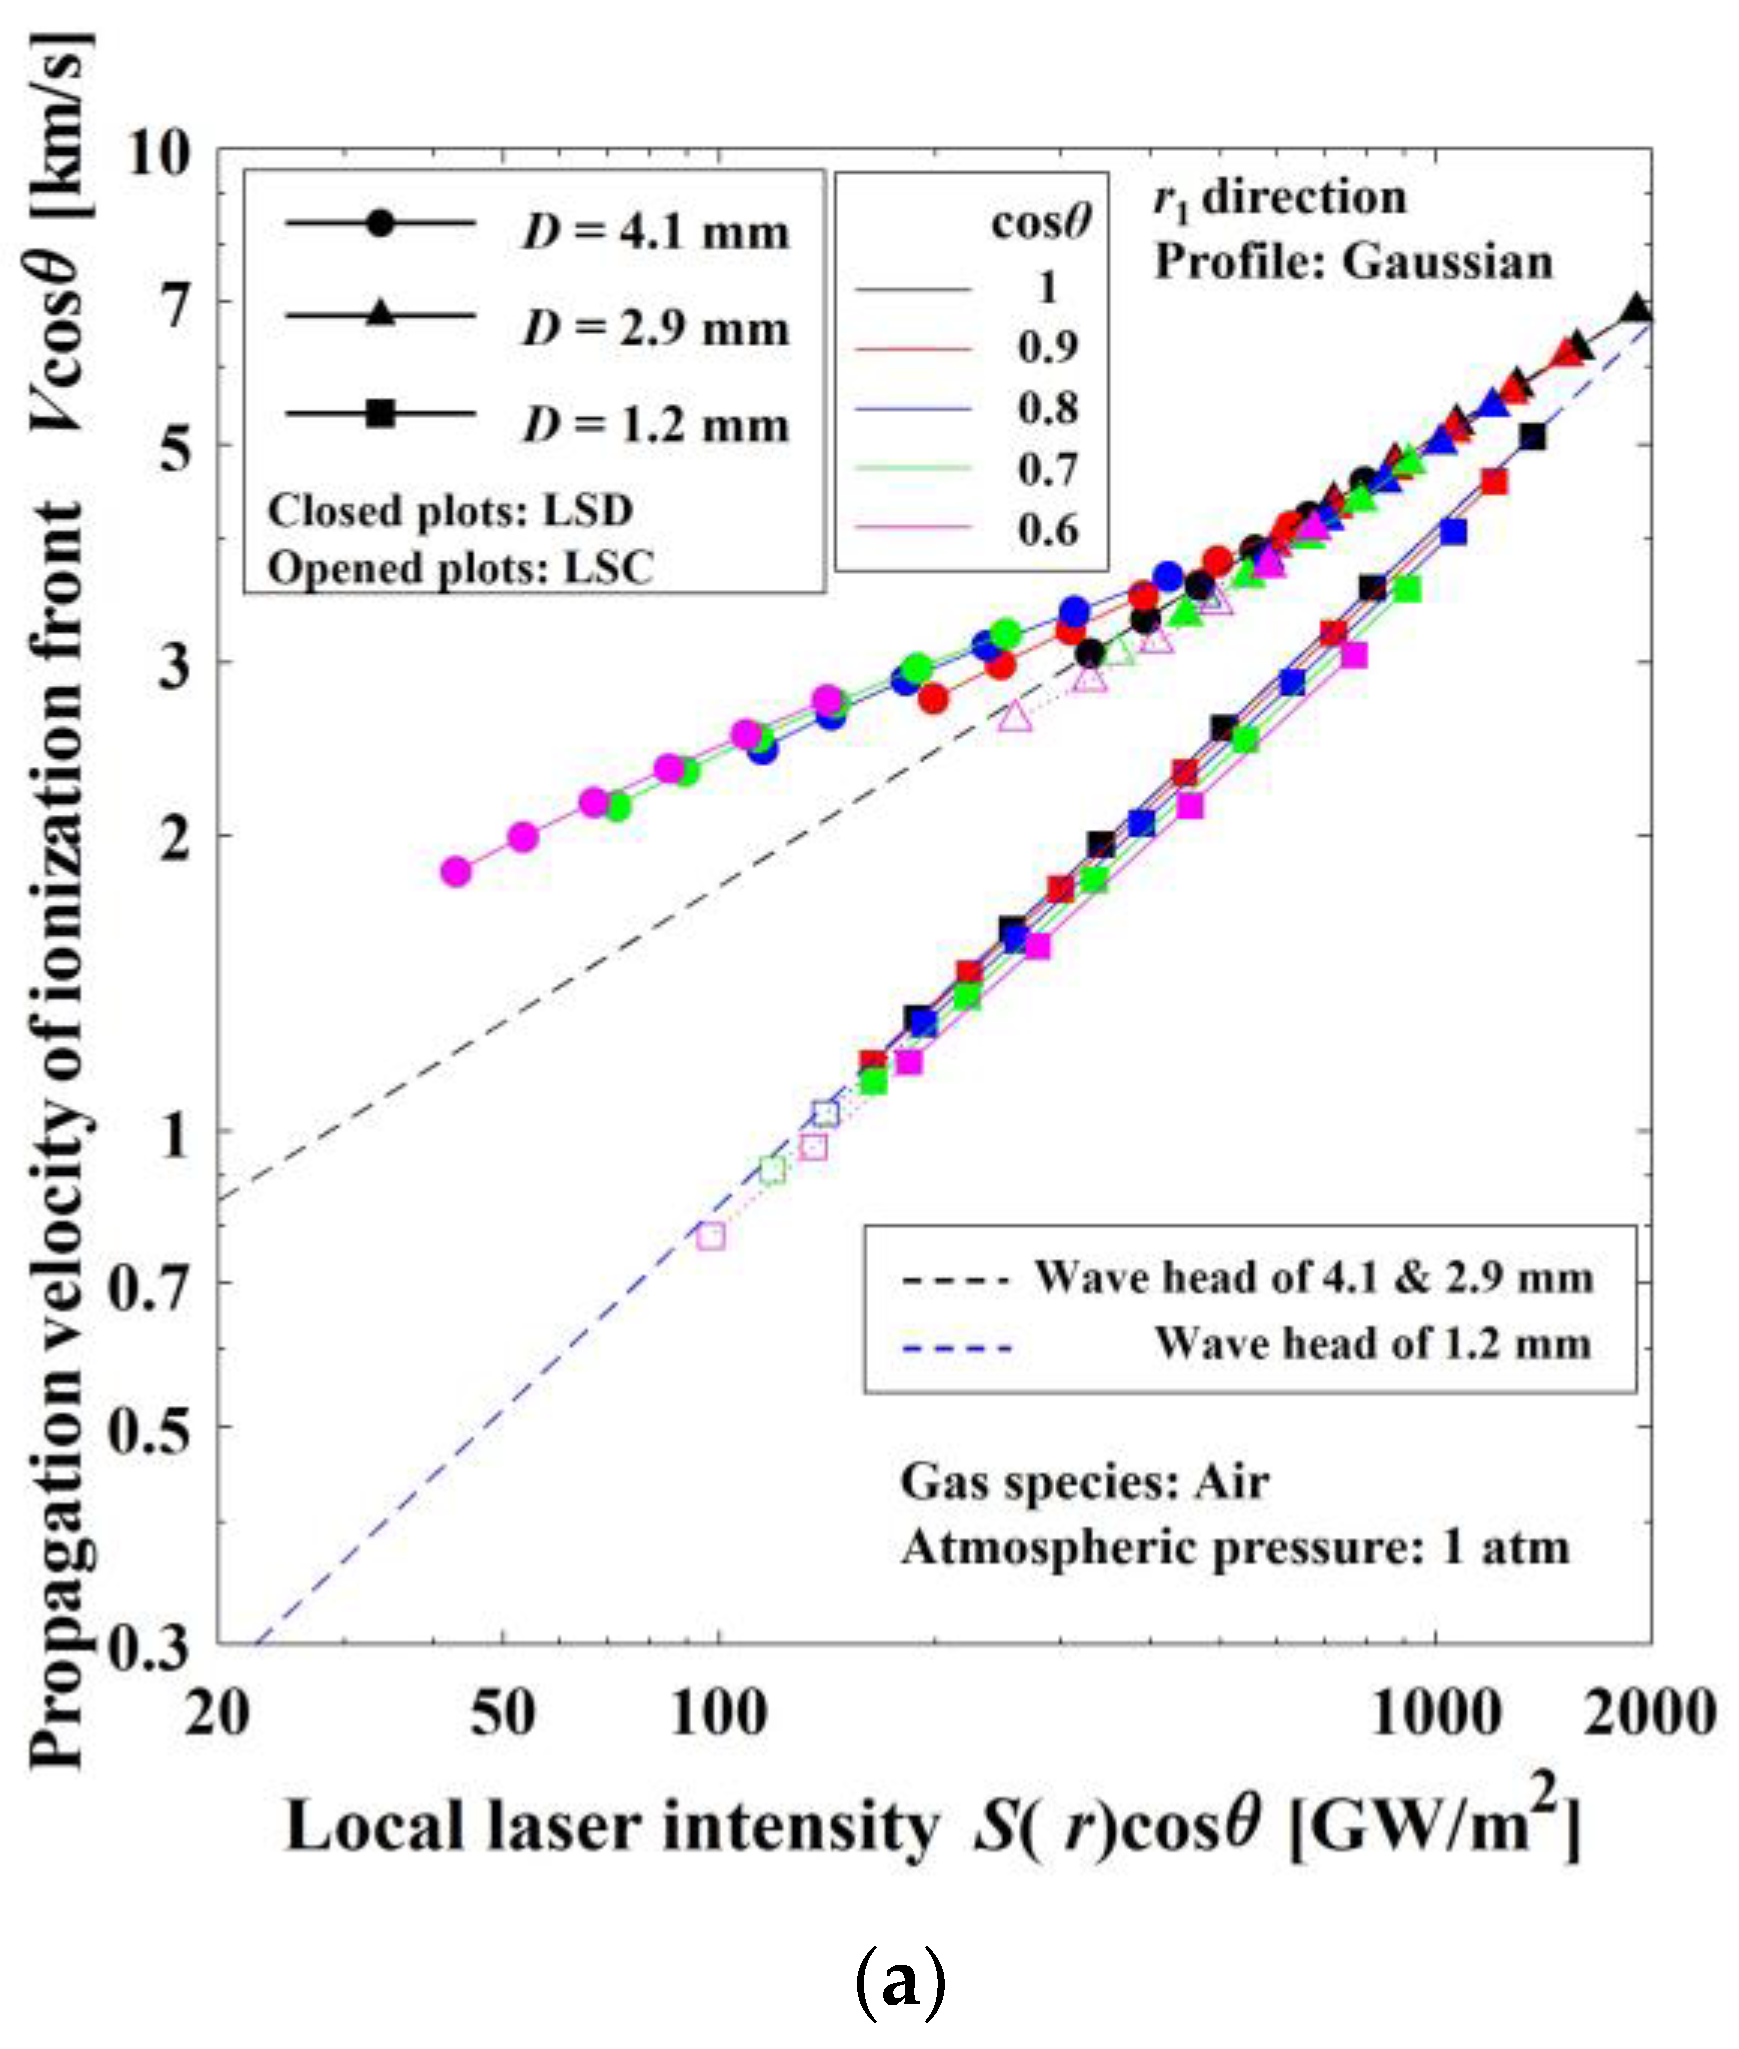
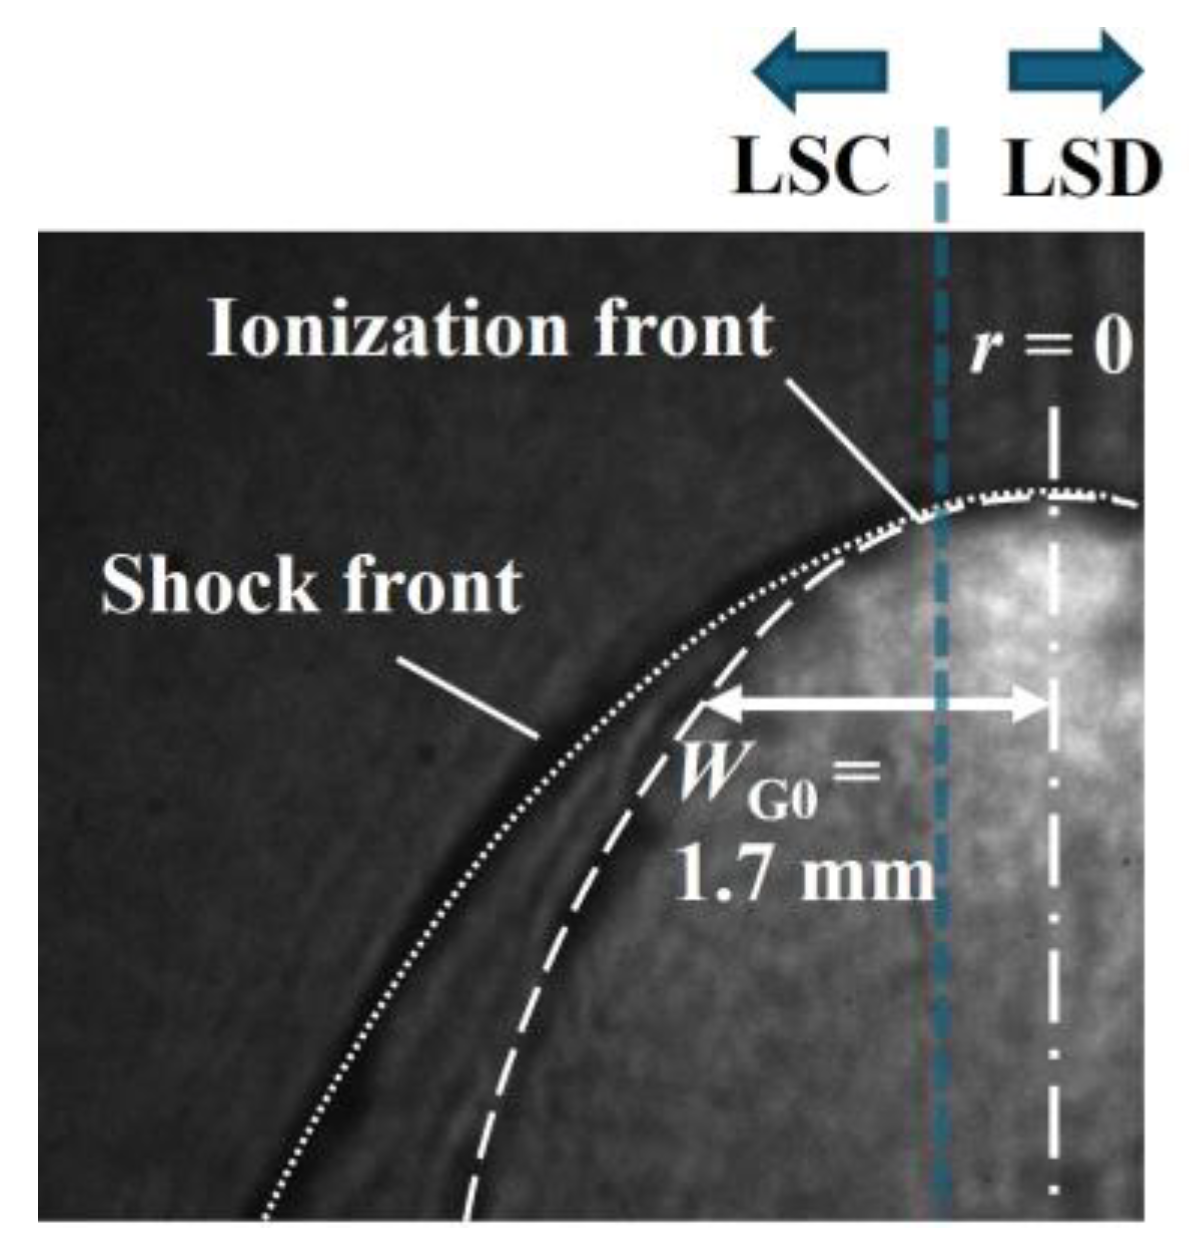
Figure 8 presents photographs of propagating ionization fronts in the r1 direction with 2.9 mm beam diameter and the historical profiles of the laser intensity distribution and wavefront shapes. The wavefront shape presented in Figure 8b with solid lines is deduced by detecting the wavefront shape from images taken by iStar sCMOS presented in Figure 8a. The wave head positions are aligned at z = 0 mm in Figure 8b. To calculate the local propagation velocity in a direction normal to wavefront Vcosθ, the velocity in the direction of the laser axis is given as Equations (6) and (7). The wavefront angle is deduced by differentiating a polynomial fitted curve obtained from the wavefront shape presented in Figure 8b. Because the time variation of the wavefront shape is negligible compared to the propagation velocity, the propagation velocity along the laser axis for each r is unique at a certain time. To elucidate the propagation velocity dependence on the laser intensity, we evaluated the local intensity as S(r)cosθ because the cross section of the laser beam projected onto the oblique wavefront is enlarged by 1/cosθ and because the local laser intensity is reduced by a factor of cosθ. From these profiles of the laser intensity distribution and the wavefront shapes, relations between local propagation velocity in the direction normal to the wavefront and local laser beam intensity are deduced as shown in Figure 9. Figure 9a,b show propagation velocities in the r1 and r2 directions. Their respective laser intensity profiles are Gaussian and top-hat distribution, as shown in Figure 5. The propagation velocity is shown for cosθ from 0.6 to 1. To investigate the condition of LSD termination, we took schlieren images in which a shock front and an ionization front are projected simultaneously, as in Figure 10, which presents a typical Schlieren image of LSD with D = 4.1 mm in the r1 direction. As r/W increases, the region in which a shock front is separated from an ionization front, which is in the LSC state, is enlarged. By analyzing the separation points, the state of LSD is shown as a filled plot. The state of LSC is shown as an open plot. In Figure 9, the result shows unique trends of local laser intensity, irrespective of the wavefront angle in both directions. Although the result of D = 1.2 mm shows the same tendency as that of the velocity in the direction of the laser axis, the velocity of D ≥ 2.9 mm is higher than that within a region below 500 GW/m2. In this region, the function of the fitting curve is given as shown below.
This function, which is defined as line 3, is presented in Figure 11 along with the results of the local propagation velocity presented in Figure 9a. The exponent of the function is similar to that of C–J velocity, as shown Equation (3). The variation of the exponents in each region suggests that the propagation structure transitions at a certain intensity, which is also observed in argon [25]. Figure 12 presents the velocity in the direction of the laser axis with three lines. The velocity of D ≥ 2.9 mm shows the same tendency as that of line three within the error bars. This result indicates that propagation velocities of the LSD wave in the direction of the laser axis and that of oblique laser-supported detonation off the laser axis can be described as the same functions of S(r)cosθ. For future works, a physical reason of the unique tendency of the velocity with D ≥ 2.9 mm and the velocity of the oblique detonation should be clarified with a 2D numerical calculation that contains the complex plasma dynamics.
5. Conclusions
The propagation velocity at the laser axis was measured using beam diameters of 4.1 mm, 2.9 mm, and 1.2 mm. That of D ≥ 2.9 mm showed a unique tendency for peak laser intensity. By analyzing the wavefront shape, the relation between the local propagation velocity in the direction normal to the wavefront and the local laser intensity S(r)cosθ were deduced. The local propagation velocity showed a unique tendency on S(r)cosθ, irrespective of the wavefront angle. Compared to the tendency obtained from the analysis of local propagation velocity with the velocity at the laser axis, good agreement was found. This result suggests the velocity of the oblique laser-supported detonation off the laser axis can be described as the same function, with the propagation velocity of the LSD wave in the direction of the laser axis.
Author Contributions
Conceptualization, K.M. and K.K. (Kimiya Komurasaki); Formal analysis, K.M.; Investigation, K.M. and K.K. (Kimiya Komurasaki); Data curation, K.M.; Writing—original draft, K.M.; Writing—review & editing, K.K. (Keisuke Kanda) and H.K.; Supervision, K.K. (Kimiya Komurasaki) and H.K.; Funding acquisition, K.K. (Kimiya Komurasaki). All authors have read and agreed to the published version of the manuscript.
Funding
This work was supported by JSPS KAKENHI Grant number JP15H05770 and JP20H02344.
Data Availability Statement
The data that support the findings of this study are available from the corresponding author upon reasonable request.
Conflicts of Interest
The authors declare no conflicts of interest.
Nomenclature
| a | Speed of sound, m/s |
| D | Equivalent beam diameter, mm |
| f | Focal length, mm |
| F | F-number |
| M2 | Beam quality factor |
| Local laser intensity, W/m2 | |
| Laser intensity on the beam axis, W/m2 | |
| Normalized laser intensity | |
| t | Elapsed time after laser breakdown, s |
| r, z | Cylindrical coordinates, m |
| r1 | Direction of Gaussian intensity profile |
| r2 | Direction of top-hat intensity profile |
| Propagation velocity, m/s | |
| Normalized propagation velocity | |
| WG0 | Beam waist size of r1 direction, m |
| WT0 | Beam waist size of r2 direction, m |
| θ | Angle of a wavefront, rad |
| ρ1 | Atmospheric gaseous density, kg/m3 |
| γ2 | Specific heat ratio behind shock wave |
References
- Komurasaki, K.; Wang, B. Laser Propulsion. In Encyclopedia of Aerospace Engineering; American Institute of Aeronautics and Astronautics, Inc.: Reston, VA, USA, 2010. [Google Scholar]
- Katsurayama, H.; Komurasaki, K.; Arakawa, Y. A preliminary study of pulse-laser powered orbital launcher. Acta Astronaut. 2009, 65, 1032–1041. [Google Scholar] [CrossRef]
- Myrabo, L.M.; Messitt, D.G.; Mead, F.B., Jr. Ground and flight tests of a laser propelled vehicle. AIAA Paper 1998, 98–1001. [Google Scholar]
- Sasoh, S.; Kim, J.H.; Yamashita, K.; Sakai, T. Supersonic aerodynamic performance of truncated cones with repetitive laser pulse energy depositions. Shock. Waves 2014, 24, 59–67. [Google Scholar] [CrossRef]
- Mori, K.; Komurasaki, K.; Arakawa, Y. Threshold Laser Power Density for Regime Transition of a Laser Absorption Wave in a Reduced-density Air Atmosphere. Appl. Phys. Lett. 2006, 88, 121502-1–121502-3. [Google Scholar] [CrossRef]
- Mori, K.; Komurasaki, K.; Arakawa, Y. Influence of the focusing f number on the heating regime transition in laser absorption waves. J. Appl. Phys. 2002, 92, 5663–5667. [Google Scholar] [CrossRef]
- Ushio, M.; Komurasaki, K.; Kawamura, K.; Arakawa, K. Effect of laser supported detonation wave confinement on termination conditions. Shock Waves 2008, 18, 155–157. [Google Scholar] [CrossRef]
- Wang, B.; Komurasaki, K.; Arakawa, Y. Energy conversion in a glass-laser-induced blast wave in air. J. Appl. Phys. 2010, 108, 124911. [Google Scholar] [CrossRef]
- Wang, B.; Komurasaki, K.; Arakawa, Y. Influence of ambient air pressure on the energy conversion of laser-breakdown induced blast waves. J. Phys. D 2013, 46, 375201. [Google Scholar] [CrossRef]
- Mori, K.; Komurasaki, K.; Arakawa, Y. Energy transfer from a laser pulse to a blast wave in reduced-pressure air atmospheres. J. Appl. Phys. 2004, 95, 5979–5983. [Google Scholar] [CrossRef]
- Shimamura, K.; Hatai, K.; Kawamura, K.; Fukui, A.; Fukuda, A.; Wang, B.; Yamaguchi, T.; Komurasaki, K.; Arakawa, Y. Internal structure of laser supported detonation waves by two-wavelength Mach–Zehnder interferometer. J. Appl. Phys. 2011, 109, 084910. [Google Scholar] [CrossRef]
- Shimamura, K.; Komurasaki, K.; Ofosu, J.A.; Koizumi, H. Precursor Ionization and Propagation Velocity of a Laser-Absorption Wave in 1.053 and 10.6- μm Wavelengths Laser Radiation. IEEE Trans. Plasma Sci. 2014, 42, 3121. [Google Scholar] [CrossRef]
- Shimada, Y.; Shibata, T.; Yamaguchi, T.; Oda, Y.; Kajiwara, K.; Takahashi, K.; Kasugai, A.; Sakamoto, K.; Komurasaki, K.; Arakawa, Y. Propagating Structure Of A Microwave Driven Shock wave Inside A Tube. AIP Conf. Proc. 2010, 1230, 366. [Google Scholar]
- Shimamura, K.; Ofosu, J.A.; Komurasaki, K.; Koizumi, H. Predicting Propagation Limits of Laser-supported Detonation by Hugoniot Analysis. Jpn. J. Appl. Phys. 2015, 54, 5. [Google Scholar] [CrossRef]
- Raizer, Y.P. Heating of a gas by a powerful light pulse. Sov. Phys. JETP 1965, 21, 1009–1017. [Google Scholar]
- Maher, W.E.; Hall, R.B.; Johnson, R.R. Experimental study of igition and propagation of laser-supported detonation waves. J. Appl. Phys. 1974, 45, 2138–2145. [Google Scholar] [CrossRef]
- Bournot, P.; Pincosy, P.A.; Inglesakis, G.; Autric, M.; Dufresne, D.; Caressa, J.-P. Propagation of a Laser-supported Detonation Wave. Acta Astronaut. 1979, 6, 257–267. [Google Scholar] [CrossRef]
- Bufetov, I.A.; Prokhorov, A.M.; Fedorov, V.B.; Fomin, V.K. Optical Discharge Accompanying a Restriction Imposed on Lateral Expansion of Gas and a Reduction in the Threshold of Light-induced Detonation. JETP Lett. 1984, 39, 258. [Google Scholar]
- Wei, P.S.P.; Hall, R.B.; Maher, W.E. Study of laser-supported detonation waves by time-resolved spectroscopy. J. Chem. Phys. 1973, 59, 3692–3700. [Google Scholar] [CrossRef]
- Matsui, K.; Shimano, T.; Komurasaki, J.A.O.K.; Schoenherr, T.; Koizumi, H. Accurate propagation velocity measurement of laser supported detonation waves. Vacuum 2016, 130, 171–176. [Google Scholar] [CrossRef]
- Shimano, T.; Ofosu, J.A.; Matsui, K.; Komurasaki, K.; Koizumi, H. Laser-Induced Discharge Propagation Velocity in Helium and Argon Gases. Trans. Jpn. Soc. Aero. Space Sci. 2017, 60, 378–381. [Google Scholar] [CrossRef]
- Maeda, S.; Kasahara, J.; Matsuo, A. Oblique detonation wave stability around a spherical projectile by a high time resolution optical observation. Combust. Flame 2012, 159, 887–896. [Google Scholar] [CrossRef]
- Iwata, K.; Nakaya, S.; Tuse, M. Wedge-stabilized oblique detonation in an inhomogeneous hydrogen–air mixture. Proc. Combust. Inst. 2017, 36, 2761. [Google Scholar] [CrossRef]
- ISO 11146; Lasers and Laser-Related Equipment—Test Methods for Laser Beam Widths, Divergence Angles and Beam Propagation Ratios. International Organization for Standardization: Geneva, Switzerland, 2005.
- Shimamura, K.; Yokota, I.; Yokota, S. Characterization of the fast ionization wave induced by a CO2 laser pulse in argon. J. Appl. Phys. 2019, 126, 243304. [Google Scholar] [CrossRef]
Figure 1.
Earlier studies of relations between laser intensity and propagation velocity [7,10,16,17,18,19]. All experiments were conducted in air. Because of different focusing optics, the velocity is not determined uniquely by laser intensity.

Figure 2.
Typical image of a bow-shaped ionization front. The oblique propagation velocity is calculated from V and the angle of the ionization wave front.
Figure 2.
Typical image of a bow-shaped ionization front. The oblique propagation velocity is calculated from V and the angle of the ionization wave front.

Figure 3.
Historical profile of laser power and cumulative energy of the CO2 laser, with the burn pattern of the laser before focusing.
Figure 3.
Historical profile of laser power and cumulative energy of the CO2 laser, with the burn pattern of the laser before focusing.

Figure 4.
Schematics showing the experiment setup. (a) Focusing optics of D = 4.1 mm, which consist of two mirrors with focal lengths of 500 mm in r1 and 400 mm in r2 direction. (b) Focusing optics of D = 2.9 mm and D = 1.2 mm, with respective focal lengths of 317.5 mm and 127 mm.
Figure 4.
Schematics showing the experiment setup. (a) Focusing optics of D = 4.1 mm, which consist of two mirrors with focal lengths of 500 mm in r1 and 400 mm in r2 direction. (b) Focusing optics of D = 2.9 mm and D = 1.2 mm, with respective focal lengths of 317.5 mm and 127 mm.

Figure 5.
Measured and fitted laser intensity profiles at the beam waist with D = 4.1 mm in the r1 and r2 directions, with Gaussian and top-hat profiles. WG0 and WT0 are beam radii at the beam waist.
Figure 5.
Measured and fitted laser intensity profiles at the beam waist with D = 4.1 mm in the r1 and r2 directions, with Gaussian and top-hat profiles. WG0 and WT0 are beam radii at the beam waist.

Figure 6.
Relation between beam radius in r2 direction and distance from beam waist of each focusing optics. Typical LSD propagation limits for beam diameters are displayed as broken lines. The detonation wave propagates from left to right in this figure.
Figure 6.
Relation between beam radius in r2 direction and distance from beam waist of each focusing optics. Typical LSD propagation limits for beam diameters are displayed as broken lines. The detonation wave propagates from left to right in this figure.

Figure 7.
Dependence of propagation of an ionization front with various beam diameters on laser intensity at the laser axis. All experiments were conducted in air at a pressure of 1 atm. Trends against laser intensity differ between D ≥ 2.9 mm and D = 1.2 mm. Fitted lines with power function are shown as line 1 and line 2.

Figure 8.
(a) Photograph of an ionization front propagating from t = 0.675 μs to 1.835 μs with D = 2.9 mm in the r1 direction. Laser is irradiated from upper side of photographs. (b) Historical change of wavefront shape analyzed from Figure 4a and estimated laser intensity profile with D = 2.9 mm in the r1 direction. The elapsed time from starting points of laser irradiation is shown.

Figure 9.
Relation between local propagation velocity in a direction normal to the wavefront and local laser intensity of each beam diameter. Closed and opened plots, respectively, show LSD and LSC conditions: (a) r1 direction (Gaussian profile), (b) r2 direction (top-hat profile).
Figure 9.
Relation between local propagation velocity in a direction normal to the wavefront and local laser intensity of each beam diameter. Closed and opened plots, respectively, show LSD and LSC conditions: (a) r1 direction (Gaussian profile), (b) r2 direction (top-hat profile).


Figure 10.
Schlieren image of LSD of r1 direction with D = 4.1 mm. The shock front is separated from the ionization front at large r/WG0.
Figure 10.
Schlieren image of LSD of r1 direction with D = 4.1 mm. The shock front is separated from the ionization front at large r/WG0.

Figure 11.
Relation between local propagation velocity in the direction normal to the wavefront and local laser intensity of each beam diameter in the r1 direction. In a region below 500 GW/m2 of D ≥ 2.9 mm, the velocity is larger than that of the laser axis. It shows a tendency as Line 3.
Figure 11.
Relation between local propagation velocity in the direction normal to the wavefront and local laser intensity of each beam diameter in the r1 direction. In a region below 500 GW/m2 of D ≥ 2.9 mm, the velocity is larger than that of the laser axis. It shows a tendency as Line 3.

Figure 12.
Relation between propagation velocity and laser intensity at the laser axis. Line 3 is obtained from analysis of the local propagation velocity. It shows the same tendency as the velocity in the direction of the laser axis.
Figure 12.
Relation between propagation velocity and laser intensity at the laser axis. Line 3 is obtained from analysis of the local propagation velocity. It shows the same tendency as the velocity in the direction of the laser axis.


Table 1.
Properties of focusing optics and beam diameter.
| Property | r1 | r2 | r1 | r2 | r1 | r2 |
|---|---|---|---|---|---|---|
| f [mm] | 500 | 400 | 317.5 | 127 | ||
| F | 16.7 | 13.3 | 10.6 | 4.2 | ||
| [mm] | 1.7 | 1.1 | 0.4 | |||
| [mm] | 2.0 | 1.6 | 0.6 | |||
| D [mm] | 4.1 | 2.9 | 1.2 | |||
Disclaimer/Publisher’s Note: The statements, opinions and data contained in all publications are solely those of the individual author(s) and contributor(s) and not of MDPI and/or the editor(s). MDPI and/or the editor(s) disclaim responsibility for any injury to people or property resulting from any ideas, methods, instructions or products referred to in the content. |
© 2024 by the authors. Licensee MDPI, Basel, Switzerland. This article is an open access article distributed under the terms and conditions of the Creative Commons Attribution (CC BY) license (https://creativecommons.org/licenses/by/4.0/).
Share and Cite
MDPI and ACS Style
Matsui, K.; Komurasaki, K.; Kanda, K.; Koizumi, H. Observation of Oblique Laser-Supported Detonation Wave Propagating in Atmospheric Air. Aerospace 2024, 11, 327. https://doi.org/10.3390/aerospace11040327
AMA Style
Matsui K, Komurasaki K, Kanda K, Koizumi H. Observation of Oblique Laser-Supported Detonation Wave Propagating in Atmospheric Air. Aerospace. 2024; 11(4):327. https://doi.org/10.3390/aerospace11040327
Chicago/Turabian StyleMatsui, Kohei, Kimiya Komurasaki, Keisuke Kanda, and Hiroyuki Koizumi. 2024. "Observation of Oblique Laser-Supported Detonation Wave Propagating in Atmospheric Air" Aerospace 11, no. 4: 327. https://doi.org/10.3390/aerospace11040327
Note that from the first issue of 2016, this journal uses article numbers instead of page numbers. See further details here.