
Research on the Flow Mechanism of a High-Loading Biomimetic Low-Pressure Turbine Cascade
by
 ,
,
Hanliu Deng
1,2,
Zhijun Lei
1,2,*,
Xiaoqing Ouyang
1,3,
Yuxiang He
1,4,
Hang Yuan
1,2,
Gang Li
1,2,
Yanfeng Zhang
1,2,
Xingen Lu
1,2 and
Gang Xu
1,2 1
Laboratory of Light-Duty Gas-Turbine, Institute of Engineering Thermo-Physics, National Key Laboratory of Science and Technology on Advanced Light-Duty Gas-Turbine, Chinese Academy of Sciences, Beijing 100089, China
2
School of Aeronautics and Astronautics, University of Chinese Academy of Sciences, Beijing 100049, China
3
Research Center of Fluid Machinery Engineering and Technology, Jiangsu University, Zhenjiang 212013, China
4
School of Energy Power and Mechanical Engineering, North China Electric Power University, Beijing 102206, China
*
Author to whom correspondence should be addressed.
Aerospace 2024, 11(4), 328; https://doi.org/10.3390/aerospace11040328
Submission received: 15 March 2024
/
Revised: 16 April 2024
/
Accepted: 17 April 2024
/
Published: 22 April 2024
Abstract
:The biomimetic turbine has an excellent flow drag reduction ability and wide incidence adaptability, so it has the potential to achieve high efficiency within a wide working range of high-performance variable cycle engines. A biomimetic cascade that can broaden the effective working incidence angles was designed based on a high-loading low-pressure turbine cascade, and its flow mechanism and aerodynamic performance were studied using experimental and numerical methods under the incidences angle (i) of 0° to 15° and Reynolds number of 1.0 × 10⁵. A series of counter rotating vortex pairs induced by the biomimetic cascade bring additional dissipation losses, but it accelerates the energy exchange between the boundary layer and mainstream, enhancing the dissipation of the pressure side leg of horseshoe vortex, and thus suppressing the flow separation and passage vortices. The undulating surface of biomimetic cascades can suppress the expansion of secondary flow in a spanwise direction in the end region, especially for large-scale separation under high incidence conditions. When i < 5°, the loss of biomimetic cascades is slightly higher than that of the original cascades, but the increase is only 0.5%; when i > 5°, the losses of biomimetic cascades are significantly reduced, with a maximum reduction of 70% at i = 15°.
1. Introduction
As one of the key components of aviation engines, the low-pressure turbine (LPT) has the lowest Reynolds number (Re = 1 × 10⁵~5 × 10⁵) [1], but its efficiency improvement contributes the most to the overall efficiency improvement of the engine [2]. For the wide envelope working range of variable cycle engines, traditional LPT blades are unable to maintain efficient operation under conditions with such a low Reynolds number and such a wide range of incidence angles, which can lead to a sharp increase in losses such as secondary flow loss and separation loss [3].
To meet an aero engine’s requirements for LPT components, researchers have proposed various design methods, including synthetic jets [4], vortex generators [5], dielectric barrier discharge plasma exciters [6], a grooving or ribbing blade [7], and altering the turbine blade’s surface roughness [8]. However, these flow control methods each have their own drawbacks. Some increase the structural complexity, add to the overall structural weight of the engine, or complicate control, such as synthetic jets and vortex generators. Others can only achieve a higher efficiency within a specific range of operating conditions, but bring serious negative effects in a wide range of operating conditions. For instance, plasma excitation can only be used under low-speed conditions, and changing surface roughness is only effective under certain conditions. Therefore, the existing LPT flow control methods are still inadequate for ensuring an aero engine operates efficiently and stably across a broad range of operating conditions.
To address this need, researchers have proposed flow control methods that incorporate bionics, which are shown in Figure 1a. For instance, the fins of killer whales, which are not entirely flat and have protrusions called tubercles at the leading edge, have been applied to structures like drones and rudders [9,10]. It has been verified that its effect is akin to a vortex generator, capable of preventing or delaying the onset of airflow separation and significantly enhancing the airfoil’s performance within a large incidence angle range [11]. However, this causes the complexity of the flow field behind the tubercles to increase [12]. Another approach is to imitate the wings of eagles by designing serrated structures at the trailing edge position and applying them to wind turbine blades [13,14,15,16]. This has been found to effectively improve the tail vortex structure and reduce aerodynamic noise. Researchers have also studied the geometric shape of seals’ whiskers, which can effectively alter the vortex street behind the whiskers and reduce the vibration of the vortex shedding [17,18]. This led to the proposal of a turbine blade design based on the seals’ whiskers’ surface [19]. It has been verified that this can reduce up to 50% of aerodynamic loss by suppressing the width of the wake, widen the stable working incidence angle margin, effectively enhance the working efficiency of the LPT blade, and potentially reduce aerodynamic noise. Moin et al. [20] studied the grooving of the surface similar to scallops and proposed that the V-shaped groove on the grooving surface could suppress the movement of the vortex, thereby reducing their resistance to the aircraft wing. Hu et al. [21] found that the interaction between the top of the surface groove structure and the fluid produces a pair of “counter vortex pairs”, which can constrain the low-speed fluid at the bottom of the groove structure, make the near-surface flow field more stable, and ultimately reduce the turbulent friction resistance near the surface. Researchers have also studied the scale structure on the surface of shark skin [22] and found that the groove structure between the scales on the surface and the scales can effectively reduce the friction resistance between the surface and the water flow. Designing this structure on the fuselage surface can reduce about 6%~8% of the fuselage surface resistance [23,24].
In this study, a high-lift LPT blade inspired by bionics is designed, integrating tubercles, serrations, and seal whiskers. Comprehensive experimental measurements are conducted on the straight blades (original blades) and the newly configured blades (biomimetic blades) within the planar cascade. By measuring the static pressure on the blade suction surface and the post-cascade pressure data, comparisons are made between the biomimetic and original cascade under varying inflow incidence angles. These comparisons aim to investigate their influence on the airflow structure and aerodynamic performance within the cascade. Additionally, through numerical simulation, more in-depth analyses of the flow structure in the cascades of the original configuration and biomimetic configuration are performed under different inflow incidence angles.
2. Experimental and Numerical Approaches
2.1. Experimental Equipment
The experimental measurements are conducted on a low-speed wind tunnel, which is powered by a centrifugal fan with a boost of 3000 Pa. Following the divergent, settling, and contraction sections, the airflow enters the test section. The overall structure of the test section is depicted in Figure 2. A turbulence grid is installed at the test section’s inlet to regulate the inflow turbulence, and the inlet flow field’s uniformity and the outlet flow field’s periodicity are adjusted using four flaps. The cascade’s inflow incidence angle is modified by gears, and the cascade consists of seven identical blades. The physical parameters of the inlet and outlet flow fields are measured at the cross-sections located at the 60%Cx (axial chord) position at the inlet and the 40%Cx position at the outlet. A three-hole pressure probe is used to measure the quality of the inlet and outlet flow fields. It is confirmed that the maximum error values of the airflow angle, total pressure coefficient, and dynamic pressure coefficient of the inlet flow field are less than 5%, the inlet airflow turbulence is about 2.2%, the boundary layer thickness remains at about 3% of the span, and the outlet flow field exhibits a good periodicity. Once the experimental requirements are met, the experiment is conducted. The static pressure values on the blade surface under different inflow incidence angles are measured during the experiment, and a seven-hole pressure probe measures the pressure data of the flow field at the cascade outlet. By comparing the biomimetic cascade with the original cascade, the changes in the loss and flow phenomena of the biomimetic cascade are explored.
This article uses the post-loaded high-lift LPT blade IET-LPT A (Zw = 1.36) designed by the institute as the original cascade profile research object. The aspect ratio is 2.44, and the airflow turning angle is 90°. Table 1 contains the other parameters of the IET-LPT A.
To achieve the new biomimetic configuration design, this study applies a sinusoidal oscillation to the original cascade in the span direction. The distance between two adjacent “peaks” on the blade’s leading edge corresponds to one period of the sine curve, while the axial height difference between the “peak” and “valley” on the blade’s leading edge represents the amplitude of the sine curve. Following a multi-objective optimization via numerical simulation, it is determined that the blade features 16 periods distributed along the span, with a wavelength (λ) of 3.5r and an amplitude (A) of 0.25r, in which r represents the leading-edge radius of the LPT blades. The final biomimetic configuration of the LPT blade, as shown in Figure 3, incorporates leading edge tubercles, trailing edge serrations, and the complex 3D configuration of a seal’s whisker surface. A conversion band of concave and convex features appears on the blade’s suction side, located at the 45.8% suction side length (SSL) position.
This study obtains static pressure data on the blade surface by establishing a static pressure test points array with a diameter of 0.7 mm on the suction side surface. The test schemes were positioned in the mid-span section, as depicted in Figure 3a. Due to the unevenness and periodicity of the biomimetic configuration blade surface along the spanwise direction, three rows of static pressure holes are arranged on the blade in the spanwise direction. These are located at the peak, valley, and midway between the two, respectively referred to as Plane 1 (P1), Plane 2 (P2), and Plane 3 (P3) in subsequent discussions. P3 is located at 50% of the blade height, and P1, P2, and P3 are equipped with a 37, 35, and 27 static pressure test points array, respectively. By obtaining more data at various positions, the flow state and flow control mechanism on the blade surface are further analyzed.
In Figure 3a, the blade parameters of IET-LPT A are also displayed, where the inlet flow angle (αI) is the angle between the inlet flow and the axial direction, the outlet flow angle (αE) is the angle between the outlet flow and the axial direction, and the stagger angle (γ) is the angle between the line connecting the leading and the trailing edge points of the blade and the axial direction. Figure 3c also provides the three-view and the orthographic drawing of the biomimetic blade to help readers to understand its three-dimensional structure.
2.2. Numerical Method
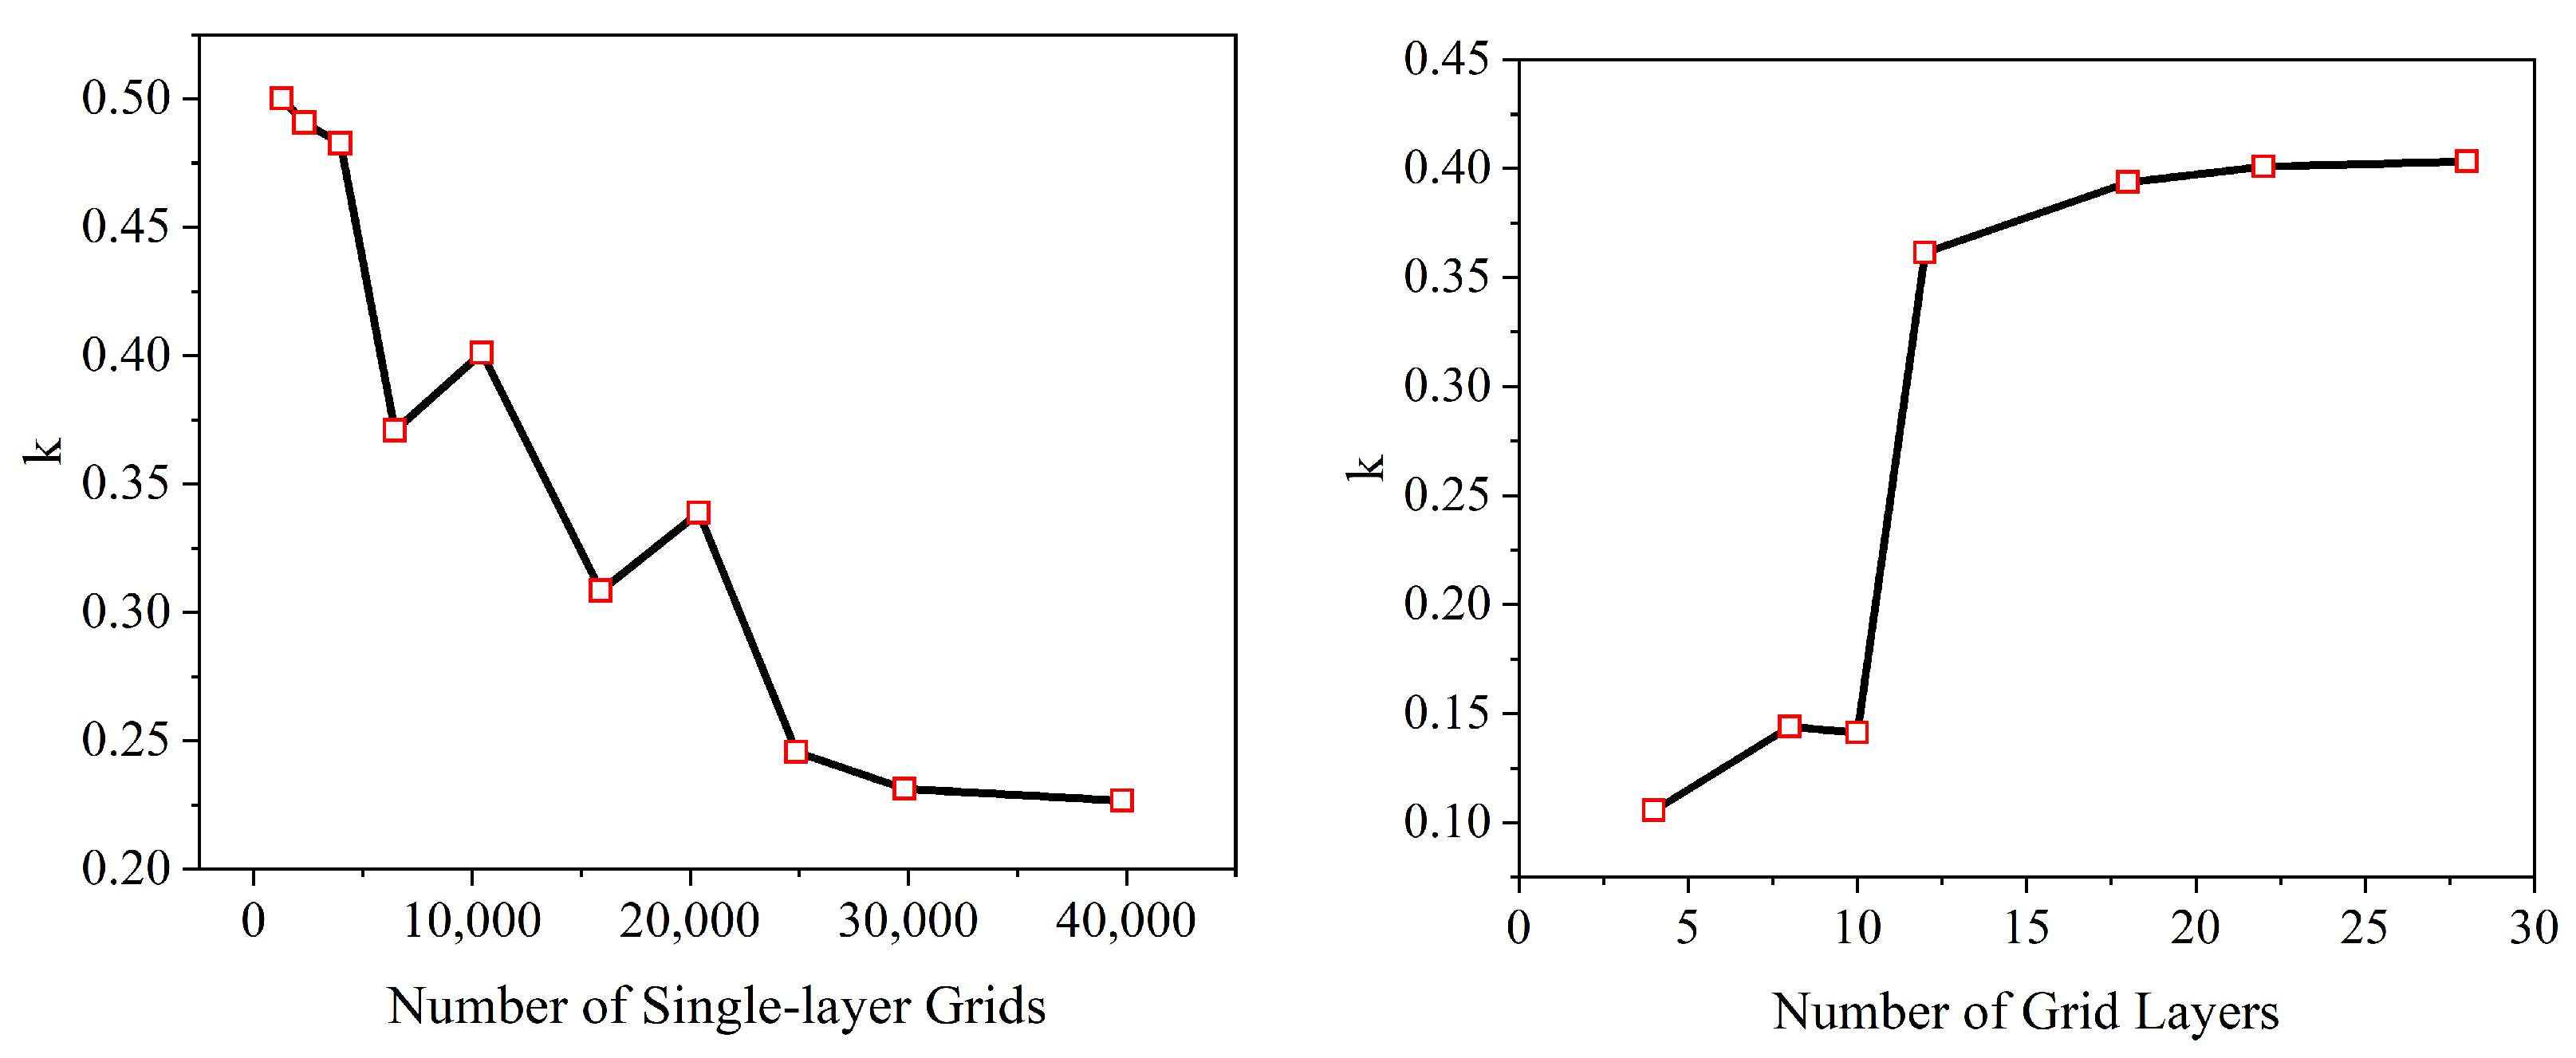
This study uses the shear–stress–transport (SST) turbulence model in the commercial fluid simulation software ANSYS CFX 22.1, and couples it with the Gamma Re-Theta transition model, known for its high prediction accuracy for RANS method numerical simulations [25,26]. As shown in Figure 4, the calculation domain of the biomimetic cascade, which is meshed with the “HOH” type grid, has an inlet section length of 1.5Cx and an outlet section length of 2Cx. Figure 4 also labels the three-dimensional coordinate axis direction, where the x-axis points towards the spanwise direction, the y-axis points in the pitchwise direction, and the z-axis points in the streamwise direction. Figure 5 illustrates the impact of the number of spanwise grid layers and single-layer grid nodes on total pressure loss coefficient (k). When the grid layer number in each period of the biomimetic cascade is greater than 15 and the node number of a single layer is greater than 30,000, the loss of the biomimetic cascade is no longer affected by the number of grids; that is, it meets the requirements of grid independency. At these points, the entire computation domain, including the boundary layer mesh of end wall, has 233 layers of mesh, totaling approximately 5.8 million grid nodes. The thickness of the first layer of grid on the blade surface is 0.003 mm, ensuring that the y+ value under all conditions is less than 1, thereby meeting the calculation requirements of the SST turbulence model.
The inlet Reynolds number (Re) and flow direction are determined by specifying the inlet velocity magnitude and direction, where the inlet velocity is 40 m/s and Re is 100,000. The inlet flow turbulence intensity is set as 2.2%. The outlet employs a static pressure boundary, with the average static pressure at the outlet set to 1 atm. The surface and endwall of the cascade are assigned adiabatic no-slip boundaries, and the boundaries on both sides of the cascade pitchwise are established as translational periodic boundary conditions. The total residual root mean square (RMS) is defined as the mean square value of the changes in the overall flow parameters. When the total residual of the entire field falls below 1 × 10⁻⁶, it is considered that the iteration has converged.
To verify the above numerical method, Figure 6 compares the simulated results of the static pressure coefficient distribution of the IET-LPT A cascade with the experimental results. The computational results capture the separation bubble on the suction surface well (as shown in the platform area in Figure 6) and align closely with the experimental data. Therefore, the numerical method used in this paper could accurately simulate the flow field of the high-loading LPT cascade.
2.3. Data Processing
The data processing in this study uses the total pressure, static pressure, and speed at the inlet section as reference data. In the data processing, the following common coefficients are defined and the analysis of article is based on these coefficients.
Static pressure coefficient:
Total pressure loss coefficient:
In the above formulas, , , , and correspond to the total pressure, static pressure, local total pressure, and local static pressure at the inlet section, respectively.
Furthermore, within the context of the Cartesian coordinate system and under the assumption that the fluid in the cascade is steady, inviscid, and unaffected by body forces, this study employs the vorticity calculation method outlined by Benner [27]. The vorticity vector, denoted as ω, is defined as the curl of the velocity vector U. The velocity components in the axial, circumferential, and spanwise directions are represented by u, v, and w, respectively. From these, the spanwise (ωx), circumferential (ωy), and axial (ωz) components of the vorticity are derived:
The streamwise vorticity intensity (ωs) is defined as,
where α is the mass average outlet flow angle, defined as,
The dimensionless streamwise vorticity coefficient (Cωs) is defined as,
3. Results and Discussion
In this experiment, the Reynolds number under investigation is Re = 100,000, which is dictated by the inlet velocity of the cascade and the axial chord (Cx). The range of incidence angles for the incoming flow includes 0°, 5°, 10°, and 15°. The blade outlet is characterized as an open boundary, with the outlet pressure equating to atmospheric pressure. Measurements are taken separately for the original cascade and the biomimetic cascade under these operational conditions.
3.1. The Impact of the Biomimetic Cascade Performance (EXP)
Figure 7 illustrates the distribution of the total pressure loss coefficient at the downstream 0.4Cx section under different incidence angle conditions for the original cascade and the biomimetic cascade. As the incidence angle increases, the k of both cascades increases to varying degrees, but the trends are different. In the original cascade, its k increases faster with the increase in the incidence angle. Especially when i = 15°, its k suddenly increases to 0.29, which is 70% higher than the 10° condition. This may be related to the large-scale open flow separation that occurs on the suction surface of the cascade under this condition. Compared with the original cascade, the k of the biomimetic cascade slightly increases under the 0° incidence angle, but the increase is only 0.5%. This may be related to the vortices’ loss induced by the biomimetic cascade and the viscous dissipation brought by the increased surface area. Considering the measurement error, this increase is almost within the range of measurement error. As the incidence angle increases, the growth rate of the k of the biomimetic cascade is gentler. When i ≥ 5°, the loss of the biomimetic cascade will be lower than the original cascade. Especially under the 15° condition, the loss coefficient of the biomimetic cascade is 36% lower than the original cascade, and it is only 20% higher than the 10° condition. This shows that under high incidence angle conditions, the biomimetic cascade can suppress the rapid growth of k, especially by suppressing the rapid increase in k under extreme incidence angle conditions (such as 15° incidence angle), which can effectively widen the effective working incidence angle range of the turbine cascade.
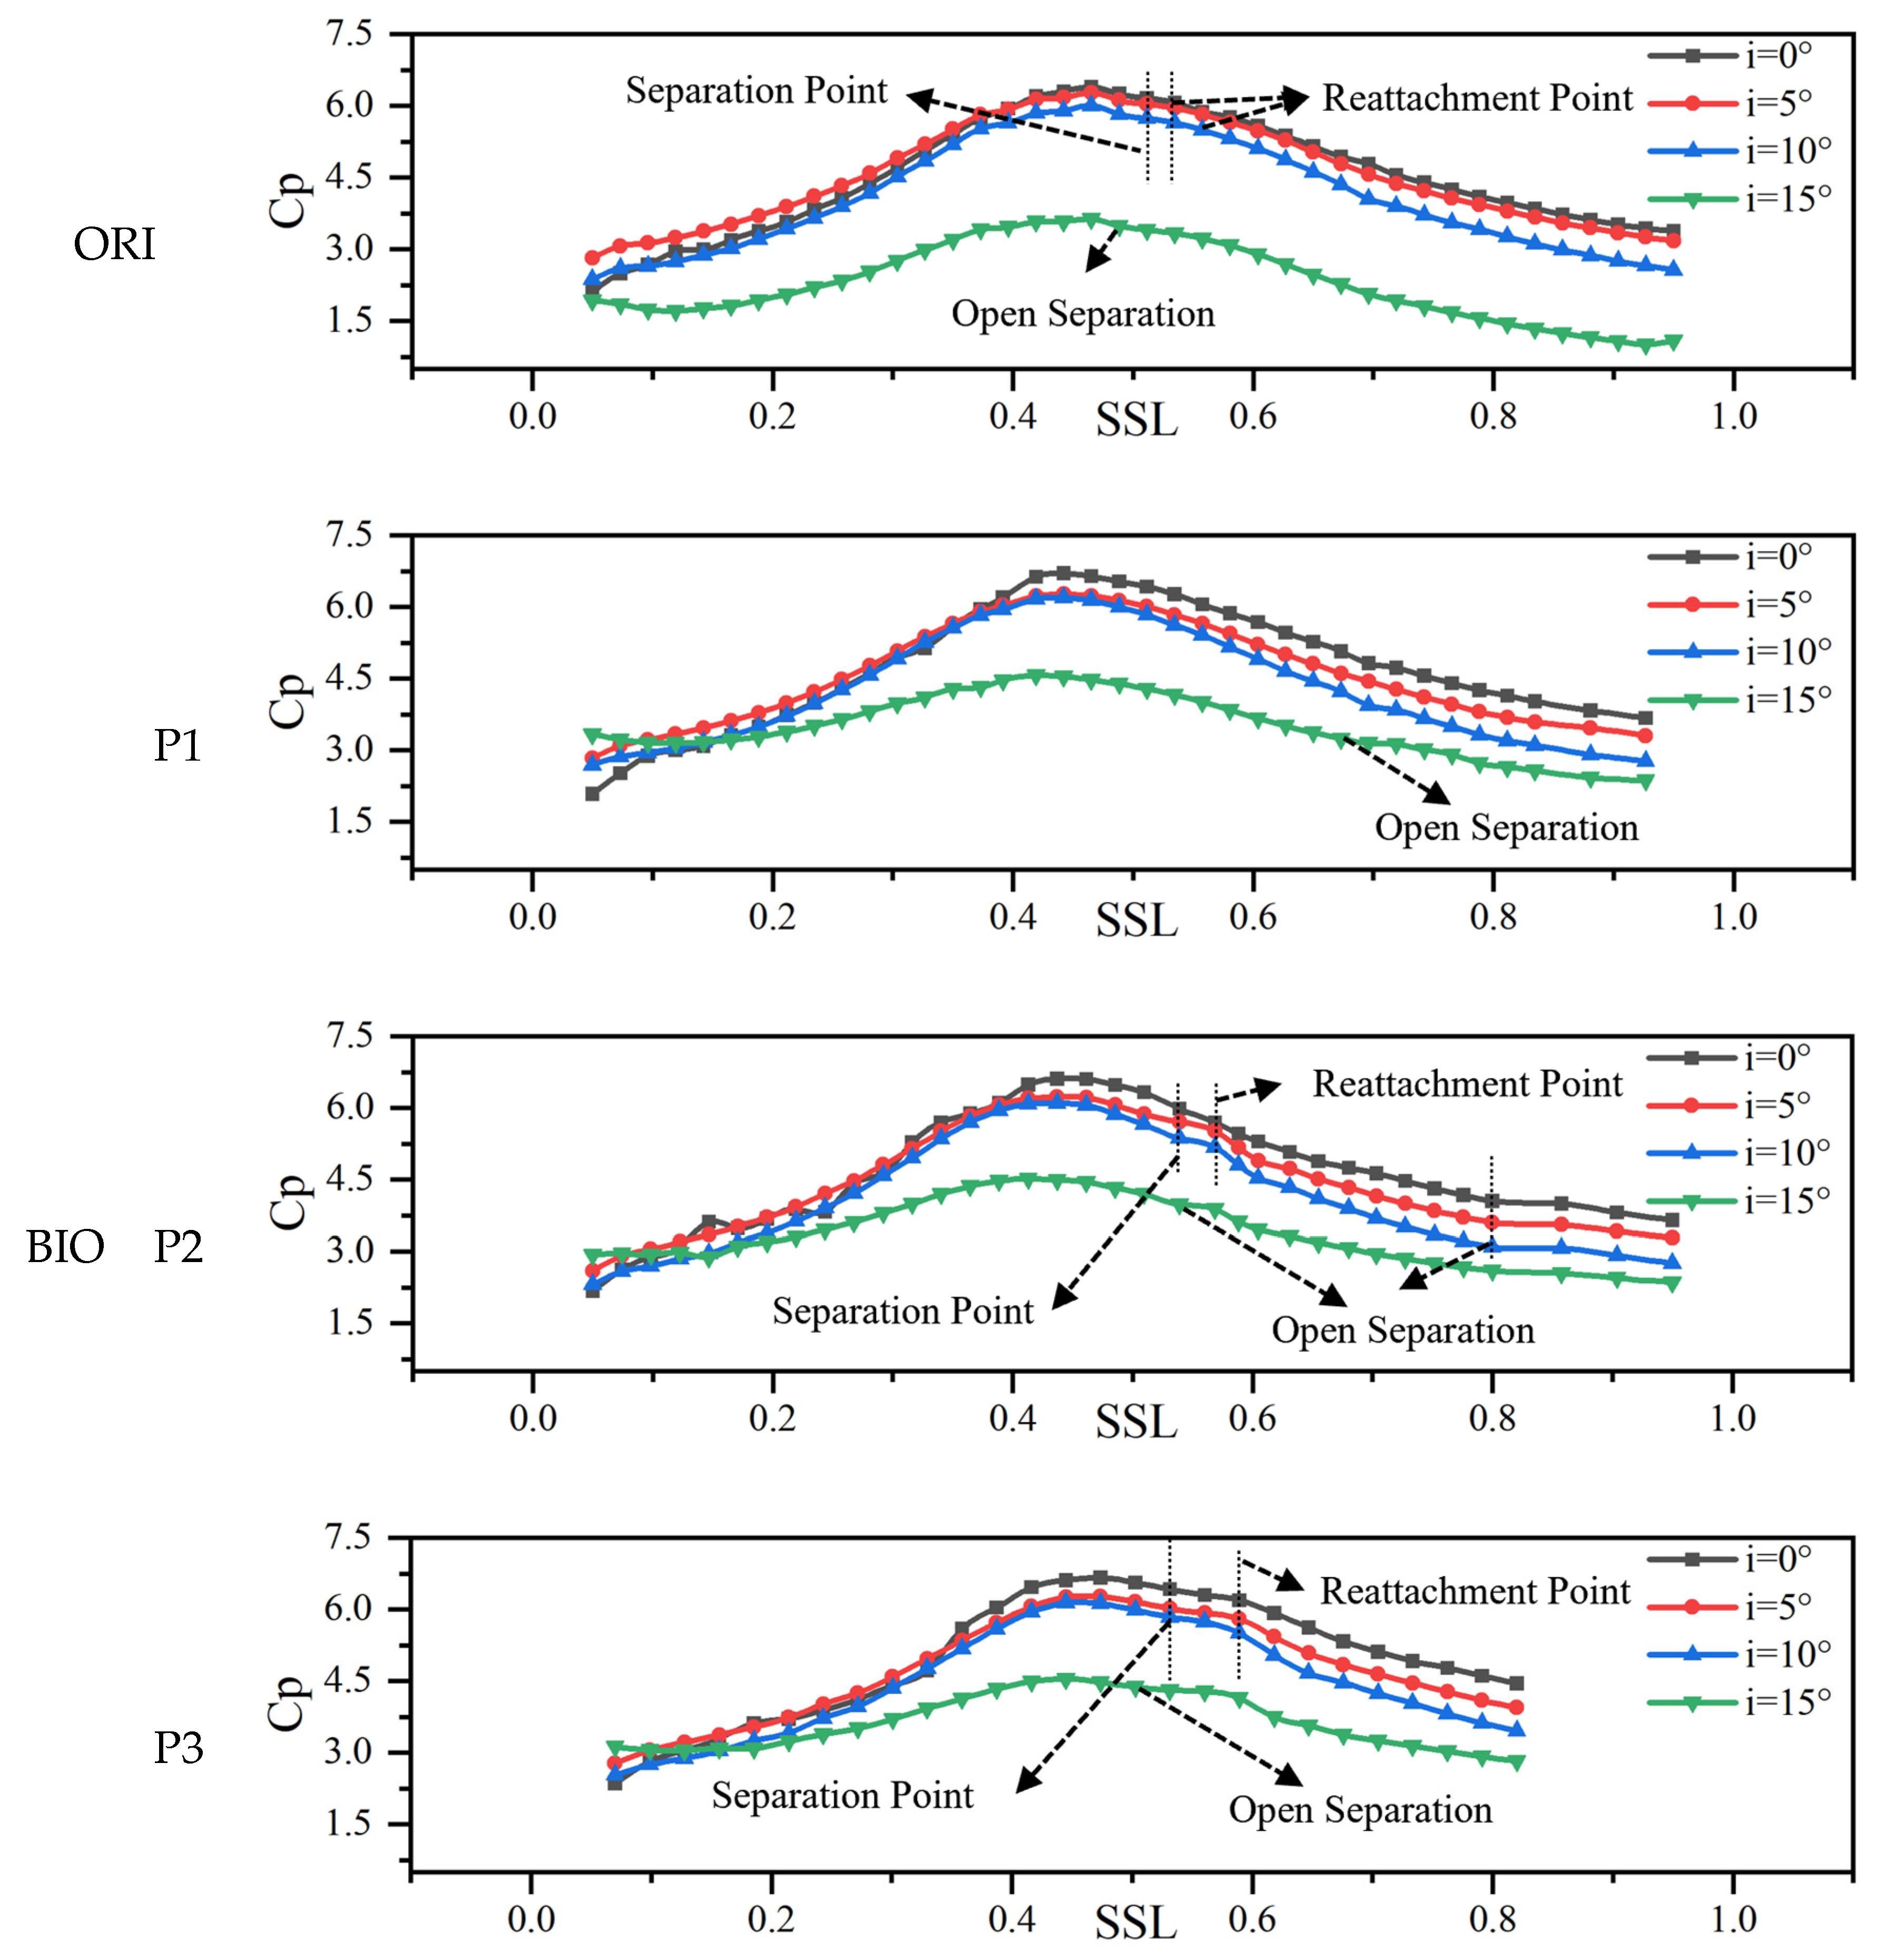
Figure 8 illustrates the static pressure coefficient (Cp) of the biomimetic and the original cascades on the suction surface under different incidence angles. For different cascades, the trend of the Cp with the inflow incidence angle remains consistent. As the incidence angle increases, the Cp at each position decreases to varying degrees. The Cp significantly decreases under the 15° incidence angle. The “platform area” of the Cp typically indicates separation. For the original cascade, the separation point is at 52% SSL at 0° and 5° incidence angles, and the reattachment point is at 54% SSL. When i = 10°, the separation position almost does not change, but the reattachment position moves backward to 55% SSL. However, when the incidence angle increases to 15°, an open separation appears on the suction side, and the separation starts at 49% SSL. For the biomimetic cascade, at P1, no separation occurs when i ≤ 10°, and open separation occurs from 67% SSL at 15°. At P2, the separation and reattachment positions are advanced. The separation position is at 53% SSL under the 0°~10° incidence angle, and the reattachment position is at 56% SSL. Open separation occurs at 80% SSL, and when i = 15°, the suction surface starts to experience open separation at 53% SSL. As for P3, the separation position when i ≤ 10° is at 53% SSL, the reattachment position is at 58% SSL, and the separation is advanced at 15°, located at 50% SSL, and no longer attached. Under different incidence angles, the peak Cp of each section of the biomimetic cascade is higher than that of the original cascade. The increase in Cp usually leads to the advance of separation and the increase in separation bubbles. However, under incidence angles which are not extremely high (0°~10°), the biomimetic cascade eliminates the separation bubbles at P1, and delays the appearance of separation bubbles at the P2 and P3s. Even under the 15° incidence angle, the biomimetic cascade can also reduce the size of the open separation area. This indicates that this configuration can suppress flow separation and restrict the separation bubbles to the trailing edge concave position, which is beneficial to the suppression of flow losses on the blade surface.
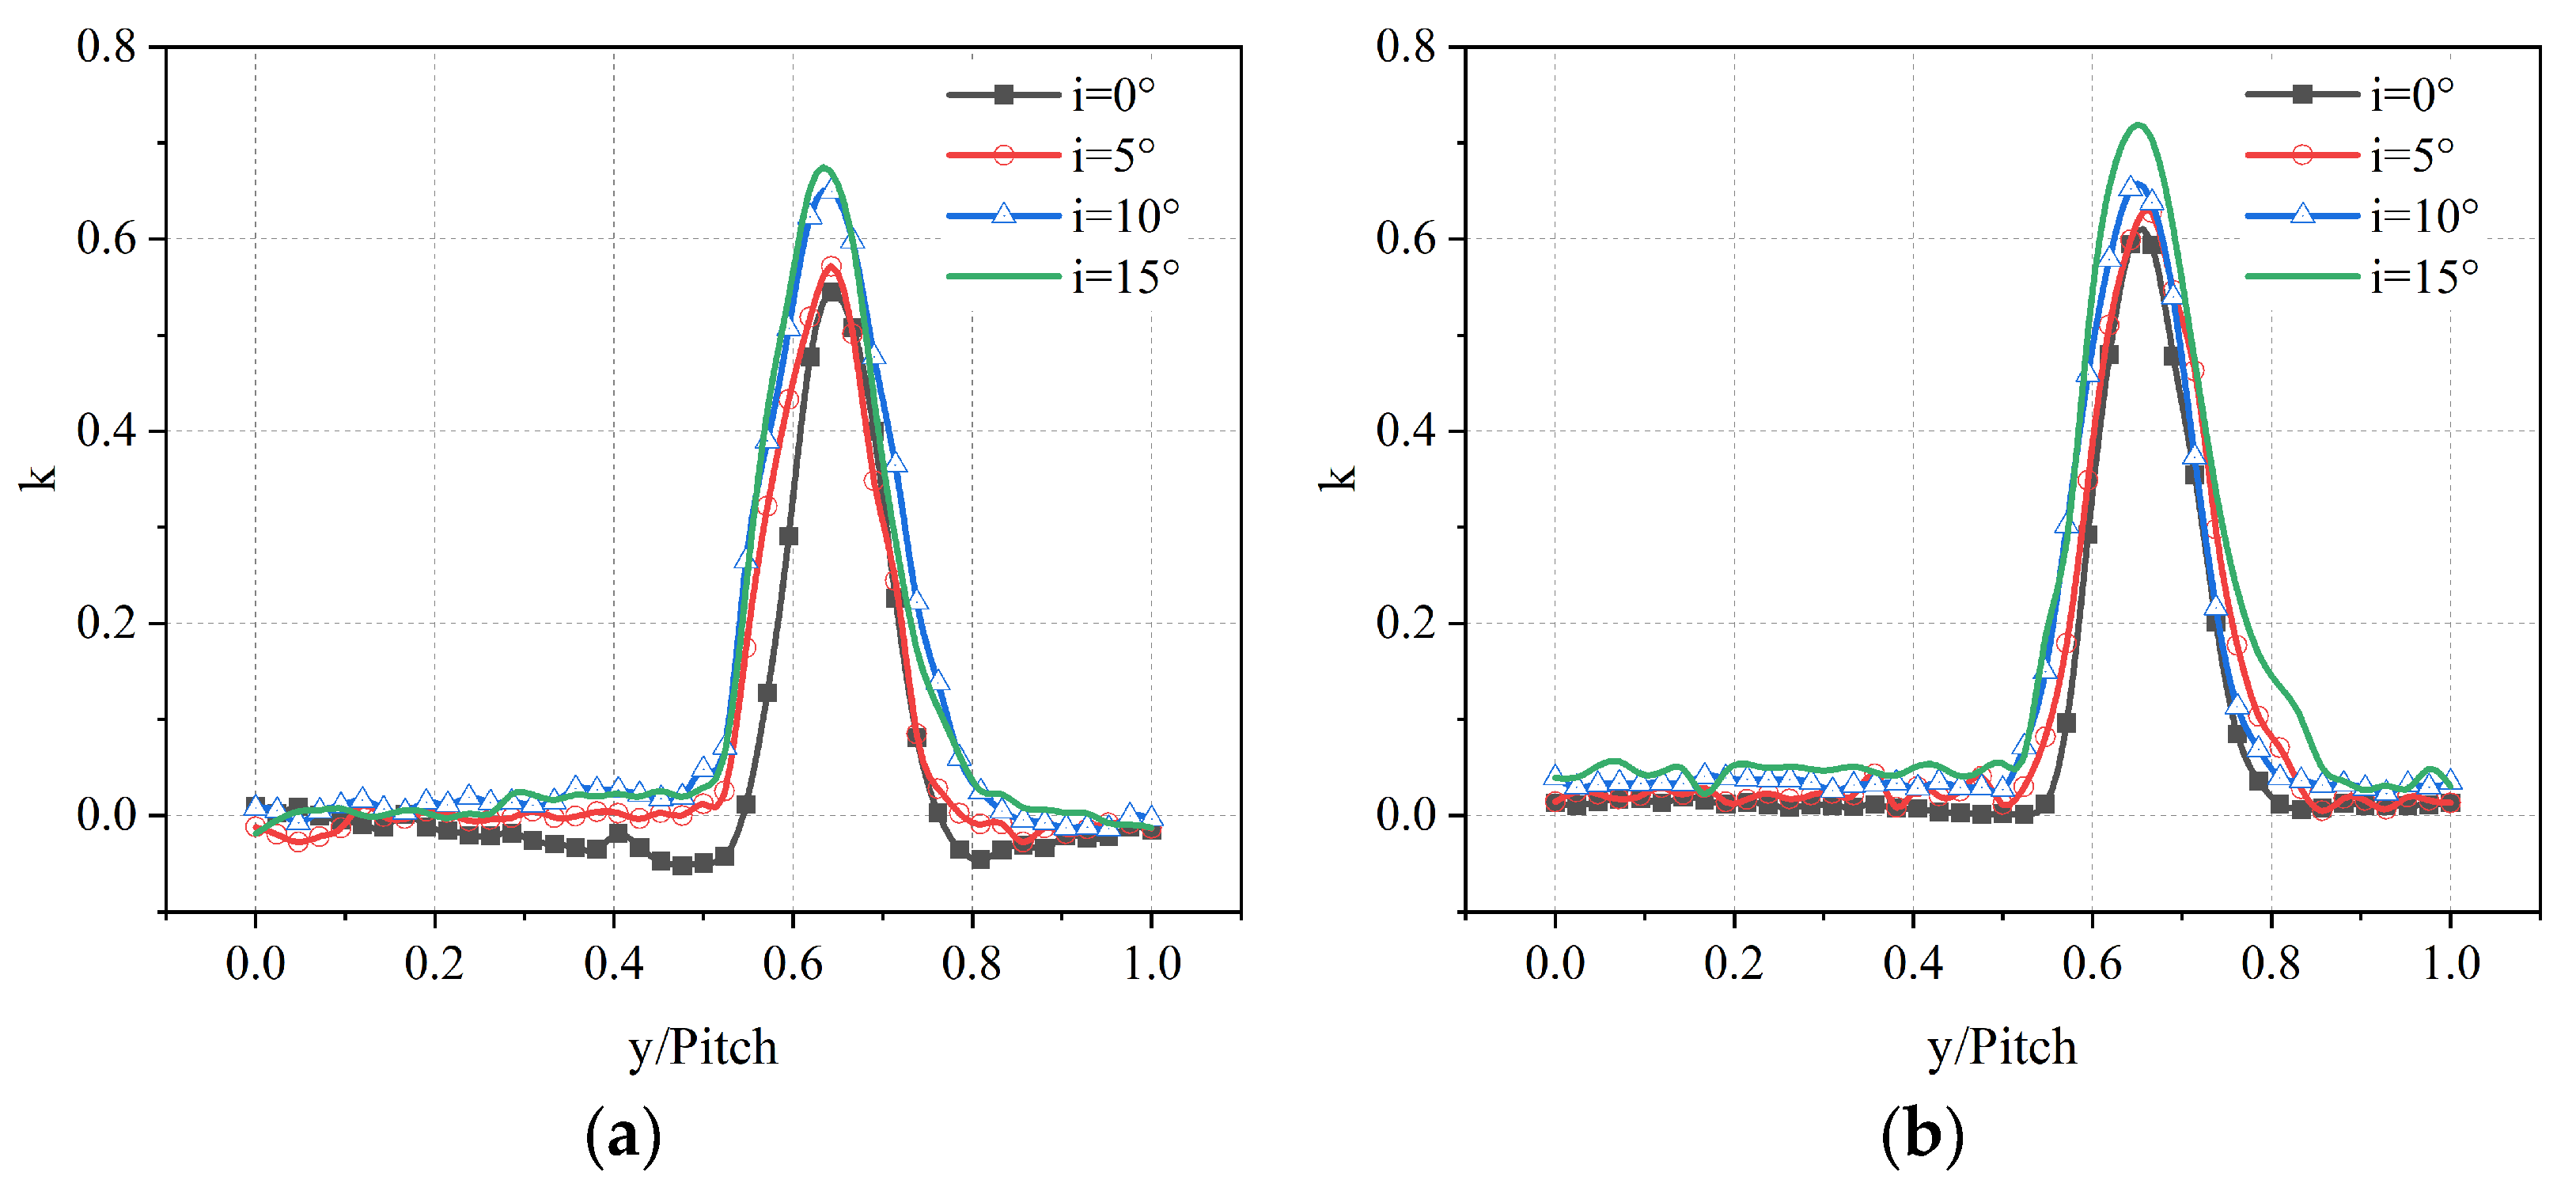
Figure 9 displays the circumferential distribution of the total pressure loss coefficient in the mid-span region of the cascade at the downstream 40% Cx at different incidence angle conditions. As can be seen from Figure 9, the high loss area at the cascade outlet corresponds to the cascade wake area. This is closely related to the separation bubble on the suction surface when the trailing edge radius remains unchanged. In the original cascade, as the inflow incidence angle increases, the size of the separation bubble on the suction surface also increases. This makes the wake width under high incidence angle conditions significantly larger than the 0° incidence angle condition. For example, the wake width increases by 9% at i = 5°. Although the wake width does not further increase at i = 10° and i = 15°, the loss coefficient peak value in the wake area increases by 26%. For the biomimetic cascade, as the incidence angle increases, the width of the wake area does not increase much. The wake area width at i = 15° only increases by 12% compared to the 0° incidence angle condition. This further verifies the previous discussion that the biomimetic cascade can effectively suppress the rapid increase in the size of the flow separation bubble with the incidence angle. Compared with the original cascade, although the wake width of the biomimetic cascade does not change much at i = 0°, it decreases by 5%, 7%, and 6% under the 5° to 15° conditions, respectively.
This phenomenon also verifies that the biomimetic cascade can suppress the size of the suction side separation bubble at high incidence angle conditions. However, the loss coefficient peak value in the wake area of the biomimetic cascade is increased compared to the original cascade. This may be related to the loss caused by the increased surface area of the biomimetic cascade and the dissipation induced by the vortex pairs. This shows that the impact of the biomimetic cascade mid-span section has two sides. On the one hand, it can reduce the profile loss by suppressing the separation on the suction surface. On the other hand, it will cause additional friction loss and vortex dissipation loss due to the cascade surface area increase and the generation of counter vortex. When i = 0°, the benefit of suppressing separation is not enough to offset the latter, which will cause an increase in biomimetic profile loss. On the contrary, under conditions with high incidence angles, the biomimetic cascade can bring profile loss benefits.
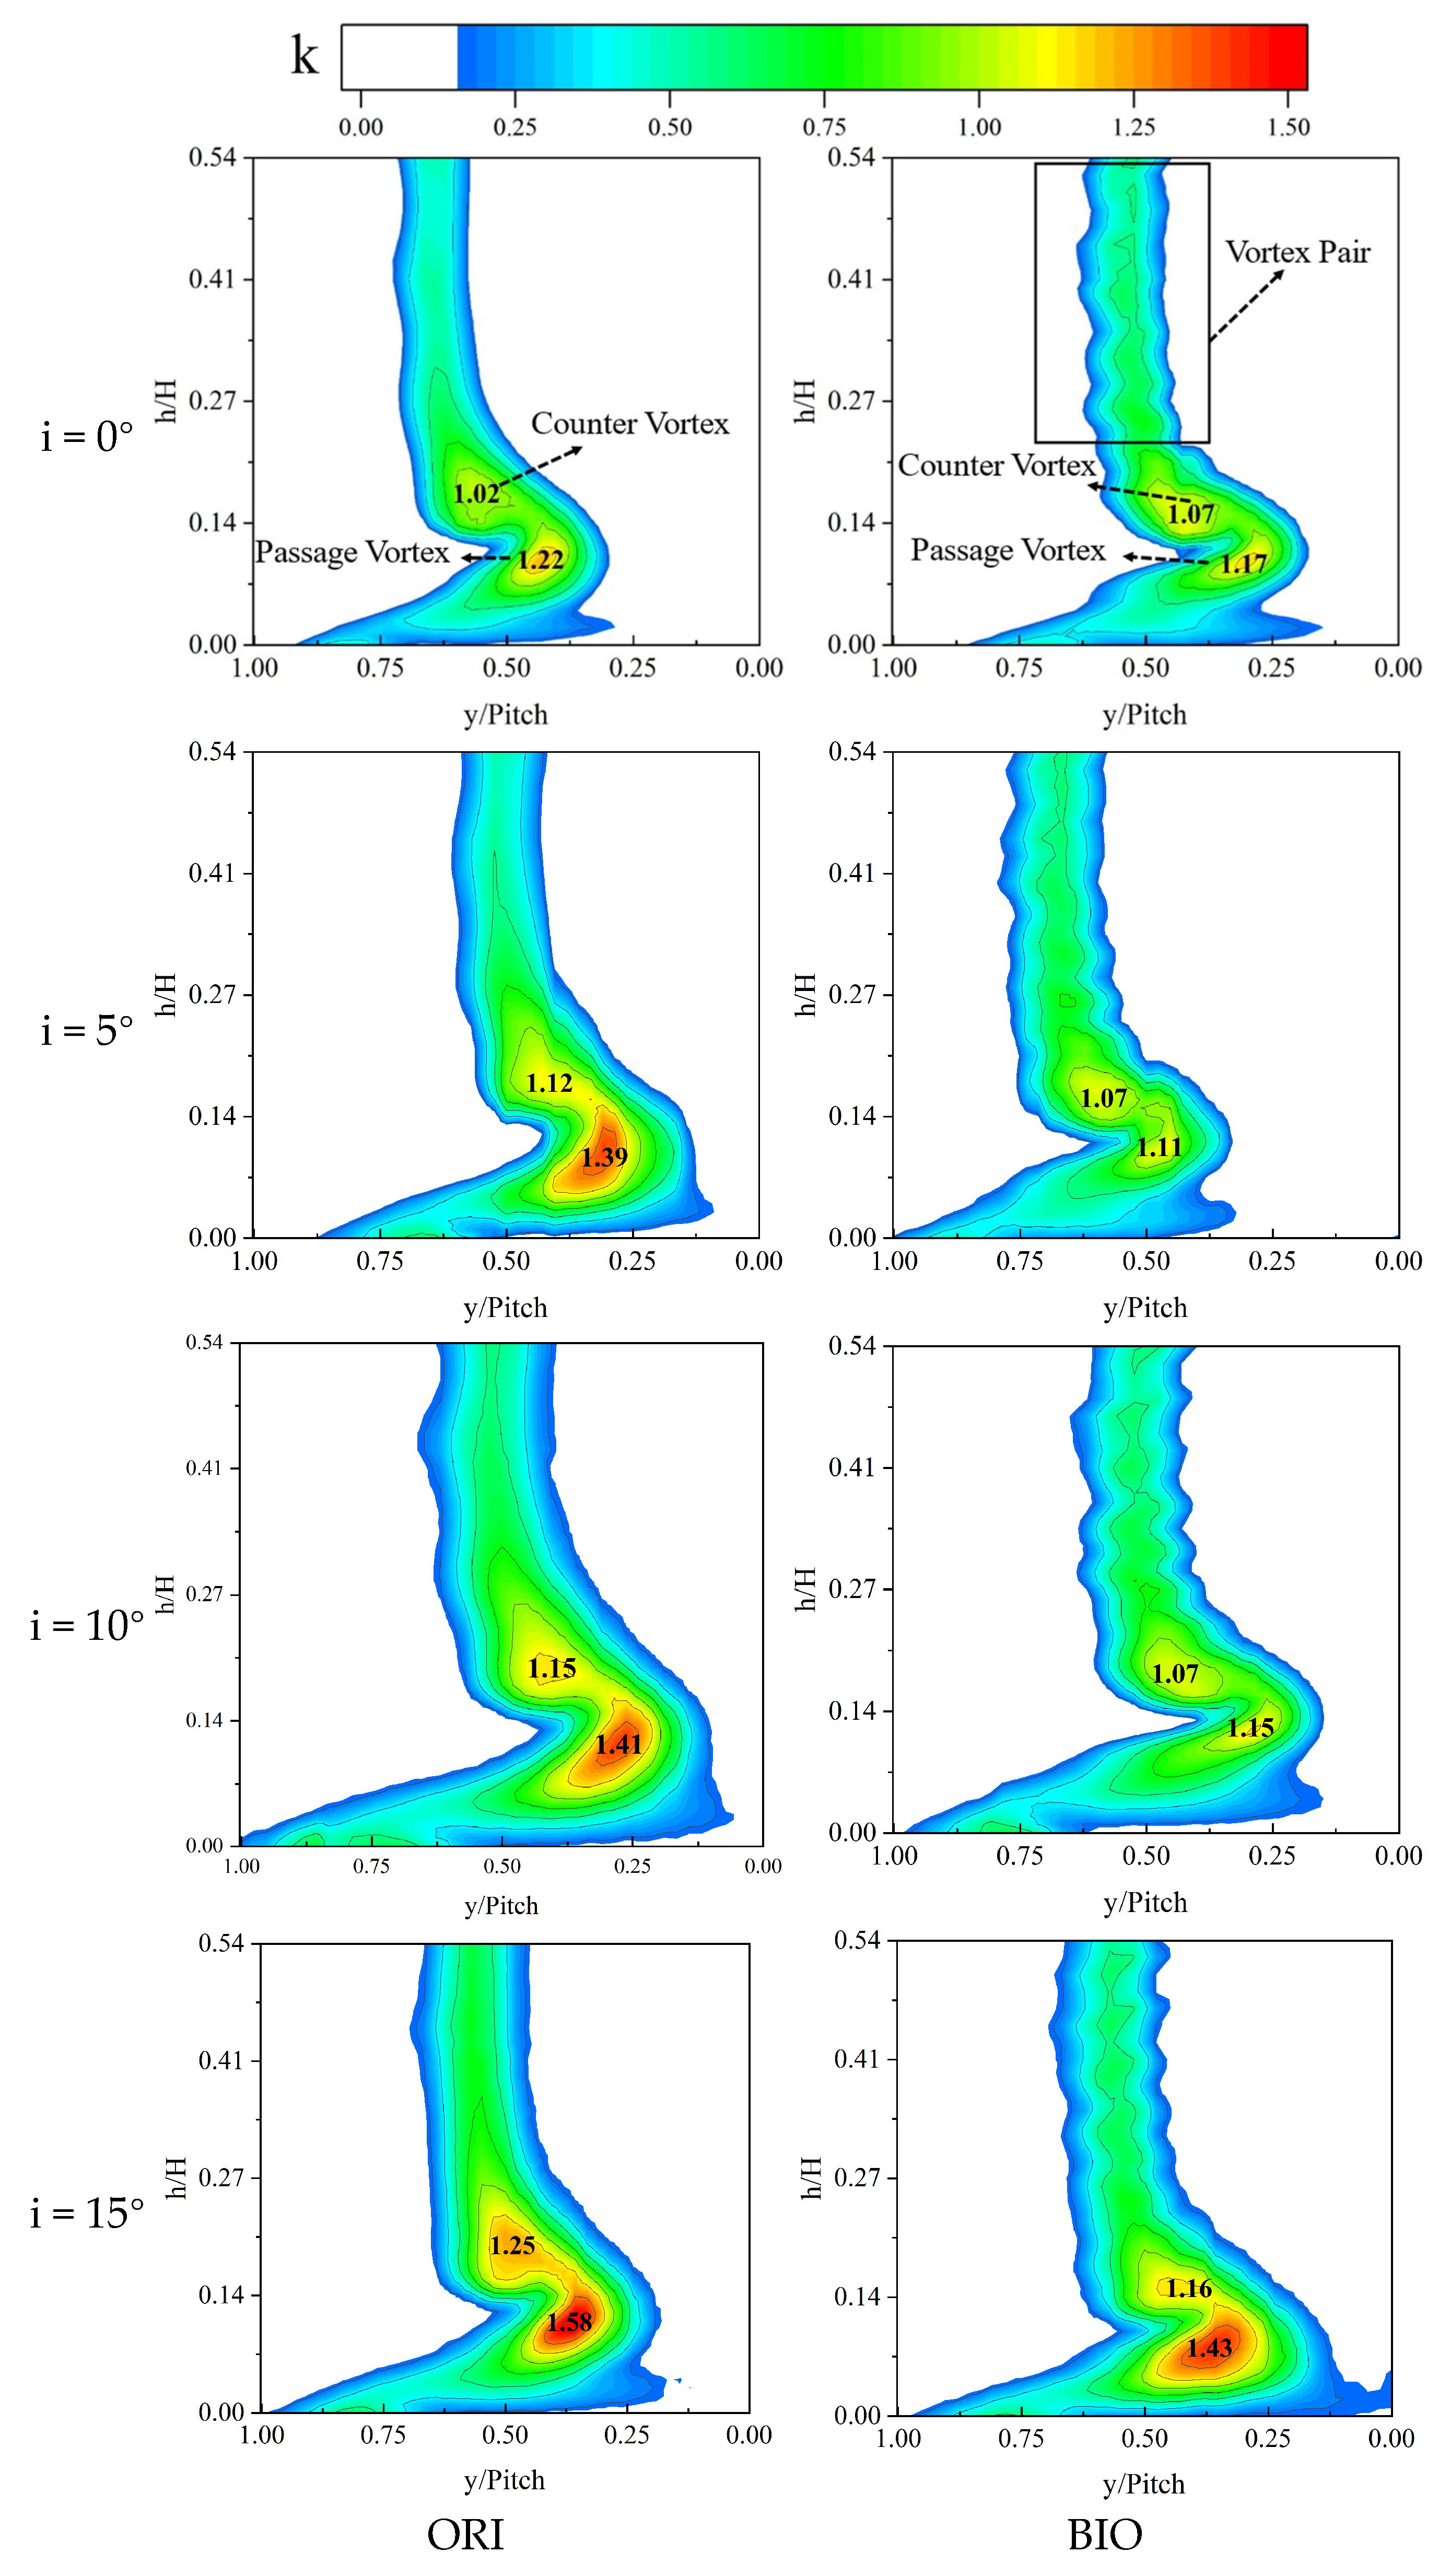
Figure 10 presents the contours of the streamwise vorticity coefficient (Cωs) and the secondary flow vector at the downstream 0.4Cx section under different incidence angle conditions for the two cascades. The black arrows in these pictures represent the direction and magnitude of the two-dimensional airflow velocity on this cross-section, ignoring the velocity component along the streamwise direction. The two-dimensional velocity vector map formed by these black arrows can help to analyze the motion of the secondary flow on this section. The maximum value of the streamwise vorticity is also marked in the figure. The magnitude of the streamwise vorticity can characterize the strength of the passage vortex and the counter vortex on this section. The range of the high streamwise vorticity area can also reflect the scale of the vortex to a certain extent. Unlike the original cascade, where there is basically no strong streamwise vortex area in the mid-span, a series of weak streamwise vortex pairs appear in the wake area in the mid-span of the biomimetic cascade (marked with a black frame in the figure). Each vortex pair corresponds exactly to one period of the biomimetic configuration, indicating that this is the counter vortex pair shed from the suction surface of the biomimetic configuration. As the incidence angle increases, this series of vortex pairs does not show significant changes, indicating that the strength of vortex pairs is not very sensitive to the change in the incidence angle. At the cascade end region, according to the secondary flow empirical model [28], it can be judged that there is a clear passage vortex and counter vortex core area, which is marked in the figure. Their vorticity directions are opposite, but the intensity is significantly higher than that of the surrounding flow field.
However, because of the large diameter of the seven-hole probe, it cannot be used to obtain the flow field data near the endwall, which means that the corner vortex cannot be identified. As the incidence angle increases, the vortices strength of two cascades’ end regions both increases. Among these, the passage vortex strength increases more obviously, and among the two cascades, the vortices of the original cascade are more significantly enhanced. In the original cascade, when the incidence angle increases from 0° to 10°, its passage vortex strength peak value increases by about 11%, and the counter vortex strength peak value increases by about 17%. However, when the incidence angle continues to increase to 15°, the passage vortex strength peak value suddenly increases by 67%, but the counter vortex strength peak value only increases by 2.5%. The sudden increase in passage vortex intensity under this condition may be related to the occurrence of large-scale three-dimensional flow separation bubbles on the suction surface. In the biomimetic cascade, the increase speed of its passage vortex peak value with the incidence angle is obviously weaker than the original cascade. At a 0° incidence angle, the passage vortex peak value of the biomimetic cascade is 10% lower than the original cascade. When the incidence angle increases to 15°, the passage vortex strength peak value of the biomimetic cascade is only 53% of the original cascade.
These phenomena show that the biomimetic cascade can suppress the development of the passage vortex. Especially under extreme high incidence angle conditions, the biomimetic cascade can avoid excessive development of the passage vortex, thereby benefiting the reduction in secondary flow loss. Under different incidence angles, although the counter vortex intensity of the biomimetic cascade end region has a certain degree of growth compared to the original cascade, the maximum increase is only 3.5%. Therefore, comparatively speaking, the key to the biomimetic cascade reducing the end region loss is to suppress the development of the passage vortex. However, it is worth noting that the vortex structure here can only be displayed on such a cross-section, including the strength and size of the vortex system, but cannot show the development process of the vortex system. The development process of the vortex system will be described in detail below.
Figure 11 displays the contours of the total pressure loss coefficient at the downstream 40% Cx section under the inflow incidence angles of 0~15° for both the original cascade and the biomimetic cascade. The peak loss coefficient of the high loss area is also marked. In the wake area of the mid-span (as marked by the black frame in the figure), when i ≤ 5°, the wake high loss area of the biomimetic cascade is wider than the original cascade. There are intermittent green high loss blocks in it, which do not exist in the original cascade. When i ≥ 10°, the width of the wake high loss area of the biomimetic cascade is slightly smaller than the original cascade. The area of the green block area representing high loss in the wake area is also smaller than the original cascade. The main reasons can be analyzed as follows: Under low incidence angle conditions, due to the increase in friction loss caused by the increase in surface area and the additional dissipation loss caused by the induced vortex pair, the profile loss in the biomimetic cascade mid-span is greater than the original cascade. When the incidence angles further increase, the size of the suction surface separation bubble also increases. Especially when large-scale open separation occurs, the profile loss in the blade mid-span will be dominated by separation loss. The biomimetic cascade can suppress flow separation, so the profile loss under high incidence angle conditions is reduced.
When comparing with the analysis of the vortices position and development process in the end region in Figure 10, it can be clearly seen in Figure 11 that there are two high-loss areas in the end region. These areas are dominated by the counter vortex and the passage vortex, as marked in Figure 11. As the incidence angle increases, both the range of the high loss area in the end region of the two cascades (as shown by the yellow and red blocks in the figure) and the peak loss coefficient increase to varying degrees. At the original cascade condition, when the incidence angle increases from 0° to +15°, both the high-loss area caused by the counter vortex and the passage vortex increase. The loss coefficient peak value also continues to increase. Among these, the expansion trend of the passage vortex along the circumferential direction is particularly obvious. The loss coefficient peak value of this area increases compared to the 0° incidence angle under the 15° incidence angle. The counter vortex also expands significantly in the circumferential and spanwise directions. The loss coefficient peak value of this area increases compared to the 0° incidence angle under the 15° incidence angle. For the original cascade, the area and peak loss coefficient of the passage vortex loss area are much larger than the counter vortex. This indicates that the passage vortex is the main loss source of the cascade end region loss.
For the biomimetic cascade, when i ≤ 10°, there is not much difference in the strength and peak loss coefficient of its counter vortex and passage vortex, with the difference in the peak loss coefficient being no more than 10%. When the incidence angle increases to 15°, the range and peak loss coefficient of the passage vortex in the end region of the biomimetic cascade suddenly increase. Although the counter vortex area also increases, its range and loss peak value are much smaller than the passage vortex. The difference in the peak loss coefficient of two increases to 24% under this condition. When i ≤ 10°, the range and peak loss of the high loss area in the end region of the biomimetic cascade under each condition are smaller than the original cascade. The increase speed of loss with the increase in the incidence angle is also slower. This is particularly significant in the comparison of the high-loss area caused by the passage vortex. When the incidence angle increases from 0° to 10°, the difference in the passage vortex loss peak value of the biomimetic cascade and the original cascade increases from 5% to 20%. Even under a 15° incidence angle condition, the loss coefficient peak value caused by the passage vortex of the biomimetic cascade is still 9% lower than the original cascade, and the counter vortex loss peak value is also 8% lower. This demonstrates that the biomimetic cascade can suppress the rapid growth of loss in a wide range of incidence angles. The main mechanism of action is to suppress the rapid increase in passage vortex loss in the end region. On the other hand, under each incidence angle condition, the height of the high loss area in the end region of the biomimetic cascade is mostly smaller than the original cascade, with the height difference being between 19% and 23%. This indicates that the biomimetic cascade can suppress the development of secondary flow in the spanwise direction in the end region, which is another reason for the biomimetic cascade to reduce flow loss.
Figure 12 provides a comparison of the spanwise distribution of the mass average total pressure loss coefficient at the cascade outlet of the downstream 40%Cx section under the 0° and 15° incidence angle conditions for the two cascades. The cascade end region is a high total pressure loss area. The two total pressure loss coefficient peak areas that appear correspond to the passage vortex and the counter vortex, indicating that the secondary flow in the end region is the main source of loss. In the original cascade, when the inflow incidence angle increases from 0° to 15°, the k peak values caused by the passage vortex and the counter vortex increase, respectively. The range of the high loss area in the end region increases by 7%H. For the biomimetic cascade, the mid-span area exhibits loss fluctuations. As known from the analysis above, this fluctuation is mainly caused by the counter vortex pairs in the cascade. The secondary flow loss remains the main loss source of the biomimetic cascade. As the inflow incidence angle increases, the k peak value in the end region also increases to some extent. The k peak values corresponding to the passage vortex and the counter vortex increase by 43% and 31%, respectively, which is significantly smaller than the increase in the original cascade. This indicates that the biomimetic cascade suppresses the increase in secondary flow loss with the change in incidence angle. On the other hand, as the incidence angle increases, the range of the high loss area in the end region of the biomimetic cascade does not increase significantly in the blade height direction, and it is smaller than the original cascade. Especially under the 15° incidence angle, the height of the high loss area in the end region of the biomimetic cascade is 6%H smaller than the original cascade. This indicates that the biomimetic cascade has a significant inhibitory effect on the development of secondary flow in the spanwise direction in the end region, and this inhibitory effect is still effective even under high incidence angle conditions. Comparatively, under a 0° incidence angle, the losses in the mid-span and end regions of the biomimetic cascade are greater than the original cascade. However, the situation is exactly the opposite at a 15° incidence angle. This shows that the impact of the biomimetic cascade on the end region has two aspects. Under a 0° incidence angle, the secondary flow in the end region of the biomimetic cascade is not stronger than the original cascade, but its end region loss is higher than the latter. This may be caused by its secondary flow loss superimposed on the additional friction loss and vortex dissipation loss of the biomimetic cascade surface. Under high incidence angle conditions, the benefit brought by the inhibitory effect of the biomimetic cascade on the secondary flow in the end region will be greater than the above two additional losses. At this time, the advantage of the biomimetic cascade in reducing loss is reflected.
3.2. Analysis of Flow Loss Reduction Mechanism of Biomimetic Configuration Blade (CFD)
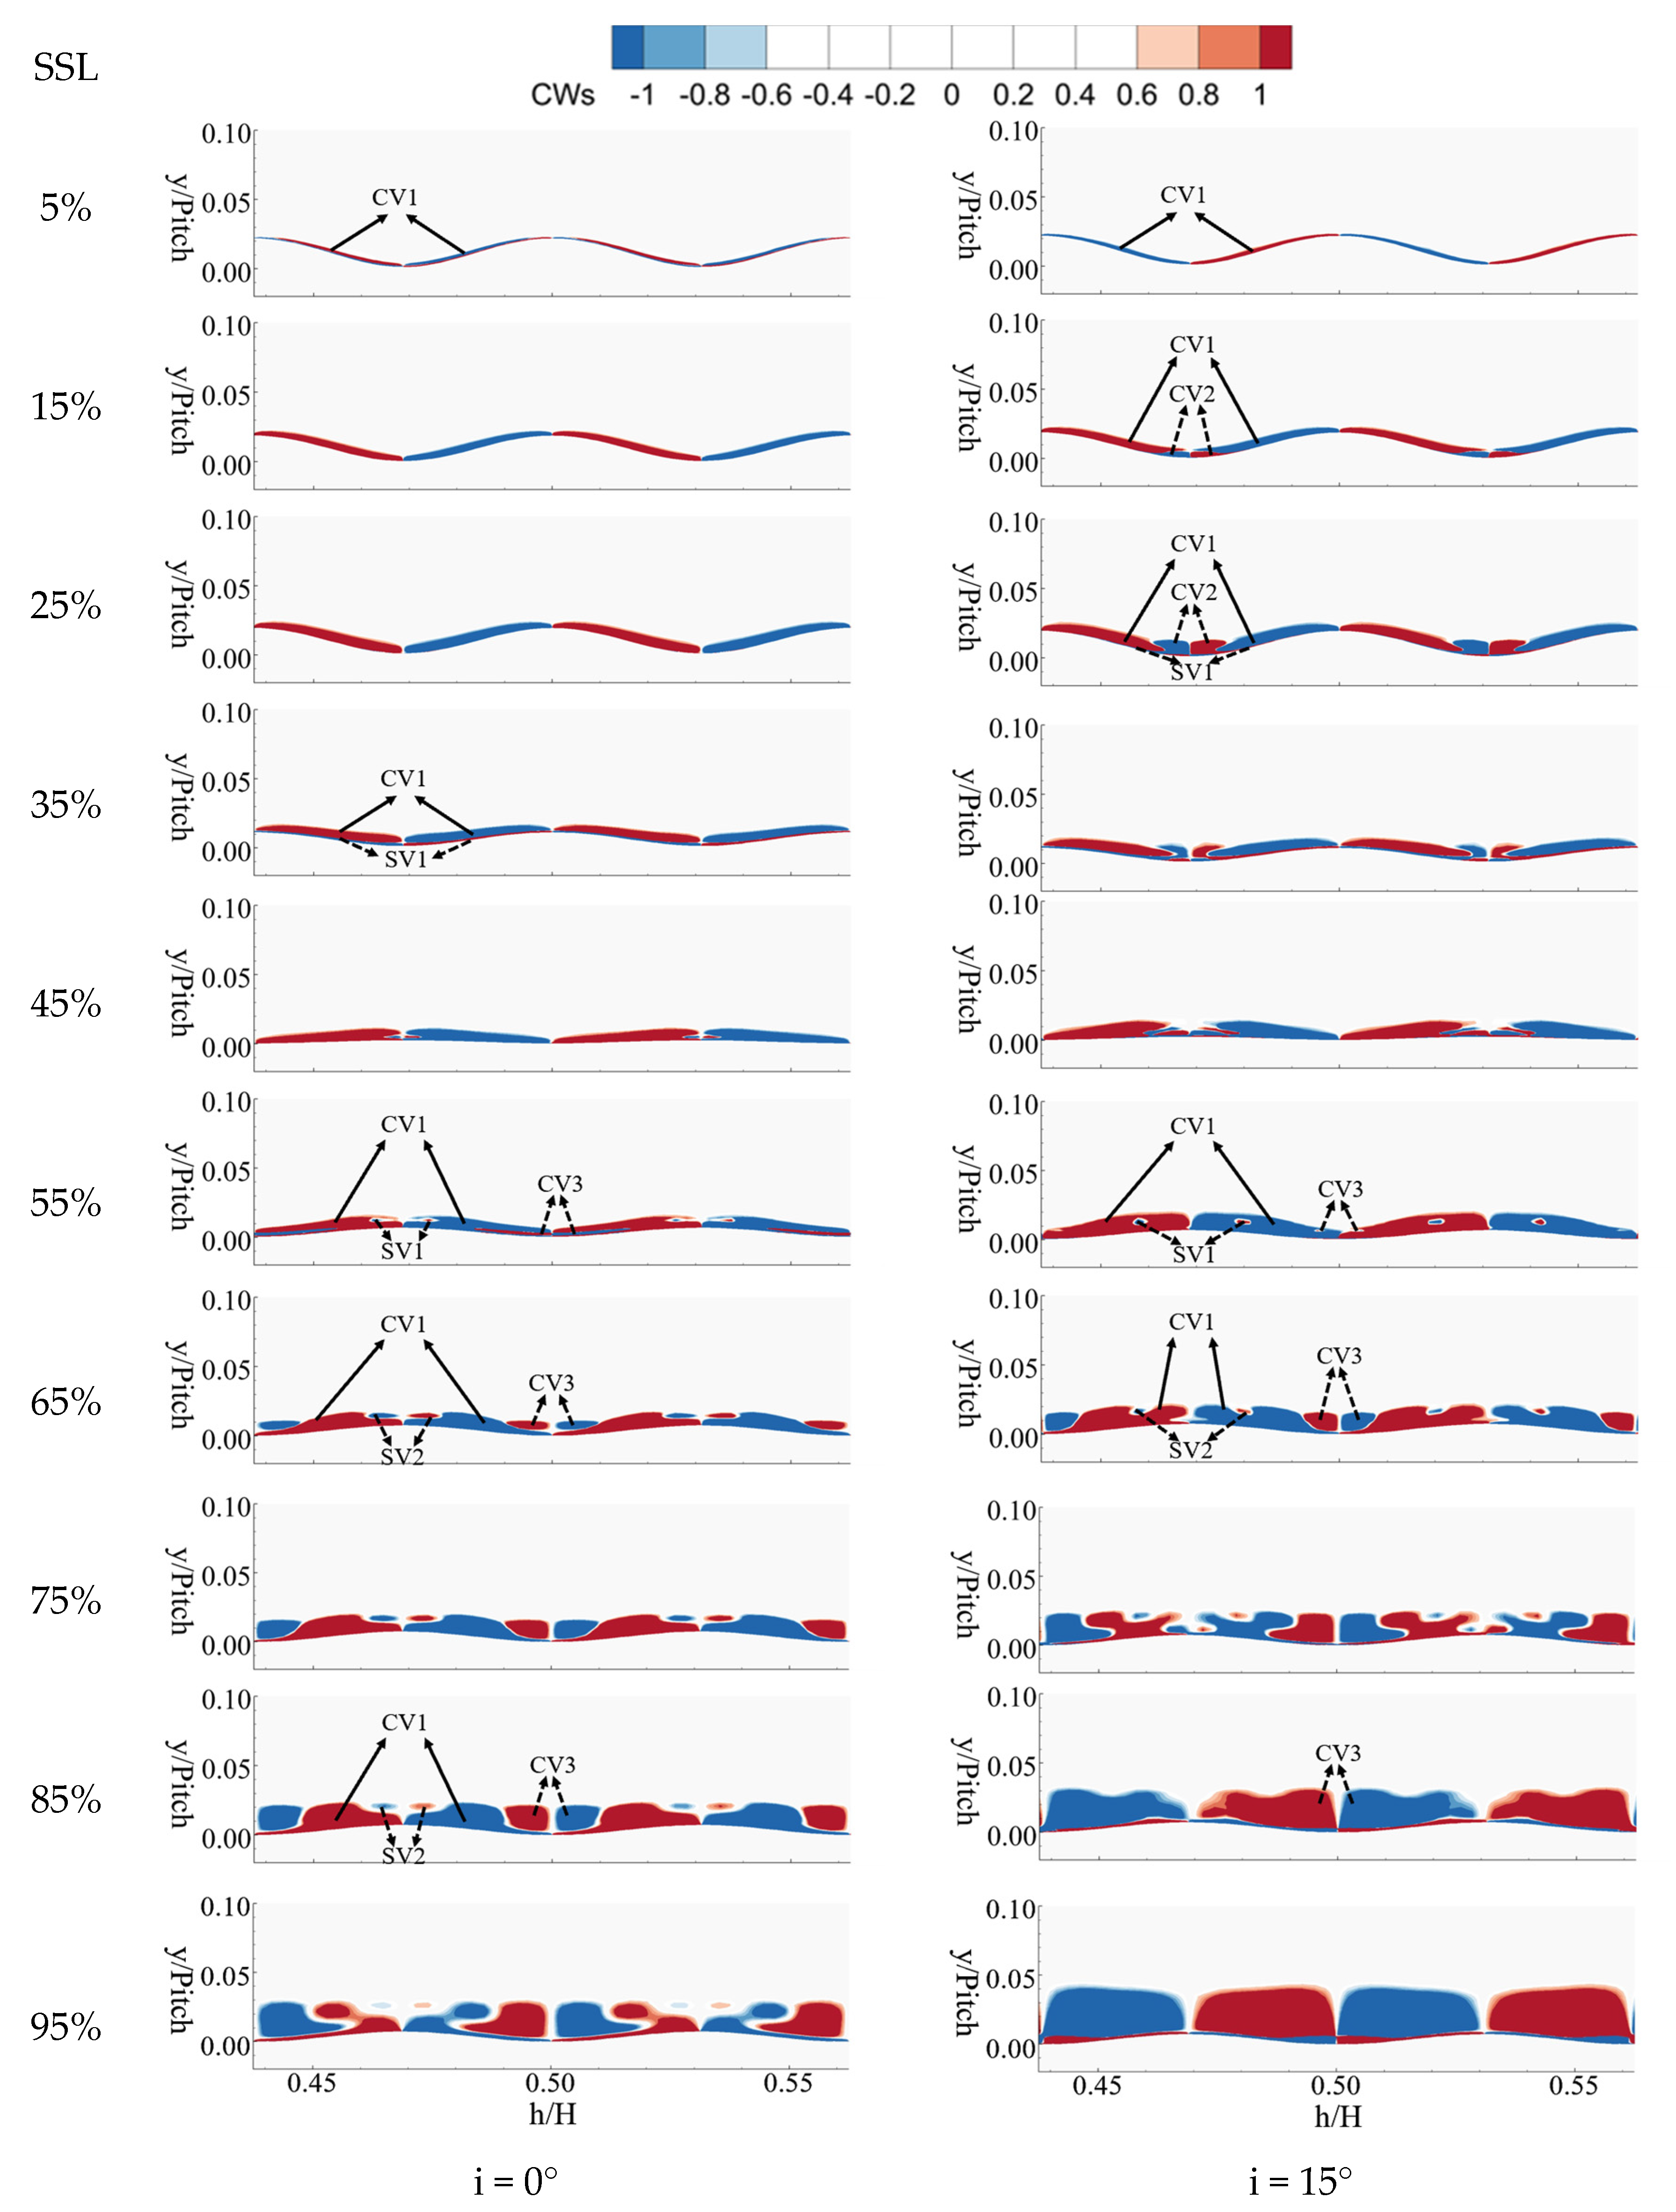
Given the limitations of experimental testing, high-precision simulation results will be used to conduct a detailed analysis of the formation and evolution process of the vortices and secondary flow in the biomimetic cascade. This will reveal the mechanism of the biomimetic cascade suppressing flow loss within a wide incidence angle range. Figure 13 displays the contours of the streamwise vortex coefficient distribution on the section perpendicular to the suction surface at different axial positions of the biomimetic cascade under 0° and 15° incidence angle conditions. Under a 0° incidence angle condition, due to the influence of the leading-edge geometry, a pair of weaker counter-rotating vortices will be generated at each valley profile depression on the suction surface of the biomimetic configuration blade near the leading edge (as the CV1 shown in the 5% SSL section in Figure 13). This series of vortices will continue to strengthen as they move downstream. At the 35% SSL position, affected by the change in blade surface curvature, the CV1 that develops from the leading edge gradually lifts and leaves the blade surface. A pair of new counter-rotating vortices will be generated in the low-energy fluid between CV1 and the surface, as shown in the SV1 in Figure 13. The rotation direction of this counter vortex pair is just opposite to CV1. Affected by the blade surface curvature, these vortices continue to lift as they develop downstream, and are continuously sucked by CV1. By the time they reach the 55% SSL section, they are basically exhausted. At the same position, another pair of counter-rotating vortices, SV2, which is the suction surface separation vortex, begins to appear from the 65% SSL section. This vortex develops to the maximum at 75% SSL, and then is continuously dissipated by CV1. For the biomimetic cascade studied in this paper, its suction surface essentially completes the surface geometry conversion at the 55% SSL position. This means that the position of the peak is simply converted into the valley, and vice versa. After the conversion, a series of counter vortex pairs opposite to CV1 are generated at the new valley position, as shown in the CV3 on the 55% SSL section in the figure.
As it develops downstream, the depth of the surface valley depression increases, and CV3 also continues to strengthen (as indicated by the change in the area of the high vortex region of CV3 on the 55% SSL–85% SSL section). It will also squeeze and suck the CV1 on both sides, thereby suppressing the further growth of CV1. From the 85% SSL section to the 95% SSL section, CV1 is continuously decreasing. The vortices generated by the biomimetic cascade are beneficial in suppressing flow separation (a further analysis will be conducted later). However, excessively strong vortices will inevitably result in additional dissipation losses. Therefore, the inhibitory effect of the newly formed reverse vortex pair downstream of the conversion belt on the excessive development of the upstream counter vortex pair is beneficial in reducing the profile loss of the biomimetic cascade.
Under a 15° incidence angle condition, the development process of the vortices on the suction side surface bears similarity to that under a 0° incidence angle condition, albeit with certain differences. The counter vortex pair CV1, generated near the leading-edge valley, is stronger than in the 0° incidence angle condition at the same downstream position. Downstream of the 65%SSL section, CV1 is rapidly attenuated by the strong suction effect of the reverse counter vortex pair CV3. Its strength will be significantly smaller than under the 0° incidence angle condition, and it quickly dissipates with the increase in downstream suction. Influenced by the incidence angle, CV1 lifts to leave the surface at 15% SSL, which is significantly earlier than the 35% SSL departure position under a 0° incidence angle condition. The CV1 that leaves surface induces a group of new reverse counter-rotating vortices (as shown in CV2 in the figure). These vortices strengthen as they develop downstream, and their strength can reach a level comparable to CV1. They, in turn, will squeeze and suck the CV1 on both sides, which will be beneficial in suppressing the rapid development of CV1. Under a 15° incidence angle condition, after the biomimetic cascade suction surface shape conversion is completed, a reverse counter vortex pair CV3 is also generated at the 55% SSL section. This vortex pair quickly strengthens downstream, and the strength of CV3 can be clearly seen on the 65% SSL–75% SSL section to be significantly larger than under the 0° incidence angle condition. By the time it reaches the 85% SSL section, CV3 has completed the suction process of CV1, which is significantly earlier than under the 0° incidence angle condition. The fully developed CV3 completely covers the entire mid-span suction surface of the blade after this section. The rapid development of CV3 may be related to the large-scale three-dimensional open separation that occurs near the trailing edge suction surface under a 15° incidence angle condition. Although it quickly suppresses the further development of CV1 and reduces the dissipation loss of CV1, its own dissipation loss will increase sharply. This is one of the reasons for the increase in profile loss under this condition.
Figure 14 illustrates the limiting streamlines of the suction surface in the mid-span of the two cascades and the turbulence kinetic energy (TKE) contours on different sections under 0° and 15° incidence angle conditions. The separation line (S) and reattachment line (R) are also marked in the figures. The TKE within the boundary layer can reflect the intensity of energy exchange between the boundary layer and the mainstream, and can also characterize the magnitude of the viscous dissipation loss in the boundary layer. For the original cascade, when the incidence angle is 0°, the flow on the blade mid-span exhibits strong two-dimensionality. The boundary layer separates at 64% of the suction surface length (SSL) and reattaches to the surface at 73% SSL. Upstream of the separation bubble, the boundary layer on the suction surface of the cascade is laminar, and its TKE is very low (no high-TKE area is visible in the figure). The TKE near the surface increases until the separation bubble reattaches. At this point, it is generally believed that the laminar boundary layer has fully transitioned to a turbulent boundary layer. The high TKE area continues to develop as the turbulent boundary layer develops, as indicated by the high TKE area near the cascade trailing edge. When the incidence angle increases to 15°, the separation point of the boundary layer is at 56% SSL. The boundary layer upstream of the separation bubble remains laminar, and the TKE is still low (no high-turbulence area is visible in the figure upstream of the separation bubble). However, the TKE inside the separation bubble increases significantly, and the TKE on the 85% SSL section under the 15° condition is significantly larger than under the 0° condition. Driven by high TKE, the reattachment line of the boundary layer under this condition advances to 69% SSL. However, downstream of the reattachment point, the boundary layer exhibits large-scale three-dimensional flow separation due to the influence of secondary flow in the end region (a detailed analysis will follow), and it continues to the cascade trailing edge. Near the surface inside this large-scale open separation bubble, the TKE increases sharply. Excessive TKE indicates a significant increase in profile loss under this condition, which aligns with the experimental test results.
In the biomimetic cascade, under a 0° incidence angle, the flow on the mid-span surface of the blade exhibits strong three-dimensionality, with the limiting flow direction moving from the peak to the valley area. Influenced by the three-dimensional surface, the separation and reattachment line shifts such that “the peak moves upstream, the valley moves downstream” compared to the original cascade condition, resulting in a shortened separation bubble. This occurs because the vortex pair (CV1 in Figure 11) induced by the biomimetic cascade increases the TKE within the laminar boundary layer upstream of the separation bubble (as indicated by the high TKE band in the figure). This accelerates the energy exchange between the boundary layer and the mainstream area, thereby suppressing flow separation to some extent. However, under a 0° incidence angle, the separation bubble is not large, and the benefit of suppressing separation is reduced. Downstream of the separation bubble, as the upstream CV1 and the downstream reverse CV2 develop, the high TKE band within the boundary layer becomes stronger than in the original cascade, particularly in the area corresponding to CV2. This suggests an increase in the viscous dissipation loss of the vortex pair downstream of the separation bubble in the biomimetic cascade. Under the 0° incidence angle condition, the advantage of the biomimetic cascade in suppressing separation loss is slightly outweighed by the increased dissipation loss of the vortex pair. This aligns with the experimental measurement result that “under a 0° incidence angle, the profile loss of the biomimetic cascade is slightly larger than that of the original cascade”. When the incidence angle increases to 15°, the enhancement of the induced CV1 results in a high TKE band appearing on the section far upstream of the separation bubble, consequently reducing the length and height of the separation bubble in the biomimetic cascade. Downstream of the separation bubble, the biomimetic cascade does not exhibit large-scale open separation. Instead, it divides the separation bubble into isolated, smaller separation bubbles confined to the valley. The downstream separation point is significantly delayed compared to the original cascade, and its corresponding downstream high TKE area is also significantly lower than in the original cascade. This indicates that the vortex pair induced by the biomimetic cascade suppresses the two separation bubbles before and after being under a high incidence angle. This analysis explains the significant reduction in profile loss of the biomimetic cascade under high incidence angle conditions.
The secondary flow in the end region significantly influences the flow in the cascade channel and is a primary contributor to cascade loss. The flow in the end region of the LPT is complex, exhibiting typical strong three-dimensional characteristics. The flow characteristics in the LPT’s end region are primarily manifested in the evolution of the passage and horseshoe vortices, the formation of the corner vortex, the impact of the counter vortex, and the separation bubble on the suction surface. These flow phenomena exhibit unique dynamic behaviors and have a strong interdependence [29]. The streamwise vortex inducted by the surface of the biomimetic configuration turbine blade, coupled with the secondary flow in the end region, complicates the development of the secondary flow and significantly impacts the flow state throughout the cascade. Consequently, the subsequent discussion will focus on the influence mechanism and control method of the biomimetic configuration turbine blade on the secondary flow in the end region.
Figure 15 illustrates the distribution of limiting streamlines in the end region of two cascades under 0° and 15° incidence angle conditions. The limiting streamlines on the blade surface clearly identify the positions of the corner vortex and passage vortex in the end region. The positions of the separation and reattachment lines, denoted by S and R respectively, can also be determined. Here, S1 and R1 represent the separation and reattachment lines of the suction surface boundary layer, R2 denotes the reattachment line of the corner vortex, S3 is the separation line of the passage vortex, and R4 is the reattachment line of the wall vortex. The trailing edge recirculation area is represented by A and B. A comparison of the limiting streamlines of the original cascade surface under 0° and 15° inflow conditions (Figure 15a,b) reveals that under the 0° inflow condition, the separation area A1 on the blade surface is larger than B1. However, under the 15° inflow condition, the open separation on the suction surface merges with the trailing edge recirculation area in the end region, forming a larger vortex area, A4. Similarly, a comparison of the limiting streamlines of the biomimetic cascade’s end region surface under the same inflow conditions (Figure 15c,d) shows that the separation area B2 of the biomimetic cascade’s secondary flow under the 0° inflow condition is larger than that of the original cascade, while A2 is smaller than in the original cascade. Under the 15° inflow condition, the separation vortices A3 and B3 in the end region of the biomimetic blade are significantly larger than under the 0° incidence angle condition. However, unlike the original cascade, there is no large-scale open separation.
Paying attention to the development of the secondary flow in the end region of the biomimetic cascade. The contours and streamline diagram of the original and biomimetic cascades’ secondary flow streamwise vortex coefficient are shown in Figure 16. Figures reveal that under the 0° inflow condition, the original cascade (Figure 16a) clearly identifies the wall vortex (WV), passage vortex (PV), suction side leg of the horseshoe vortex (HVs), pressure side leg of the horseshoe vortex (HVp), and other secondary flow vortex structures. And the flow from the inlet boundary (RBL) appear to be drawn and elevated by the HVs. At this stage, the scale of the secondary flow in the inlet boundary layer fluid is small, resulting in a small-scale separation recirculation zone near the trailing edge position. For the biomimetic cascade (Figure 16c), the structure composition of the secondary flow vortex is similar to that of the original cascade. However, the strength of the HVs and WV in its vortices is slightly higher, leading to a minor increase in the secondary flow loss in the biomimetic cascade’s end region. However, when the incidence angle increases to 15° (Figure 16b), the size of the separation recirculation zone in the original cascade dramatically increases, covering the entire end region and extending into the mid-span. Consequently, the end region primarily consists of separation vortices, leading to the destruction of the secondary flow structure. As seen in Figure 16d, the secondary flow structure of the biomimetic cascade remains clear, with no large-scale separation zone. The separation zone only appears near the trailing edge position, and the range of the secondary flow is significantly smaller than in the original cascade. This is one of the reasons why the biomimetic cascade can effectively reduce flow loss under large incidence angles.
The development of vortices in the end region of the biomimetic cascade is the focus of this study. As depicted in Figure 16c, the four contours are labeled as O1 to O4, these four planes are located at 52% SSL, 68% SSL, 84% SSL, and 94% SSL, respectively. It is observed that when the passage vortex (PV) begins to approach the suction side (at the O1 section in the figure), the counter-rotating vortex pair (CV) induced by the biomimetic cascade surface at O1 has the opposite direction to the PV. This movement allows CV to suppress the development of PV. As the fluid continues to move downstream, PV rises, crossing the “peak” in the blade rear section. Due to the depression and protrusion conversion of the biomimetic cascade (as analyzed in Figure 13), there is a tendency to induce the reverse CV near PV (as shown in the O3 and O4 sections in the figure). This suppresses the further enhancement of PV. This trend aligns with the direction of the wall vortex (WV), promoting WV enhancement. This phenomenon is also observed in Figure 16c. The biomimetic cascade alters the direction of the vortex pair at the leading and trailing edge positions through the conversion of surface depression and protrusion. This effectively suppresses the development of PV throughout its development process, thereby cleverly restricting the development of PV. Under the 0° inflow incidence angle (as seen in Figure 16a), the strength of the secondary flow vortex is weak, and there is no large-scale separation. The flow organization in the cascade is good, eliminating the need to suppress the secondary flow. At this stage, the CV strength produced by the biomimetic cascade is also weak, and its suppression effect on PV is not significant. However, it does have a strengthening effect on WV, but the additional loss caused is minimal. As the incidence angle increases and the strength of the secondary flow vortices sharply rises, the strength of CV also increases. At this point, the suppression effect on the secondary flow outweighs the additional loss caused by CV itself, resulting in a decrease in the secondary flow loss of the biomimetic cascade at large incidence angles.
4. Conclusions
A biomimetic cascade with a seal whisker structure was designed based on a high-loading low-pressure turbine cascade (Zw = 1.36), and its flow mechanism and aerodynamic performance were studied using experimental and numerical methods under the incidences of 0° to 15°. After comparison with the original cascade, the conclusions can be summarized as follows:
- The biomimetic cascade induces a series of counter-rotating vortex pairs from the leading edge. Another series of vortex pairs rotating in the opposite direction are generated downstream of its profile conversion band. Their interaction accelerates the dissipation of the upstream vortex pairs, thus preventing its overdevelopment and minimizing the additional vortex dissipation loss. It is evident that the position of the conversion band is a crucial parameter affecting the performance of the biomimetic cascade.
- The counter-rotating vortex pair induced by the biomimetic cascade accelerates the energy exchange between the boundary layer and the mainstream. This is beneficial in suppressing the flow separation on the suction surface, especially the large-scale flow separation under the condition with a high incidence angle. In the end zone, the induced counter-rotating vortex pair also enhances the dissipation of the pressure surface branch of the horseshoe vortex, which can suppress the development of the passage vortex in the end zone.
- The undulating wrinkles of the biomimetic cascade profile also suppress the development of the secondary flow in the end zone in the spanwise direction. Especially under the conditions of a high incidence angle, it suppresses the development of large-scale separation in the end zone in the spanwise direction.
- The biomimetic cascade also has a defect: its induced counter-rotating vortex not only brings additional dissipation loss but also enhances the complexity of the secondary flow in the end zone. Its increased surface area also results in additional friction loss.
- At the 0° incidence angle, the additional loss brought by the biomimetic cascade holds a slight advantage, and its profile loss is slightly greater than that of the original cascade. However, when the incidence angle exceeds 5°, the loss reduction effect of the biomimetic cascade is sufficient to offset its additional loss. And its profile losses are lower than those of the original cascade. Under the condition of i = 15°, the profile loss of the biomimetic cascade is 70% lower than that of the original cascade.
Author Contributions
Conceptualization, H.D., Y.Z. and Z.L.; methodology, H.D., X.L. and Z.L.; software, Z.L. and G.X.; validation, X.O., H.Y., Y.H. and G.L.; formal analysis, Z.L. and H.D.; investigation, H.D.; resources, Z.L.; data curation, H.D. and Z.L.; writing—original draft preparation, H.D. and Z.L.; writing—review and editing, Z.L., Y.Z., Z.L., X.L., G.X., X.O., H.Y., Y.H. and G.L.; visualization, H.D.; supervision, G.X.; project administration, X.L.; funding acquisition, Y.Z. and Z.L. All authors have read and agreed to the published version of the manuscript.
Funding
Science Center for Gas Turbine Project (P2022-DC-II-001-001, P2022-B-II-008-001).
Data Availability Statement
Due to privacy restrictions, we cannot share our research data.
Conflicts of Interest
The authors declare no conflicts of interest.
References
- Hourmouziadis, J. Aerodynamic design of low pressure turbines. AGARD, Blading Design for Axial Turbomachines 40 p(SEE N 89-27661 22-07), 1989.
- LaGraff, J.E.; Ashpis, D.E. Minnowbrook III: 2000 Workshop on Boundary Layer Transition and Unsteady Aspects of Turbomachinery Flows; NASA/CP-2001-210888; NASA: Hanover, MD, USA, 2001.
- Sun, D.-W.; Qiao, W.-Y.; Xu, K.-F.; Li, W. Influence of different incidences on loss in turbine cascade. J. Aerosp. Power 2008, 23, 1232–1239. [Google Scholar]
- Miller, C.J.; Shyam, V.; Rigby, D.L. Multifunctional LPT for Core Noise Reduction, Improved Efficiency, and Nitrogen Oxide (NOx) Reduction; NASA: Hanover, MD, USA, 2013; 66p.
- Bloxham, M.; Reimann, D.; Crapo, K.; Pluim, J.; Bons, J.P. Synchronizing separation flow control with unsteady wakes in a low-pressure turbine cascade. J. Turbomach. 2009, 131, 021019. [Google Scholar] [CrossRef]
- Corke, T.C.; Enloe, C.L.; Wilkinson, S.P. Dielectric Barrier Discharge Plasma Actuators for Flow Control. Annu. Rev. Fluid Mech. 2010, 42, 505–529. [Google Scholar] [CrossRef]
- Bohl, D.G.; Volino, R.J. Experiments with three-dimensional passive flow control devices on low-pressure turbine airfoils. J. Turbomach. 2006, 128, 251–260. [Google Scholar] [CrossRef]
- Sun, S.; Lei, Z.; Zhu, J. Effects of roughness on boundary layer of ultra-high-lift low-pressure turbine. J. Propuls. Technol. 2014, 35, 347–355. [Google Scholar]
- Carreira Pedro, H.; Kobayashi, M. Numerical Study of Stall Delay on Humpback Whale Flippers. In Proceedings of the 46th AIAA Aerospace Sciences Meeting and Exhibit, Reno, NV, USA, 7–10 January 2008; American Institute of Aeronautics and Astronautics: Reston, VA, USA, 2008. [Google Scholar]
- Weber, P.W.; Howle, L.E.; Murray, M.M. Lift, drag, and cavitation onset on rudders with leading-edge tubercles. Mar. Technol. SNAME News 2010, 47, 27–36. [Google Scholar] [CrossRef]
- Watts, P.; Fish, F.E. The influence of passive, leading edge tubercles on wing performance. In Proceedings of the 12th International Symposium on Unmanned Untethered Submersible Technology, Durham, NH, USA, 27–29 August 2001; pp. 2–9. [Google Scholar]
- Johari, H.; Henoch, C.; Custodio, D.; Levshin, A. Effects of leading-edge protuberances on airfoil performance. AIAA J. 2007, 45, 2634–2642. [Google Scholar] [CrossRef]
- Chong, T.P.; Vathylakis, A. On the aeroacoustic and flow structures developed on a flat plate with a serrated sawtooth trailing edge. J. Sound Vib. 2015, 354, 65–90. [Google Scholar] [CrossRef]
- Arce León, C.; Merino-Martínez, R.; Ragni, D.; Avallone, F.; Snellen, M. Boundary layer characterization and acoustic measurements of flow-aligned trailing edge serrations. Exp. Fluids 2016, 57, 182. [Google Scholar] [CrossRef]
- Vathylakis, A.; Chong, T.P. On the turbulent boundary layers developed on flat plate with a serrated trailing edge. In Proceedings of the 19th AIAA/CEAS Aeroacoustics Conference, Berlin, Germany, 27–29 May 2013. AIAA 2013-2170. [Google Scholar]
- Gruber, M.; Mahdi, A.; Joseph, P.F. Airfoil trailing edge noise reduction by the introduction of sawtooth and slitted trailing edge geometries. In Proceedings of the 20th International Congress on Acoustics 2010, ICA 2010-Incorporating the 2010 Annual Conference of the Australian Acoustical Society, Sydney, Australia, 23–27 August 2010. [Google Scholar]
- Hanke, W.; Witte, M.; Miersch, L.; Brede, M.; Oeffner, J.; Michael, M.; Hanke, F.; Leder, A.; Dehnhardt, G. Harbor seal vibrissa morphology suppresses vortex-induced vibrations. J. Exp. Biol. 2010, 213, 2665–2672. [Google Scholar] [CrossRef] [PubMed]
- Rinehart, A.; Shyam, V.; Zhang, W. Characterization of seal whisker morphology: Implications for whisker-inspired flow control applications. Bioinspir. Biomim. 2017, 12, 066005. [Google Scholar] [CrossRef] [PubMed]
- Shyam, V.; Ameri, A.; Poinsatte, P.; Thurman, D.R.; Wroblewski, A.C.; Snyder, C. Application of pinniped vibrissae to aeropropulsion. In Proceedings of the Turbo Expo: Power for Land, Sea, and Air, Montreal, QC, Canada, 15–19 June 2015; American Society of Mechanical Engineers: New York, NY, USA, 2015; Volume 56635, p. V02AT38A023. [Google Scholar]
- Moin, P.; Kim, J. Tackling turbulence with supercomputers. Sci. Am. 1997, 276, 62–68. [Google Scholar] [CrossRef]
- Hu, B.Y.; Bai, X.Q.; Fu, Y.F.; Yuan, C. Drag Reduction Performance Analysis of Chlamys nobilis Ribbed Surface. Mar. Technol. Soc. J. 2019, 53, 43–52. [Google Scholar] [CrossRef]
- Gregory, D.B.; Bhushan, B. Biofouling: Lessons from nature. Philos. Trans. R. Soc. A 2010, 370, 2381–2417. [Google Scholar]
- Bechert, D.W.; Hoppe, G.; Reif, W.E. On the drag reduction of the shark skin. In Proceedings of the AIAA Shear Flow Control Conference, Boulder, CO, USA, 12–14 March 1985; AIAA-85-0546. pp. 1–18. [Google Scholar]
- Bechert, D.W.; Bartenwerfer, M.; Hoppe, G.; Reif, W.-E. Drag reduction mechanisms derived from shark skin. In Proceedings of the 15th ICAS Congress, London, UK, 7–12 September 1986; pp. 1044–1068. [Google Scholar]
- Menter, F.R.; Langtry, R.B.; Likki, S.R.; Suzen, Y.B.; Huang, P.G.; Volker, S. A Correlation-Based Transition Model Using Local Variables Part I-Model Formulation. In Proceedings of the ASME Turbo Expo 2004: Power for Land, Sea, and Air, Vienna, Austria, 14–17 June 2004. ASME Paper 2004-GT-53452. [Google Scholar]
- Langtry, R.B.; Menter, F.R.; Likki, S.R.; Suzen, Y.B.; Huang, P.G.; Volker, S. A Correlation-Based Transition Model Using Local Variables Part II-Test Cases and Industry Applications. In Proceedings of the ASME Turbo Expo 2004: Power for Land, Sea, and Air, Vienna, Austria, 14–17 June 2004. ASME Paper 2004-GT-53454. [Google Scholar]
- Benner, M.W. The Influence of Leading-Edge Geometry on Profile and Secondary Losses in Turbine Cascades. Ph.D. Thesis, Carleton University, Ottawa, ON, Canada, 2003. [Google Scholar]
- Vogt, H.F.; Zippel, M. Sekundärströmungen in Turbinengittern mit geraden und gekrümmten Schaufeln; Visualisierung im ebenen Wasserkanal. Forsch. Ingenieurwesen 1996, 62, 247–253. [Google Scholar] [CrossRef]
- Coull, J.D. Endwall Loss in Turbine Cascades. J. Turbomach. 2017, 139, 081004. [Google Scholar] [CrossRef]
Figure 1.
Bionics schematic diagram: (a) Leading edge tubercles; (b) Tailing edge serrations; (c) Configuration of seals’ whiskers [18].
Figure 1.
Bionics schematic diagram: (a) Leading edge tubercles; (b) Tailing edge serrations; (c) Configuration of seals’ whiskers [18].

Figure 2.
Test section and measuring scheme of wind tunnel and the photograph of seven-hole probe measurement.
Figure 2.
Test section and measuring scheme of wind tunnel and the photograph of seven-hole probe measurement.

Figure 3.
Biomimetic cascade and surface static testing scheme: (a) Blade profile parameters and static pressure hole distribution schematic; (b) Biomimetic blade construction method; (c) Three-view and orthographic drawing.
Figure 3.
Biomimetic cascade and surface static testing scheme: (a) Blade profile parameters and static pressure hole distribution schematic; (b) Biomimetic blade construction method; (c) Three-view and orthographic drawing.

Figure 4.
Calculation domain and grid.

Figure 5.
Verification of grid dependency.

Figure 6.
Comparison of the measured and predicted static pressure coefficient distribution on the suction surface of the LPT cascade ITE-LPT A.
Figure 6.
Comparison of the measured and predicted static pressure coefficient distribution on the suction surface of the LPT cascade ITE-LPT A.

Figure 7.
Total pressure loss coefficient at 40% Cx sections downstream of both cascades versus incidence angle.
Figure 7.
Total pressure loss coefficient at 40% Cx sections downstream of both cascades versus incidence angle.

Figure 8.
Static pressure coefficient distribution on the mid-span of suction surface for both cascades in the cases with different incidence angles.
Figure 8.
Static pressure coefficient distribution on the mid-span of suction surface for both cascades in the cases with different incidence angles.

Figure 9.
Spanwise mass averaged total pressure loss coefficient at mid-span: (a) Original cascade; (b) Biomimetic cascade.
Figure 9.
Spanwise mass averaged total pressure loss coefficient at mid-span: (a) Original cascade; (b) Biomimetic cascade.

Figure 10.
Streamwise vorticity coefficient (Cωs) contours at 40% Cx sections downstream of both cascades at the incidence angle of 0° to 15°.
Figure 10.
Streamwise vorticity coefficient (Cωs) contours at 40% Cx sections downstream of both cascades at the incidence angle of 0° to 15°.

Figure 11.
Total pressure loss coefficient contours at 40% Cx sections downstream of both cascades at the incidence angle of 0° to 15°.
Figure 11.
Total pressure loss coefficient contours at 40% Cx sections downstream of both cascades at the incidence angle of 0° to 15°.

Figure 12.
Comparison of pitchwise mass averaged total pressure loss coefficient at 40% Cx sections downstream of both cascades between the incidence angle of 0° and 15°.
Figure 12.
Comparison of pitchwise mass averaged total pressure loss coefficient at 40% Cx sections downstream of both cascades between the incidence angle of 0° and 15°.

Figure 13.
Spanwise vorticity coefficient contours for the various sections perpendicular to the suction surface of biomimetic cascades at the incidence angle of 0° and 15°.
Figure 13.
Spanwise vorticity coefficient contours for the various sections perpendicular to the suction surface of biomimetic cascades at the incidence angle of 0° and 15°.

Figure 14.
Limiting streamlines and contours in the middle section of the biomimetic cascade and original cascade at the incidence angle of 0° and 15°.
Figure 14.
Limiting streamlines and contours in the middle section of the biomimetic cascade and original cascade at the incidence angle of 0° and 15°.

Figure 15.
Limiting streamlines on suction surface near the endwall of the original and biomimetic cascade at the incidence angle of 0° and 15°: (a) Original cascade in the 0° incidence angle condition; (b) Original cascade in the 15° incidence angle condition; (c) Biomimetic cascade in the 0° incidence angle condition; (d) Biomimetic cascade in the 15° incidence angle condition;.


Figure 16.
Streamwise vorticity coefficient contours for the original and biomimetic cascade: (a) Original cascade in the 0° incidence angle condition; (b) Original cascade in the 15° incidence angle condition; (c) Biomimetic cascade in the 0° incidence angle condition; (d) Biomimetic cascade in the 15° incidence angle condition;.


Table 1.
Main parameters of the tested cascades.
| Parameter | IET-LPT A |
|---|---|
| Chord, C (mm) | 84.5 |
| Axial Chord, Cx (mm) | 76.2 |
| Pitch (mm) | 84.2 |
| Span, H (mm) | 207 |
| Leading Edge Radius, r (mm) | 3.7 |
| Inlet Flow Angle (°) | 30 |
| Outlet Flow Angle (°) | 60 |
| Stagger Angle (°) | 26 |
Disclaimer/Publisher’s Note: The statements, opinions and data contained in all publications are solely those of the individual author(s) and contributor(s) and not of MDPI and/or the editor(s). MDPI and/or the editor(s) disclaim responsibility for any injury to people or property resulting from any ideas, methods, instructions or products referred to in the content. |
© 2024 by the authors. Licensee MDPI, Basel, Switzerland. This article is an open access article distributed under the terms and conditions of the Creative Commons Attribution (CC BY) license (https://creativecommons.org/licenses/by/4.0/).
Share and Cite
MDPI and ACS Style
Deng, H.; Lei, Z.; Ouyang, X.; He, Y.; Yuan, H.; Li, G.; Zhang, Y.; Lu, X.; Xu, G. Research on the Flow Mechanism of a High-Loading Biomimetic Low-Pressure Turbine Cascade. Aerospace 2024, 11, 328. https://doi.org/10.3390/aerospace11040328
AMA Style
Deng H, Lei Z, Ouyang X, He Y, Yuan H, Li G, Zhang Y, Lu X, Xu G. Research on the Flow Mechanism of a High-Loading Biomimetic Low-Pressure Turbine Cascade. Aerospace. 2024; 11(4):328. https://doi.org/10.3390/aerospace11040328
Chicago/Turabian StyleDeng, Hanliu, Zhijun Lei, Xiaoqing Ouyang, Yuxiang He, Hang Yuan, Gang Li, Yanfeng Zhang, Xingen Lu, and Gang Xu. 2024. "Research on the Flow Mechanism of a High-Loading Biomimetic Low-Pressure Turbine Cascade" Aerospace 11, no. 4: 328. https://doi.org/10.3390/aerospace11040328
Note that from the first issue of 2016, this journal uses article numbers instead of page numbers. See further details here.